
Effect of Breastfeeding and Its Duration on Impaired Fasting Glucose and Diabetes in Perimenopausal and Postmenopausal Women: Korea National Health and Nutrition Examination Survey (KNHANES) 2010–2019


Abstract
1. Introduction
2. Materials and Methods
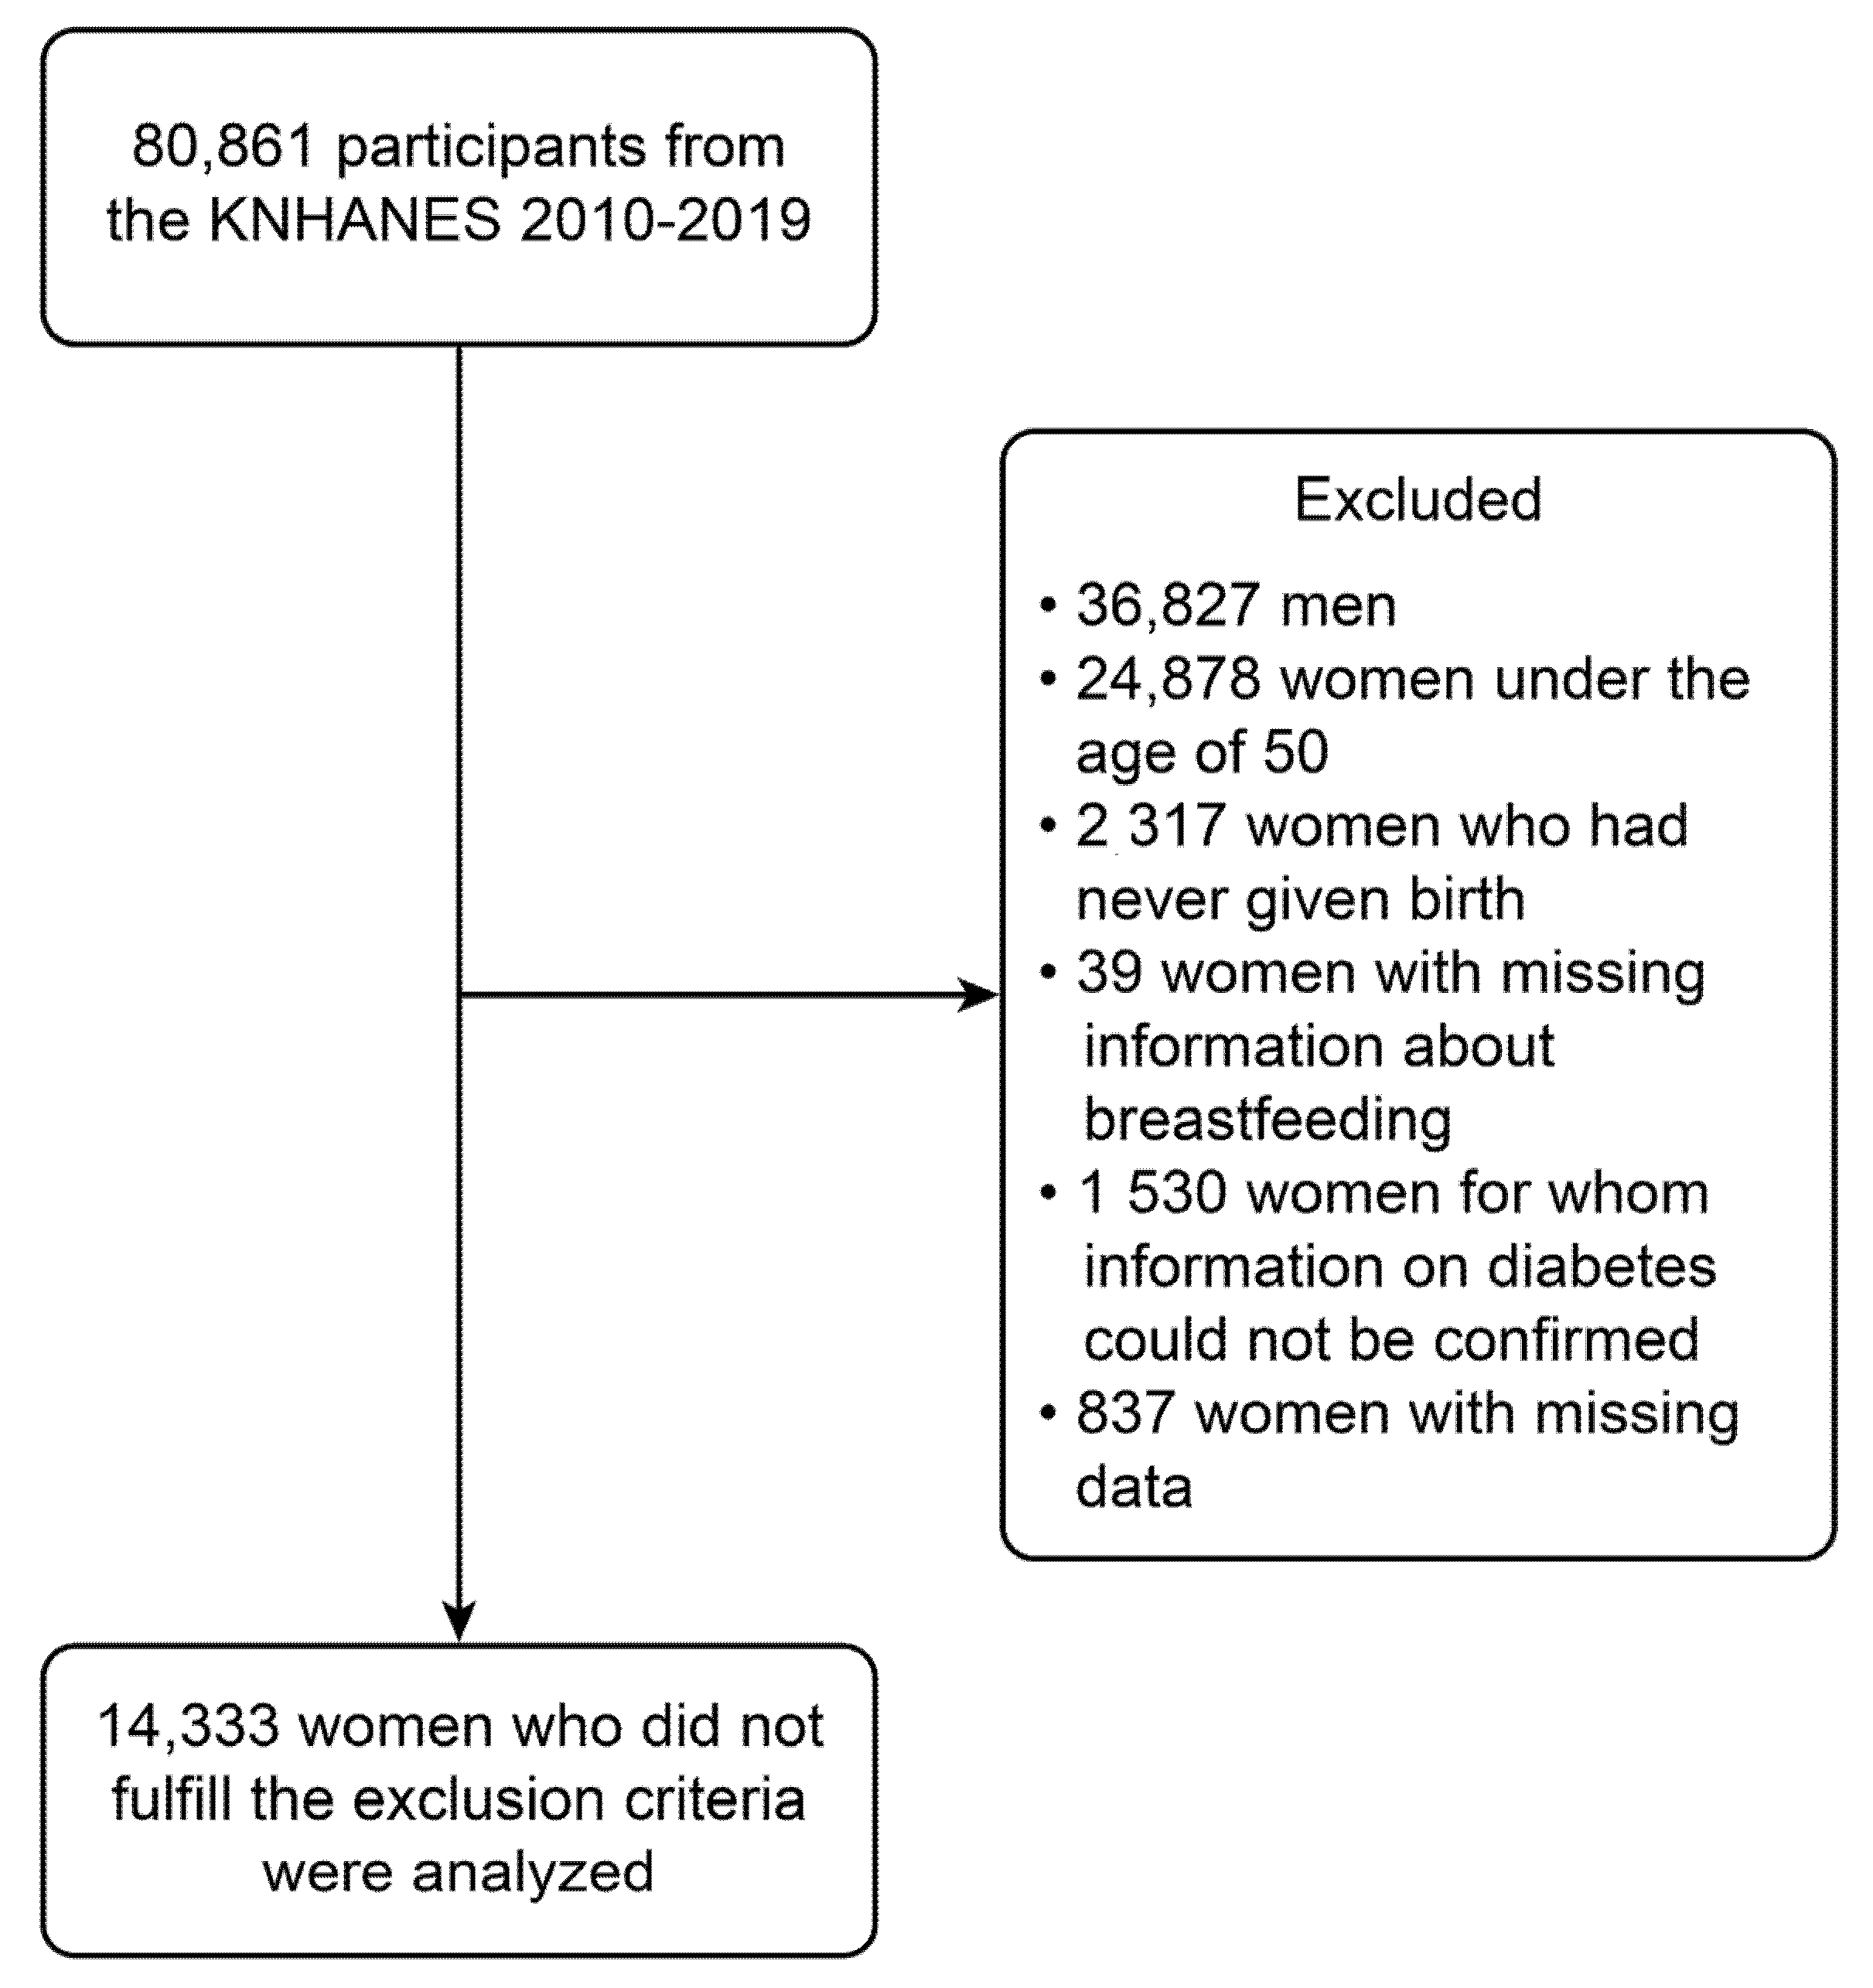
2.1. Study Participants and Design
2.2. Study Variables
2.3. Statistical Analysis
2.4. Ethics
3. Results
4. Discussion
5. Conclusions
Author Contributions
Funding
Institutional Review Board Statement
Informed Consent Statement
Data Availability Statement
Conflicts of Interest
References
- Danaei, G.; Finucane, M.M.; Lu, Y.; Singh, G.M.; Cowan, M.J.; Paciorek, C.J.; Lin, J.K.; Farzadfar, F.; Khang, Y.-H.; Stevens, G.A. National, regional, and global trends in fasting plasma glucose and diabetes prevalence since 1980: Systematic analysis of health examination surveys and epidemiological studies with 370 country-years and 2· 7 million participants. Lancet 2011, 378, 31–40; [Google Scholar] [CrossRef]
- Khan, M.B.; Hashim, M.J.; King, J.K.; Govender, R.D.; Mustafa, H.; Al Kaabi, J. Epidemiology of type 2 diabetes–global burden of disease and forecasted trends. J. Epidemiol. Glob. Health 2020, 10, 107. [Google Scholar] [CrossRef] [PubMed]
- Whiting, D.R.; Guariguata, L.; Weil, C.; Shaw, J. IDF diabetes atlas: Global estimates of the prevalence of diabetes for 2011 and 2030. Diabetes Res. Clin. Pract. 2011, 94, 311–321. [Google Scholar] [CrossRef] [PubMed]
- Kramer, M.S.; Kakuma, R. Optimal duration of exclusive breastfeeding. Cochrane Database Syst. Rev. 2012, 12, CD003517. [Google Scholar] [CrossRef] [PubMed]
- Victora, C.G.; Bahl, R.; Barros, A.J.; França, G.V.; Horton, S.; Krasevec, J.; Murch, S.; Sankar, M.J.; Walker, N.; Rollins, N.C. Breastfeeding in the 21st century: Epidemiology, mechanisms, and lifelong effect. Lancet 2016, 387, 475–490. [Google Scholar] [CrossRef]
- Aune, D.; Norat, T.; Romundstad, P.; Vatten, L. Breastfeeding and the maternal risk of type 2 diabetes: A systematic review and dose–response meta-analysis of cohort studies. Nutr. Metab. Cardiovasc. Dis. 2014, 24, 107–115. [Google Scholar] [CrossRef] [PubMed]
- Schwarz, E.B.; Brown, J.S.; Creasman, J.M.; Stuebe, A.; Mcclure, C.K.; Van Den Eeden, S.K.; Thom, D. Lactation and maternal risk of type 2 diabetes: A population-based study. Am. J. Med. 2010, 123, 863.e1–863.e6. [Google Scholar] [CrossRef]
- Choi, S.R.; Kim, Y.M.; Cho, M.S.; Kim, S.H.; Shim, Y.S. Association between duration of breast feeding and metabolic syndrome: The Korean National Health and Nutrition Examination Surveys. J. Women’s Health 2017, 26, 361–367. [Google Scholar] [CrossRef] [PubMed]
- Chowdhury, R.; Sinha, B.; Sankar, M.J.; Taneja, S.; Bhandari, N.; Rollins, N.; Bahl, R.; Martines, J. Breastfeeding and maternal health outcomes: A systematic review and meta-analysis. Acta Paediatr. 2015, 104, 96–113. [Google Scholar] [CrossRef] [PubMed]
- Villegas, R.; Gao, Y.-T.; Yang, G.; Li, H.; Elasy, T.; Zheng, W.; Shu, X.-O. Duration of breast-feeding and the incidence of type 2 diabetes mellitus in the Shanghai Women’s Health Study. Diabetologia 2008, 51, 258–266. [Google Scholar] [CrossRef] [PubMed]
- Zhang, B.-Z.; Zhang, H.-Y.; Liu, H.-H.; Li, H.-J.; Wang, J.-S. Breastfeeding and maternal hypertension and diabetes: A population-based cross-sectional study. Breastfeed. Med. 2015, 10, 163–167. [Google Scholar] [CrossRef] [PubMed]
- Szmuilowicz, E.D.; Stuenkel, C.A.; Seely, E.W. Influence of menopause on diabetes and diabetes risk. Nat. Rev. Endocrinol. 2009, 5, 553–558. [Google Scholar] [CrossRef] [PubMed]
- Luo, J.; Hendryx, M.; Leblanc, E.S.; Shadyab, A.H.; Qi, L.; Sealy-Jefferson, S.; Manson, J.E. Associations between parity, breastfeeding, and risk of maternal type 2 diabetes among postmenopausal women. Obstet. Gynecol. 2019, 134, 591–599. [Google Scholar] [CrossRef] [PubMed]
- Jung, C.-H.; Son, J.W.; Kang, S.; Kim, W.J.; Kim, H.-S.; Kim, H.S.; Seo, M.; Shin, H.-J.; Lee, S.-S.; Jeong, S.J. Diabetes fact sheets in Korea, 2020: An appraisal of current status. Diabetes Metab. J. 2021, 45, 1–10. [Google Scholar] [CrossRef] [PubMed]
- Liu, X.; Yu, C.; Wang, Y.; Bi, Y.; Liu, Y.; Zhang, Z.-J. Trends in the incidence and mortality of diabetes in China from 1990 to 2017: A joinpoint and age-period-cohort analysis. Int. J. Environ. Res. Public Health 2019, 16, 158. [Google Scholar] [CrossRef] [PubMed]
- Stuebe, A.M.; Rich-Edwards, J.W.; Willett, W.C.; Manson, J.E.; Michels, K.B. Duration of lactation and incidence of type 2 diabetes. Jama 2005, 294, 2601–2610. [Google Scholar] [CrossRef] [PubMed]
- Stuebe, A.M.; Mantzoros, C.; Kleinman, K.; Gillman, M.W.; Rifas-Shiman, S.; Seely, E.; Rich-Edwards, J. Gestational glucose tolerance and maternal metabolic profile at 3 years postpartum. Obstet. Gynecol. 2011, 118, 1065. [Google Scholar] [CrossRef]
- Antonakou, A.; Papoutsis, D.; Panou, I.; Chiou, A.; Matalas, A.L. Role of exclusive breastfeeding in energy balance and weight loss during the first six months postpartum. Clin. Exp. Obstet. Gynecol. 2013, 40, 485–488. [Google Scholar] [PubMed]
- Burnol, A.; Leturque, A.; Ferre, P.; Kande, J.; Girard, J. Increased insulin sensitivity and responsiveness during lactation in rats. Am. J. Physiol.-Endocrinol. Metab. 1986, 251, E537–E541. [Google Scholar] [CrossRef]
- Gunderson, E.P.; Hedderson, M.M.; Chiang, V.; Crites, Y.; Walton, D.; Azevedo, R.A.; Fox, G.; Elmasian, C.; Young, S.; Salvador, N.; et al. Lactation intensity and postpartum maternal glucose tolerance and insulin resistance in women with recent GDM: The SWIFT cohort. Diabetes Care 2012, 35, 50–56. [Google Scholar] [CrossRef]
- Mcmanus, R.M.; Cunningham, I.; Watson, A.; Harker, L.; Finegood, D.T. Beta-cell function and visceral fat in lactating women with a history of gestational diabetes. Metabolism 2001, 50, 715–719. [Google Scholar] [CrossRef] [PubMed]
- Kjos, S.L.; Henry, O.; Lee, R.M.; Buchanan, T.A.; Mishell Jr, D.R. The effect of lactation on glucose and lipid metabolism in women with recent gestational diabetes. Obstet. Gynecol. 1993, 82, 451–455. [Google Scholar] [PubMed]
- Stuebe, A.M.; Mantzoros, C.; Kleinman, K.; Gillman, M.W.; Rifas-Shiman, S.; Gunderson, E.P.; Rich-Edwards, J. Duration of lactation and maternal adipokines at 3 years postpartum. Diabetes 2011, 60, 1277–1285. [Google Scholar] [CrossRef] [PubMed]
- World Health Organization. Guideline: Protecting, Promoting and Supporting Breastfeeding in Facilities Providing Maternity and Newborn Services; World Health Organization: Geneva, Switzerland, 2017. [Google Scholar]
- Chung, S.-H.; Kim, H.-R.; Choi, Y.-S.; Bae, C.-W. Trends of breastfeeding rate in Korea (1994-2012): Comparison with OECD and other countries. J. Korean Med. Sci. 2013, 28, 1573–1580. [Google Scholar] [CrossRef] [PubMed]
- Feldman, A.L.; Long, G.H.; Johansson, I.; Weinehall, L.; Fhärm, E.; Wennberg, P.; Norberg, M.; Griffin, S.J.; Rolandsson, O. Change in lifestyle behaviors and diabetes risk: Evidence from a population-based cohort study with 10 year follow-up. Int. J. Behav. Nutr. Phys. Act. 2017, 14, 39. [Google Scholar] [CrossRef] [PubMed]
- Hu, F.B.; Manson, J.E.; Stampfer, M.J.; Colditz, G.; Liu, S.; Solomon, C.G.; Willett, W.C. Diet, lifestyle, and the risk of type 2 diabetes mellitus in women. N. Engl. J. Med. 2001, 345, 790–797. [Google Scholar] [CrossRef] [PubMed]
- Wada, M.; Yano, S.; Hamano, T.; Nabika, T.; Kumakura, S. Effect of serum cholesterol on insulin secretory capacity: Shimane CoHRE Study. PLoS ONE 2016, 11, e0149452. [Google Scholar] [CrossRef]
- Lee, J.; Lee, J.S.; Park, S.-H.; Shin, S.A.; Kim, K. Cohort profile: The national health insurance service–national sample cohort (NHIS-NSC), South Korea. Int. J. Epidemiol. 2017, 46, e15. [Google Scholar] [CrossRef]
- Stumvoll, M.; Mitrakou, A.; Pimenta, W.; Jenssen, T.; Yki-Järvinen, H.; Van Haeften, T.; Renn, W.; Gerich, J. Use of the oral glucose tolerance test to assess insulin release and insulin sensitivity. Diabetes care 2000, 23, 295–301. [Google Scholar] [CrossRef]


| Total (N = 14,433) | Normal (N = 8462) | Impaired Fasting Glucose (N = 3670) | Diabetes (N = 2301) | p-Value | |
|---|---|---|---|---|---|
| Age (years), mean (SD) | 63.4 ± 8.8 | 62.2 ± 8.7 | 63.7 ± 8.7 | 67.1 ± 8.3 | <0.001 |
| Income, N (%) | <0.001 | ||||
| Q4 | 3235 | 2135 (66%) | 786 (24.3%) | 314 (9.7%) | |
| Q3 | 3103 | 1903 (61.3%) | 782 (25.2%) | 418 (13.5%) | |
| Q2 | 3762 | 2135 (56.8%) | 1003 (26.7%) | 624 (16.6%) | |
| Q1 | 4333 | 2289 (52.8%) | 1099 (25.4%) | 945 (21.8%) | |
| Education, N (%) | <0.001 | ||||
| College or higher | 1500 | 1043 (69.5%) | 348 (23.2%) | 109 (7.3%) | |
| High school | 3445 | 2199 (63.8%) | 880 (25.5%) | 366 (10.6%) | |
| Middle school | 2413 | 1434 (59.4%) | 624 (25.9%) | 355 (14.7%) | |
| Less than elementary school | 7075 | 3786 (53.5%) | 1818 (25.7%) | 1471 (20.8%) | |
| Alcohol consumption, N (%) | <0.001 | ||||
| No alcohol consumption | 4021 | 2245 (55.8%) | 960 (23.9%) | 816 (20.3%) | |
| Alcohol consumption | 10,412 | 6217 (59.7%) | 2710 (26%) | 1485 (14.3%) | |
| Smoking, N (%) | 0.053 | ||||
| Nonsmoking | 13,533 | 7956 (58.8%) | 3459 (25.6%) | 2118 (15.7%) | |
| Current smoking | 900 | 506 (56.2%) | 211 (23.4%) | 183 (20.3%) | |
| Waist circumference | 82.2 ± 9.1 | 80.3 ± 8.5 | 84.0 ± 9.0 | 86.6 ± 9.3 | <0.001 |
| BMI | 24.3 ± 3.3 | 23.7 ± 3.0 | 24.9 ± 3.3 | 25.4 ± 3.6 | <0.001 |
| BMI (categorical) | <0.001 | ||||
| BMI < 18.5 | 291 | 217 (74.6%) | 50 (17.2%) | 24 (8.2%) | |
| 18.5 ≤ BMI < 25.0 | 8816 | 5761 (65.3%) | 1943 (22%) | 1112 (12.6%) | |
| 25.0 ≤ BMI < 30.0 | 4593 | 2238 (48.7%) | 1424 (31%) | 931 (20.3%) | |
| 30.0 ≤ BMI | 733 | 246 (33.6%) | 253 (34.5%) | 234 (31.9%) | |
| Hypertension | <0.001 | ||||
| Normal | 4118 | 3021 (73.4%) | 810 (19.7%) | 287 (7%) | |
| Prehypertension | 3362 | 2146 (63.8%) | 835 (24.8%) | 381 (11.3%) | |
| Hypertension | 6953 | 3295 (47.4%) | 2025 (29.1%) | 1633 (23.5%) | |
| Total cholesterol | 199.3 ± 38.4 | 202.0 ± 36.1 | 203.5 ± 39.0 | 182.5 ± 41.1 | <0.001 |
| Total cholesterol (categorical) | <0.001 | ||||
| <200 | 5113 | 3149 (61.6%) | 1127 (22%) | 837 (16.4%) | |
| 200≤, <240 | 4461 | 2895 (64.9%) | 1183 (26.5%) | 383 (8.6%) | |
| >240 | 4859 | 2418 (49.8%) | 1360 (28%) | 1081 (22.2%) | |
| Menstruation | <0.001 | ||||
| Menstruation | 975 | 702 (72%) | 222 (22.8%) | 51 (5.2%) | |
| Menopause | 13,458 | 7760 (57.7%) | 3448 (25.6%) | 2250 (16.7%) | |
| Number of pregnancies | 4.5 ± 2.2 | 4.4 ± 2.1 | 4.5 ± 2.1 | 5.1 ± 2.4 | <0.001 |
| Breast feeding, N (%) | 0.002 | ||||
| No | 1406 | 881 (62.7%) | 361 (25.7%) | 164 (11.7%) | |
| Yes | 13,027 | 7581 (58.2%) | 3309 (25.4%) | 2137 (16.4%) | |
| Breastfeeding duration (months), mean (SD) | 40.3 ± 39.9 | 37.5 ± 39.1 | 39.8 ± 38.3 | 51.4 ± 43.6 | <0.001 |
| Breastfeeding duration (months) categorical, N (%) | <0.001 | ||||
| Less 1 month | 1409 | 883 (62.7%) | 361 (25.6%) | 165 (11.7%) | |
| Less than 12 months | 1120 | 748 (66.8%) | 263 (23.5%) | 109 (9.7%) | |
| 13–24 months | 1297 | 839 (64.7%) | 319 (24.6%) | 139 (10.7%) | |
| 25–36 months | 3257 | 2046 (62.8%) | 826 (25.4%) | 385 (11.8%) | |
| 37–48 months | 2240 | 1270 (56.7%) | 598 (26.7%) | 372 (16.6%) | |
| More than 49 months | 5110 | 2676 (52.4%) | 1303 (25.5%) | 1131 (22.1%) | |
| Number of children breastfed, mean (SD) | 2.5 ± 1.6 | 2.4 ± 1.5 | 2.6 ± 1.6 | 2.9 ± 1.7 | <0.001 |
| Number of children breastfed, N (%) | <0.001 | ||||
| 0 | 1406 | 881 (62.7%) | 361 (25.7%) | 164 (11.7%) | |
| 1 or 2 | 6609 | 4142 (62.7%) | 1636 (24.8%) | 831 (12.6%) | |
| 3 or 4 | 4826 | 2597 (53.8%) | 1286 (26.6%) | 943 (19.5%) | |
| More than 5 | 1592 | 842 (52.9%) | 387 (24.3%) | 363 (22.8%) | |
| Oral contraceptive use | <0.001 | ||||
| No | 11,229 | 6696 (59.6%) | 2846 (25.3%) | 1687 (15%) | |
| Yes | 3204 | 1766 (55.1%) | 824 (25.7%) | 614 (19.2%) | |
| Age at last birth | 29.6 ± 4.4 | 29.5 ± 4.3 | 29.6 ± 4.4 | 29.8 ± 4.7 | 0.007 |
| Exercise, N (%) | <0.001 | ||||
| Muscle and aerobic exercise | 1036 | 687 (66.3%) | 247 (23.8%) | 102 (9.8%) | |
| Only aerobic exercise | 4607 | 2768 (60.1%) | 1145 (24.9%) | 694 (15.1%) | |
| Only muscle exercise | 818 | 513 (62.7%) | 209 (25.6%) | 96 (11.7%) | |
| No exercise | 7972 | 4494 (56.4%) | 2069 (26%) | 1409 (17.7%) |
| Risk for Impaired Fasting Glucose Compared to Normal | Risk for Diabetes Compared to Normal | |||||
|---|---|---|---|---|---|---|
| OR | 95% CI | p-Value | OR | 95% CI | p-Value | |
| Age | 1.02 | (1.02, 1.03) | <0.001 | 1.07 | (1.06, 1.07) | <0.001 |
| Income | ||||||
| Q4 | 1.00 | Reference | 1.00 | Reference | ||
| Q3 | 1.07 | (0.94, 1.23) | 0.312 | 1.49 | (1.23, 1.8) | <0.001 |
| Q2 | 1.22 | (1.07, 1.39) | 0.003 | 1.96 | (1.65, 2.33) | <0.001 |
| Q1 | 1.29 | (1.14, 1.47) | <0.001 | 2.99 | (2.54, 3.52) | <0.001 |
| Education | ||||||
| College or higher | 1.00 | Reference | 1.00 | Reference | ||
| High school | 1.14 | (0.96, 1.34) | 0.138 | 1.49 | (1.16, 1.9) | 0.002 |
| Middle school | 1.24 | (1.04, 1.48) | 0.019 | 2.17 | (1.67, 2.81) | <0.001 |
| Elementary school or lower | 1.45 | (1.24, 1.68) | <0.001 | 3.69 | (2.95, 4.62) | <0.001 |
| Alcohol consumption | ||||||
| No alcohol consumption | 1.00 | Reference | 1.00 | Reference | ||
| Alcohol consumption | 1.01 | (0.91, 1.13) | 0.819 | 0.62 | (0.55, 0.69) | <0.001 |
| Smoking | ||||||
| Nonsmoking | 1.00 | Reference | 1.00 | Reference | ||
| Smoking | 0.90 | (0.74, 1.1) | 0.312 | 1.22 | (0.99, 1.51) | 0.063 |
| Waist circumference | 1.06 | (1.05, 1.06) | <0.001 | 1.09 | (1.08, 1.09) | <0.001 |
| BMI | 1.15 | (1.13, 1.17) | <0.001 | 1.18 | (1.16, 1.2) | <0.001 |
| BMI (categorical) | ||||||
| BMI < 18.5 | 1.00 | Reference | 1.00 | Reference | ||
| 18.5 ≤ BMI < 25.0 | 1.44 | (1.01, 2.07) | 0.044 | 1.76 | (1.06, 2.92) | 0.028 |
| 25.0 ≤ BMI < 30.0 | 2.84 | (1.97, 4.11) | <0.001 | 3.97 | (2.4, 6.56) | <0.001 |
| 30.0 ≤ BMI | 5.11 | (3.43, 7.63) | <0.001 | 9.54 | (5.58, 16.3) | <0.001 |
| Hypertension | ||||||
| Normal | 1.00 | Reference | 1.00 | Reference | ||
| Prehypertension | 1.46 | (1.28, 1.67) | <0.001 | 1.87 | (1.53, 2.28) | <0.001 |
| Hypertension | 2.36 | (2.11, 2.64) | <0.001 | 5.15 | (4.4, 6.03) | <0.001 |
| Total cholesterol | 1.00 | (1, 1) | 0.027 | 0.99 | (0.98, 0.99) | <0.001 |
| Total cholesterol (categorical) | ||||||
| <200 | 1.00 | Reference | 1 | Reference | ||
| 200≤, <240 | 1.12 | (1, 1.25) | 0.057 | 0.50 | (0.43, 0.59) | <0.001 |
| 240≤ | 1.63 | (1.46, 1.83) | <0.001 | 1.71 | (1.52, 1.94) | <0.001 |
| Menstruation | ||||||
| Menstruation | 1.00 | Reference | 1.00 | Reference | ||
| Menopause | 1.37 | (1.14, 1.64) | <0.001 | 3.36 | (2.42, 4.66) | <0.001 |
| Number of pregnancies | 1.03 | (1.01, 1.05) | 0.006 | 1.14 | (1.11, 1.17) | <0.001 |
| Breastfeeding, N (%) | ||||||
| No | 1.00 | Reference | 1.00 | Reference | ||
| Yes | 1.10 | (0.95, 1.28) | 0.191 | 1.41 | (1.16, 1.7) | <0.001 |
| Breastfeeding duration (months) | 1.00 | (1, 1) | <0.001 | 1.01 | (1.01, 1.01) | <0.001 |
| Breastfeeding duration (months) categorical | ||||||
| Less than 1 month | 1.00 | Reference | 1.00 | Reference | ||
| Less than 12 months | 0.87 | (0.71, 1.07) | 0.176 | 0.79 | (0.59, 1.06) | 0.120 |
| 13–24 months | 0.93 | (0.76, 1.14) | 0.485 | 0.77 | (0.59, 1.01) | 0.064 |
| 25–36 months | 1.04 | (0.88, 1.23) | 0.662 | 0.91 | (0.73, 1.14) | 0.417 |
| 37–48 months | 1.13 | (0.94, 1.35) | 0.185 | 1.47 | (1.18, 1.83) | <0.001 |
| More than 49 months | 1.30 | (1.11, 1.52) | 0.001 | 2.27 | (1.87, 2.77) | <0.001 |
| Number of children breastfed | 1.07 | (1.04, 1.1) | <0.001 | 1.23 | (1.19, 1.27) | <0.001 |
| Number of children breastfed | ||||||
| 0 | 1.00 | Reference | 1.00 | Reference | ||
| 1 or 2 | 0.98 | (0.85, 1.14) | 0.835 | 0.99 | (0.81, 1.21) | 0.900 |
| 3 or 4 | 1.28 | (1.09, 1.51) | 0.003 | 1.91 | (1.56, 2.33) | <0.001 |
| More than 5 | 1.24 | (1.02, 1.51) | 0.031 | 2.36 | (1.88, 2.97) | <0.001 |
| Oral contraceptive use | ||||||
| No | 1.00 | Reference | 1.00 | Reference | ||
| Yes | 1.08 | (0.96, 1.2) | 0.187 | 1.33 | (1.17, 1.51) | <0.001 |
| Age at last birth | 1.01 | (1, 1.02) | 0.112 | 1.02 | (1.01, 1.03) | 0.003 |
| Exercise | ||||||
| Muscle and aerobic exercise | 1.00 | Reference | 1.00 | Reference | ||
| Only aerobic exercise | 1.16 | (0.97, 1.39) | 0.114 | 1.73 | (1.33, 2.26) | <0.001 |
| Only muscle exercise | 1.10 | (0.86, 1.42) | 0.443 | 1.21 | (0.85, 1.73) | 0.293 |
| No exercise | 1.29 | (1.07, 1.55) | 0.008 | 2.20 | (1.71, 2.83) | <0.001 |
| Risk for Impaired Fasting Glucose Compared to Normal | Risk for Diabetes Compared to Normal | |||||
|---|---|---|---|---|---|---|
| OR | 95% CI | p-Value | OR | 95% CI | p-Value | |
| Breastfeeding | ||||||
| No | 1.00 | Reference | 1.00 | Reference | ||
| Yes | 0.88 | (0.76, 1.04) | 0.154 | 0.76 | (0.61, 0.95) | 0.016 |
| Age | 1.02 | (1.01, 1.02) | <0.001 | 1.03 | (1.02, 1.04) | <0.001 |
| Income | ||||||
| Q4 | 1.00 | Reference | 1.00 | Reference | ||
| Q3 | 0.95 | (0.82, 1.1) | 0.493 | 1.17 | (0.95, 1.43) | 0.131 |
| Q2 | 1.03 | (0.89, 1.18) | 0.709 | 1.26 | (1.04, 1.53) | 0.017 |
| Q1 | 0.94 | (0.8, 1.09) | 0.399 | 1.29 | (1.06, 1.56) | 0.011 |
| Education | ||||||
| College or higher | 1.00 | Reference | 1.00 | Reference | ||
| High school | 1.04 | (0.87, 1.24) | 0.635 | 1.22 | (0.95, 1.57) | 0.119 |
| Middle school | 0.99 | (0.82, 1.2) | 0.919 | 1.28 | (0.97, 1.69) | 0.075 |
| Less than elementary school | 0.94 | (0.78, 1.13) | 0.494 | 1.25 | (0.97, 1.61) | 0.084 |
| Alcohol consumption | ||||||
| No alcohol consumption | 1.00 | Reference | 1.00 | Reference | ||
| Alcohol consumption | 1.15 | (1.03, 1.29) | 0.014 | 0.80 | (0.7, 0.91) | <0.001 |
| Smoking | ||||||
| Nonsmoking | 1.00 | Reference | 1.00 | Reference | ||
| Smoking | 0.93 | (0.76, 1.14) | 0.510 | 1.28 | (1.02, 1.61) | 0.032 |
| BMI | 1.13 | (1.11, 1.15) | <0.001 | 1.14 | (1.12, 1.16) | <0.001 |
| Hypertension | ||||||
| Normal | 1.00 | Reference | 1.00 | Reference | ||
| Prehypertension | 1.31 | (1.15, 1.5) | <0.001 | 1.53 | (1.25, 1.87) | <0.001 |
| Hypertension | 1.86 | (1.65, 2.1) | <0.001 | 2.78 | (2.34, 3.3) | <0.001 |
| Total cholesterol | ||||||
| <200 | 1.00 | Reference | 1.00 | Reference | ||
| 200≤, <240 | 1.10 | (0.98, 1.23) | 0.116 | 0.55 | (0.46, 0.64) | <0.001 |
| 240≤ | 1.40 | (1.24, 1.57) | <0.001 | 1.47 | (1.28, 1.68) | <0.001 |
| Menstruation | ||||||
| Menstruation | 1.00 | Reference | 1.00 | Reference | ||
| Menopause | 1.13 | (0.93, 1.37) | 0.233 | 1.62 | (1.13, 2.31) | 0.008 |
| Number of pregnancies | 0.98 | (0.95, 1) | 0.099 | 1.03 | (1, 1.06) | 0.096 |
| Oral contraceptive use | ||||||
| No | 1.00 | Reference | 1.00 | Reference | ||
| Yes | 0.98 | (0.87, 1.1) | 0.714 | 1.05 | (0.91, 1.2) | 0.535 |
| Age at last birth | 1.01 | (0.99, 1.02) | 0.359 | 0.99 | (0.98, 1.01) | 0.233 |
| Exercise | ||||||
| Muscle and aerobic exercise | 1.00 | Reference | 1.00 | Reference | ||
| Only aerobic exercise | 1.08 | (0.9, 1.3) | 0.398 | 1.30 | (0.98, 1.72) | 0.066 |
| Only muscle exercise | 1.10 | (0.85, 1.42) | 0.455 | 0.95 | (0.65, 1.39) | 0.803 |
| No exercise | 1.12 | (0.93, 1.36) | 0.239 | 1.36 | (1.04, 1.78) | 0.024 |
| Risk for Impaired Fasting Glucose Compared to Normal | Risk for Diabetes Compared to Normal | |||||
|---|---|---|---|---|---|---|
| OR | 95% CI | p-Value | OR | 95% CI | p-Value | |
| Breastfeeding duration | ||||||
| Less than 1 month | 1.00 | Reference | 1.00 | Reference | ||
| less than 12 months | 0.87 | (0.71, 1.07) | 0.188 | 0.90 | (0.65, 1.23) | 0.502 |
| 13–24 months | 0.85 | (0.69, 1.05) | 0.143 | 0.68 | (0.5, 0.91) | 0.011 |
| 25–36 months | 0.90 | (0.76, 1.08) | 0.276 | 0.67 | (0.52, 0.87) | 0.002 |
| 37–48 months | 0.89 | (0.73, 1.08) | 0.228 | 0.79 | (0.61, 1.02) | 0.069 |
| More than 49 months | 0.90 | (0.74, 1.09) | 0.269 | 0.84 | (0.66, 1.08) | 0.172 |
| Age | 1.02 | (1.01, 1.02) | <0.001 | 1.03 | (1.02, 1.04) | <0.001 |
| Income | ||||||
| Q1 | 1.00 | Reference | 1.00 | Reference | ||
| Q2 | 0.95 | (0.82, 1.1) | 0.491 | 1.17 | (0.96, 1.43) | 0.130 |
| Q3 | 1.03 | (0.89, 1.18) | 0.711 | 1.26 | (1.04, 1.53) | 0.018 |
| Q4 | 0.94 | (0.8, 1.09) | 0.401 | 1.28 | (1.05, 1.55) | 0.013 |
| Education | ||||||
| College or higher | 1.00 | Reference | 1.00 | Reference | ||
| High school | 1.04 | (0.87, 1.24) | 0.664 | 1.25 | (0.97, 1.6) | 0.088 |
| Middle school | 0.98 | (0.81, 1.2) | 0.857 | 1.31 | (0.99, 1.73) | 0.058 |
| Less than elementary school | 0.93 | (0.77, 1.12) | 0.448 | 1.25 | (0.96, 1.62) | 0.094 |
| Alcohol consumption | ||||||
| No alcohol consumption | 1.00 | Reference | 1.00 | Reference | ||
| Alcohol consumption | 1.15 | (1.03, 1.29) | 0.014 | 0.80 | (0.71, 0.92) | 0.001 |
| Smoking | ||||||
| Nonsmoking | 1.00 | Reference | 1.00 | Reference | ||
| Smoking | 0.94 | (0.76, 1.15) | 0.518 | 1.29 | (1.02, 1.61) | 0.030 |
| BMI | 1.13 | (1.11, 1.15) | <0.001 | 1.14 | (1.12, 1.16) | <0.001 |
| Hypertension | ||||||
| Normal | 1.00 | Reference | 1.00 | Reference | ||
| Prehypertension | 1.31 | (1.15, 1.5) | <0.001 | 1.53 | (1.25, 1.87) | <0.001 |
| Hypertension | 1.86 | (1.65, 2.1) | <0.001 | 2.77 | (2.33, 3.29) | <0.001 |
| Total cholesterol | ||||||
| <200 | 1.00 | Reference | 1.00 | Reference | ||
| 200≤, <240 | 1.10 | (0.98, 1.23) | 0.114 | 0.55 | (0.46, 0.64) | <0.001 |
| 240≤ | 1.40 | (1.24, 1.58) | <0.001 | 1.47 | (1.29, 1.68) | <0.001 |
| Menstruation | ||||||
| Menstruation | 1.00 | Reference | 1.00 | Reference | ||
| Menopause | 1.12 | (0.92, 1.37) | 0.241 | 1.66 | (1.16, 2.38) | 0.006 |
| Number of pregnancies | 0.98 | (0.95, 1) | 0.099 | 1.02 | (0.99, 1.05) | 0.171 |
| Oral contraceptive use | ||||||
| No | 1.00 | Reference | 1.00 | Reference | ||
| Yes | 0.98 | (0.87, 1.1) | 0.719 | 1.05 | (0.91, 1.2) | 0.527 |
| Age at last birth | 1.01 | (0.99, 1.02) | 0.361 | 0.99 | (0.97, 1) | 0.136 |
| Exercise | ||||||
| Muscle and aerobic exercise | 1.00 | Reference | 1.00 | Reference | ||
| Only aerobic exercise | 1.08 | (0.9, 1.3) | 0.405 | 1.29 | (0.97, 1.71) | 0.076 |
| Only muscle exercise | 1.10 | (0.85, 1.42) | 0.454 | 0.95 | (0.65, 1.38) | 0.776 |
| No exercise | 1.12 | (0.93, 1.36) | 0.239 | 1.35 | (1.03, 1.76) | 0.028 |
Publisher’s Note: MDPI stays neutral with regard to jurisdictional claims in published maps and institutional affiliations. |
© 2021 by the authors. Licensee MDPI, Basel, Switzerland. This article is an open access article distributed under the terms and conditions of the Creative Commons Attribution (CC BY) license (https://creativecommons.org/licenses/by/4.0/).
Share and Cite
Kwan, B.-S.; Cho, I.-A.; Park, J.-E. Effect of Breastfeeding and Its Duration on Impaired Fasting Glucose and Diabetes in Perimenopausal and Postmenopausal Women: Korea National Health and Nutrition Examination Survey (KNHANES) 2010–2019. Medicines 2021, 8, 71. https://doi.org/10.3390/medicines8110071
Kwan B-S, Cho I-A, Park J-E. Effect of Breastfeeding and Its Duration on Impaired Fasting Glucose and Diabetes in Perimenopausal and Postmenopausal Women: Korea National Health and Nutrition Examination Survey (KNHANES) 2010–2019. Medicines. 2021; 8(11):71. https://doi.org/10.3390/medicines8110071
Chicago/Turabian StyleKwan, Byung-Soo, In-Ae Cho, and Ji-Eun Park. 2021. "Effect of Breastfeeding and Its Duration on Impaired Fasting Glucose and Diabetes in Perimenopausal and Postmenopausal Women: Korea National Health and Nutrition Examination Survey (KNHANES) 2010–2019" Medicines 8, no. 11: 71. https://doi.org/10.3390/medicines8110071
APA StyleKwan, B.-S., Cho, I.-A., & Park, J.-E. (2021). Effect of Breastfeeding and Its Duration on Impaired Fasting Glucose and Diabetes in Perimenopausal and Postmenopausal Women: Korea National Health and Nutrition Examination Survey (KNHANES) 2010–2019. Medicines, 8(11), 71. https://doi.org/10.3390/medicines8110071