Effect of Sulforaphane and 5-Aza-2’-Deoxycytidine on Melanoma Cell Growth

 , ,
, ,
Abstract
1. Introduction
2. Materials and Methods
2.1. Cell Culture and Treatment
2.2. Assays for Characteristics of Cell Growth
2.2.1. Viable Cell Count
2.2.2. Cell Cycle Arrest Analysis
2.2.3. Apoptotic Analysis
2.3. RNA-Seq Analysis
2.3.1. RNA Extraction and Targeted Gene Expression Analysis
2.3.2. RNA-Seq Sample Preparation
2.3.3. RNA-Seq Data Analysis
2.4. Chemokines Analysis
2.5. Histone PTM Mass Spectrometry
3. Results
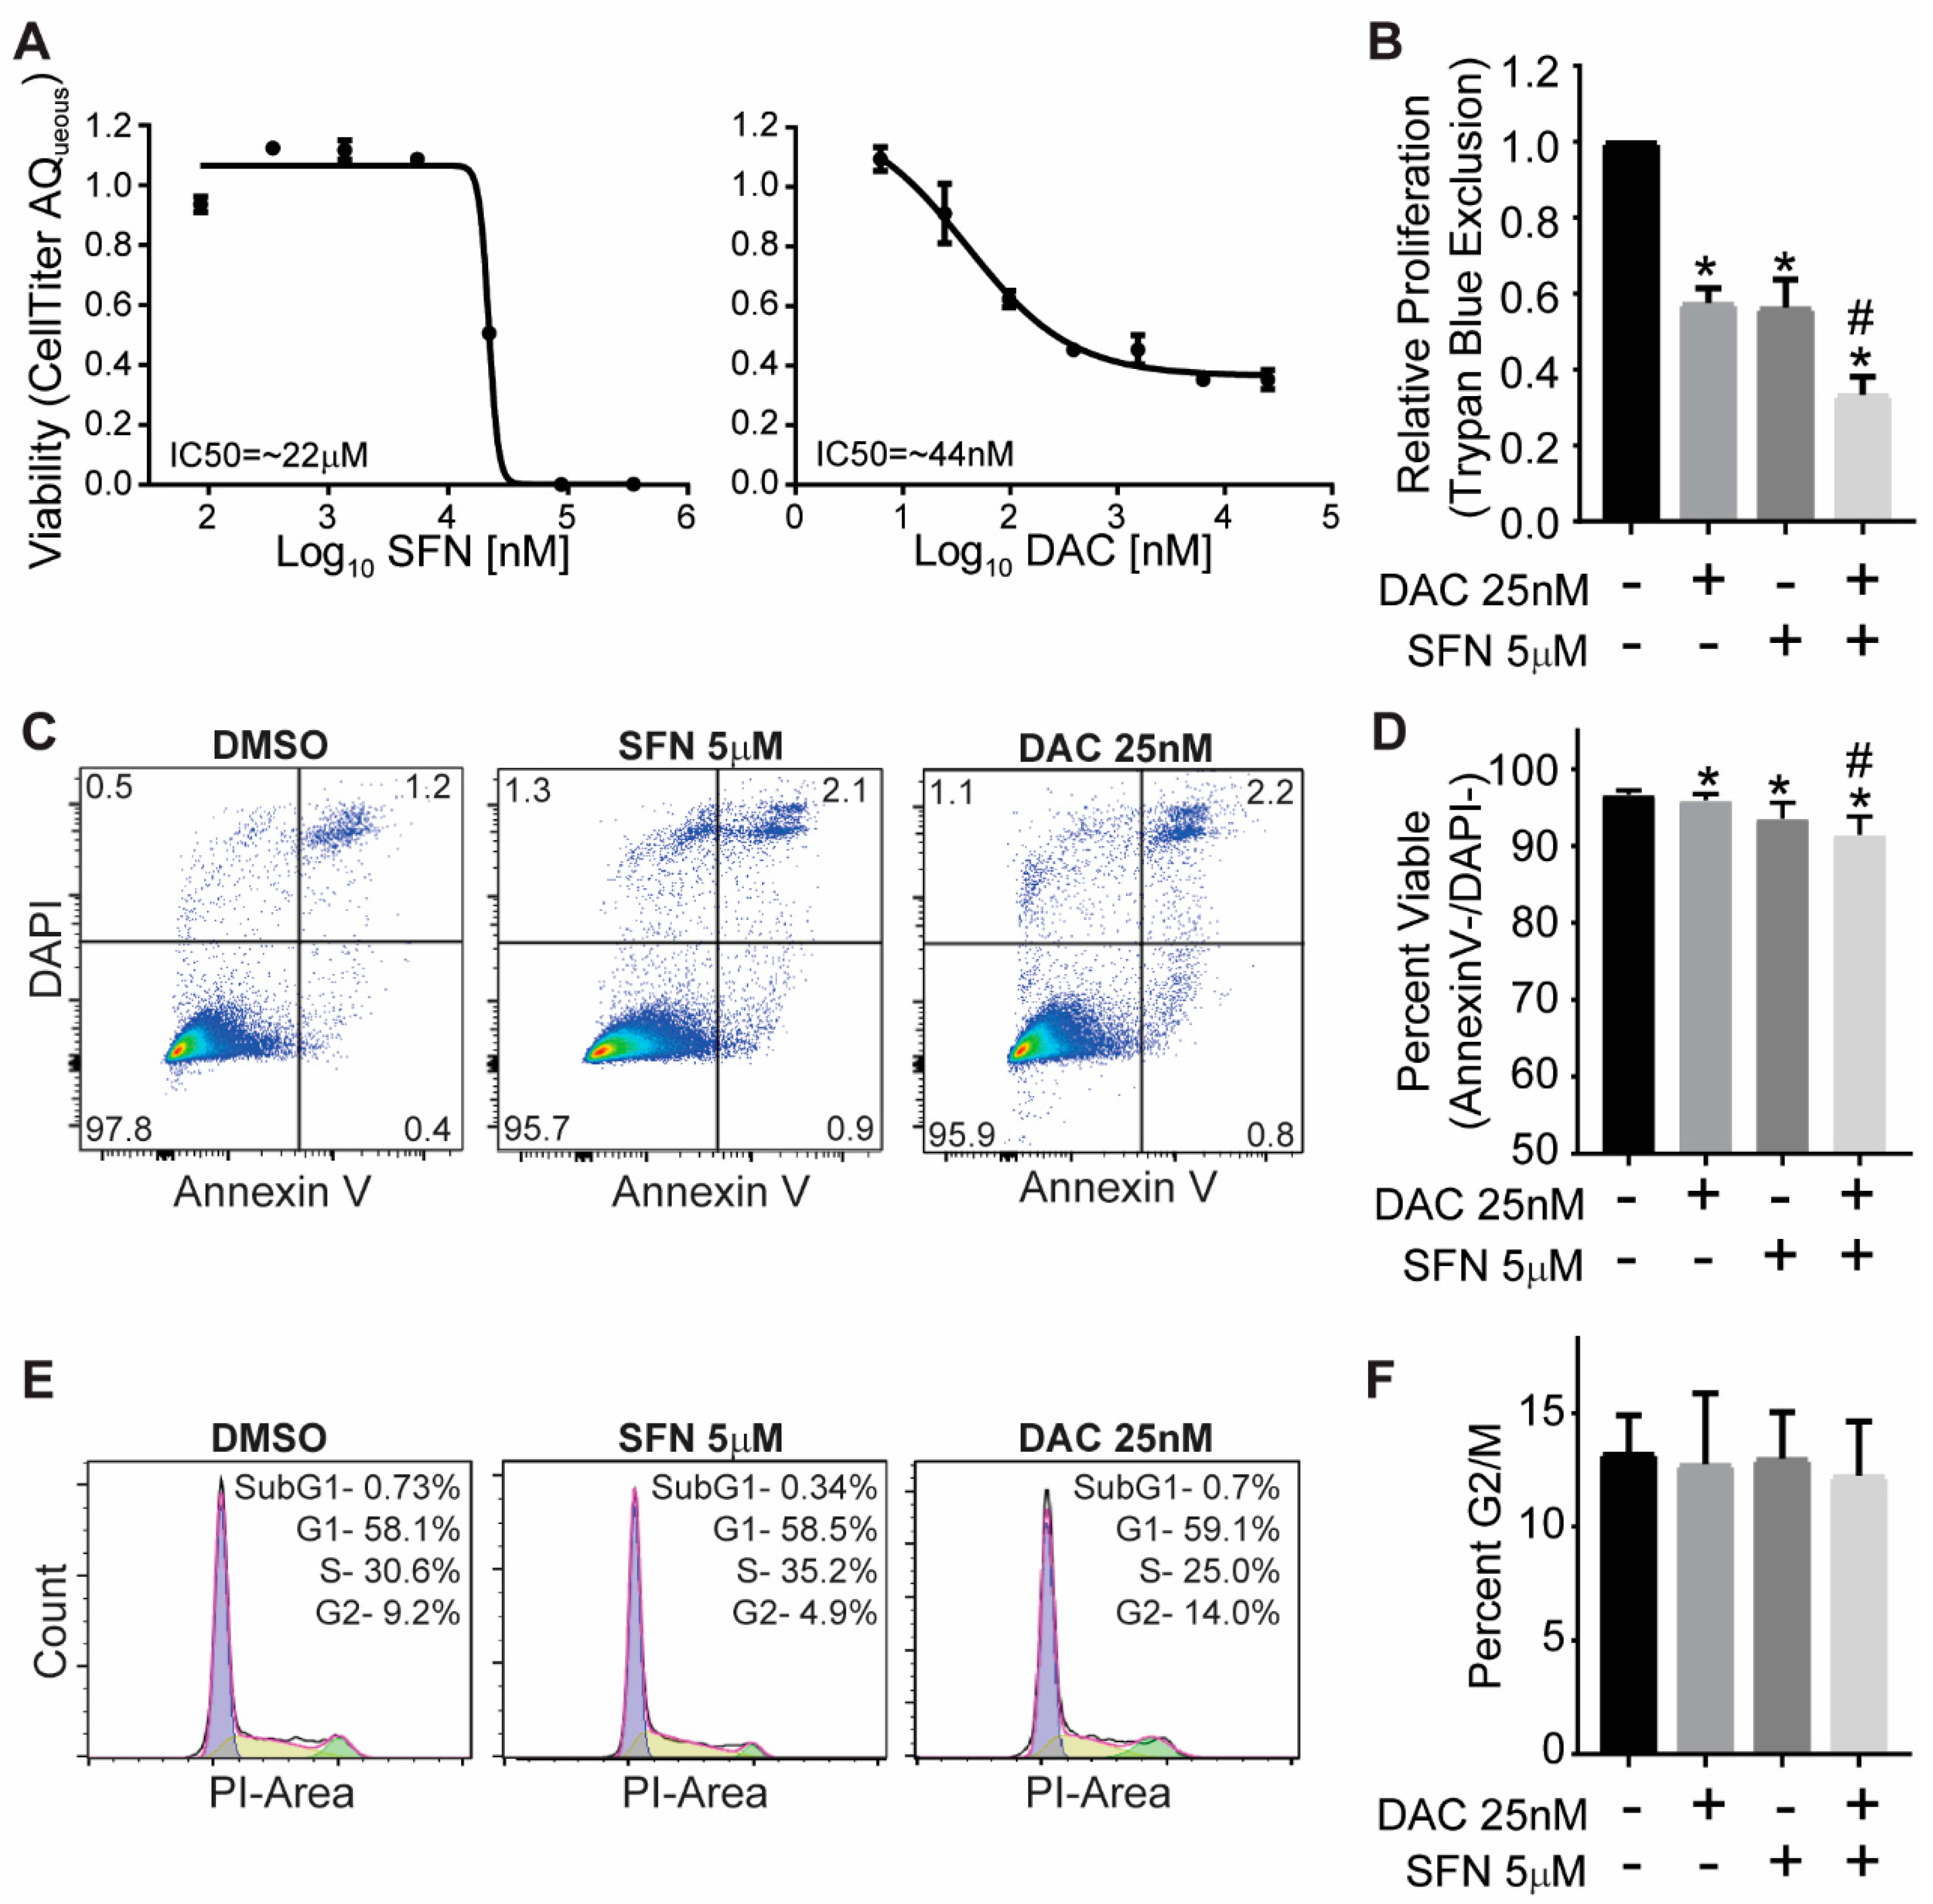
3.1. SFN and DAC Single and Combination Treatment Result in Growth Inhibition
3.2. SFN and DAC Single and Combination Treatment Result in Minimal Apoptosis
3.3. SFN and DAC Single and Combination Treatment Result in No Cell Cycle Arrest
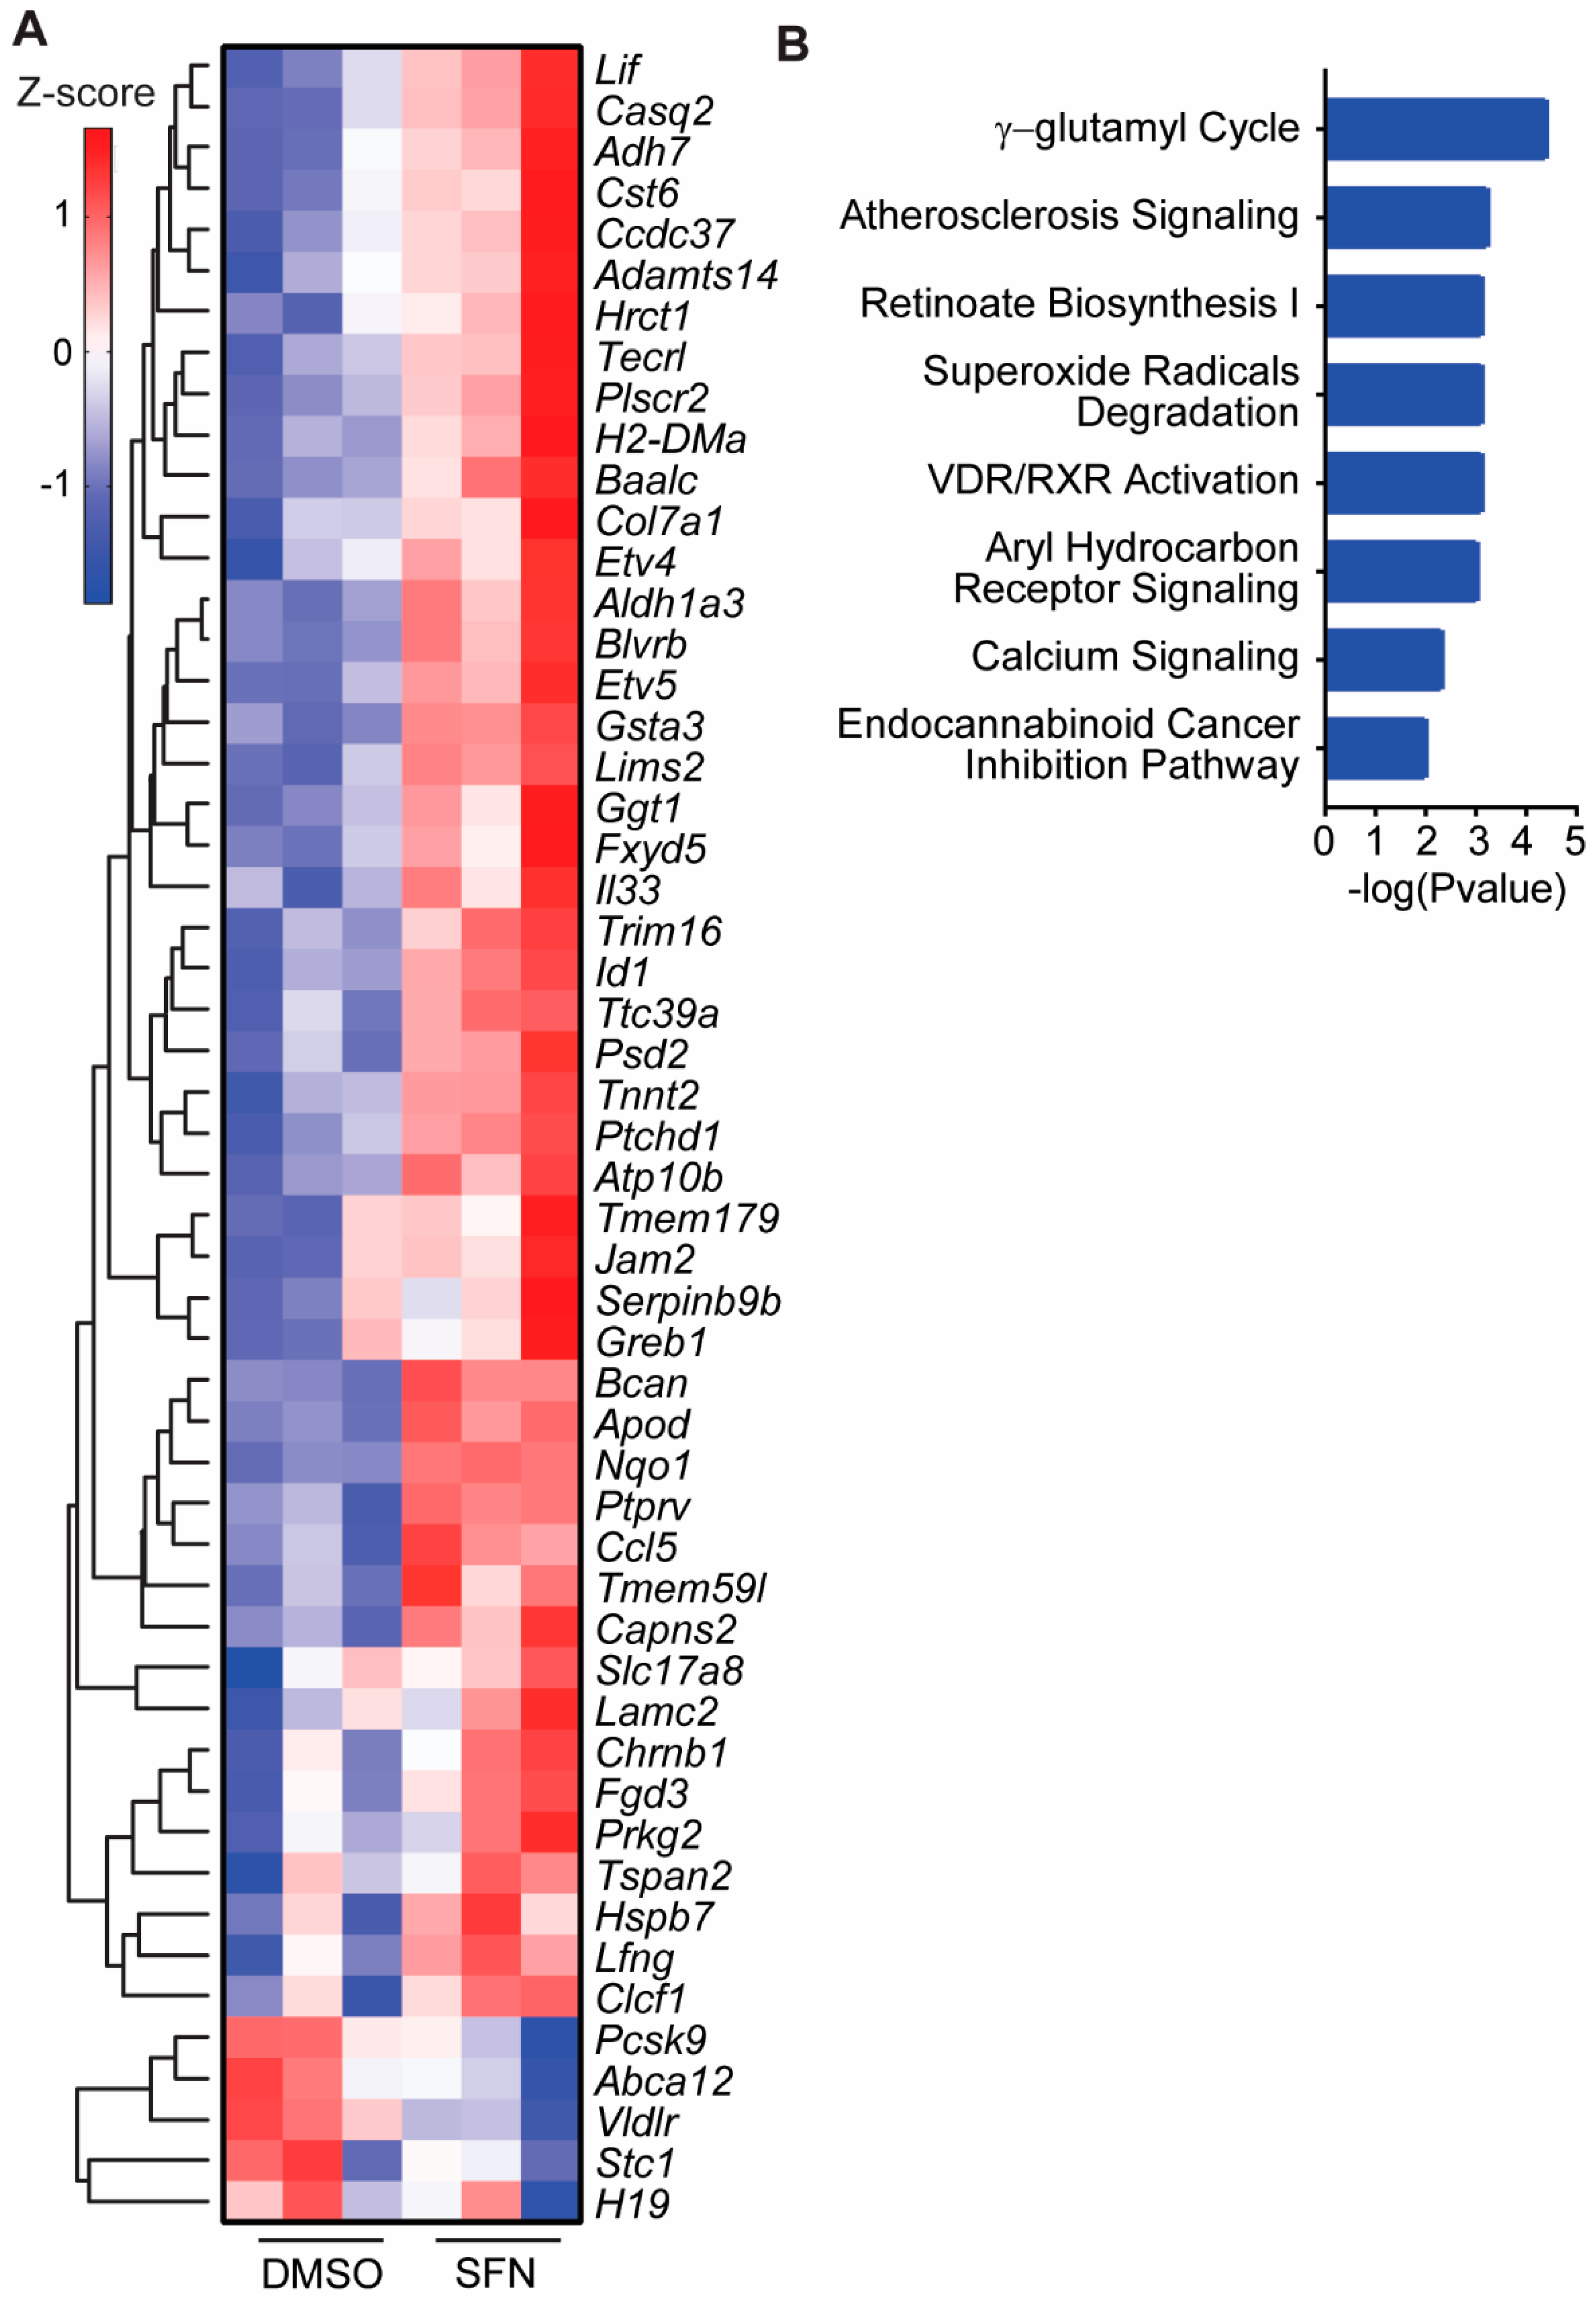
3.4. SFN Induced Dysregulated Gene Transcription
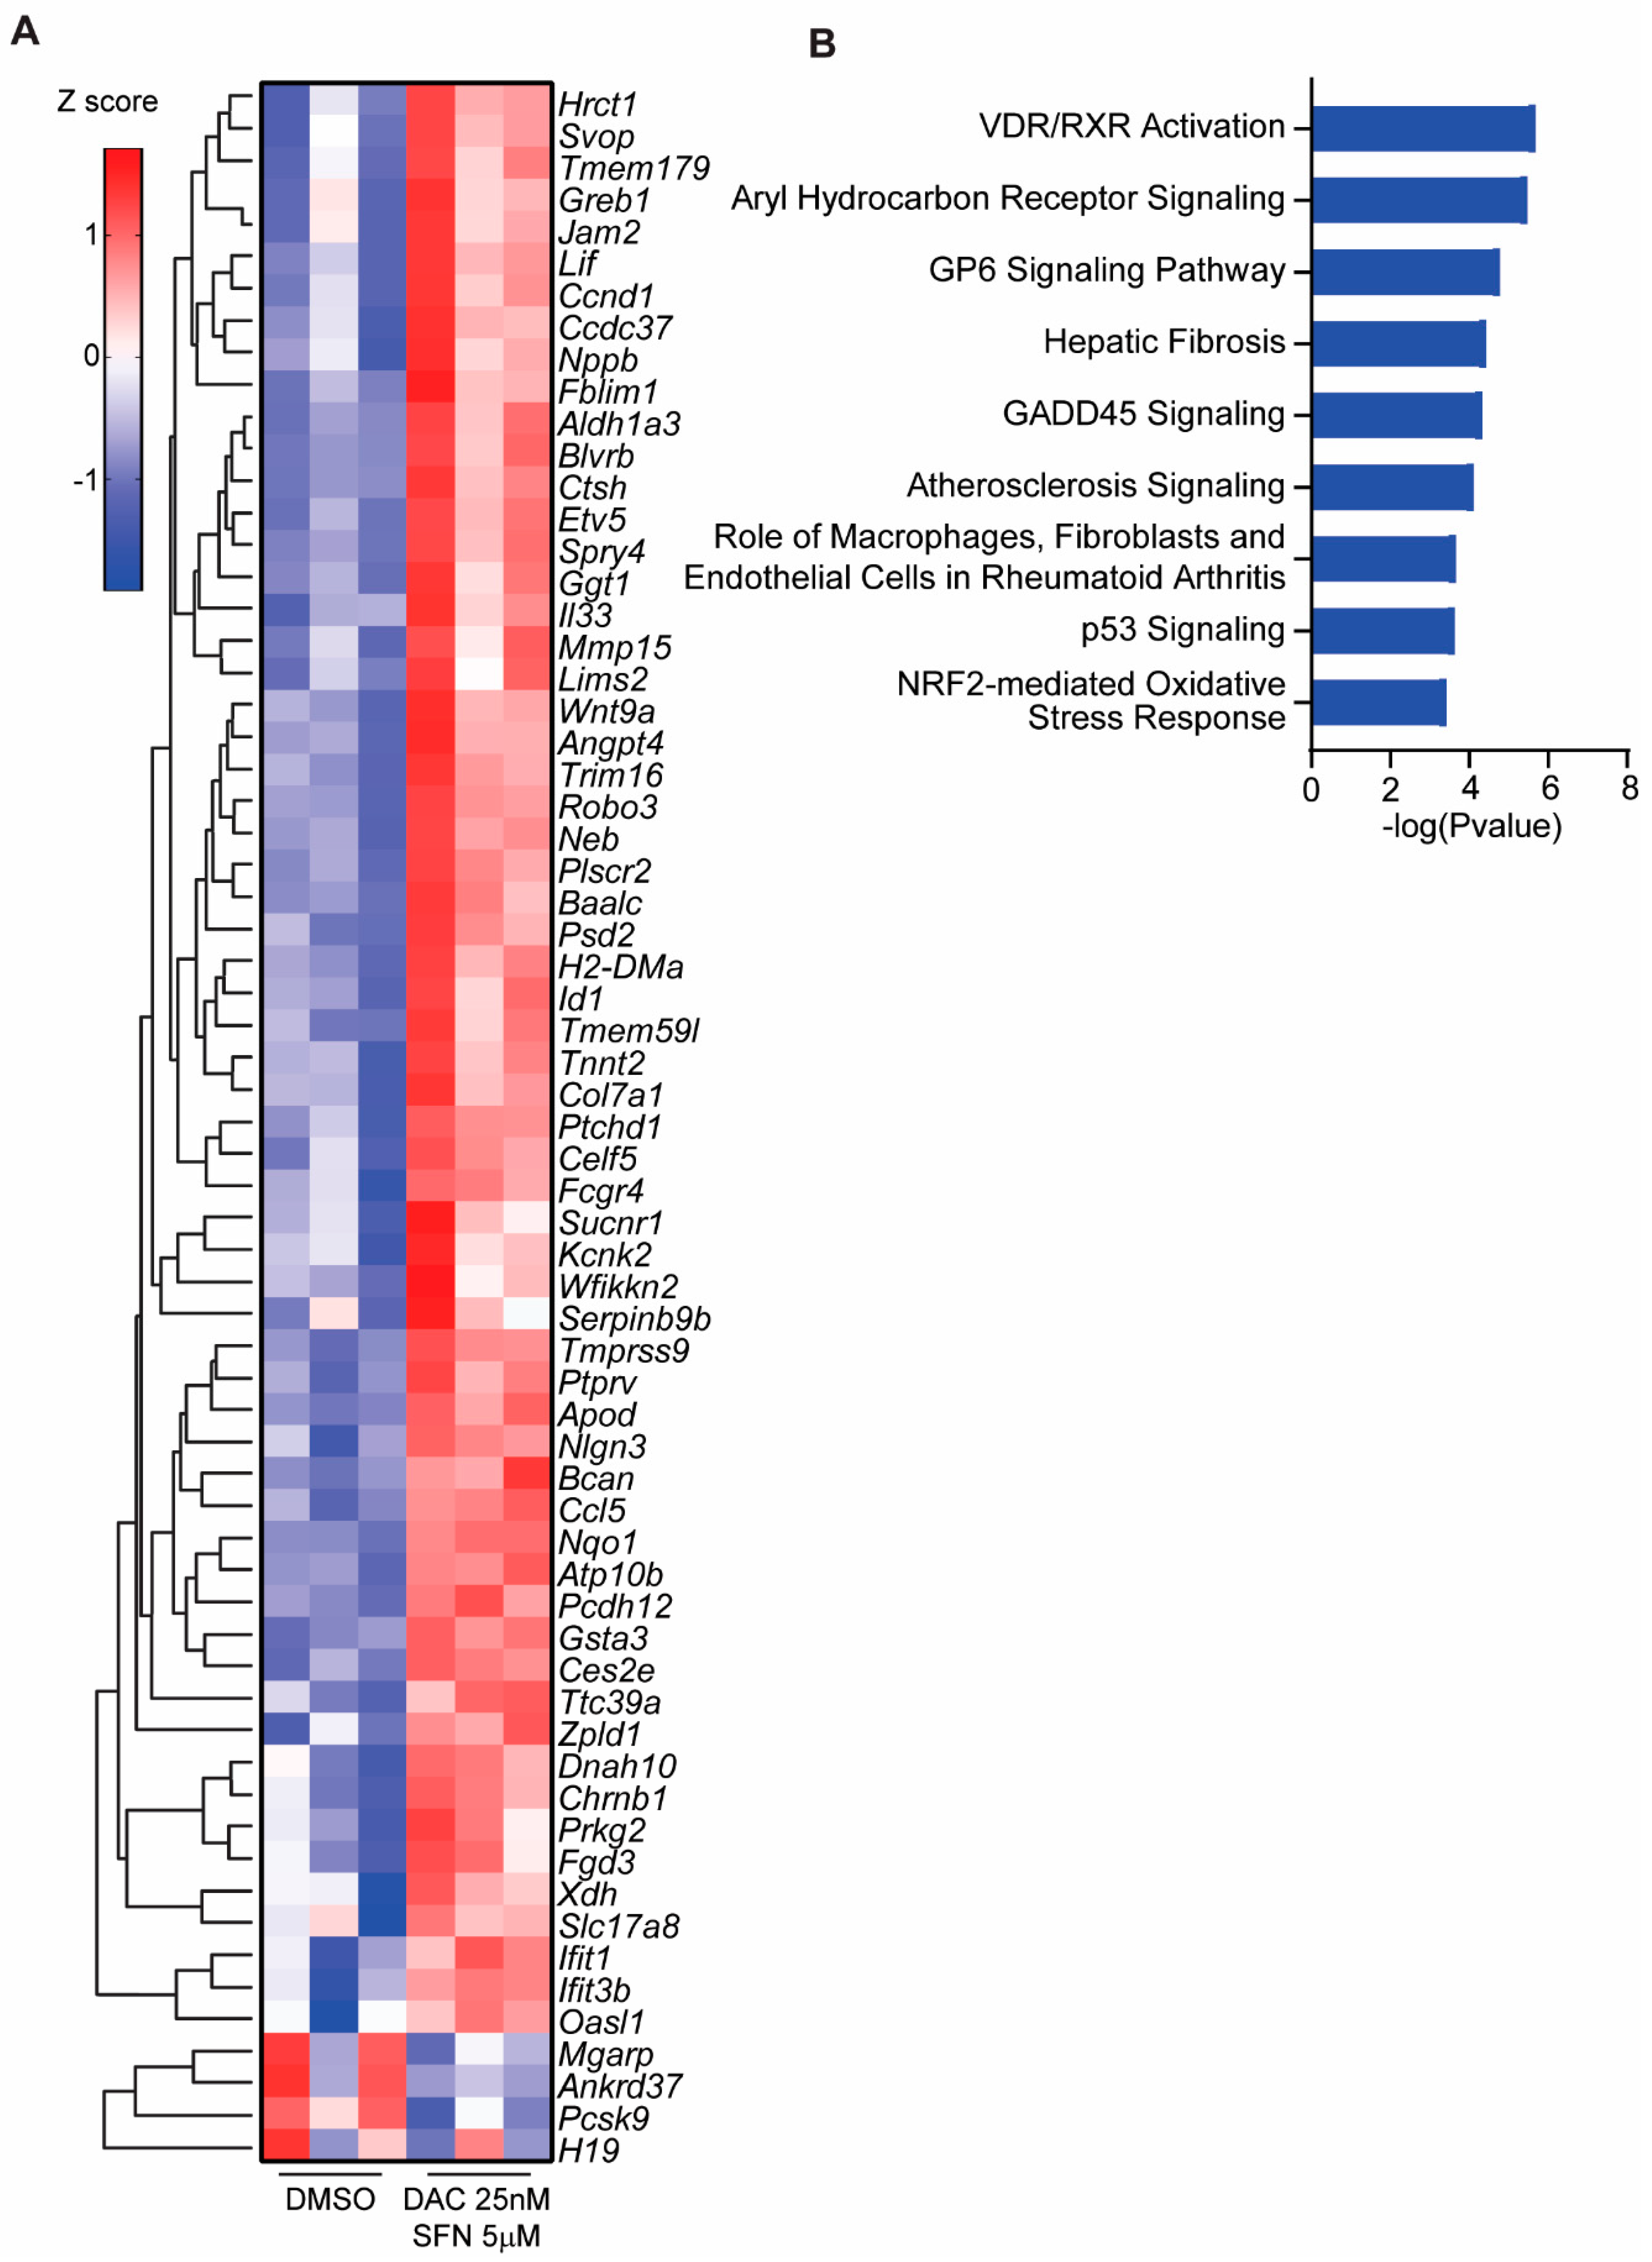
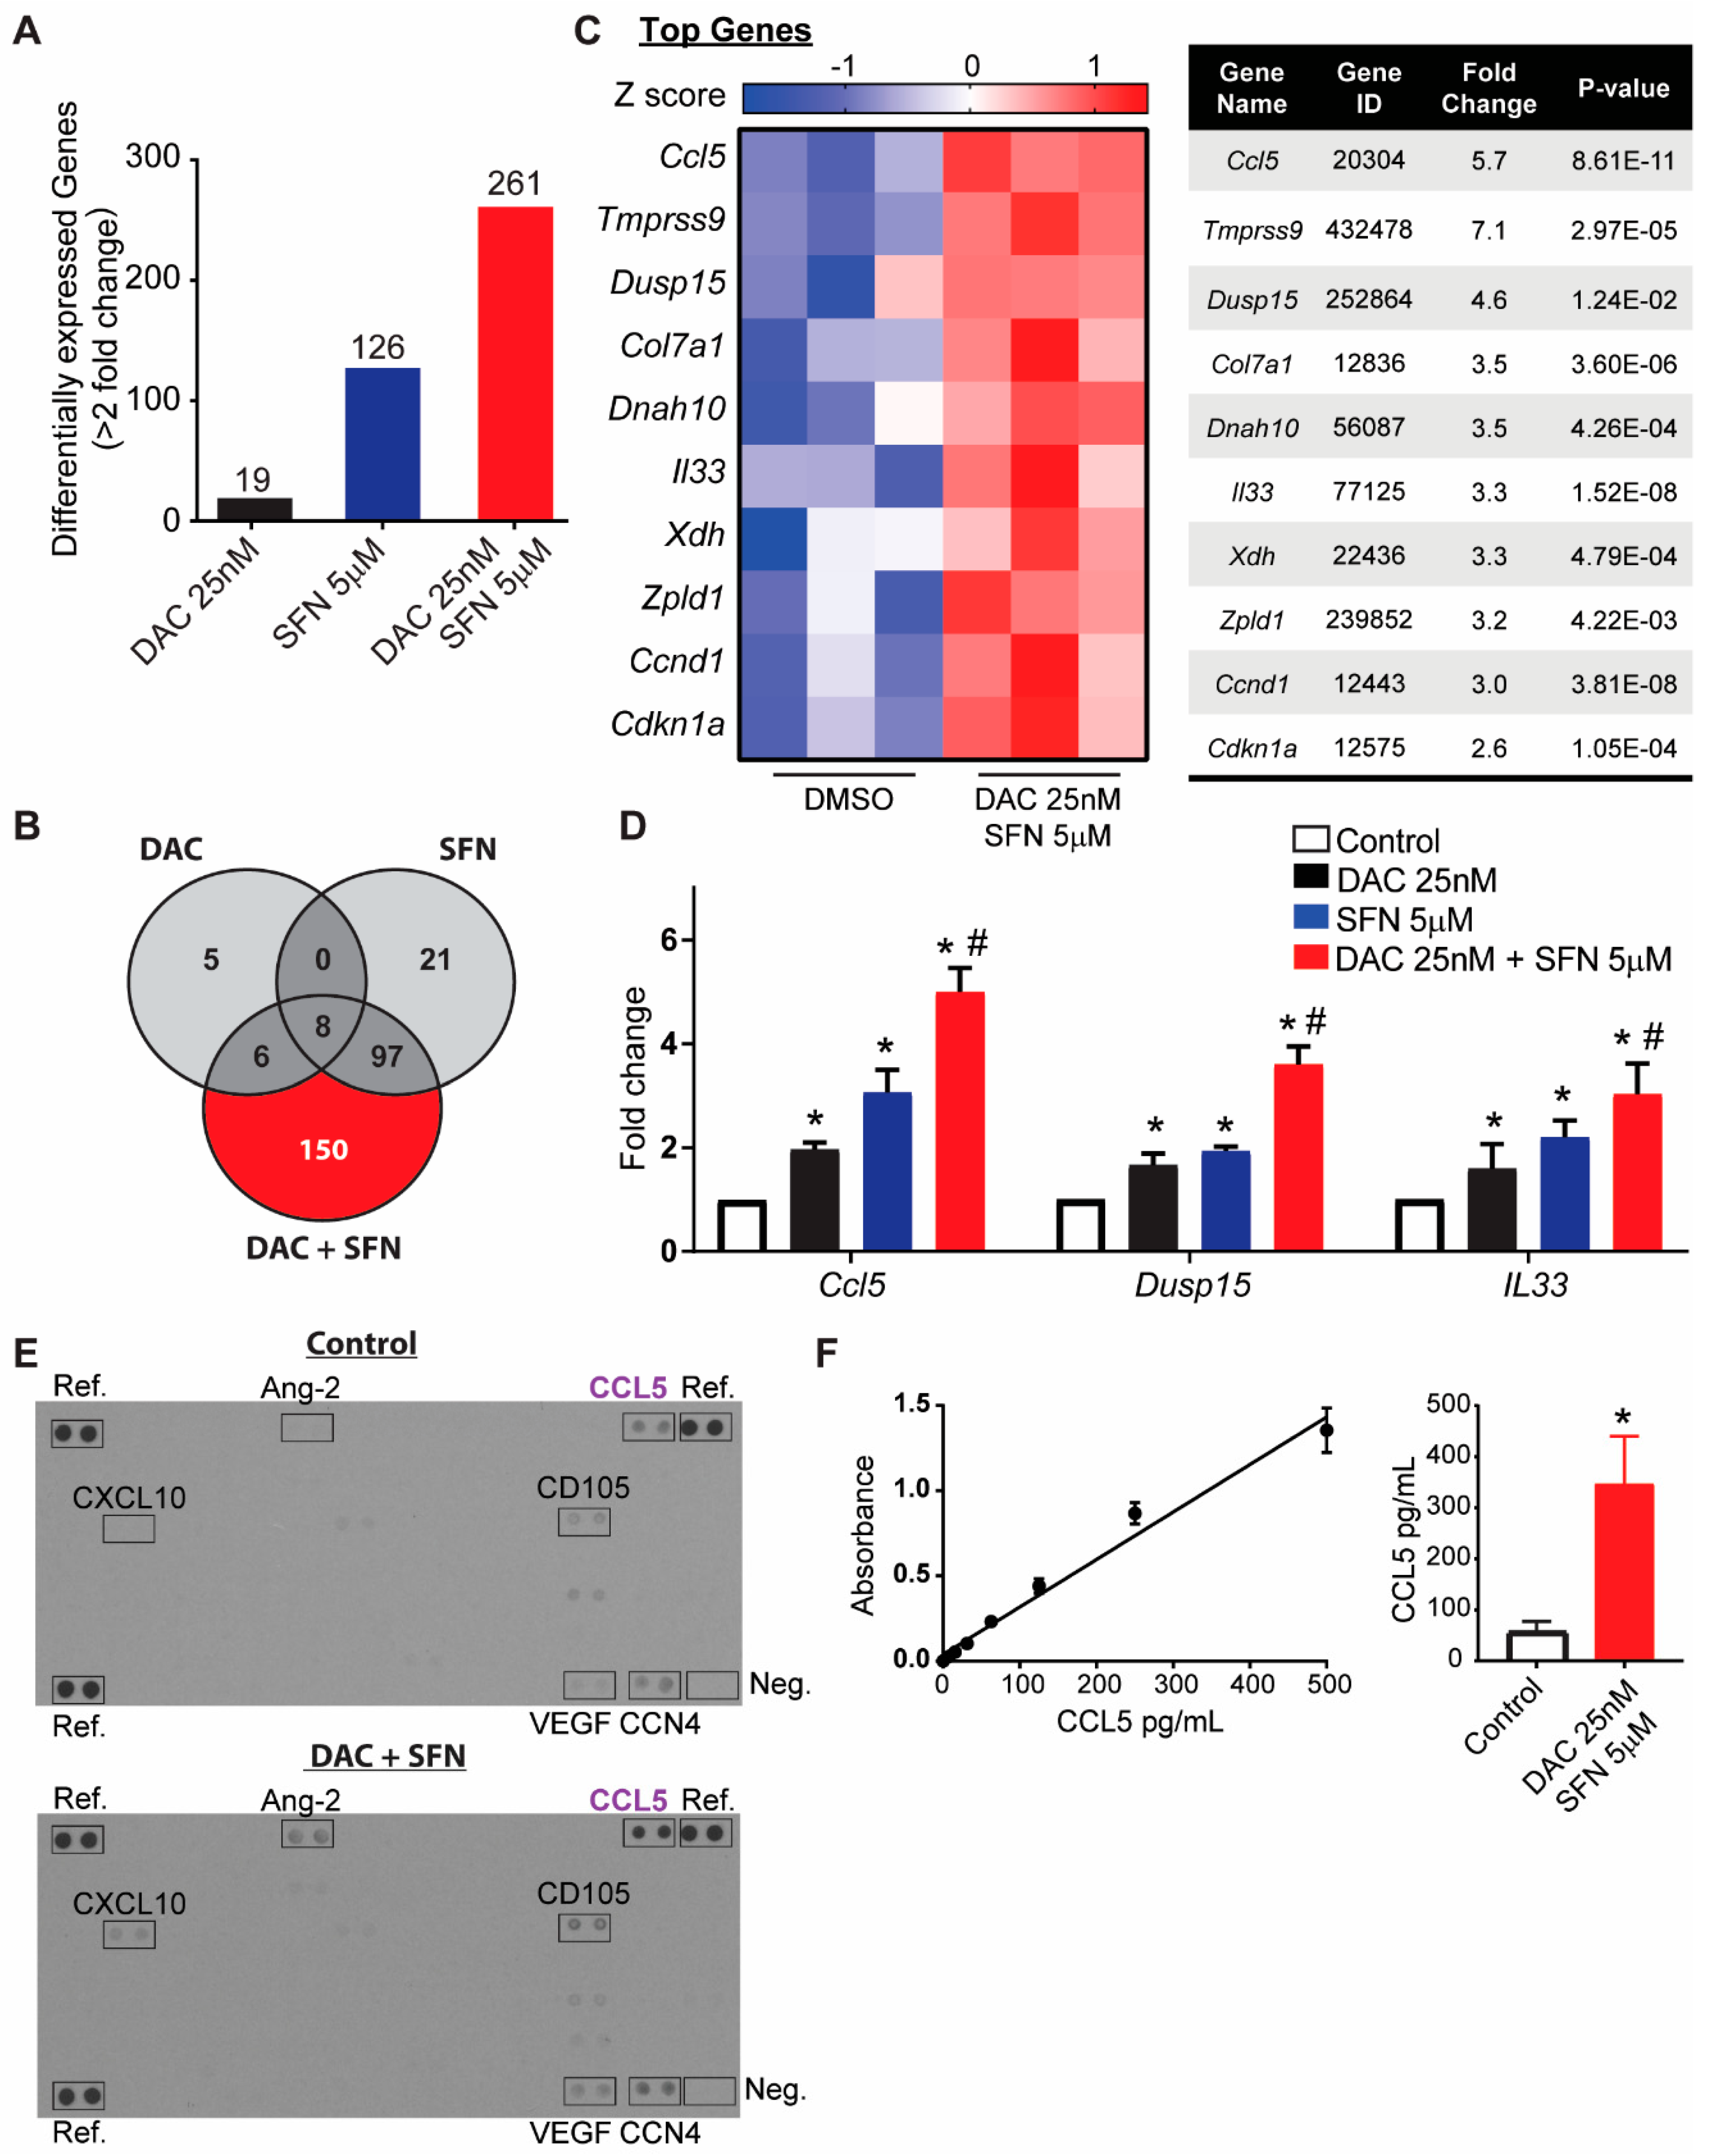
3.5. SFN and DAC Uniquely Induced Dysregulated Gene Transcription
3.6. Validation of Dysregulated Gene Transcription Induced by SFN and DAC Combination Treatment
3.7. Analysis of Histone Epigenetic Post-Translational Modifications (PTMs)
4. Discussion
5. Conclusions
Supplementary Materials
Author Contributions
Funding
Acknowledgments
Conflicts of Interest
References
- Sandru, A.; Voinea, S.; Panaitescu, E.; Blidaru, A. Survival rates of patients with metastatic malignant melanoma. J. Med. Life 2014, 7, 572–576. [Google Scholar] [PubMed]
- Chen, Y.; Lun, A.T.; Smyth, G.K. From reads to genes to pathways: Differential expression analysis of RNA-Seq experiments using Rsubread and the edgeR quasi-likelihood pipeline. F1000Research 2016, 5, 1438. [Google Scholar] [PubMed]
- Berwick, M.; Buller, D.B.; Cust, A.; Gallagher, R.; Lee, T.K.; Meyskens, F.; Pandey, S.; Thomas, N.E.; Veierød, M.B.; Ward, S. Melanoma Epidemiology and Prevention. Cancer Treat. Res. 2016, 167, 17–49. [Google Scholar] [PubMed]
- Cadet, J.; Wagner, J.R. DNA base damage by reactive oxygen species, oxidizing agents, and UV radiation. Cold Spring Harb. Perspect. Biol. 2013, 5, a012559. [Google Scholar] [CrossRef] [PubMed]
- Venza, M.; Visalli, M.; Beninati, C.; Gaetano, G.V.D.; Teti, D.; Venza, I. Cellular Mechanisms of Oxidative Stress and Action in Melanoma. Oxid. Med. Cell. Longev. 2015, 2015, 1–11. [Google Scholar] [CrossRef] [PubMed]
- Videira, I.F.; Moura, D.F.; Magina, S. Mechanisms regulating melanogenesis. Bras. Derm. 2013, 88, 76–83. [Google Scholar] [CrossRef] [PubMed]
- Drouin, R.; Therrien, J.P. UVB-induced cyclobutane pyrimidine dimer frequency correlates with skin cancer mutational hotspots in p53. Photochem. Photobiol. 1997, 66, 719–726. [Google Scholar] [CrossRef]
- Abdel-Malek, Z.; Swope, V.; Smalara, D.; Babcock, G.; Dawes, S.; Nordlund, J. Analysis of the UV-induced melanogenesis and growth arrest of human melanocytes. Pigment Cell Res. 1994, 7, 326–332. [Google Scholar] [CrossRef]
- Latreille, J.; Ezzedine, K.; Elfakir, A.; Ambroisine, L.; Gardinier, S.; Galan, P.; Hercberg, S.; Gruber, G.; Rees, J.; Tschachler, E.; et al. MC1R gene polymorphism affects skin color and phenotypic features related to sun sensitivity in a population of French adult women. Photochem. Photobiol. 2009, 85, 1451–1458. [Google Scholar] [CrossRef]
- Morgan, A.M.; Lo, J.; Fisher, D.E. How does pheomelanin synthesis contribute to melanomagenesis?: Two distinct mechanisms could explain the carcinogenicity of pheomelanin synthesis. Bioessays 2013, 35, 672–676. [Google Scholar] [CrossRef]
- Hsiao, J.J.; Fisher, D.E. The roles of microphthalmia-associated transcription factor and pigmentation in melanoma. Arch. Biochem. Biophys. 2014, 563, 28–34. [Google Scholar] [CrossRef] [PubMed]
- Samokhvalov, A.; Hong, L.; Liu, Y.; Garguilo, J.; Nemanich, R.J.; Edwards, G.S.; Simon, J.D. Oxidation potentials of human eumelanosomes and pheomelanosomes. Photochem. Photobiol. 2005, 81, 145–148. [Google Scholar] [CrossRef] [PubMed]
- Sulem, P.; Gudbjartsson, D.F.; Stacey, S.N.; Helgason, A.; Rafnar, T.; Magnusson, K.P.; Manolescu, A.; Karason, A.; Palsson, A.; Thorleifsson, G.; et al. Genetic determinants of hair, eye and skin pigmentation in Europeans. Nat. Genet. 2007, 39, 1443–1452. [Google Scholar] [CrossRef] [PubMed]
- Syed, D.N.; Mukhtar, H. FICZ: A Messenger of Light in Human Skin. J. Investig. Derm. 2015, 135, 1478–1481. [Google Scholar] [CrossRef] [PubMed]
- Fritsche, E.; Schäfer, C.; Calles, C.; Bernsmann, T.; Bernshausen, T.; Wurm, M.; Hübenthal, U.; Cline, J.E.; Hajimiragha, H.; Schroeder, P.; et al. Lightening up the UV response by identification of the arylhydrocarbon receptor as a cytoplasmatic target for ultraviolet B radiation. Proc. Natl. Acad. Sci. USA 2007, 104, 8851–8856. [Google Scholar] [CrossRef] [PubMed]
- Becker, M.R.; Siegelin, M.D.; Rompel, R.; Enk, A.H.; Gaiser, T. COX-2 expression in malignant melanoma: A novel prognostic marker? Melanoma Res. 2009, 19, 8–16. [Google Scholar] [CrossRef] [PubMed]
- Furue, M.; Takahara, M.; Nakahara, T.; Uchi, H. Role of AhR/ARNT system in skin homeostasis. Arch. Derm. Res. 2014, 306, 769–779. [Google Scholar] [CrossRef] [PubMed]
- Pollet, M.; Shaik, S.; Mescher, M.; Frauenstein, K.; Tigges, J.; Braun, S.A.; Sondenheimer, K.; Kaveh, M.; Bruhs, A.; Meller, S.; et al. The AHR represses nucleotide excision repair and apoptosis and contributes to UV-induced skin carcinogenesis. Cell Death Differ. 2018, 25, 1823–1836. [Google Scholar] [CrossRef]
- Delijewski, M.; Wrześniok, D.; Otręba, M.; Beberok, A.; Rok, J.; Buszman, E. Nicotine impact on melanogenesis and antioxidant defense system in HEMn-DP melanocytes. Mol. Cell. Biochem. 2014, 395, 109–116. [Google Scholar] [CrossRef]
- Haresaku, S.; Hanioka, T.; Tsutsui, A.; Watanabe, T. Association of lip pigmentation with smoking and gingival melanin pigmentation. Oral Dis. 2007, 13, 71–76. [Google Scholar] [CrossRef]
- Mimura, J.; Fujii-Kuriyama, Y. Functional role of AhR in the expression of toxic effects by TCDD. Biochim. Biophys. Acta 2003, 1619, 263–268. [Google Scholar] [CrossRef]
- Granstein, R.D.; Sober, A.J. Drug- and heavy metal—Induced hyperpigmentation. J. Am. Acad. Derm. 1981, 5, 1–18. [Google Scholar] [CrossRef]
- Bisevac, J.P.; Djukic, M.; Stanojevic, I.; Stevanovic, I.; Mijuskovic, Z.; Djuric, A.; Gobeljic, B.; Banovic, T.; Vojvodic, D. Association Between Oxidative Stress and Melanoma Progression. J. Med. Biochem. 2018, 37, 12–20. [Google Scholar] [CrossRef] [PubMed]
- Sarkar, D.; Leung, E.Y.; Baguley, B.C.; Finlay, G.J.; Askarian-Amiri, M.E. Epigenetic regulation in human melanoma: Past and future. Epigenetics 2015, 10, 103–121. [Google Scholar] [CrossRef] [PubMed]
- Tokarz, P.; Kaarniranta, K.; Blasiak, J. Inhibition of DNA methyltransferase or histone deacetylase protects retinal pigment epithelial cells from DNA damage induced by oxidative stress by the stimulation of antioxidant enzymes. Eur. J. Pharm. 2016, 776, 167–175. [Google Scholar] [CrossRef] [PubMed]
- Donkena, K.V.; Young, C.Y.; Tindall, D.J. Oxidative stress and DNA methylation in prostate cancer. Obs. Gynecol. Int. 2010, 2010, 1–14. [Google Scholar] [CrossRef]
- Wachsman, J.T. DNA methylation and the association between genetic and epigenetic changes: Relation to carcinogenesis. Mutat. Res. 1997, 375, 1–8. [Google Scholar] [CrossRef]
- Sigalotti, L.; Covre, A.; Fratta, E.; Parisi, G.; Colizzi, F.; Rizzo, A.; Danielli, R.; Nicolay, H.J.; Coral, S.; Maio, M. Epigenetics of human cutaneous melanoma: Setting the stage for new therapeutic strategies. J. Transl. Med. 2010, 8, 56. [Google Scholar] [CrossRef]
- Furuta, J.; Umebayashi, Y.; Miyamoto, K.; Kikuchi, K.; Otsuka, F.; Sugimura, T.; Ushijima, T. Promoter methylation profiling of 30 genes in human malignant melanoma. Cancer Sci. 2004, 95, 962–968. [Google Scholar] [CrossRef]
- Hoon, D.S.; Spugnardi, M.; Kuo, C.; Huang, S.K.; Morton, D.L.; Taback, B. Profiling epigenetic inactivation of tumor suppressor genes in tumors and plasma from cutaneous melanoma patients. Oncogene 2004, 23, 4014–4022. [Google Scholar] [CrossRef]
- Shen, L.; Kondo, Y.; Guo, Y.; Zhang, J.; Zhang, L.; Ahmed, S.; Shu, J.; Chen, X.; Waterland, R.A.; Issa, J.P. Genome-wide profiling of DNA methylation reveals a class of normally methylated CpG island promoters. PLoS Genet. 2007, 3, 2023–2036. [Google Scholar] [CrossRef] [PubMed]
- Muthusamy, V.; Duraisamy, S.; Bradbury, C.M.; Hobbs, C.; Curley, D.P.; Nelson, B.; Bosenberg, M. Epigenetic silencing of novel tumor suppressors in malignant melanoma. Cancer Res. 2006, 66, 11187–11193. [Google Scholar] [CrossRef] [PubMed]
- Koga, Y.; Pelizzola, M.; Cheng, E.; Krauthammer, M.; Sznol, M.; Ariyan, S.; Narayan, D.; Molinaro, A.M.; Halaban, R.; Weissman, S.M. Genome-wide screen of promoter methylation identifies novel markers in melanoma. Genome Res. 2009, 19, 1462–1470. [Google Scholar] [CrossRef] [PubMed]
- Sigalotti, L.; Covre, A.; Fratta, E.; Parisi, G.; Sonego, P.; Colizzi, F.; Coral, S.; Massarut, S.; Kirkwood, J.M.; Maio, M. Whole genome methylation profiles as independent markers of survival in stage IIIC melanoma patients. J. Transl. Med. 2012, 10, 185. [Google Scholar] [CrossRef] [PubMed]
- Sengupta, D.; Byrum, S.D.; Avaritt, N.L.; Davis, L.; Shields, B.; Mahmoud, F.; Reynolds, M.; Orr, L.M.; Mackintosh, S.G.; Shalin, S.C.; et al. Quantitative Histone Mass Spectrometry Identifies Elevated Histone H3 Lysine 27 (Lys27) Trimethylation in Melanoma. Mol. Cell. Proteom. 2016, 15, 765–775. [Google Scholar] [CrossRef] [PubMed]
- Vire, E.; Brenner, C.; Deplus, R.; Blanchon, L.; Fraga, M.; Didelot, C.; Morey, L.; Van Eynde, A.; Bernard, D.; Vanderwinden, J.M.; et al. The Polycomb group protein EZH2 directly controls DNA methylation. Nature 2006, 439, 871–874. [Google Scholar] [CrossRef]
- Malik, P.; Cashen, A.F. Decitabine in the treatment of acute myeloid leukemia in elderly patients. Cancer Manag. Res. 2014, 6, 53–61. [Google Scholar]
- Young, C.S.; Clarke, K.M.; Kettyle, L.M.; Thompson, A.; Mills, K.I. Decitabine-Vorinostat combination treatment in acute myeloid leukemia activates pathways with potential for novel triple therapy. Oncotarget 2017, 8, 51429–51446. [Google Scholar] [CrossRef]
- Momparler, R.L.; Côté, S.; Momparler, L.F.; Idaghdour, Y. Epigenetic therapy of acute myeloid leukemia using 5-aza-2-deoxycytidine (decitabine) in combination with inhibitors of histone methylation and deacetylation. Clin. Epigenetics 2014, 6, 19. [Google Scholar] [CrossRef]
- Sorm, F.; Vesely, J. Effect of 5-aza-2-deoxycytidine against leukemic and hemopoietic tissues in AKR mice. Neoplasma 1968, 15, 339–343. [Google Scholar]
- Christman, J.K. 5-Azacytidine and 5-aza-2-deoxycytidine as inhibitors of DNA methylation: Mechanistic studies and their implications for cancer therapy. Oncogene 2002, 21, 5483–5495. [Google Scholar] [CrossRef] [PubMed]
- Issa, J.P.; Garcia-Manero, G.; Giles, F.J.; Mannari, R.; Thomas, D.; Faderl, S.; Bayar, E.; Lyons, J.; Rosenfeld, C.S.; Cortes, J.; et al. Phase 1 study of low-dose prolonged exposure schedules of the hypomethylating agent 5-aza-2-deoxycytidine (decitabine) in hematopoietic malignancies. Blood 2004, 103, 1635–1640. [Google Scholar] [CrossRef] [PubMed]
- Rajaii, F.; Asnaghi, L.; Enke, R.; Merbs, S.L.; Handa, J.T.; Eberhart, C.G. The demethylating agent 5-Aza reduces the growth, invasiveness, and clonogenicity of uveal and cutaneous melanoma. Invest. Ophthalmol. Vis. Sci. 2014, 55, 6178–6186. [Google Scholar] [CrossRef] [PubMed][Green Version]
- El Baroudi, M.; La Sala, D.; Cinti, C.; Capobianco, E. Pathway landscapes and epigenetic regulation in breast cancer and melanoma cell lines. Theor. Biol. Med. Model. 2014, 11, S8. [Google Scholar] [CrossRef] [PubMed]
- Herr, I.; Buchler, M.W. Dietary constituents of broccoli and other cruciferous vegetables: Implications for prevention and therapy of cancer. Cancer Treat. Rev. 2010, 36, 377–383. [Google Scholar] [CrossRef]
- Higdon, J.V.; Delage, B.; Williams, D.E.; Dashwood, R.H. Cruciferous vegetables and human cancer risk: Epidemiologic evidence and mechanistic basis. Pharm. Res. 2007, 55, 224–236. [Google Scholar] [CrossRef]
- Durko, L.; Malecka-Panas, E. Lifestyle Modifications and Colorectal Cancer. Curr. Colorectal Cancer Rep. 2014, 10, 45–54. [Google Scholar] [CrossRef]
- Sestili, P.; Fimognari, C. Cytotoxic and Antitumor Activity of Sulforaphane: The Role of Reactive Oxygen Species. Biomed. Res. Int. 2015, 2015, 1–9. [Google Scholar] [CrossRef]
- Xiao, D.; Powolny, A.A.; Antosiewicz, J.; Hahm, E.R.; Bommareddy, A.; Zeng, Y.; Desai, D.; Amin, S.; Herman-Antosiewicz, A.; Singh, S.V. Cellular responses to cancer chemopreventive agent D,L-sulforaphane in human prostate cancer cells are initiated by mitochondrial reactive oxygen species. Pharm. Res. 2009, 26, 1729–1738. [Google Scholar] [CrossRef]
- Prochaska, H.J.; Santamaria, A.B.; Talalay, P. Rapid detection of inducers of enzymes that protect against carcinogens. Proc. Natl. Acad. Sci. USA 1992, 89, 2394–2398. [Google Scholar] [CrossRef]
- Riedl, M.A.; Saxon, A.; Diaz-Sanchez, D. Oral sulforaphane increases Phase II antioxidant enzymes in the human upper airway. Clin. Immunol. 2009, 130, 244–251. [Google Scholar] [CrossRef] [PubMed]
- Fimognari, C.; Hrelia, P. Sulforaphane as a promising molecule for fighting cancer. Mutat. Res. 2007, 635, 90–104. [Google Scholar] [CrossRef] [PubMed]
- Cho, S.D.; Li, G.; Hu, H.; Jiang, C.; Kang, K.S.; Lee, Y.S.; Kim, S.H.; Lu, J. Involvement of c-Jun N-terminal kinase in G2/M arrest and caspase-mediated apoptosis induced by sulforaphane in DU145 prostate cancer cells. Nutr. Cancer 2005, 52, 213–224. [Google Scholar] [CrossRef] [PubMed]
- Choi, S.; Singh, S.V. Bax and Bak are required for apoptosis induction by sulforaphane, a cruciferous vegetable-derived cancer chemopreventive agent. Cancer Res. 2005, 65, 2035–2043. [Google Scholar] [CrossRef] [PubMed]
- Pledgie-Tracy, A.; Sobolewski, M.D.; Davidson, N.E. Sulforaphane induces cell type-specific apoptosis in human breast cancer cell lines. Mol. Cancer Ther. 2007, 6, 1013–1021. [Google Scholar] [CrossRef] [PubMed]
- Myzak, M.C.; Hardin, K.; Wang, R.; Dashwood, R.H.; Ho, E. Sulforaphane inhibits histone deacetylase activity in BPH-1, LnCaP and PC-3 prostate epithelial cells. Carcinogenesis 2006, 27, 811–819. [Google Scholar] [CrossRef]
- Myzak, M.C.; Tong, P.; Dashwood, W.M.; Dashwood, R.H.; Ho, E. Sulforaphane retards the growth of human PC-3 xenografts and inhibits HDAC activity in human subjects. Exp. Biol. Med. 2007, 232, 227–234. [Google Scholar]
- Wang, X.; Li, Y.; Dai, Y.; Liu, Q.; Ning, S.; Liu, J.; Shen, Z.; Zhu, D.; Jiang, F.; Zhang, J.; et al. Sulforaphane improves chemotherapy efficacy by targeting cancer stem cell-like properties via the miR-124/IL-6R/STAT3 axis. Sci. Rep. 2016, 6, 36796. [Google Scholar] [CrossRef]
- Bose, C.; Awasthi, S.; Sharma, R.; Beneš, H.; Hauer-Jensen, M.; Boerma, M.; Singh, S.P. Sulforaphane potentiates anticancer effects of doxorubicin and attenuates its cardiotoxicity in a breast cancer model. PLoS ONE 2018, 13, e0193918. [Google Scholar] [CrossRef]
- Fan, P.; Zhang, Y.; Liu, L.; Zhao, Z.; Yin, Y.; Xiao, X.; Bauer, N.; Gladkich, J.; Mattern, J.; Gao, C.; et al. Continuous exposure of pancreatic cancer cells to dietary bioactive agents does not induce drug resistance unlike chemotherapy. Cell Death Dis. 2016, 7, e2246. [Google Scholar] [CrossRef]
- Bolger, A.M.; Lohse, M.; Usadel, B. Trimmomatic: A flexible trimmer for Illumina sequence data. Bioinformatics 2014, 30, 2114–2120. [Google Scholar] [CrossRef] [PubMed]
- Trapnell, C.; Pachter, L.; Salzberg, S.L. TopHat: Discovering splice junctions with RNA-Seq. Bioinformatics 2009, 25, 1105–1111. [Google Scholar] [CrossRef] [PubMed]
- Anders, S.; Pyl, P.T.; Huber, W. HTSeq—A Python framework to work with high-throughput sequencing data. Bioinformatics 2015, 31, 166–169. [Google Scholar] [CrossRef] [PubMed]
- Gotz, S.; García-Gómez, J.M.; Terol, J.; Williams, T.D.; Nagaraj, S.H.; Nueda, M.J.; Robles, M.; Talón, M.; Dopazo, J.; Conesa, A. High-throughput functional annotation and data mining with the Blast2GO suite. Nucleic Acids Res. 2008, 36, 3420–3435. [Google Scholar] [CrossRef] [PubMed]
- Robinson, M.D.; Oshlack, A. A scaling normalization method for differential expression analysis of RNA-seq data. Genome Biol. 2010, 11, R25. [Google Scholar] [CrossRef] [PubMed]
- Benjamini, Y.; Hochberg, Y. Controlling The False Discovery Rate-A Practical And Powerful Approach To Multiple Testing. J. R. Stat. Soc. Ser. B 1995, 57, 289–300. [Google Scholar] [CrossRef]
- Taverna, S.D.; Ueberheide, B.M.; Liu, Y.; Tackett, A.J.; Diaz, R.L.; Shabanowitz, J.; Chait, B.T.; Hunt, D.F.; Allis, C.D. Long-distance combinatorial linkage between methylation and acetylation on histone H3 N termini. Proc. Natl. Acad. Sci. USA 2007, 104, 2086–2091. [Google Scholar] [CrossRef]
- El Kennani, S.; Crespo, M.; Govin, J.; Pflieger, D. Proteomic Analysis of Histone Variants and Their PTMs: Strategies and Pitfalls. Proteomes 2018, 6, 29. [Google Scholar] [CrossRef]
- Chiang, T.; Koss, B.; Su, L.; Washam, C.; Byrum, S.; Storey, A.; Tackett, A. Effect of sulforaphane and 5-aza-2’-deoxycytidine on melanoma cell growth. In NCBI: Gene Expression Omnibus; accession number GSE127252; 2019. Available online: https://www.ncbi.nlm.nih.gov/geo/query/acc.cgi?acc=GSE127252 (accessed on 26 June 2019).
- Parnaud, G.; Li, P.; Cassar, G.; Rouimi, P.; Tulliez, J.; Combaret, L.; Gamet-Payrastre, L. Mechanism of sulforaphane-induced cell cycle arrest and apoptosis in human colon cancer cells. Nutr. Cancer 2004, 48, 198–206. [Google Scholar] [CrossRef]
- Cheng, Y.M.; Tsai, C.C.; Hsu, Y.C. Sulforaphane, a Dietary Isothiocyanate, Induces G(2)/M Arrest in Cervical Cancer Cells through CyclinB1 Downregulation and GADD45beta/CDC2 Association. Int. J. Mol. Sci. 2016, 17, 1530. [Google Scholar] [CrossRef]
- Alcazar, O.; Achberger, S.; Aldrich, W.; Hu, Z.; Negrotto, S.; Saunthararajah, Y.; Triozzi, P. Epigenetic regulation by decitabine of melanoma differentiation in vitro and in vivo. Int. J. Cancer 2012, 131, 18–29. [Google Scholar] [CrossRef] [PubMed]
- Vijayaraghavalu, S.; Labhasetwar, V. Efficacy of decitabine-loaded nanogels in overcoming cancer drug resistance is mediated via sustained DNA methyltransferase 1 (DNMT1) depletion. Cancer Lett. 2013, 331, 122–129. [Google Scholar] [CrossRef] [PubMed]
- Park, S.L.; Justiniano, R.; Williams, J.D.; Cabello, C.M.; Qiao, S.; Wondrak, G.T. The Tryptophan-Derived Endogenous Aryl Hydrocarbon Receptor Ligand 6-Formylindolo[3,2-b]Carbazole Is a Nanomolar UVA Photosensitizer in Epidermal Keratinocytes. J. Investig. Derm. 2015, 135, 1649–1658. [Google Scholar] [CrossRef] [PubMed]
- Tran, T.T.; Schulman, J.; Fisher, D.E. UV and pigmentation: Molecular mechanisms and social controversies. Pigment Cell Melanoma Res. 2008, 21, 509–516. [Google Scholar] [CrossRef] [PubMed]
- Reichrath, J.; Rass, K. Ultraviolet damage, DNA repair and vitamin D in nonmelanoma skin cancer and in malignant melanoma: An update. Adv. Exp. Med. Biol. 2014, 810, 208–233. [Google Scholar] [PubMed]
- Loetscher, P.; Seitz, M.; Clark-Lewis, I.; Baggiolini, M.; Moser, B. Activation of NK cells by CC chemokines. Chemotaxis, Ca2+ mobilization, and enzyme release. J. Immunol. 1996, 156, 322–327. [Google Scholar] [PubMed]
- Sconocchia, G.; Arriga, R.; Tornillo, L.; Terracciano, L.; Ferrone, S.; Spagnoli, G.C. Melanoma cells inhibit NK cell functions. Cancer Res. 2012, 72, 5428–5429. [Google Scholar] [CrossRef]
- Mgrditchian, T.; Arakelian, T.; Paggetti, J.; Noman, M.Z.; Viry, E.; Moussay, E.; Van Moer, K.; Kreis, S.; Guerin, C.; Buart, S.; et al. Targeting autophagy inhibits melanoma growth by enhancing NK cells infiltration in a CCL5-dependent manner. Proc. Natl. Acad. Sci. USA 2017, 114, E9271–E9279. [Google Scholar] [CrossRef]
- Norris, S.; Coleman, A.; Kuri-Cervantes, L.; Bower, M.; Nelson, M.; Goodier, M.R. PD-1 expression on natural killer cells and CD8(+) T cells during chronic HIV-1 infection. Viral Immunol. 2012, 25, 329–332. [Google Scholar] [CrossRef]
- Stojanovic, A.; Fiegler, N.; Brunner-Weinzierl, M.; Cerwenka, A. CTLA-4 is expressed by activated mouse NK cells and inhibits NK Cell IFN-gamma production in response to mature dendritic cells. J. Immunol. 2014, 192, 4184–4191. [Google Scholar] [CrossRef]
- Noman, M.Z.; Berchem, G.; Janji, B. Targeting autophagy blocks melanoma growth by bringing natural killer cells to the tumor battlefield. Autophagy 2018, 14, 730–732. [Google Scholar] [CrossRef] [PubMed]
- Noman, M.Z.; Paggetti, J.; Moussay, E.; Berchem, G.; Janji, B. Driving Natural Killer cells toward the melanoma tumor battlefield: Autophagy as a valuable therapeutic target. Oncoimmunology 2018, 7, e1452583. [Google Scholar] [CrossRef] [PubMed]
- Bottcher, J.P.; Bonavita, E.; Chakravarty, P.; Blees, H.; Cabeza-Cabrerizo, M.; Sammicheli, S.; Rogers, N.C.; Sahai, E.; Zelenay, S.; Reis e Sousa, C. NK Cells Stimulate Recruitment of cDC1 into the Tumor Microenvironment Promoting Cancer Immune Control. Cell 2018, 172, 1022–1037. [Google Scholar] [CrossRef] [PubMed]
- Benvenuto-Andrade, C.; Oseitutu, A.; Agero, A.L.; Marghoob, A.A. Cutaneous melanoma: Surveillance of patients for recurrence and new primary melanomas. Derm. Ther. 2005, 18, 423–435. [Google Scholar] [CrossRef] [PubMed]
- Faries, M.B.; Steen, S.; Ye, X.; Sim, M.; Morton, D.L. Late recurrence in melanoma: Clinical implications of lost dormancy. J. Am. Coll. Surg. 2013, 217, 27–34. [Google Scholar] [CrossRef] [PubMed]


| Ccl5-Forward | ACCATATGGCTCGGACACCA |
| Ccl5-Reverse | TCTCTGGGTTGGCACACACTT |
| IL33-Forward | GGGGCTCACTGCAGGAAAGT |
| IL33-Reverse | ATTTTGCAAGGCGGGACCAG |
| Dusp15-Forward | TATCCACGAATCACCCCA |
| Dusp15-Reverse | AAGCAGTGCACAAGGCA |
| UBC-forward | GCCCAGTGTTACCACCAAGAGCC |
| UBC-Reverse | CCCATCACACCCAAGAACAGTT |
| Mouse Histones | |||||
|---|---|---|---|---|---|
| H10 | H1FOO | H2A2B | H2AX | H2B1H | H2B3B |
| H11 | H1T | H2A2C | H2AY | H2B1K | H31 |
| H12 | H2A1 | H2A3 | H2AZ | H2B1M | H32 |
| H13 | H2A1F | H2AB1 | H2B1A | H2B1P | H33 |
| H14 | H2A1H | H2AJ | H2B1B | H2B2B | H3C |
| H15 | H2A1K | H2AV | H2B1C | H2B2E | H4 |
| H1FNT | H2A2A | H2AW | H2B1F | H2B3A | |
© 2019 by the authors. Licensee MDPI, Basel, Switzerland. This article is an open access article distributed under the terms and conditions of the Creative Commons Attribution (CC BY) license (http://creativecommons.org/licenses/by/4.0/).
Share and Cite
Chiang, T.-c.; Koss, B.; Su, L.J.; Washam, C.L.; Byrum, S.D.; Storey, A.; Tackett, A.J. Effect of Sulforaphane and 5-Aza-2’-Deoxycytidine on Melanoma Cell Growth. Medicines 2019, 6, 71. https://doi.org/10.3390/medicines6030071
Chiang T-c, Koss B, Su LJ, Washam CL, Byrum SD, Storey A, Tackett AJ. Effect of Sulforaphane and 5-Aza-2’-Deoxycytidine on Melanoma Cell Growth. Medicines. 2019; 6(3):71. https://doi.org/10.3390/medicines6030071
Chicago/Turabian StyleChiang, Tung-chin, Brian Koss, L. Joseph Su, Charity L. Washam, Stephanie D. Byrum, Aaron Storey, and Alan J. Tackett. 2019. "Effect of Sulforaphane and 5-Aza-2’-Deoxycytidine on Melanoma Cell Growth" Medicines 6, no. 3: 71. https://doi.org/10.3390/medicines6030071
APA StyleChiang, T.-c., Koss, B., Su, L. J., Washam, C. L., Byrum, S. D., Storey, A., & Tackett, A. J. (2019). Effect of Sulforaphane and 5-Aza-2’-Deoxycytidine on Melanoma Cell Growth. Medicines, 6(3), 71. https://doi.org/10.3390/medicines6030071