
Direct Comparison of the Lowest Effect Concentrations of Mutagenic Reference Substances in Two Ames Test Formats

 ,
,  ,
,  and
and 
Abstract
: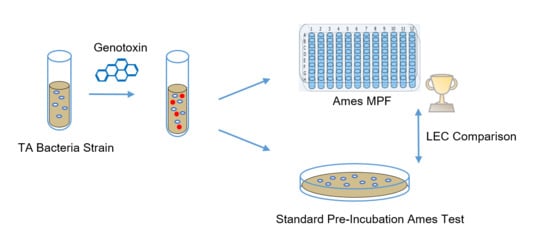
1. Introduction
1.1. Relevance for Packaging Safety Assessment
1.2. Ames Test Protocols and S9 Selection
2. Materials and Methods
2.1. Test Substances, Chemicals and Reagents
2.2. Test Strains and Pre-Culture
2.3. Metabolic Activation
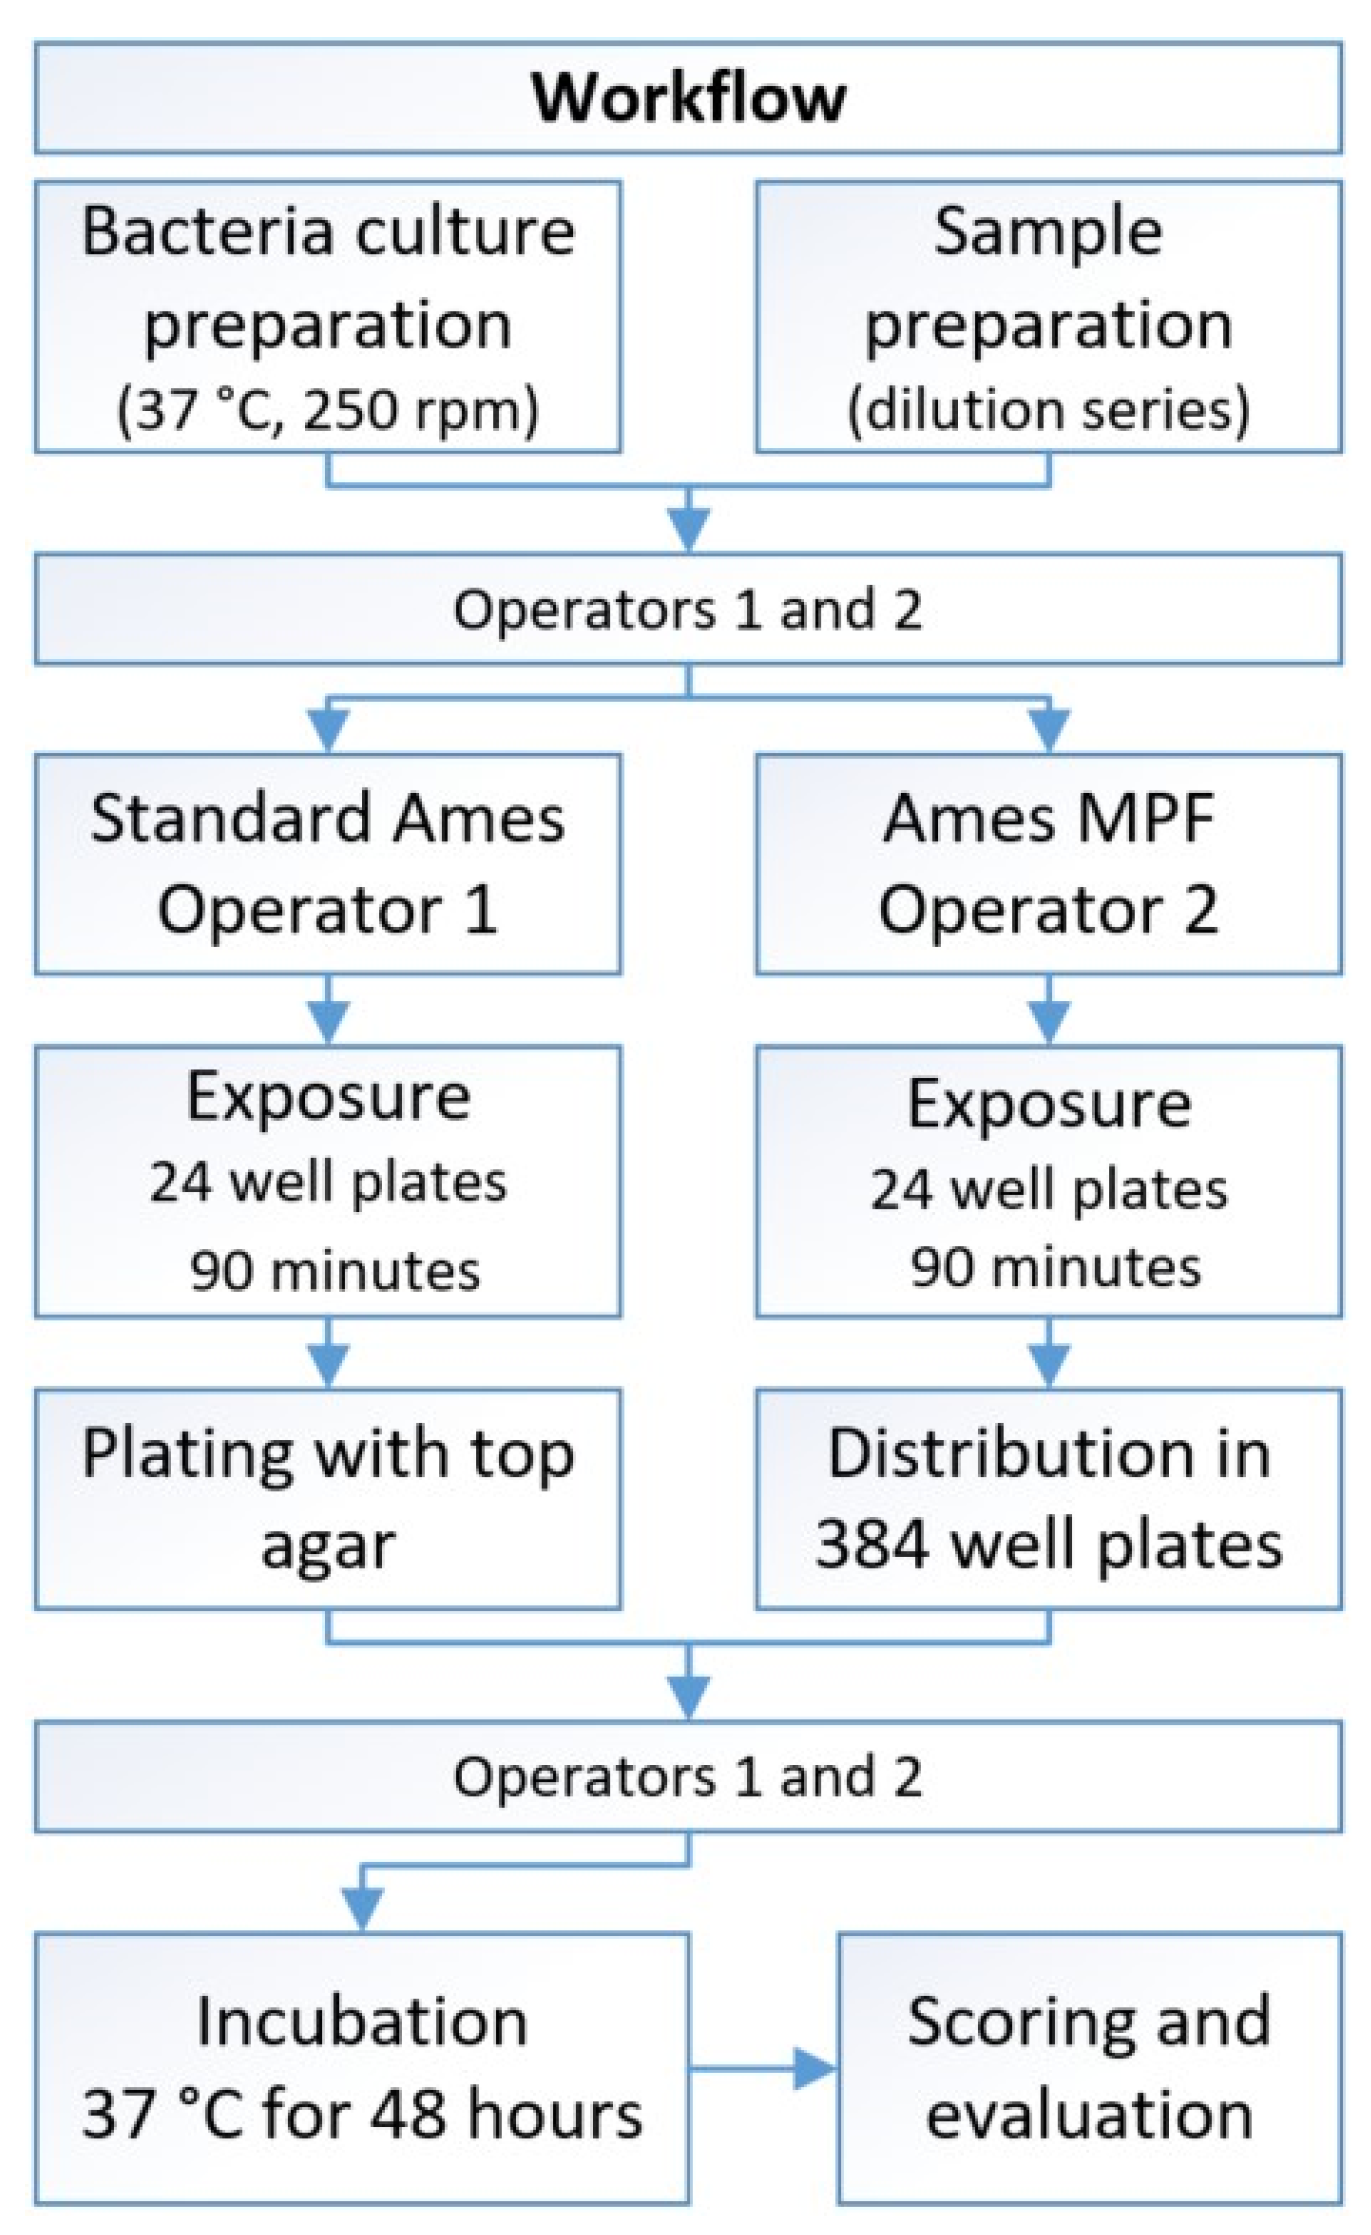
2.4. Test Conditions for the Direct Comparison
2.5. Ames MPF™ Test Protocol
2.6. Agar-Based Ames Test Protocol
2.7. Scoring Criteria and Interpretation
Statistical Analysis
3. Results
3.1. Concordance of the Assay Results
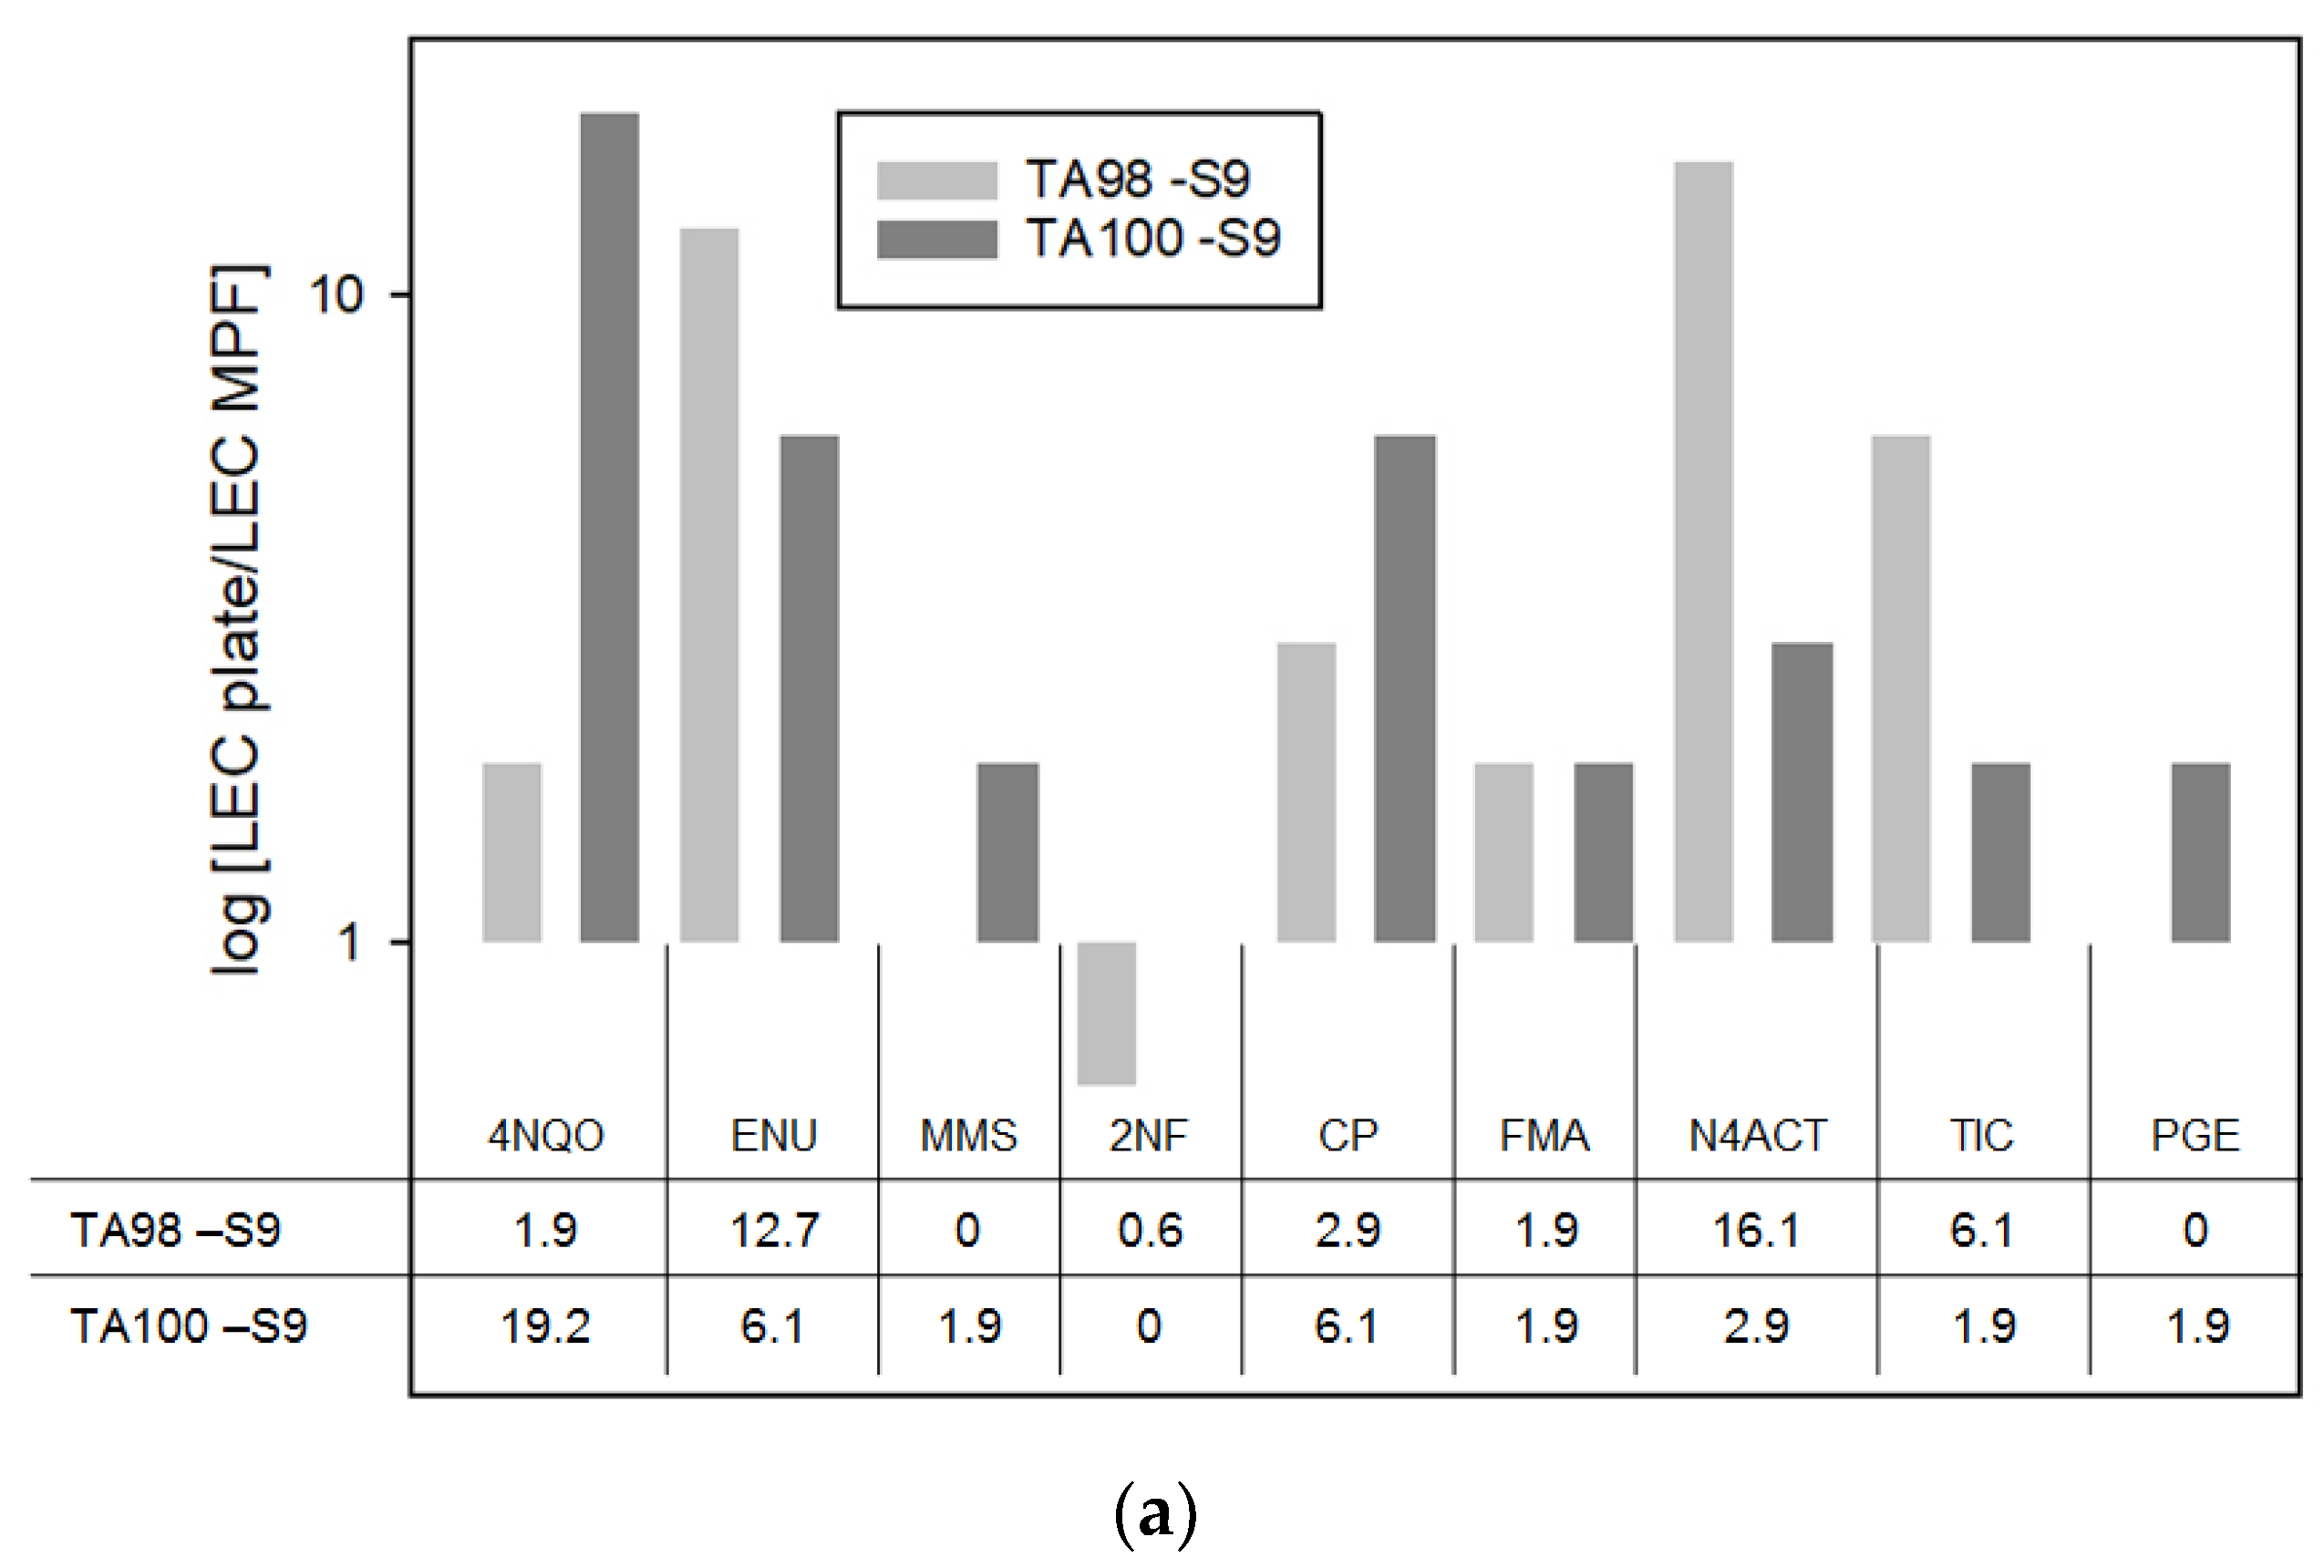
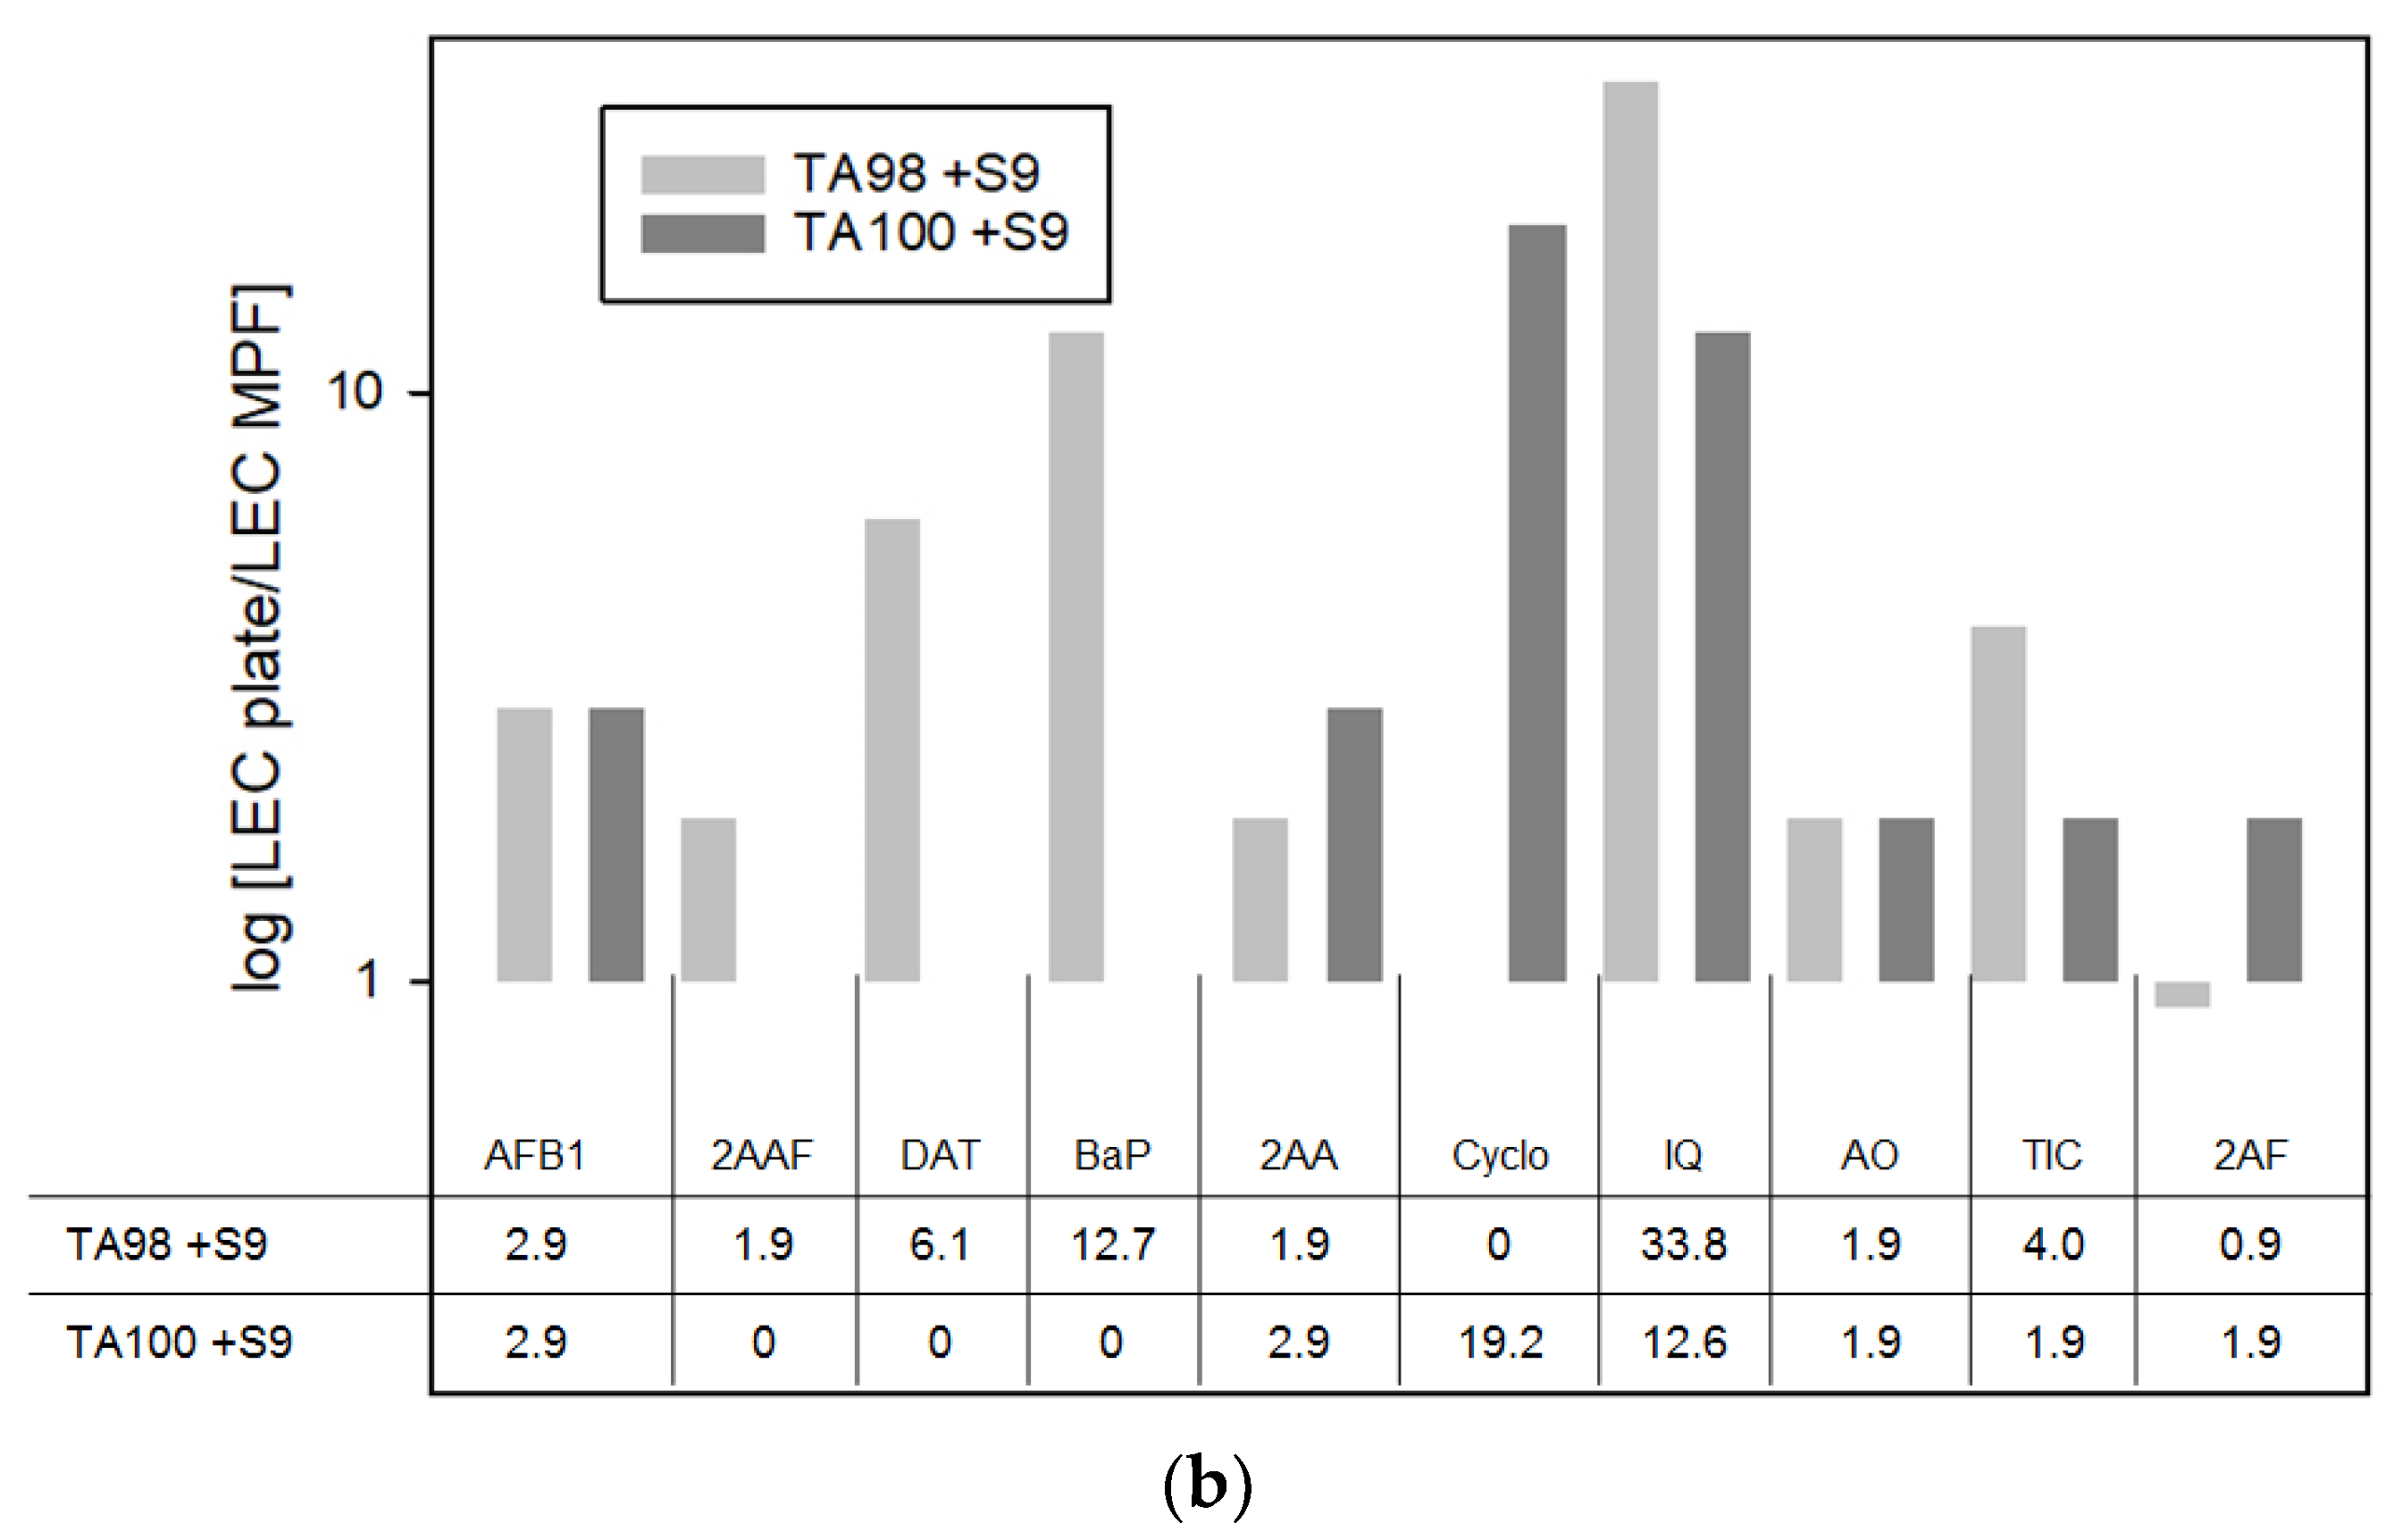
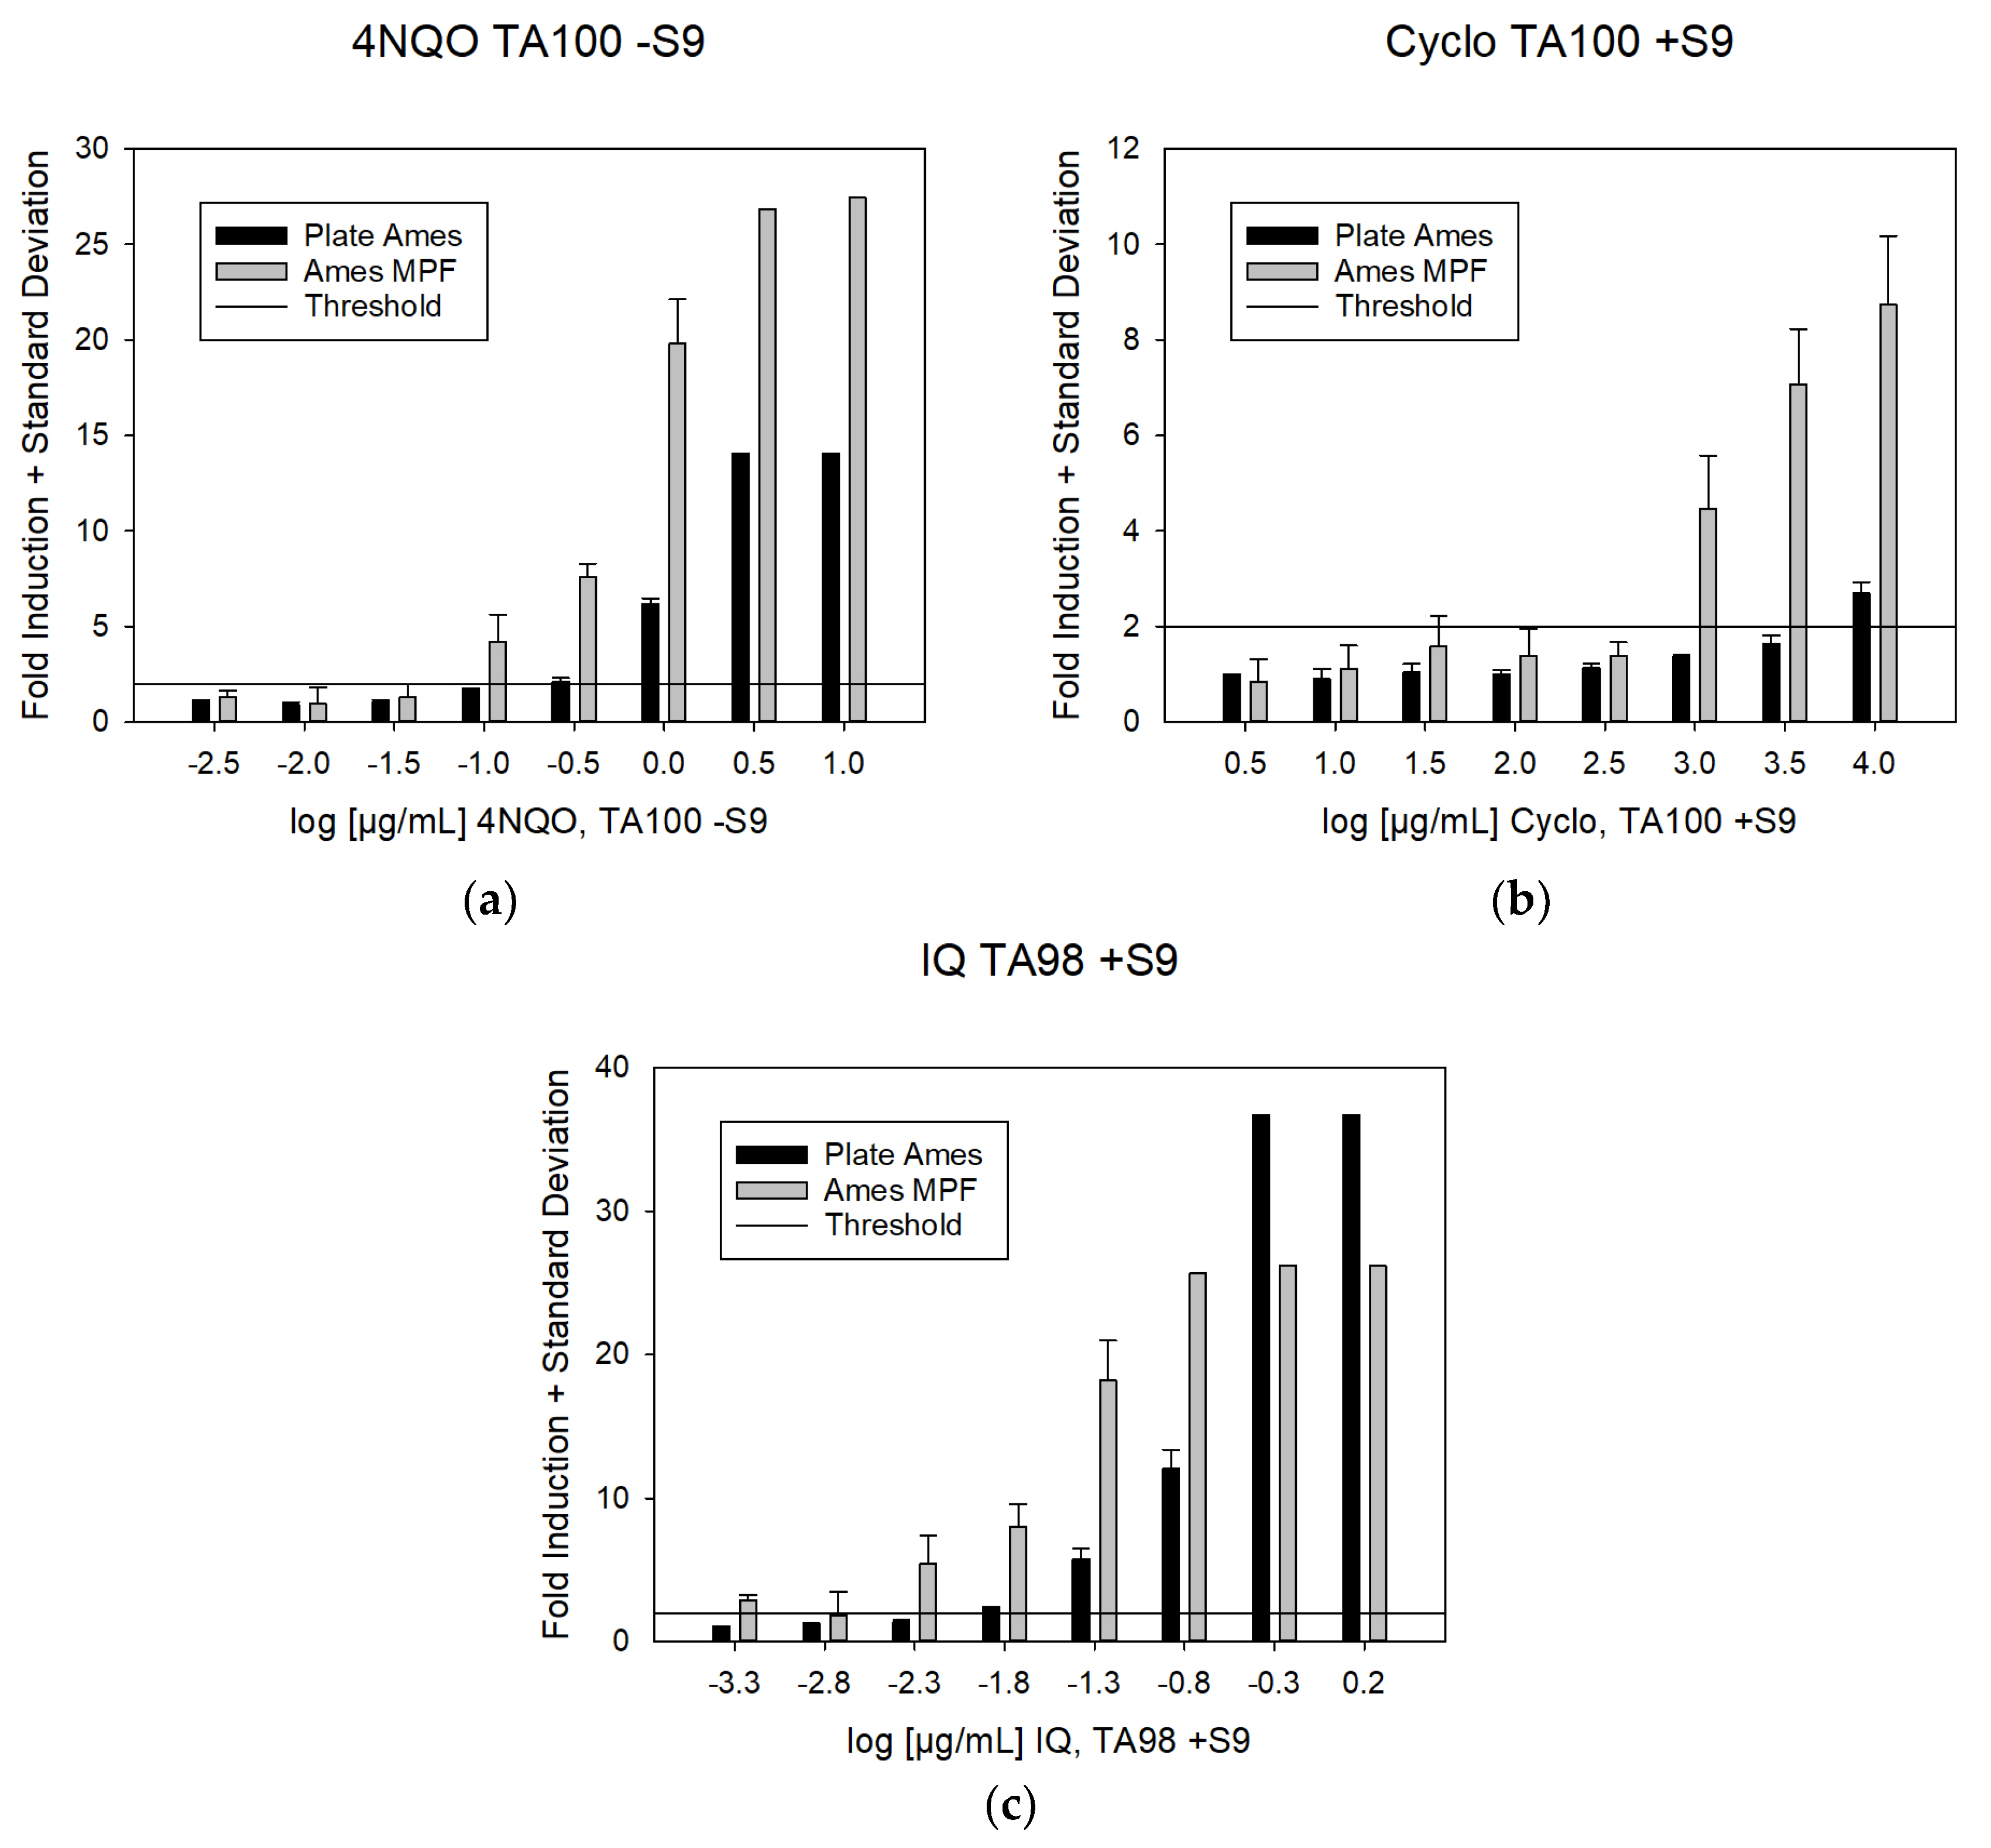
3.2. Direct LEC Comparisons
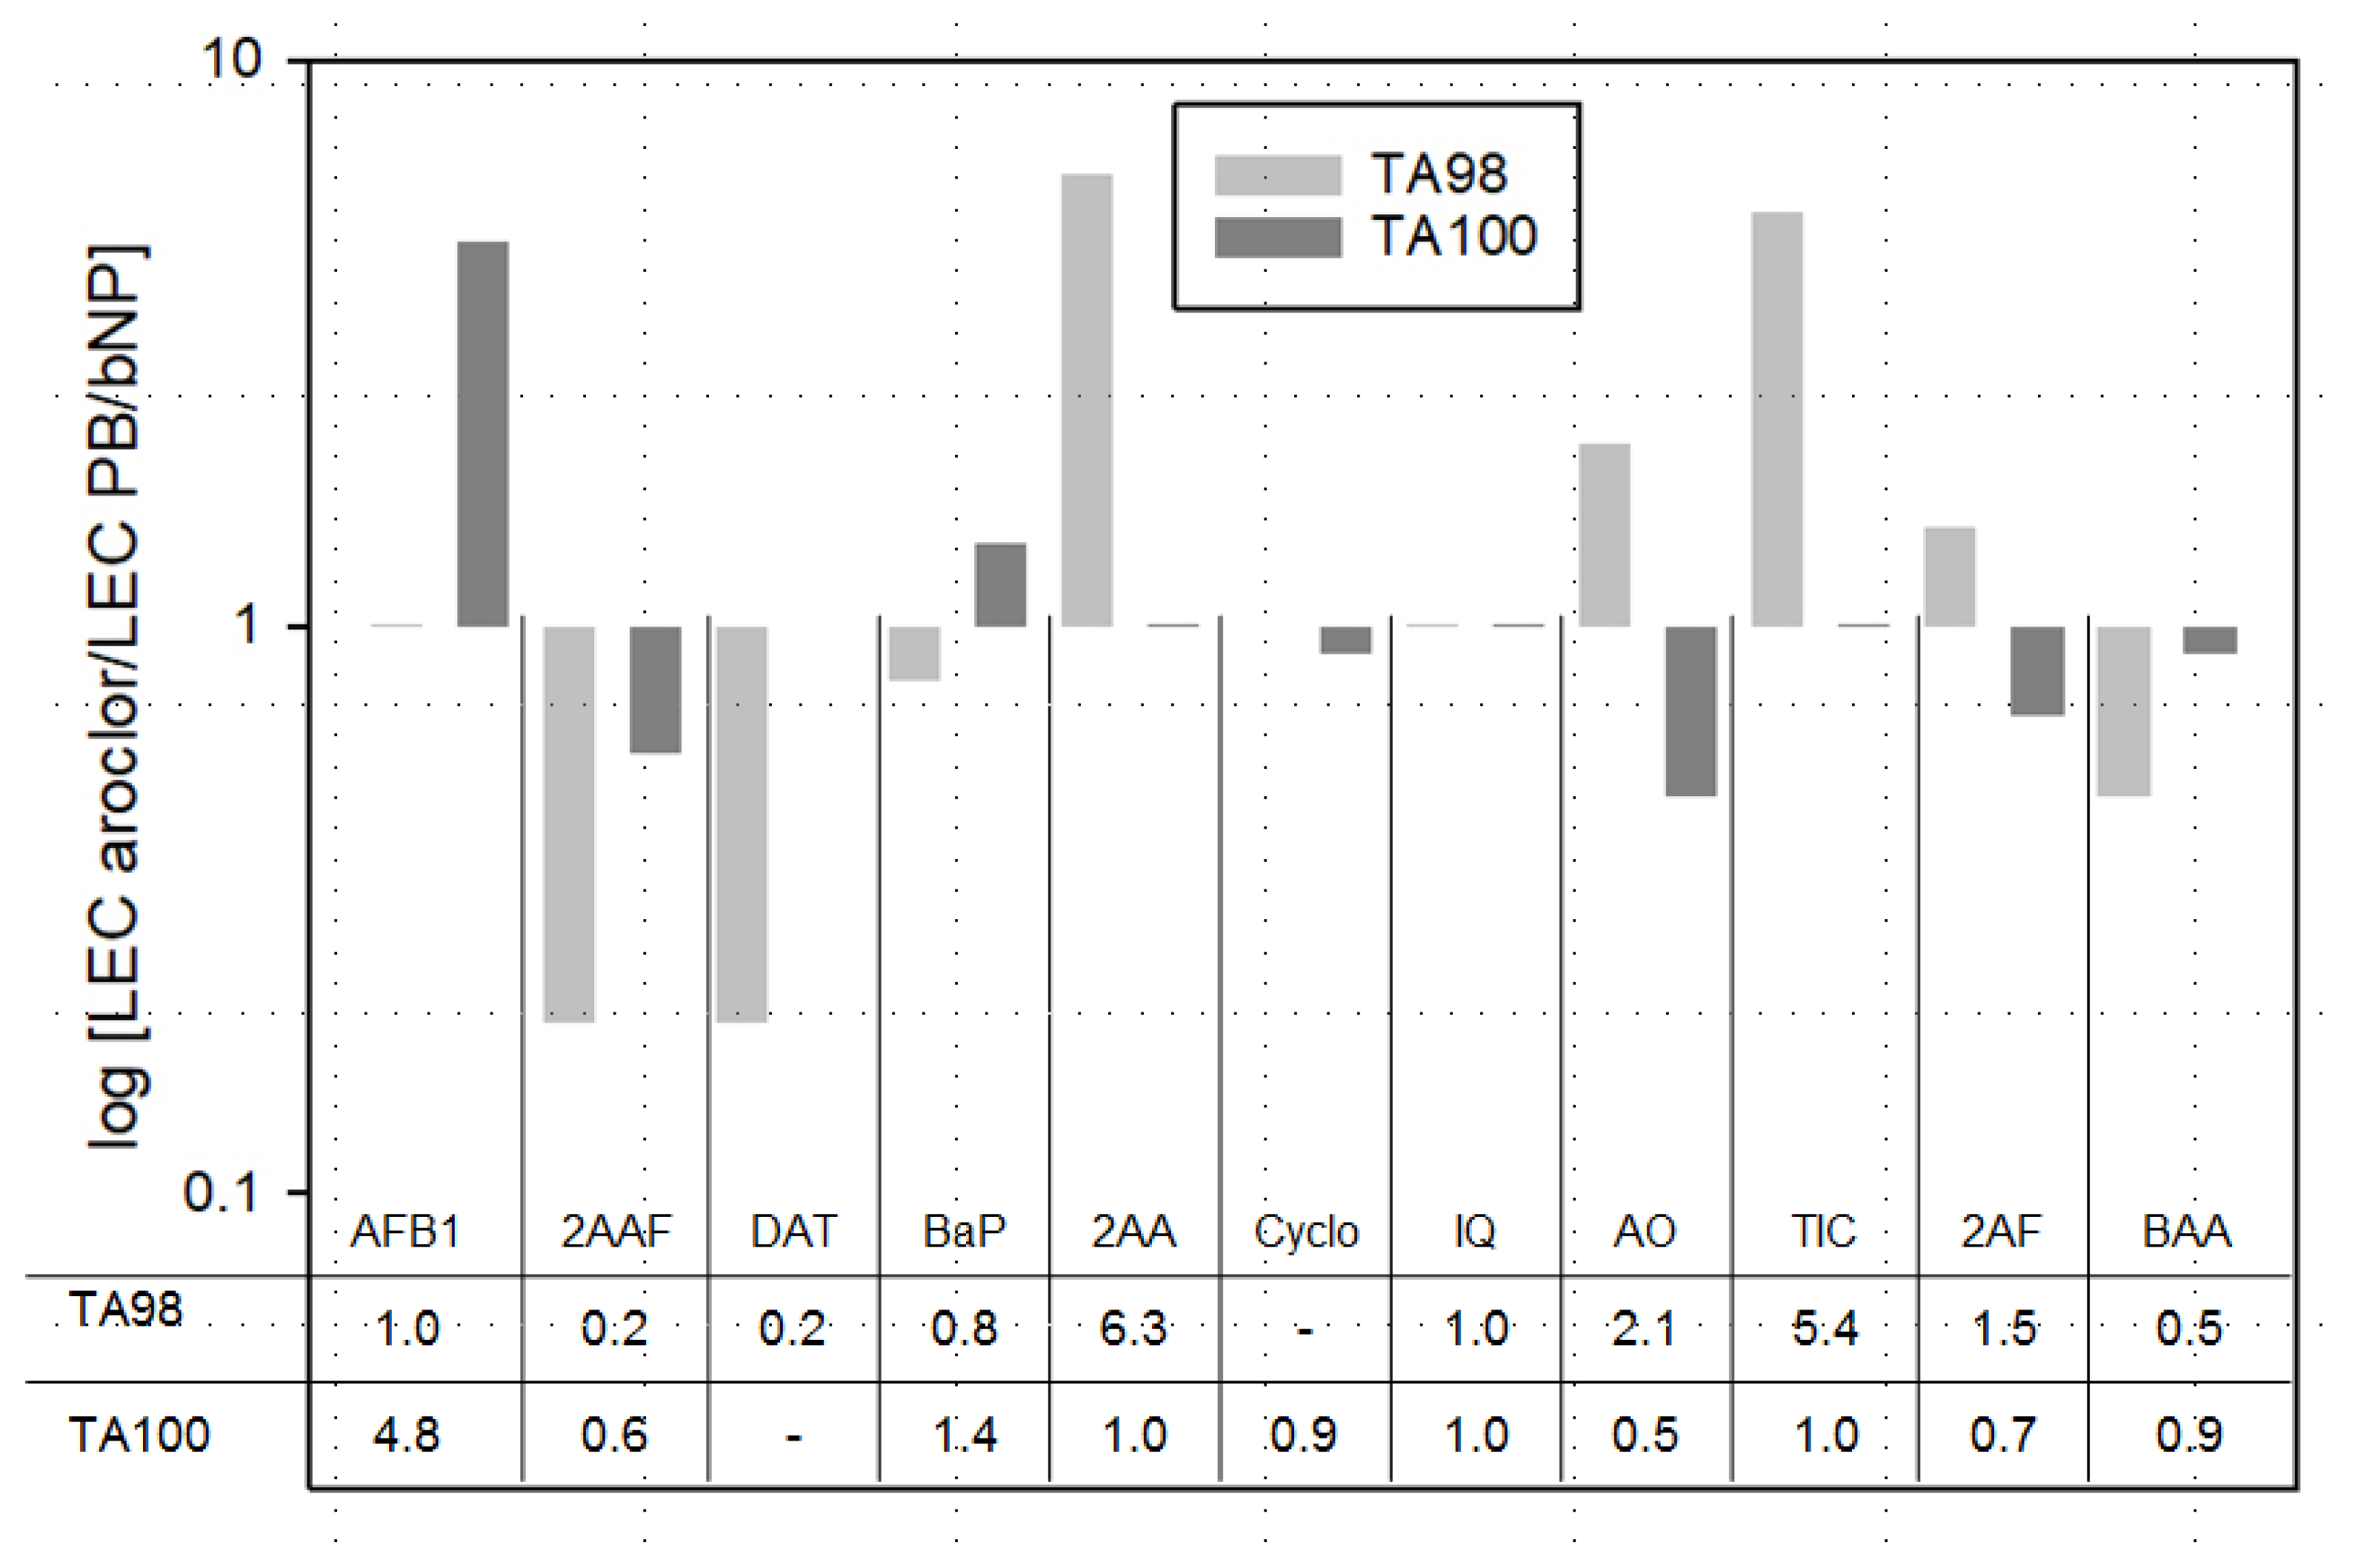
3.3. S9-Source Comparison
4. Discussion
4.1. Assay Concordance
4.2. LEC According to the Test Protocol
4.3. S9 Fraction Comparison
4.4. Implication for the LOBD
4.5. Practical Considerations
4.6. Relevance for FCM Safety Assessment
5. Conclusions
- According to the conditions and data analysis applied, the LEC values of the Ames MPF™ assay are significantly lower when compared to the LEC values obtained with the standard pre-incubation Petri-dish agar-based Ames protocol. This is expected to result in lower LOBDs for mutagens in complex mixtures.
- In addition to LEC values, the choice of assay protocol should be based on regulatory requirements as well as technical considerations such as availability of sample material and consumables required.
- The use of either Aroclor 1254-induced S9 or PB/β-NF-induced S9 has no major impact on LEC values.
- The assay protocols show a concordance of over 90% for the set of test chemicals that were chosen for this study.
- Safety assessment of packaging migrate material: Neither protocol can consistently detect DNA reactive substances at a concentration range of 0.15 µg/kg, a limit which is derived from the TTC concept for substances with alert for mutagenicity. More research is needed to achieve such low a level of detection.
Author Contributions
Funding
Institutional Review Board Statement
Informed Consent Statement
Data Availability Statement
Acknowledgments
Conflicts of Interest
Appendix A

| Strain TA98-Tests Run without Metabolic Activation (−S9) | ||||||||
| Substance | CAS | Run 1 [µg/mL] | Top Dose | Run 2 [µg/mL] | Top Dose | Factor | ||
| Plate | MPF | [µg/mL] | Plate | MPF | [µg/mL] | |||
| 4NQO | 56-57-5 | 0.08 | 0.04 | 10 | 0.08 | 0.04 | 10 | 1.9 |
| ENU | 759-73-9 | 487 | 25 | 20,000 | 154 | 25 | 20,000 | 12.7 |
| MMS | 66-27-3 | – | – | 10,000 | – | – | 10,000 | – |
| 2NF | 607-57-8 | 0.4 | 0.6 | 5000 | 0.4 | 0.6 | 500 | 0.6 |
| CP | 15663-27-1 | 12 | 2 | 5000 | 12 | 6 | 500 | 2.9 |
| FMA | 50-00-0 | 12 | 6 | 5000 | 4 | 2 | 5000 | 1.9 |
| SA | 26628-22-8 | – | – | 5000 | – | – | 25,000 | – |
| N4ACT | 57294-74-3 | 12 | 6 | 5000 | 122 | 2 | 5000 | 16.1 |
| Mel | 108-78-1 | – | – | 25,000 | – | – | 25,000 | – |
| TIC | 2451-62-9 | 192 | 10 | 25,000 | 61 | 32 | 7906 | 6.1 |
| PGE | 204-557-2 | – | – | 5000 | – | – | 5000 | – |
| Strain TA100-Tests Run without Metabolic Activation (−S9) | ||||||||
| Substance | CAS | Run 1 [µg/mL] | Top Dose | Run 2 [µg/mL] | Top Dose | Factor | ||
| Plate | MPF | [µg/mL] | Plate | MPF | [µg/mL] | |||
| 4NQO | 56-57-5 | 0.08 | 0.004 | 10 | 0.077 | 0.004 | 10 | 19.2 |
| ENU | 759-73-9 | 154 | 25 | 20,000 | 154 | 25 | 20,000 | 6.1 |
| MMS | 66-27-3 | 77 | 40 | 10,000 | 77 | 40 | 10,000 | 1.9 |
| 2NF | 607-57-8 | 12 | – | 5000 | 12 | – | 500 | – |
| CP | 15663-27-1 | 3.8 | 0.6 | 5000 | 12 | 2 | 500 | 6.1 |
| FMA | 50-00-0 | 12 | 6 | 5000 | 12 | 6 | 5000 | 1.9 |
| SA | 26628-22-8 | 0.38 | – | 5000 | 1.9 | – | 25,000 | – |
| N4ACT | 57294-74-3 | 0.012 | 0.006 | 5 | 0.012 | 0.002 | 5 | 2.9 |
| Mel | 108-78-1 | – | – | 25,000 | – | – | 25,000 | – |
| TIC | 2451-62-9 | 192 | 100 | 25,000 | 192 | 100 | 25,000 | 1.9 |
| PGE | 204-557-2 | 12 | 6 | 5000 | 12 | 6 | 5000 | 1.9 |
| Strain TA98-Tests Run with Metabolic Activation (+S9) | ||||||||
| Substance | CAS | Run 1 [µg/mL] | Top Dose | Run 2 [µg/mL] | Top Dose | Factor | ||
| Plate | MPF | [µg/mL] | Plate | MPF | [µg/mL] | |||
| AFB1 | 1162-65-8 | 0.0025 | 0.0004 | 10 | 0.0025 | 0.0013 | 1 | 2.9 |
| 2AAF | 53-96-3 | 0.38 | 0.2 | 500 | 0.38 | 0.20 | 500 | 1.9 |
| DAT | 95-80-7 | 77 | 40 | 10,000 | 243 | 13 | 10,000 | 6.1 |
| BaP | 50-32-8 | 1.2 | 0.2 | 5000 | 3.8 | 0.2 | 500 | 12.7 |
| 2AA | 613-13-8 | 0.024 | 0.013 | 10 | 0.024 | 0.013 | 10 | 1.9 |
| Cyclo | 6055-19-2 | – | – | 10,000 | – | – | 10,000 | – |
| IQ | 76180-96-6 | 0.0012 | 0.000019 | 15 | 0.00012 | 0.000019 | 0.15 | 33.8 |
| AO | 494-38-2 | 0.19 | 0.10 | 2500 | 0.19 | 0.10 | 250 | 1.9 |
| Mel | 108-78-1 | – | – | 25,000 | – | – | 7906 | – |
| TIC | 2451-62-9 | 61 | 32 | 25,000 | 192 | 32 | 7906 | 4.0 |
| 2AF | 153-78-6 | 0.038 | 0.020 | 50 | 0.038 | 0.063 | 50 | 0.9 |
| BAA | 56-55-3 | – | 6 | 5000 | – | 63 | 5000 | – |
| Strain TA100-Tests Run with Metabolic Activation (+S9) | ||||||||
| Substance | CAS | Run 1 [µg/mL] | Top Dose | Run 2 [µg/mL] | Top Dose | Factor | ||
| Plate | MPF | [µg/mL] | Plate | MPF | [µg/mL] | |||
| AFB1 | 1162-65-8 | 0.008 | 0.004 | 1 | 0.0077 | 0.0013 | 1 | 2.9 |
| 2AAF | 53-96-3 | – | 2 | 5000 | – | 2 | 5000 | – |
| DAT | 95-80-7 | – | – | 10,000 | – | – | 10,000 | |
| BaP | 50-32-8 | – | 0.64 | 5000 | – | 0.64 | 500 | – |
| 2AA | 613-13-8 | 0.24 | 0.13 | 10 | 0.24 | 0.04 | 10 | 2.9 |
| Cyclo | 6055-19-2 | 769 | 40 | 10,000 | 608 | 32 | 25,000 | 19.2 |
| IQ | 76180-96-6 | 0.036 | 0.006 | 15 | 0.115 | 0.006 | 15 | 12.6 |
| AO | 494-38-2 | 1.9 | 1.0 | 250 | 1.9 | 1.0 | 250 | 1.9 |
| Mel | 108-78-1 | – | – | 25,000 | – | – | 7906 | – |
| TIC | 2451-62-9 | 192 | 100 | 25,000 | 192 | 100 | 25,000 | 1.9 |
| 2AF | 153-78-6 | 0.385 | 0.632 | 50 | 1.2 | 0.2 | 50 | 1.9 |
| BAA | 56-55-3 | – | 2 | 5000 | – | 2 | 5000 | – |
| Strain TA98-Tests Run without Metabolic Activation (−S9) | ||||||||
| Substance | CAS | Run 1 [µg/mL] | Top Dose | Run 2 [µg/mL] | Top Dose | Factor | ||
| Plate | MPF | [µg/mL] | Plate | MPF | [µg/mL] | |||
| 4NQO | 56-57-5 | 1 | 1 | 10 | 1 | 1 | 10 | 1.0 |
| ENU | 759-73-9 | 6325 | 632.5 | 20,000 | 2000 | 632.5 | 20,000 | 6.6 |
| MMS | 66-27-3 | – | – | 10,000 | – | – | 10,000 | – |
| 2NF | 607-57-8 | 5 | 15.8 | 5000 | 5 | 15.8 | 500 | 0.3 |
| CP | 15663-27-1 | 158.1 | 50 | 5000 | 158.1 | 158.1 | 500 | 1.5 |
| FMA | 50-00-0 | 158.1 | 158.1 | 5000 | 50 | 50 | 5000 | 1.0 |
| SA | 26628-22-8 | – | – | 5000 | – | – | 25,000 | – |
| N4ACT | 57294-74-3 | 158.1 | 158.1 | 5000 | 1581.1 | 50 | 5000 | 8.4 |
| Mel | 108-78-1 | – | – | 25,000 | – | – | 25,000 | – |
| TIC | 2451-62-9 | 2500 | 250 | 25,000 | 791 | 791 | 7906 | 3.2 |
| PGE | 204-557-2 | – | – | 5000 | – | – | 5000 | – |
| Strain TA100-Tests Run without Metabolic Activation (−S9) | ||||||||
| Substance | CAS | Run 1 [µg/mL] | Top Dose | Run 2 [µg/mL] | Top Dose | Factor | ||
| Plate | MPF | [µg/mL] | Plate | MPF | [µg/mL] | |||
| 4NQO | 56-57-5 | 1 | 0.1 | 10 | 1 | 0.1 | 10 | 10.0 |
| ENU | 759-73-9 | 2000 | 632.5 | 20,000 | 2000 | 632.5 | 20,000 | 3.2 |
| MMS | 66-27-3 | 1000 | 1000 | 10,000 | 1000 | 1000 | 10,000 | 1.0 |
| 2NF | 607-57-8 | 158.1 | – | 5000 | 158.1 | – | 500 | – |
| CP | 15663-27-1 | 50 | 15.8 | 5000 | 158.1 | 50 | 500 | 3.2 |
| FMA | 50-00-0 | 158.1 | 158.1 | 5000 | 158.1 | 158.1 | 5000 | 1.0 |
| SA | 26628-22-8 | 5 | – | 5000 | 25 | – | 25,000 | – |
| N4ACT | 57294-74-3 | 0.158 | 0.158 | 5 | 0.158 | 0.05 | 5 | 1.5 |
| Mel | 108-78-1 | – | – | 25,000 | – | – | 25,000 | – |
| TIC | 2451-62-9 | 2500 | 2500 | 25,000 | 2500 | 2500 | 25,000 | 1.0 |
| PGE | 204-557-2 | 158.1 | 158.1 | 5000 | 158.1 | 158.1 | 5000 | 1.0 |
| Strain TA98-Tests Run with Metabolic Activation (+S9) | ||||||||
| Substance | CAS | Run 1 [µg/mL] | Top Dose | Run 2 [µg/mL] | Top Dose | Factor | ||
| Plate | MPF | [µg/mL] | Plate | MPF | [µg/mL] | |||
| AFB1 | 1162-65-8 | 0.032 | 0.01 | 10 | 0.032 | 0.032 | 1 | 1.5 |
| 2AAF | 53-96-3 | 5 | 5 | 500 | 5 | 5 | 500 | 1.0 |
| DAT | 95-80-7 | 1000 | 1000 | 10,000 | 3162 | 316 | 10,000 | 3.2 |
| BaP | 50-32-8 | 15.8 | 5 | 5000 | 50 | 5 | 500 | 6.6 |
| 2AA | 613-13-8 | 0.316 | 0.316 | 10 | 0.316 | 0.316 | 10 | 1.0 |
| Cyclo | 6055-19-2 | – | – | 10,000 | – | – | 10,000 | – |
| IQ | 76180-96-6 | 0.015 | 0.00047 | 15 | 0.0015 | 0.00047 | 0.15 | 17.6 |
| AO | 494-38-2 | 2.5 | 2.5 | 2500 | 2.5 | 2.5 | 250 | 1.0 |
| Mel | 108-78-1 | – | – | 25,000 | – | – | 7906 | – |
| TIC | 2451-62-9 | 791 | 791 | 25,000 | 2500 | 791 | 7906 | 2.1 |
| 2AF | 153-78-6 | 0.5 | 0.5 | 50 | 0.5 | 1.581 | 50 | 0.5 |
| BAA | 56-55-3 | – | 158.1 | 5000 | – | 1581.1 | 5000 | – |
| Strain TA100-Tests Run with Metabolic Activation (+S9) | ||||||||
| Substance | CAS | Run 1 [µg/mL] | Top Dose | Run 2 [µg/mL] | Top Dose | Factor | ||
| Plate | MPF | [µg/mL] | Plate | MPF | [µg/mL] | |||
| AFB1 | 1162-65-8 | 0.1 | 0.1 | 1 | 0.1 | 0.032 | 1 | 1.5 |
| 2AAF | 53-96-3 | – | 50 | 5000 | – | 50 | 5000 | – |
| DAT | 95-80-7 | – | – | 10,000 | – | – | 10,000 | – |
| BaP | 50-32-8 | – | 16 | 5000 | – | 16 | 500 | – |
| 2AA | 613-13-8 | 3.162 | 3.162 | 10 | 3.162 | 1 | 10 | 1.5 |
| Cyclo | 6055-19-2 | 10,000 | 1000 | 10,000 | 7906 | 791 | 25,000 | 10.0 |
| IQ | 76180-96-6 | 0.47 | 0.15 | 15 | 1.5 | 0.15 | 15 | 6.6 |
| AO | 494-38-2 | 25 | 25 | 250 | 25 | 25 | 250 | 1.0 |
| Mel | 108-78-1 | – | – | 25,000 | – | – | 7906 | – |
| TIC | 2451-62-9 | 2500 | 2500 | 25,000 | 2500 | 2500 | 25,000 | 1.0 |
| 2AF | 153-78-6 | 5 | 15.811 | 50 | 15.811 | 5 | 50 | 1.0 |
| BAA | 56-55-3 | – | 50 | 5000 | – | 50 | 5000 | – |
| TA98 | ||||||
| Substance | CAS | Arclor 1254 LEC [µg/mL] | PB/ßNF LEC [µg/mL] | Factor | ||
| Run 1 | Run 2 | Run 1 | Run 2 | |||
| AFB1 | 1162-65-8 | 0.0013 | 0.0004 | 0.0004 | 0.0013 | 1.0 |
| 2AAF | 53-96-3 | 0.06 | 0.03 | 0.20 | 0.20 | 0.2 |
| DAT | 95-80-7 | 8 | 25 | 126 | 13 | 0.2 |
| BaP | 50-32-8 | 0.20 | 0.12 | 0.20 | 0.20 | 0.8 |
| 2AA | 613-13-8 | 0.12 | 0.04 | 0.013 | 0.013 | 6.3 |
| IQ | 76180-96-6 | 0.000019 | 0.000019 | 0.000019 | 0.000019 | 1.0 |
| AO | 494-38-2 | 0.1 | 0.3 | 0.1 | 0.1 | 2.1 |
| TIC | 2451-62-9 | 316 | 25 | 32 | 32 | 5.4 |
| 2AF | 153-78-6 | 0.06 | 0.06 | 0.02 | 0.06 | 1.5 |
| BAA | 56-55-3 | 20 | 13 | 6 | 63 | 0.5 |
| TA 100 | ||||||
| Substance | CAS | Arclor 1254 LEC [µg/mL] | PB/ßNF LEC [µg/mL] | Factor | ||
| Run 1 | Run 2 | Run 1 | Run 2 | |||
| AFB1 | 1162-65-8 | 0.013 | 0.013 | 0.004 | 0.001 | 4.8 |
| 2AAF | 53-96-3 | 0.25 | 2.00 | 2 | 2 | 0.6 |
| BaP | 50-32-8 | 1.0 | 0.2 | 0.6 | 0.6 | 0.9 |
| 2AA | 613-13-8 | 0.13 | 0.31 | 0.13 | 0.04 | 2.6 |
| Cyclo | 6055-19-2 | 32 | 100 | 40 | 32 | 1.8 |
| IQ | 76180-96-6 | 0.006 | 0.006 | 0.006 | 0.006 | 1.0 |
| AO | 494-38-2 | 0.32 | 0.32 | 1 | 1 | 0.3 |
| TIC | 2451-62-9 | 100 | 100 | 100 | 100 | 1.0 |
| 2AF | 153-78-6 | 0.2 | 0.6 | 0.6 | 0.2 | 1.0 |
| BAA | 56-55-3 | 1.6 | 1.6 | 2 | 2 | 0.8 |
References
- EFSA. Recent developments in the risk assessment of chemicals in food and their potential impact on the safety assessment of substances used in food contact materials. EFSA J. 2016, 14, 4357. [Google Scholar] [CrossRef]
- Claxton, L.D.; Umbuzeiro, G.d.A.; DeMarini, D.M. The Salmonella mutagenicity assay: The stethoscope of genetic toxicology for the 21st century. Environ. Health Perspect. 2010, 118, 1515–1522. [Google Scholar] [CrossRef] [Green Version]
- Umbuzeiro, G.d.A.; Rech, C.M.; Correia, S.; Bergamasco, A.M.; Cardenette, G.H.L.; Flückiger-Isler, S.; Kamber, M. Comparison of the Salmonella/microsome microsuspension assay with the new microplate fluctuation protocol for testing the mutagenicity of environmental samples. Environ. Mol. Mutagen. 2010, 51, 31–38. [Google Scholar] [CrossRef] [PubMed]
- Verschaeve, L. Genotoxicity studies in groundwater, surface waters, and contaminated soil. Sci. World J. 2002, 2, 1247–1253. [Google Scholar] [CrossRef] [PubMed]
- Reifferscheid, G.; Maes, H.M.; Allner, B.; Badurova, J.; Belkin, S.; Bluhm, K.; Brauer, F.; Bressling, J.; Domeneghetti, S.; Elad, T.; et al. International round-robin study on the Ames fluctuation test. Environ. Mol. Mutagen. 2012, 53, 185–197. [Google Scholar] [CrossRef] [PubMed]
- ICH. ICH Assessment and Control of DNA Reactive (Mutagenic) Impurities in Pharmaceuticals to Limit Potential Potential Carcinogenic Risk: ICH M7; ICH: Geneva, Switzerland, 2014. [Google Scholar]
- Escobar, P.A.; Kemper, R.A.; Tarca, J.; Nicolette, J.; Kenyon, M.; Glowienke, S.; Sawant, S.G.; Christensen, J.; Johnson, T.E.; McKnight, C.; et al. Bacterial mutagenicity screening in the pharmaceutical industry. Mutat. Res. 2013, 752, 99–118. [Google Scholar] [CrossRef] [PubMed]
- International Organization for Standardization. ISO10993-3. Biological Evaluation of Medical Devices—Part 3: Tests for Genotoxicity, Carcinogenicity and Reproductive Toxicity; International Organization for Standardization: Geneva, Switzerland, 2003. [Google Scholar]
- EFSA Scientific Committee. Scientific opinion on genotoxicity testing strategies applicable to food and feed safety assessment. EFSA J. 2011, 9, 2379. [Google Scholar] [CrossRef]
- Schilter, B.; Burnett, K.; Eskes, C.; Geurts, L.; Jacquet, M.; Kirchnawy, C.; Oldring, P.; Pieper, G.; Pinter, E.; Tacker, M.; et al. Value and limitation of in vitro bioassays to support the application of the threshold of toxicological concern to prioritise unidentified chemicals in food contact materials. Food Addit. Contam. Part A Chem. Anal. Control Expo. Risk Assess. 2019, 36, 1903–1936. [Google Scholar] [CrossRef] [PubMed]
- Bolognesi, C.; Castoldi, A.F.; Crebelli, R.; Barthélémy, E.; Maurici, D.; Wölfle, D.; Volk, K.; Castle, L. Genotoxicity testing approaches for the safety assessment of substances used in food contact materials prior to their authorization in the European Union. Environ. Mol. Mutagen. 2017, 58, 361–374. [Google Scholar] [CrossRef] [PubMed]
- Sponchiado, G.; Adam, M.L.; Silva, C.D.; Soley, B.S.; de Mello-Sampayo, C.; Cabrini, D.A.; Correr, C.J.; Otuki, M.F. Quantitative genotoxicity assays for analysis of medicinal plants: A systematic review. J. Ethnopharmacol. 2016, 178, 289–296. [Google Scholar] [CrossRef] [PubMed]
- Mackerer, C.R.; Griffis, L.C.; Grabowski, J.S.; Reitman, F.A. Petroleum mineral oil refining and evaluation of cancer hazard. Appl. Occup. Environ. Hyg. 2003, 18, 890–901. [Google Scholar] [CrossRef]
- Rainer, B.; Pinter, E.; Czerny, T.; Riegel, E.; Kirchnawy, C.; Marin-Kuan, M.; Schilter, B.; Tacker, M. Suitability of the Ames test to characterise genotoxicity of food contact material migrate. Food Addit. Contam. Part A Chem. Anal. Control Expo. Risk Assess. 2018, 1–14. [Google Scholar] [CrossRef] [PubMed]
- Rainer, B.; Mayrhofer, E.; Redl, M.; Dolak, I.; Mislivececk, D.; Czerny, T.; Kirchnawy, C.; Marin-Kuan, M.; Schilter, B.; Tacker, M. Mutagenicity assessment of food contact material migrates with the Ames MPF assay. Food Addit. Contam. Part A Chem. Anal. Control Expo. Risk Assess. 2019, 36, 1419–1432. [Google Scholar] [CrossRef]
- Pinter, E.; Rainer, B.; Czerny, T.; Riegel, E.; Schilter, B.; Marin-Kuan, M.; Tacker, M. Evaluation of the Suitability of Mammalian In Vitro Assays to Assess the Genotoxic Potential of Food Contact Materials. Foods 2020, 9, 237. [Google Scholar] [CrossRef] [PubMed] [Green Version]
- Timm, M.; Saaby, L.; Moesby, L.; Hansen, E.W. Considerations regarding use of solvents in in vitro cell based assays. Cytotechnology 2013, 65, 887–894. [Google Scholar] [CrossRef] [PubMed] [Green Version]
- Hakura, A.; Mochida, H.; Yamatsu, K. Dimethyl sulfoxide (DMSO) is mutagenic for bacterial mutagenicity tester strains. Mutat. Res. Lett. 1993, 303, 127–133. [Google Scholar] [CrossRef]
- OECD. OECD Guideline for Testing of Chemicals, Bacterial Reverse Mutation Test; OECD 471; OECD: Paris, France, 2020. [Google Scholar]
- Diehl, M.S.; Willaby, S.L.; Snyder, R.D. Comparison of the results of a modified miniscreen and the standard bacterial reverse mutation assays. Environ. Mol. Mutagen. 2000, 36, 72–77. [Google Scholar] [CrossRef]
- Flückiger-Isler, S.; Baumeister, M.; Braun, K.; Gervais, V.; Hasler-Nguyen, N.; Reimann, R.; van Gompel, J.; Wunderlich, H.-G.; Engelhardt, G. Assessment of the performance of the Ames II assay: A collaborative study with 19 coded compounds. Mutat. Res. 2004, 558, 181–197. [Google Scholar] [CrossRef] [PubMed] [Green Version]
- Miller, J.E.; Vlasakova, K.; Glaab, W.E.; Skopek, T.R. A low volume, high-throughput forward mutation assay in Salmonella typhimurium based on fluorouracil resistance. Mutat. Res. 2005, 578, 210–224. [Google Scholar] [CrossRef] [PubMed]
- Aubrecht, J.; Osowski, J.J.; Persaud, P.; Cheung, J.R.; Ackerman, J.; Lopes, S.H.; Ku, W.W. Bioluminescent Salmonella reverse mutation assay: A screen for detecting mutagenicity with high throughput attributes. Mutagenesis 2007, 22, 335–342. [Google Scholar] [CrossRef] [Green Version]
- Flückiger-Isler, S.; Kamber, M. Direct comparison of the Ames microplate format (MPF) test in liquid medium with the standard Ames pre-incubation assay on agar plates by use of equivocal to weakly positive test compounds. Mutat. Res. 2012, 747, 36–45. [Google Scholar] [CrossRef]
- Proudlock, R.; Evans, K. The micro-Ames test: A direct comparison of the performance and sensitivities of the standard and 24-well plate versions of the bacterial mutation test. Environ. Mol. Mutagen. 2016, 57, 687–705. [Google Scholar] [CrossRef]
- Kauffmann, K.; Werner, F.; Deitert, A.; Finklenburg, J.; Brendt, J.; Schiwy, A.; Hollert, H.; Büchs, J. Optimization of the Ames RAMOS test allows for a reproducible high-throughput mutagenicity test. Sci. Total Environ. 2020, 717, 137168. [Google Scholar] [CrossRef]
- Chandrasekaran, C.V.; Sundarajan, K.; David, K.; Agarwal, A. In vitro efficacy and safety of poly-herbal formulations. Toxicol. In Vitro 2010, 24, 885–897. [Google Scholar] [CrossRef]
- Spiliotopoulos, D.; Koelbert, C. Assessment of the miniaturized liquid Ames microplate format (MPF™) for a selection of the test items from the recommended list of genotoxic and non-genotoxic chemicals. Mutat. Res. 2020, 856–857, 503218. [Google Scholar] [CrossRef]
- National Oceanic and Atmospheric Administration. What Are PCBs? Available online: https://oceanservice.noaa.gov/facts/pcbs.html (accessed on 22 April 2021).
- Kirkland, D.; Kasper, P.; Martus, H.-J.; Müller, L.; van Benthem, J.; Madia, F.; Corvi, R. Updated recommended lists of genotoxic and non-genotoxic chemicals for assessment of the performance of new or improved genotoxicity tests. Mutat. Res. Genet. Toxicol. Environ. Mutagen. 2016, 795, 7–30. [Google Scholar] [CrossRef] [PubMed]
- Proudlock, R. (Ed.) Genetic Toxicology Testing: A Laboratory Manual; Elsevier: London, UK, 2016. [Google Scholar]
- Veres, Z.; Török, G.; Tóth, E.; Vereczkey, L.; Jemnitz, K. The Spectrum of Enzymes Involved in Activation of 2-Aminoanthracene Varies with the Metabolic System Applied. Mutat. Res. 2005, 586, 18–27. [Google Scholar] [CrossRef] [PubMed]
- Feng, Y.; Jiang, W.; Hein, D.W. 2-Aminofluorene-DNA Adduct Levels in Tumor-Target and Nontargetorgans of Rapid and Slow Acetylator Syrian Hamsters Congenic at the NAT2 Locus. Toxicol. Appl. Pharmacol. 1996, 141, 248–255. [Google Scholar] [CrossRef]
- Beije, B.; Möller, L. 2-nitrofluorene and related compounds: Prevalence and biological effects. Mutat. Res./Rev. Genet. Toxicol. 1988, 196, 177–209. [Google Scholar] [CrossRef]
- Negishi, K.; Takahashi, M.; Yamashita, Y.; Nishizawa, M.; Hayatsu, H. Mutagenesis by N4-aminocytidine: Induction of AT to GC transition and its molecular mechanism. Biochemistry 1985, 24, 7273–7278. [Google Scholar] [CrossRef] [PubMed]
- Khan, S.; Al-Quirainy, F.; Anwar, F. Sodium azide: A chemical mutagen for enhancement of agronomic traits of crop plants. Environ. We Int. J. Sci. Technol. 2009, 2009, 1–21. [Google Scholar]
- Kawanishi, M.; Matsuda, T.; Yagi, T. Genotoxicity of formaldehyde: Molecular basis of DNA damage and mutation. Front. Environ. Sci. 2014, 2, 173. [Google Scholar] [CrossRef] [Green Version]
- Armstrong, R.W.; Kurucsev, T.; Strauss, U.P. The interaction between acridine dyes and deoxyribonucleic acid. J. Am. Chem. Soc. 1970, 92, 3174–3181. [Google Scholar] [CrossRef] [PubMed]
- Seike, K.; Murata, M.; Oikawa, S.; Hiraku, Y.; Hirakawa, K.; Kawanishi, S. Oxidative DNA damage induced by benzaanthracene metabolites via redox cycles of quinone and unique non-quinone. Chem. Res. Toxicol. 2003, 16, 1470–1476. [Google Scholar] [CrossRef]
- Winter, C.; Kerros, M.-E.; Weinbauer, M.G. Effects of sodium azide on the abundance of prokaryotes and viruses in marine samples. PLoS ONE 2012, 7, e37597. [Google Scholar] [CrossRef] [Green Version]
- Belser, W.L.; Shaffer, S.D.; Bliss, R.D.; Hynds, P.M.; Yamamoto, L.; Pitts, J.N.; Winer, J.A. A standardized procedure for quantification of the ames salmonella/mammalian-microsome mutagenicity test. Environ. Mutagen. 1981, 3, 123–139. [Google Scholar] [CrossRef]
- Zeiger, E.; Chhabra, R.S.; Margolin, B.H. Effects of the hepatic S9 fraction from aroclor-1254-treated rats on the mutagenicity of benzo[a]pyrene and 2-aminoanthracene in the salmonella/microsome assay. Mutat. Res. 1979, 64, 379–389. [Google Scholar] [CrossRef]
- Callander, R.D.; Mackay, J.M.; Clay, P.; Elcombe, C.R.; Elliott, B.M. Evaluation of phenobarbital/beta-naphthoflavone as an alternative S9-induction regime to Aroclor 1254 in the rat for use in in vitro genotoxicity assays. Mutagenesis 1995, 10, 517–522. [Google Scholar] [CrossRef] [PubMed]
- Brendt, J.; Crawford, S.E.; Velki, M.; Xiao, H.; Thalmann, B.; Hollert, H.; Schiwy, A. Is a liver comparable to a liver? A comparison of different rat-derived S9-fractions with a biotechnological animal-free alternative in the Ames fluctuation assay. Sci. Total Environ. 2021, 759, 143522. [Google Scholar] [CrossRef]
- Hakura, A.; Suzuki, S.; Sawada, S.; Sugihara, T.; Hori, Y.; Uchida, K.; Kerns, W.D.; Sagami, F.; Motooka, S.; Satoh, T. Use of human liver S9 in the Ames test: Assay of three procarcinogens using human S9 derived from multiple donors. Regul. Toxicol. Pharmacol. 2003, 37, 20–27. [Google Scholar] [CrossRef]
- Shao, Y.; Schiwy, A.; Glauch, L.; Henneberger, L.; König, M.; Mühlenbrink, M.; Xiao, H.; Thalmann, B.; Schlichting, R.; Hollert, H.; et al. Optimization of a pre-metabolization procedure using rat liver S9 and cell-extracted S9 in the Ames fluctuation test. Sci. Total Environ. 2020, 749, 141468. [Google Scholar] [CrossRef] [PubMed]
- ISO. ISO 11350:2012. Water Quality—Determination of the Genotoxicity of Water and Waste Water—Salmonella/Microsome Fluctuation Test (Ames Fluctuation Test); ISO: Geneva, Switzerland, 2012. [Google Scholar]
- Kroes, R.; Renwick, A.G.; Cheeseman, M.; Kleiner, J.; Mangelsdorf, I.; Piersma, A.; Schilter, B.; Schlatter, J.; van Schothorst, F.; Vos, J.G.; et al. Structure-based thresholds of toxicological concern (TTC): Guidance for application to substances present at low levels in the diet. Food Chem. Toxicol. 2004, 42, 65–83. [Google Scholar] [CrossRef] [PubMed]
- Meyer, D.; Marin-Kuan, M.; Debon, E.; Serrant, P.; Cottet-Fontannaz, C.; Schilter, B.; Morlock, G.E. Detection of low levels of genotoxic compounds in food contact materials using an alternative HPTLC-SOS-Umu-C assay. ALTEX Altern. Anim. Exp. 2020. [Google Scholar] [CrossRef]
- Shakibai, D.; Riegraf, C.; Moscovici, L.; Reifferscheid, G.; Buchinger, S.; Belkin, S. Coupling High-Performance Thin-Layer Chromatography with Bacterial Genotoxicity Bioreporters. Environ. Sci. Technol. 2019, 53, 6410–6419. [Google Scholar] [CrossRef] [PubMed]
- Stütz, L.; Leitner, P.; Schulz, W.; Winzenbacher, R. Identification of genotoxic transformation products by effect-directed analysis with high-performance thin-layer chromatography and non-target screening. J. Planar Chromatogr. Modern TLC 2019, 32, 173–182. [Google Scholar] [CrossRef]


| Chemical | Abbreviation | CAS No. | Purity [%] | Supplier | Selection Criteria/Mode of Action |
|---|---|---|---|---|---|
| 2,4-Diaminotoluene | DAT | 95-80-7 | 99.5 | SCB 1 | Aromatic amine, requires metabolic activation [29] |
| 2-Acetylaminofluorene | 2AAF | 53-96-3 | ≥98 | Sigma Aldrich | Hydroxylated by CYP1A2and then acetylated. Forms C8 adduct on guanine [29] |
| 2-Amino-3-methylimidazol[4,5-f]quinoline | IQ | 76180-96-6 | 98 | SCB 1 | Heterocyclic amine with potent genotoxicity, requires metabolic activation [29] |
| 4-Nitroquinoline 1-oxide | 4NQO | 56-57-5 | ≥98 | Sigma Aldrich | Alkylating agent, forms DNA adducts [29] |
| Aflatoxin B1 | AfB1 | 1162-65-8 | ≥98 | Fermentek | Activated by CYP3A4. Forms various adducts [29] |
| Benzo[a]pyrene | BaP | 50-32-8 | ≥96 | Sigma Aldrich | Requires metabolic activation (CYP 1A1, 1B1, epoxide hydrolase), forms bulky adduct [29] |
| Cisplatin | CP | 15663-27-1 | n.s. | Sigma Aldrich | Cross-linking agent [29] |
| Cyclophosphamide monohydrate | Cyclo | 6055-19-2 | ≥97 | SCB 1 | Requires metabolic activation (CYP2B6) [29] |
| Melamine | Mel | 108-78-1 | 99 | Sigma Aldrich | Ames negative, causes bladder and ureteral carcinomas [29] |
| Methyl methanesulfonate | MMS | 66-27-3 | 99 | Sigma Aldrich | Strong clastogen (N7 alkylation) [29] |
| N-ethyl-N-nitrosourea | NEU | 759-73-9 | 56 | SCB 1 | Strong gene mutagen (O6 alkylation) [29] |
| 2-Aminoanthracene | 2AA | 613-13-8 | 96 | Carl Roth | Positive control, activated mainly by CYP1A2, DNA binding [32] |
| 2-Aminofluorene | 2AF | 153-78-6 | 98 | Sigma Aldrich | Positive control, formation of C8-AF adducts [33] |
| 2-Nitrofluorene | 2NF | 607-57-8 | >99 | TCI 2 | Positive control, adduct formation [34] |
| N4-Aminocytidine | N4ACT | 57294-74-3 | ≥95 | SCB 1 | Positive control, DNA incorporation, AT to GC transition [35] |
| Sodium azide | SA | 26628-22-8 | ≥99.5 | Sigma Aldrich | Positive control, A.T to G.C base pair transition and transversion [36] |
| Formaldehyde | FM | 50-00-0 | 37 | SCB 1 | Volatile, N-hydroxymethyl mono-adducts on guanine, adenine and cytosine, N-methylene crosslinks [37] |
| Acridine Orange | AO | 494-38-2 | n.s. | SCB 1 | Strong coloring agent, DNA intercalation [38] |
| Benzo[a]anthracene | BAA | 56-55-3 | 99 | Sigma Aldrich | S9 Weak positive, adduct formation, oxidative DNA damage [39] |
| Phenylglycidyl ether | PGE | 204-557-2 | 99 | Sigma Aldrich | Packaging related [14] |
| Triglycidyl isocyanurate | TIC | 2451-62-9 | ≥98 | SCB 1 | Packaging related [14] |
| (a) | |||||
| Substance | CAS | Strain TA98 − S9 | Strain TA100 − S9 | ||
| [µg/mL] | [µg/mL] | ||||
| Plate | MPF | Plate | MPF | ||
| 4NQO | 56-57-5 | 0.08 | 0.04 | 0.08 | 0.004 |
| ENU | 759-73-9 | 320 | 25 | 154 | 25 |
| MMS | 66-27-3 | – | – | 77 | 40 |
| 2NF | 607-57-8 | 0.38 | 1 | 12 | – |
| CP | 15663-27-1 | 12 | 4 | 8 | 1 |
| FMA | 50-00-0 | 8 | 4 | 12 | 6 |
| SA | 26628-22-8 | – | – | 1.2 | – |
| N4ACT | 57294-74-3 | 67 | 4 | 0.012 | 0.0042 |
| Mel | 108-78-1 | – | – | – | – |
| TIC | 2451-62-9 | 127 | 21 | 192 | 100 |
| PGE | 204-557-2 | – | – | 12 | 6 |
| (b) | |||||
| Substance | CAS | Strain TA98 + S9 | Strain TA100 + S9 | ||
| [µg/mL] | [µg/mL] | ||||
| Plate | MPF | Plate | MPF | ||
| AFB1 | 1162-65-8 | 0.0025 | 0.0008 | 0.0077 | 0.0026 |
| 2AAF | 53-96-3 | 0.38 | 0.2 | – | 2 |
| DAT | 95-80-7 | 160 | 26 | – | – |
| BaP | 50-32-8 | 3 | 0.2 | – | 0.64 |
| 2AA | 613-13-8 | 0.02 | 0.01 | 0.2 | 0.1 |
| Cyclo | 6055-19-2 | – | – | 689 | 36 |
| IQ | 76180-96-6 | 0.001 | 0.00002 | 0.08 | 0.006 |
| AO | 494-38-2 | 0.19 | 0.1 | 1.92 | 1 |
| Mel | 108-78-1 | – | – | – | – |
| TIC | 2451-62-9 | 127 | 31.6 | 192 | 100 |
| 2AF | 153-78-6 | 0.038 | 0 | 0.8 | 0.4 |
| BAA | 56-55-3 | – | 35 | – | 2 |
Publisher’s Note: MDPI stays neutral with regard to jurisdictional claims in published maps and institutional affiliations. |
© 2021 by the authors. Licensee MDPI, Basel, Switzerland. This article is an open access article distributed under the terms and conditions of the Creative Commons Attribution (CC BY) license (https://creativecommons.org/licenses/by/4.0/).
Share and Cite
Rainer, B.; Pinter, E.; Prielinger, L.; Coppola, C.; Marin-Kuan, M.; Schilter, B.; Apprich, S.; Tacker, M. Direct Comparison of the Lowest Effect Concentrations of Mutagenic Reference Substances in Two Ames Test Formats. Toxics 2021, 9, 152. https://doi.org/10.3390/toxics9070152
Rainer B, Pinter E, Prielinger L, Coppola C, Marin-Kuan M, Schilter B, Apprich S, Tacker M. Direct Comparison of the Lowest Effect Concentrations of Mutagenic Reference Substances in Two Ames Test Formats. Toxics. 2021; 9(7):152. https://doi.org/10.3390/toxics9070152
Chicago/Turabian StyleRainer, Bernhard, Elisabeth Pinter, Lukas Prielinger, Chiara Coppola, Maricel Marin-Kuan, Benoit Schilter, Silvia Apprich, and Manfred Tacker. 2021. "Direct Comparison of the Lowest Effect Concentrations of Mutagenic Reference Substances in Two Ames Test Formats" Toxics 9, no. 7: 152. https://doi.org/10.3390/toxics9070152
APA StyleRainer, B., Pinter, E., Prielinger, L., Coppola, C., Marin-Kuan, M., Schilter, B., Apprich, S., & Tacker, M. (2021). Direct Comparison of the Lowest Effect Concentrations of Mutagenic Reference Substances in Two Ames Test Formats. Toxics, 9(7), 152. https://doi.org/10.3390/toxics9070152