Toxicological Evaluation of Novel Cyclohexenone Derivative in an Animal Model through Histopathological and Biochemical Techniques

 , , , and
Abstract
1. Introduction
2. Materials and Methods
2.1. Animals Breeding and Ethical Approval
2.2. Procedures
2.2.1. Selection of Dose(s) and Route of Administration
2.2.2. Acute Toxicity
2.2.3. Sub-Acute Toxicity
2.2.4. Pre-Clinical Observations and Survival
2.2.5. Biochemical Assessment
2.2.6. Histological Evaluation
2.3. Statistical Analysis
3. Results
3.1. Acute Toxicity
3.2. Sub-Acute Toxicity
3.2.1. Body Weights
3.2.2. Biochemical Assessment
Liver
Kidney
Pancreas
Heart
3.2.3. Histopathological Evaluation
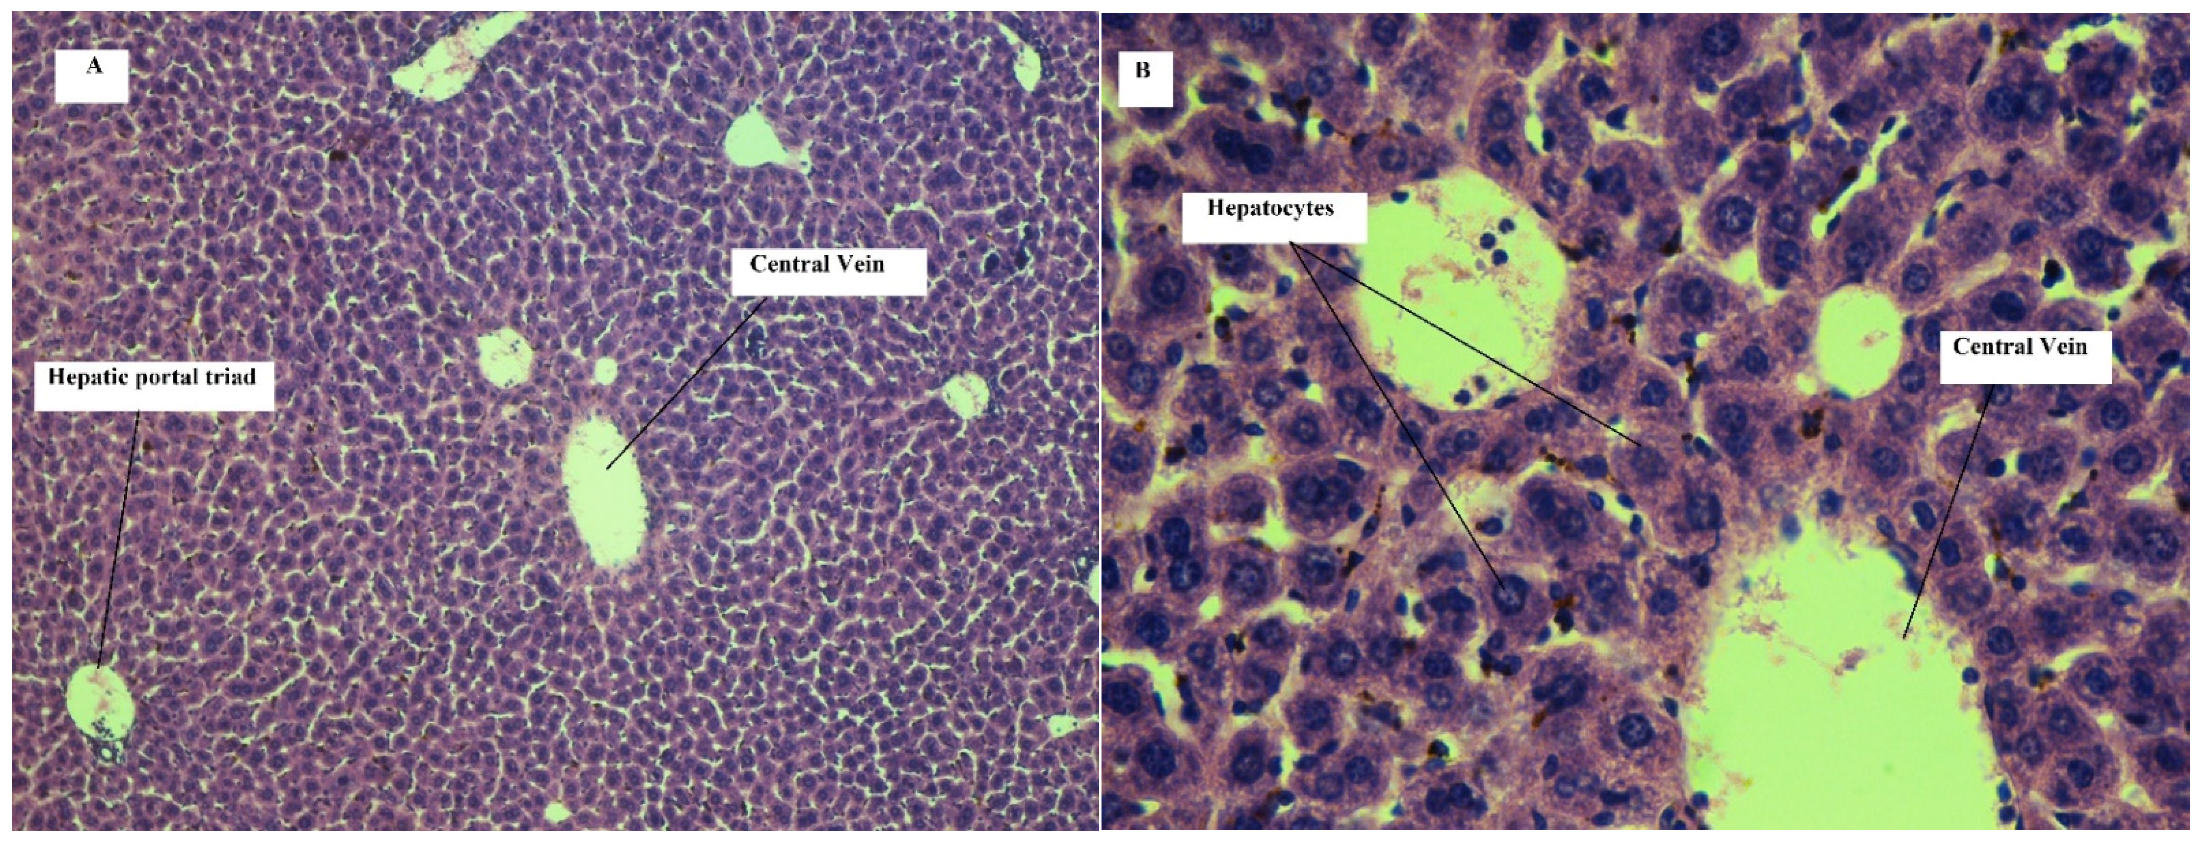
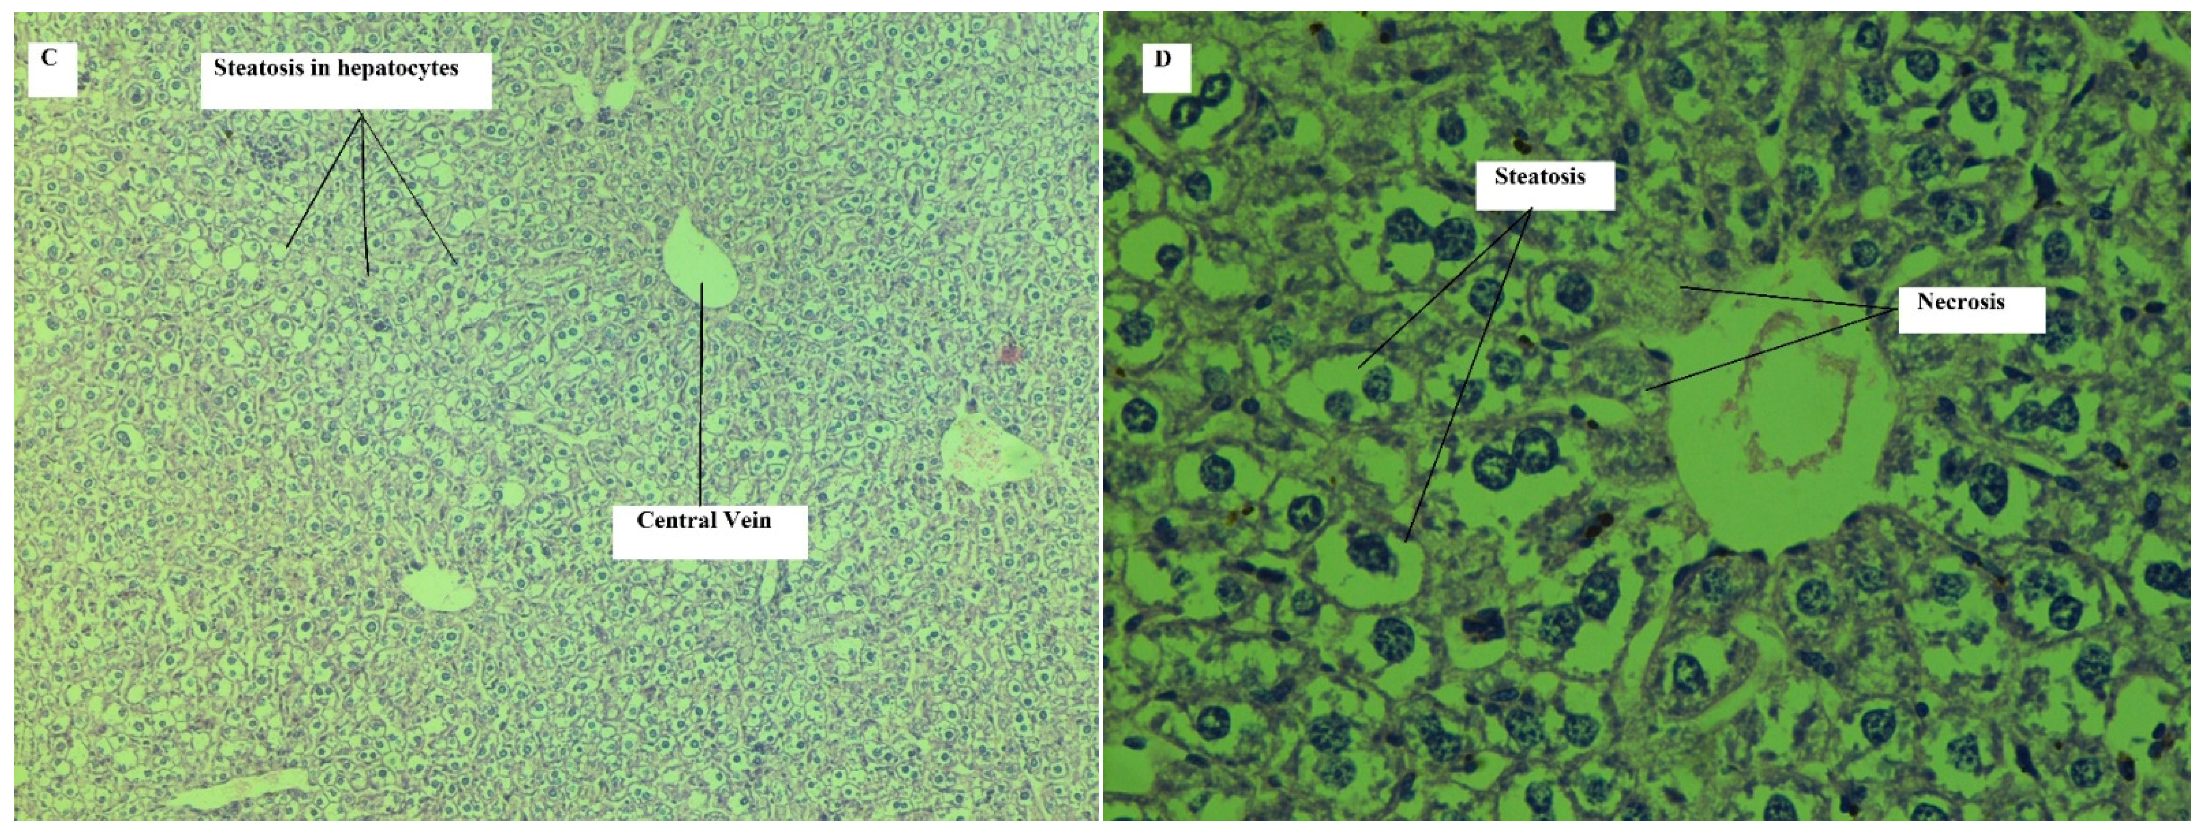
Effect on Liver
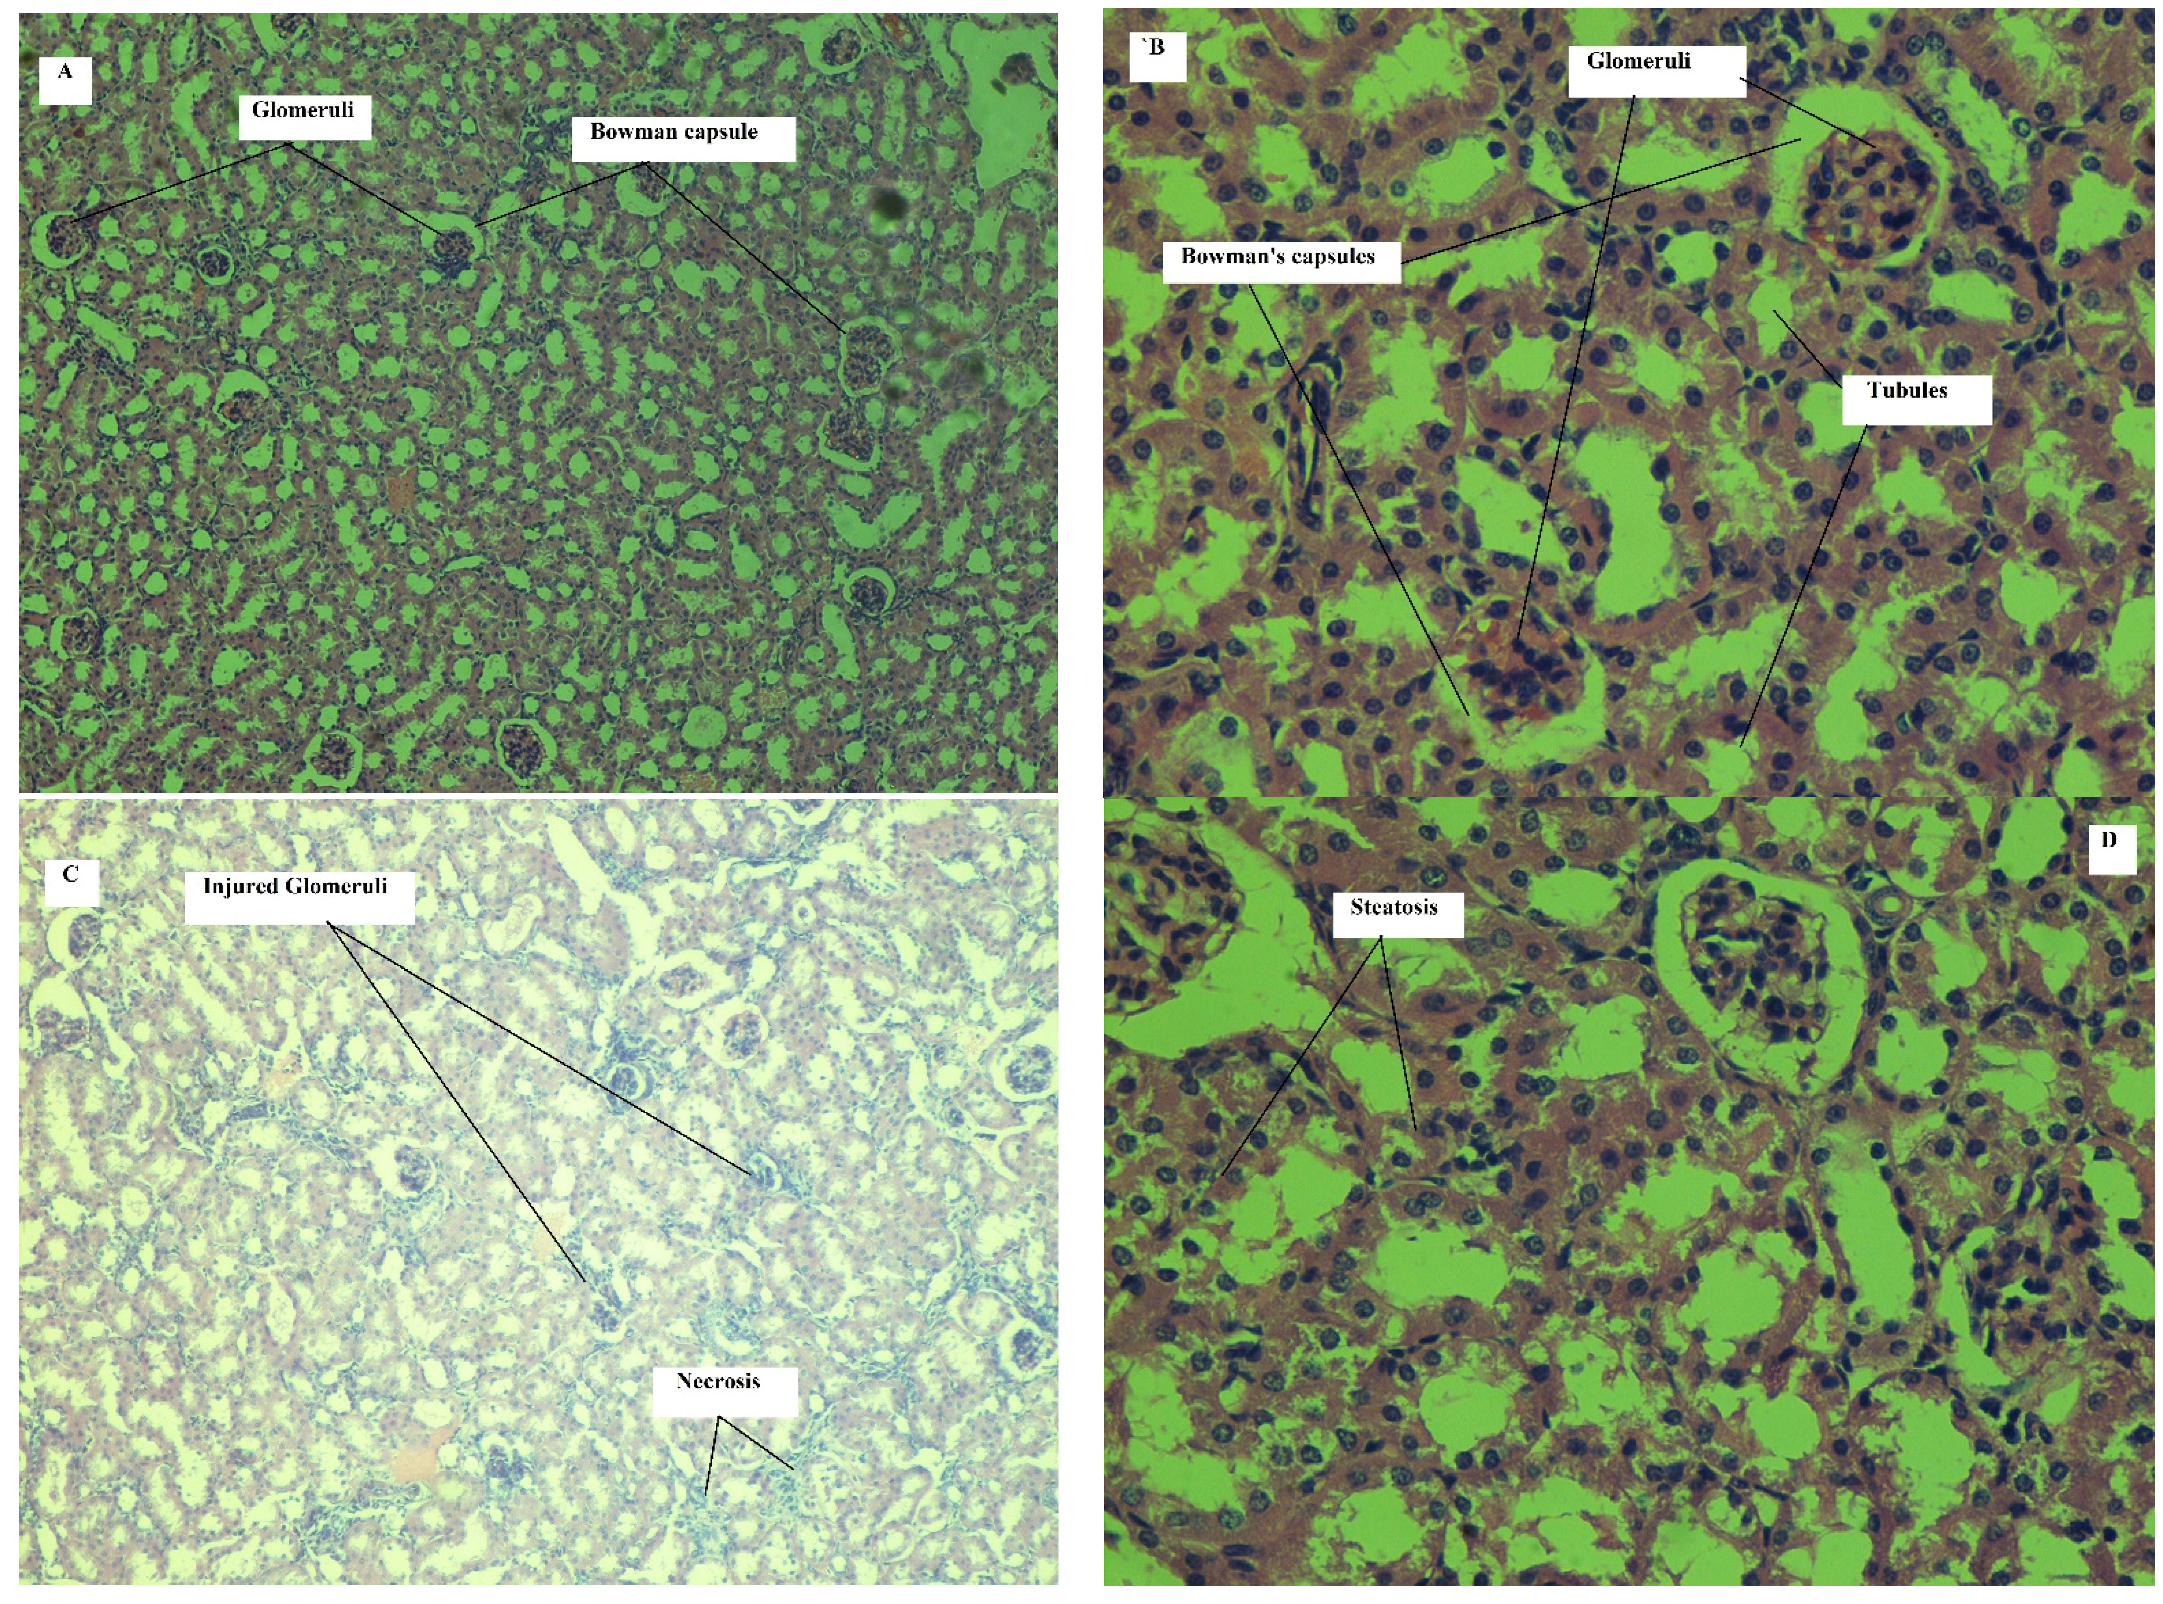
Effect on Kidney
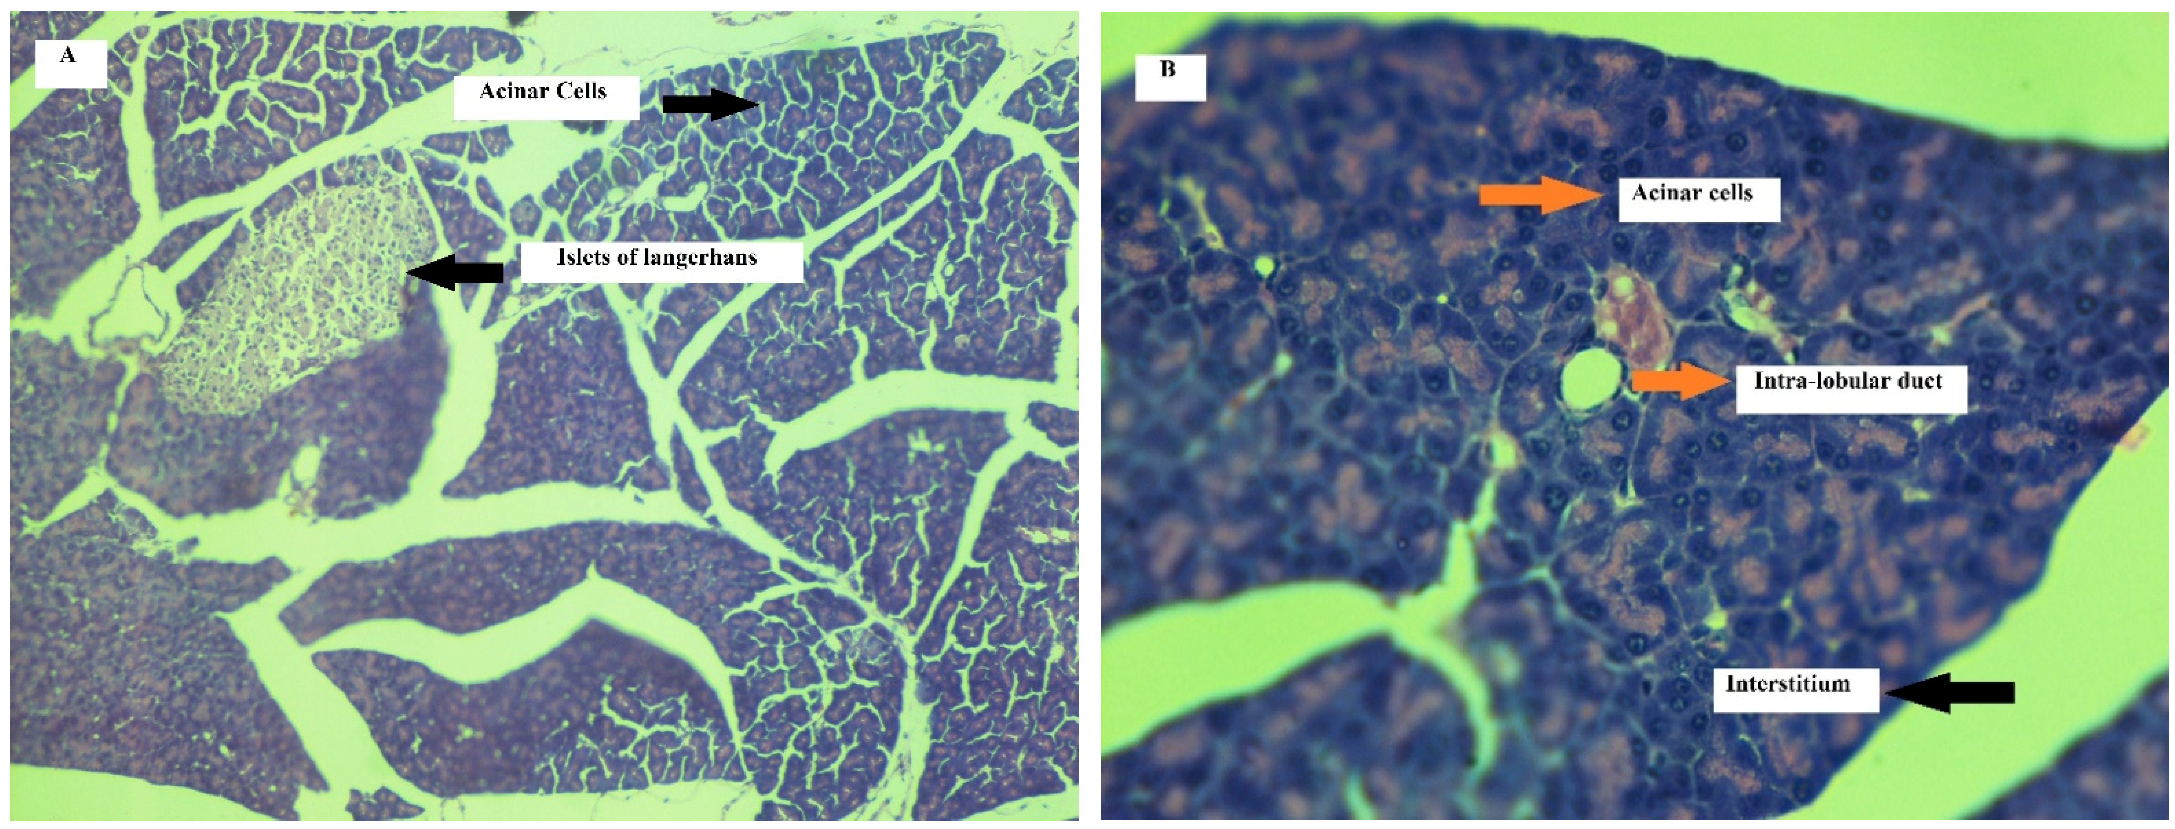
Effect on Pancreas
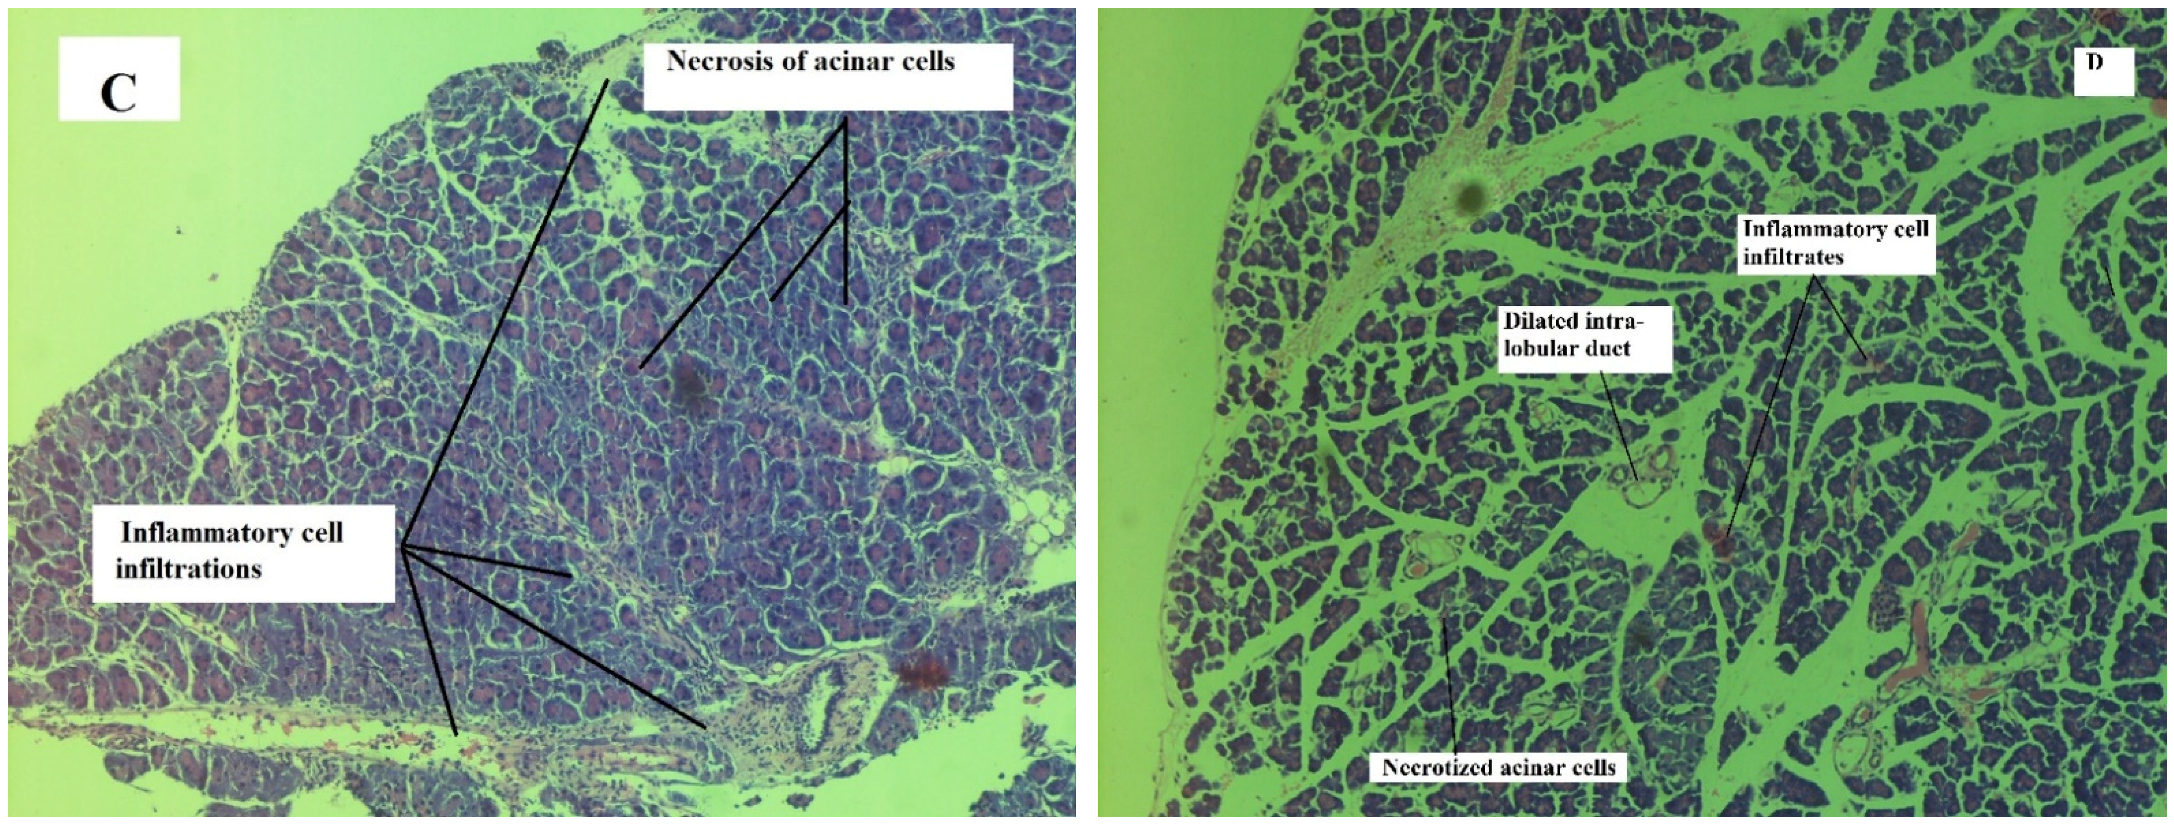
Effect on Heart
4. Discussion
5. Conclusions
6. Study Limitations and Future Plan
Author Contributions
Funding
Institutional Review Board Statement
Informed Consent Statement
Data Availability Statement
Acknowledgments
Conflicts of Interest
References
- Colerangle, J.B. Preclinical Development of Nononcogenic Drugs (Small and Large Molecules). In A Comprehensive Guide to Toxicology in Nonclinical Drug Development; Elsevier: Amsterdam, The Netherlands, 2017; pp. 659–683. [Google Scholar]
- De Bruin, Y.B.; Eskes, C.; Langezaal, I.; Coecke, S.; Kinsner-Ovaskainen, A.; Hakkinen, P.J. Testing Methods and Toxicity Assessment (Including Alternatives). In Information Resources in Toxicology; Elsevier: Amsterdam, The Netherlands, 2009; pp. 497–513. [Google Scholar]
- Mousavi, M.R.; Maghsoodlou, M.T.; Habibi-Khorassani, S.M. One-pot diastreo-selective synthesis of highly functionalized cyclohexenones: 2-oxo-N,4,6-triarylcyclohex-3-enecarboxamides. Mol. Divers. 2014, 18, 821–828. [Google Scholar] [CrossRef] [PubMed]
- Fujioka, H.; Kotoku, N.; Sawama, Y.; Nagatomi, Y.; Kita, Y. Concise asymmetric synthesis of a model compound, (4S,5S,6S)-6-(2,2-dimethoxy)ethyl-4,5-epoxy-6-hydroxy-2-cyclohexenone, for the cyclohexenone core of scyphostatin. Tetrahedron Lett. 2002, 43, 4825–4828. [Google Scholar] [CrossRef]
- Hoye, T.R.; Tennakoon, M.A. Synthesis (and Alternative Proof of Configuration) of the Scyphostatin C(1‘)−C(20‘) Trienoyl Fragment. Org. Lett. 2000, 2, 1481–1483. [Google Scholar] [CrossRef] [PubMed]
- Zia-Ul-Haq, M. Historical and Introductory Aspects of Carotenoids. In Carotenoids: Structure and Function in the Human Body; Zia-Ul-Haq, M., Dewanjee, S., Riaz, M., Eds.; Springer: Cham, Switzerland, 2021; pp. 1–42. [Google Scholar]
- Vyas, D.H.; Tala, S.D.; Akbari, J.D.; Dhaduk, M.F.; Joshi, H.S. Synthesis, Antimicrobial and Antitubercular Activity of Some Cyclohexenone and Indazole Derivatives. Indian J. Chem. 2010, 41, 19–25. [Google Scholar] [CrossRef]
- Okoth, D.A.; Akala, H.M.; Johnson, J.D.; Koorbanally, N.A. Alkyl phenols, alkenyl cyclohexenones and other phytochemical constituents from Lannea rivae (chiov) Sacleux (Anacardiaceae) and their bioactivity. Med. Chem. Res. 2016, 25, 690–703. [Google Scholar] [CrossRef]
- Okoth, D.A.; Koorbanally, N.A. Cardanols, Long Chain Cyclohexenones and Cyclohexenols from Lannea schimperi (Anacardiaceae). Nat. Prod. Commun. 2015, 10, 103–106. [Google Scholar] [CrossRef]
- LeDoux, A.; St-Gelais, A.; Cieckiewicz, E.; Jansen, O.; Bordignon, A.; Illien, B.; Di Giovanni, N.; Marvilliers, A.; Hoareau, F.; Pendeville, H.; et al. Antimalarial Activities of Alkyl Cyclohexenone Derivatives Isolated from the Leaves of Poupartia borbonica. J. Nat. Prod. 2017, 80, 1750–1757. [Google Scholar] [CrossRef]
- Gohar, U.F.; Iqbal, I.; Shah, Z.; Mukhtar, H.; Zia-Ul-Haq, M. COVID-19: Recent Developments in Therapeutic Approaches. In Alternative Medicine Interventions for COVID-19; Zia-Ul-Haq, M., Bin-Jumah, M.N., Alothamn, S.I., Henidi, H.A., Eds.; Springer: Cham, Switzerland, 2021; pp. 249–274. [Google Scholar]
- Kanagarajan, V.; Ezhilarasi, M.R.; Bhakiaraj, D.; Gopalakrishnan, M. In vitro anticandidal evaluation of novel highly functionalized bis cyclohexenone ethyl carboxylates. Eur. Rev. Med. Pharmacol. Sci. 2013, 17, 292–298. [Google Scholar]
- Fun, H.K.; Farhadikoutenaei, A.; Sarojini, B.K.; Mohan, B.J.; Narayana, B. Ethyl 6-(4-meth-oxy-phen-yl)-2-oxo-4-phenyl-cyclo-hex-3-ene-carboxyl-ate. Acta Crystallogr. Sect. E 2012, 68, o2788–o2789. [Google Scholar] [CrossRef]
- Khan, J.; Ali, G.; Khan, R.; Ullah, R.; Ullah, S. Attenuation of vincristine-induced neuropathy by synthetic cyclohexenone-functionalized derivative in mice model. Neurol. Sci. 2019, 40, 1799–1811. [Google Scholar] [CrossRef]
- Clive, D.M.; Stoff, J.S. Renal Syndromes Associated with Nonsteroidal Antiinflammatory Drugs. N. Engl. J. Med. 1984, 310, 563–572. [Google Scholar] [CrossRef] [PubMed]
- Schlondorff, D. Renal complications of nonsteroidal anti-inflammatory drugs. Kidney Int. 1993, 44, 643–653. [Google Scholar] [CrossRef]
- Gutthann, S.P.; Rodríguez, L.A.G.; Raiford, D.S.; Oliart, A.D.; Romeu, J.R. Nonsteroidal Anti-inflammatory Drugs and the Risk of Hospitalization for Acute Renal Failure. Arch. Intern. Med. 1996, 156, 2433–2439. [Google Scholar] [CrossRef]
- Whelton, A. Nephrotoxicity of nonsteroidal anti-inflammatory drugs: Physiologic foundations and clinical implications. Am. J. Med. 1999, 106, 13S–24S. [Google Scholar] [CrossRef]
- Giovanni, G.; Giovanni, P. Do non-steroidal anti-inflammatory drugs and COX-2 selective inhibitors have different renal effects? J. Nephrol. 2002, 15, 480–488. [Google Scholar] [PubMed]
- Stadlmann, S.; Zoller, H.; Vogel, W.; Offner, F.A. COX-2 inhibitor (nimesulide) induced acute liver failure. Virchows Archiv 2002, 440, 553–555. [Google Scholar] [CrossRef]
- Boelsterli, U.A. Diclofenac-induced liver injury: A paradigm of idiosyncratic drug toxicity. Toxicol. Appl. Pharmacol. 2003, 192, 307–322. [Google Scholar] [CrossRef]
- Bjorkman, D. Nonsteroidal anti-inflammatory drug-associated toxicity of the liver, lower gastrointestinal tract, and esophagus. Am. J. Med. 1998, 105, 17S–21S. [Google Scholar] [CrossRef]
- Ghosh, R.; Alajbegovic, A.; Gomes, A.V. NSAIDs and Cardiovascular Diseases: Role of Reactive Oxygen Species. Oxidative Med. Cell. Longev. 2015, 2015, 1–25. [Google Scholar] [CrossRef] [PubMed]
- Varga, Z.; Sabzwari, S.R.A.; Vargova, V. Cardiovascular Risk of Nonsteroidal Anti-Inflammatory Drugs: An Under-Recognized Public Health Issue. Cureus 2017, 9, e1144. [Google Scholar] [CrossRef]
- Kelleni, M.T.; Abdelbasset, M. Drug Induced Cardiotoxicity: Mechanism, Prevention and Management. Cardiotoxicity Oncol. Treat. 2018, 127. [Google Scholar] [CrossRef]
- Li, J.; Zhang, N.; Ye, B.; Ju, W.; Orser, B.; Fox, J.E.M.; Wheeler, M.B.; Wang, Q.; Lu, W.-Y. Non-steroidal anti-inflammatory drugs increase insulin release from beta cells by inhibiting ATP-sensitive potassium channels. Br. J. Pharmacol. 2007, 151, 483–493. [Google Scholar] [CrossRef]
- Reyes, J.V.; Patel, B.M.; Malik, F.; Gonzalez, M.O. Non-steroidal Anti-inflammatory Drug-induced Acute Pancreatitis: A Case Report. Cureus 2019, 11. [Google Scholar] [CrossRef] [PubMed]
- Pezzilli, R.; Morselli-Labate, A.M.; Corinaldesi, R. NSAIDs and Acute Pancreatitis: A Systematic Review. Pharmaceuticals 2010, 3, 558–571. [Google Scholar] [CrossRef] [PubMed]
- Ballou, L.R.; Botting, R.M.; Goorha, S.; Zhang, J.; Vane, J.R. Nociception in cyclooxygenase isozyme-deficient mice. Proc. Natl. Acad. Sci. USA 2000, 97, 10272–10276. [Google Scholar] [CrossRef]
- The assessment and control of the severity of scientific procedures on laboratory animals. Lab. Anim. 1990, 24, 97–130. [CrossRef]
- Jonsson, M.; Jestoi, M.; Nathanail, A.V.; Kokkonen, U.-M.; Anttila, M.; Koivisto, P.; Karhunen, P.; Peltonen, K. Application of OECD Guideline 423 in assessing the acute oral toxicity of moniliformin. Food Chem. Toxicol. 2013, 53, 27–32. [Google Scholar] [CrossRef]
- Chebib, M.; Hinton, T.; Schmid, K.L.; Brinkworth, D.R.; Qian, H.; Matos, S.; Kim, H.-L.; Abdel-Halim, H.; Kumar, R.J.; Johnston, G.A.R.; et al. Novel, Potent, and Selective GABAC Antagonists Inhibit Myopia Development and Facilitate Learning and Memory. J. Pharmacol. Exp. Ther. 2008, 328, 448–457. [Google Scholar] [CrossRef]
- Shahid, M.; Subhan, F.; Ullah, I.; Ali, G.; Alam, J.; Shah, R. Beneficial effects of Bacopa monnieri extract on opioid induced toxicity. Heliyon 2016, 2, e00068. [Google Scholar] [CrossRef]
- Shah, R.; Subhan, F.; Ali, G.; Ullah, I.; Ullah, S.; Shahid, M.; Ahmad, N.; Fawad, K. Olanzapine induced biochemical and histopathological changes after its chronic administration in rats. Saudi Pharm. J. 2016, 24, 698–704. [Google Scholar] [CrossRef]
- Ramaswamy, R.S.; Prathyusha, N.; Saranya, R.; Sumathy, H.; Mohanavalli, K.T.; Priya, R.J.; Venkhatesh, J.R.; Babu, C.S.; Manickavasakam, K.; Thanikachalam, S. Acute toxicity and the 28-day repeated dose study of a Siddha medicine Nuna Kadugu in rats. BMC Complement. Altern. Med. 2012, 12, 190. [Google Scholar] [CrossRef] [PubMed]
- Hsu, Y.-W.; Tsai, C.-F.; Chen, W.-K.; Huang, C.-F.; Yen, C.-C. A subacute toxicity evaluation of green tea (Camellia sinensis) extract in mice. Food Chem. Toxicol. 2011, 49, 2624–2630. [Google Scholar] [CrossRef] [PubMed]
- Feldman, A.T.; Wolfe, D. Tissue processing and hematoxylin and eosin staining. Methods Mol. Biol. 2014, 1180, 31–43. [Google Scholar] [PubMed]
- Naz, M.; Rehman, N.; Ansari, M.N.; Kamal, M.; Ganaie, M.A.; Awaad, A.S.; Alqasoumi, S.I. Comparative study of subchronic toxicities of mosquito repellents (coils, mats and liquids) on vital organs in Swiss albino mice. Saudi Pharm. J. 2019, 27, 348–353. [Google Scholar] [CrossRef] [PubMed]
- Hosseinzadeh, H.; Shakib, S.S.; Sameni, A.K.; Taghiabadi, E. Acute and Subacute Toxicity of Safranal, a Constituent of Saffron, in Mice and Rats. Iran. J. Pharm. Res. IJPR 2013, 12, 93–99. [Google Scholar] [CrossRef] [PubMed]
- Chen, S.M.; Mukoyama, T.; Sato, N.; Yamagata, S.I.; Arai, Y.; Satoh, N.; Ueda, S. Induction of nephrotoxic serum nephritis in inbred mice and suppressive effect of colchicine on the development of this nephritis. Pharmacol. Res. 2002, 45, 319–324. [Google Scholar] [CrossRef]
- Deng, Y.; Cao, M.; Shi, D.; Yin, Z.; Jia, R.; Xu, J.; Wang, C.; Lv, C.; Liang, X.; He, C.; et al. Toxicological evaluation of neem (Azadirachta indica) oil: Acute and subacute toxicity. Environ. Toxicol. Pharmacol. 2013, 35, 240–246. [Google Scholar] [CrossRef] [PubMed]
- Gibson-Corley, K.N.; Olivier, A.K.; Meyerholz, D.K. Principles for Valid Histopathologic Scoring in Research. Vet. Pathol. 2013, 50, 1007–1015. [Google Scholar] [CrossRef]
- Kleiner, D.E.; Chalasani, N.P.; Lee, W.M.; Fontana, R.J.; Bonkovsky, H.L.; Watkins, P.B.; Hayashi, P.H.; Davern, T.J.; Navarro, V.; Reddy, R.; et al. Hepatic histological findings in suspected drug-induced liver injury: Systematic evaluation and clinical associations. Hepatology 2014, 59, 661–670. [Google Scholar] [CrossRef]
- Ozer, J.; Ratner, M.; Shaw, M.; Bailey, W.; Schomaker, S. The current state of serum biomarkers of hepatotoxicity. Toxicology 2008, 245, 194–205. [Google Scholar] [CrossRef]
- Ahmadian, S.; Sheshpari, S.; Mahdipour, M.; Pazhang, M.; Tsai, P.-S.J.; Nouri, M.; Rahbarghazi, R.; Shahnazi, M. Toxic effects of VCD on kidneys and liver tissues: A histopathological and biochemical study. BMC Res. Notes 2019, 12. [Google Scholar] [CrossRef] [PubMed]
- Tian, Q.; Zhao, X.; Wang, Y.; Wee, A.; Soon, G.S.T.; Gouw, A.S.H.; Li, M.; Yang, R.; Wang, L.; Wang, Q.; et al. Histologic pattern is better correlated with clinical outcomes than biochemical classification in patients with drug-induced liver injury. Mod. Pathol. 2019, 32, 1795–1805. [Google Scholar] [CrossRef] [PubMed]
- Singh, T.; Ruchi, K.R.; Singh, A. Evaluation of biochemical and histological effects on liver of Swiss albino mice due to acute oral toxicity of aqueous leaf extract of Phyllanthus niruri. Int. J. Pharmacogn. Phytochem. Res. 2016, 8, 85–90. [Google Scholar]
- El Makawy, A.I.; Mabrouk, D.M.; Ibrahim, F.M.; Ahmed, K.A. Genotoxic, biochemical and histopathological studies to assessment the topiramate hepatorenal toxicity in mice. Drug Chem. Toxicol. 2019, 1–10. [Google Scholar] [CrossRef]
- Sayed, H. Histopathological and Biochemical Effects of Acute and Chronic Tramadol Drug Toxicity on Liver, Kidney and Testicular Function in Adult Male Albino Rats. J. Med. Toxicol. Clin. Forensic Med. 2015, I, 1–7. [Google Scholar]
- Shahid, M.; Subhan, F. Protective effect of Bacopa monniera methanol extract against carbon tetrachloride induced hepatotoxicity and nephrotoxicity. Pharmacologyonline 2014, 2, 18–28. [Google Scholar]
- Hsu, Y.-W.; Tsai, C.-F.; Chuang, W.-C.; Chen, W.-K.; Ho, Y.-C.; Lu, F.-J. Protective effects of silica hydride against carbon tetrachloride-induced hepatotoxicity in mice. Food Chem. Toxicol. 2010, 48, 1644–1653. [Google Scholar] [CrossRef]
- Ince, S.; Keleş, H.; Erdogan, M.; Hazman, O.; Kucukkurt, I. Protective effect of boric acid against carbon tetrachloride–induced hepatotoxicity in mice. Drug Chem. Toxicol. 2011, 35, 285–292. [Google Scholar] [CrossRef]
- Boll, M.; Lutz, W.D.; Becker, E.; Stampfl, A. Mechanism of Carbon Tetrachloride-Induced Hepatotoxicity. Hepatocellular Damage by Reactive Carbon Tetrachloride Metabolites. Z. Nat. C 2001, 56, 649–659. [Google Scholar] [CrossRef]
- Maddrey, W.C. Drug-induced hepatotoxicity. J. Clin. Gastroenterol. 2005, 39, S83–S89. [Google Scholar] [CrossRef]
- Haschek, W.M.; Rousseaux, C.G.; Wallig, M.A. Chapter 9—The Liver. In Fundamentals of Toxicologic Pathology, 2nd ed.; Haschek, W.M., Rousseaux, C.G., Wallig, M.A., Eds.; Academic Press: San Diego, CA, USA, 2010; pp. 197–235. [Google Scholar]
- Zirak, M.R.; Rahimian, R.; Ghazi-Khansari, M.; Abbasi, A.; Razmi, A.; Mehr, S.E.; Mousavizadeh, K.; Dehpour, A.R. Tropisetron attenuates cisplatin-induced nephrotoxicity in mice. Eur. J. Pharmacol. 2014, 738, 222–229. [Google Scholar] [CrossRef] [PubMed]
- Ajith, T.; Usha, S.; Nivitha, V. Ascorbic acid and α-tocopherol protect anticancer drug cisplatin induced nephrotoxicity in mice: A comparative study. Clin. Chim. Acta 2007, 375, 82–86. [Google Scholar] [CrossRef] [PubMed]
- Nakashima-Kamimura, N.; Mori, T.; Ohsawa, I.; Asoh, S.; Ohta, S. Molecular hydrogen alleviates nephrotoxicity induced by an anti-cancer drug cisplatin without compromising anti-tumor activity in mice. Cancer Chemother. Pharmacol. 2009, 64, 753–761. [Google Scholar] [CrossRef] [PubMed]
- Issa, S.Y.; Hafez, E.M.; El-Banna, A.S.; Rahman, S.M.A.; Almazroua, M.K.; El-Hamd, M.A. Baclofen systemic toxicity: Experimental histopathological and biochemical study. Hum. Exp. Toxicol. 2017, 37, 431–441. [Google Scholar] [CrossRef]
- Murray, M.D.; Brater, D.C. Renal Toxicity of the Nonsteroidal Anti-Inflammatory Drugs. Annu. Rev. Pharmacol. Toxicol. 1993, 33, 435–465. [Google Scholar] [CrossRef] [PubMed]
- Mork, N.L.; Robertson, R.P. Effects of Nonsteroidal Antiinflammatory Drugs in Conventional Dosage on Glucose Homeostasis in Patients With Diabetes. West. J. Med. 1983, 139, 46–49. [Google Scholar]
- Bellucci, P.N.; Bagnes, M.F.G.; Di Girolamo, G.; González, C.D. Potential Effects of Nonsteroidal Anti-Inflammatory Drugs in the Prevention and Treatment of Type 2 Diabetes Mellitus. J. Pharm. Pract. 2016, 30, 549–556. [Google Scholar] [CrossRef]
- Ben Salem, C.; Fathallah, N.; Hmouda, H.; Bouraoui, K. Drug-Induced Hypoglycaemia. Drug Saf. 2011, 34, 21–45. [Google Scholar] [CrossRef]
- Faskowitz, A.J.; Kramskiy, V.N.; Pasternak, G.W. Methadone-Induced Hypoglycemia. Cell. Mol. Neurobiol. 2013, 33, 537–542. [Google Scholar] [CrossRef]
- Cheng, J.-T.; Liu, I.-M.; Chi, T.-C.; Tzeng, T.-F.; Lu, F.-H.; Chang, C.J. Plasma Glucose-Lowering Effect of Tramadol in Streptozotocin-Induced Diabetic Rats. Diabetes 2001, 50, 2815–2821. [Google Scholar] [CrossRef]
- Makunts, T. Tramadol and methadone associated with hypoglycaemia. Reactions 2019, 1770, 12–14. [Google Scholar]
- Kim, S.H.; Kim, K.-J.; Kim, J.-H.; Kwak, J.-H.; Song, H.; Cho, J.Y.; Hwang, D.Y.; Kim, K.S.; Jung, Y.-S. Comparision of doxorubicin-induced cardiotoxicity in the ICR mice of different sources. Lab. Anim. Res. 2017, 33, 165–170. [Google Scholar] [CrossRef] [PubMed]


| Groups | Days of Treatment | Biochemical Tests | n | Mean | Skewness | z-Value | Kurtosis | z-Value | ||
|---|---|---|---|---|---|---|---|---|---|---|
| Statistic | Statistic | Statistic | Std. Error | Statistic | Std. Error | |||||
| Control | 11th day | Blood Urea Nitrogen (mg/dL) | 6 | 13.33 | 0.248 | 0.845 | 0.293 | −0.014 | 1.741 | −0.008 |
| Serum creatinine (mg/dL) | 6 | 0.517 | −0.313 | 0.845 | −0.370 | −0.104 | 1.741 | −0.059 | ||
| Alanine aminotransferase (ALT) U/L | 6 | 94.50 | −0.574 | 0.845 | −0.679 | −1.132 | 1.741 | −0.650 | ||
| Aspartate aminotransferase (AST) U/L | 6 | 24.00 | 0.433 | 0.845 | 0.512 | −1.175 | 1.741 | −0.674 | ||
| Valid N (listwise) | 6 | |||||||||
| 21st day | Blood Urea Nitrogen (mg/dL) | 6 | 15.17 | 0.319 | 0.845 | 0.377 | −1.171 | 1.741 | −0.672 | |
| Serum creatinine (mg/dL) | 6 | 0.483 | 0.313 | 0.845 | 0.370 | −0.104 | 1.741 | −0.059 | ||
| Alanine aminotransferase (ALT) U/L | 6 | 92.17 | −0.036 | 0.845 | −0.042 | 0.428 | 1.741 | 0.245 | ||
| Aspartate aminotransferase (AST) U/L | 6 | 24.67 | −0.224 | 0.845 | −0.265 | −1.864 | 1.741 | −1.070 | ||
| Valid N (listwise) | 6 | |||||||||
| Treatment | 11th day | Blood Urea Nitrogen (mg/dL) | 6 | 26.67 | 0.435 | 0.845 | 0.514 | 0.586 | 1.741 | 0.336 |
| Serum creatinine (mg/dL) | 6 | 0.483 | 0.313 | 0.845 | 0.370 | −0.104 | 1.741 | −0.059 | ||
| Alanine aminotransferase (ALT) U/L | 6 | 98.00 | −0.515 | .845 | −0.609 | 0.729 | 1.741 | 0.418 | ||
| Aspartate aminotransferase (AST) U/L | 6 | 25.50 | 0.461 | 0.845 | 0.545 | −1.260 | 1.741 | −0.723 | ||
| Valid N (listwise) | 6 | |||||||||
| 21st day | Blood Urea Nitrogen (mg/dL) | 6 | 18.50 | 0.000 | 0.845 | 0 | −1.200 | 1.741 | −0.689 | |
| Serum creatinine (mg/dL) | 6 | 0.500 | 0.000 | 0.845 | 0 | −1.875 | 1.741 | −1.076 | ||
| Alanine aminotransferase (ALT) U/L | 6 | 94.50 | 0.401 | 0.845 | 0.474 | 1.635 | 1.741 | 0.939 | ||
| Aspartate aminotransferase (AST) U/L | 6 | 24.50 | 0.255 | 0.845 | 0.301 | −1.312 | 1.741 | −0.753 | ||
| Valid N (listwise) | 6 | |||||||||
| Levene’s Test for Equality of Variances—11th Day | Levene’s Test for Equality of Variances—21st Day | |||
|---|---|---|---|---|
| F | Sig. | F | Sig. | |
| Blood urea Nitrogen (mg/dL) | 0.741 | 0.410 | 1.250 | 0.290 |
| Serum creatinine (mg/dL) | 0.000 | 1.000 | 0.160 | 0.698 |
| Alanine aminotransferase (ALT) U/L | 0.877 | 0.371 | 2.094 | 0.178 |
| Aspartate aminotransferase (AST) U/L | 0.030 | 0.865 | 1.042 | 0.331 |
| Group | Statistical Parameter | Alanine Aminotransferase (ALT, 11th day) | Alanine Aminotransferase (ALT, 21st day) | Aspartate Aminotransferase (AST, 11th day) | Aspartate Aminotransferase (AST, 21st day) |
|---|---|---|---|---|---|
| Control (n = 6) | Mean ± SD | 94.50 ± 5.089 | 92.17 ± 5.456 | 24.00 ± 3.464 | 24.67 ± 2.805 |
| Minimum | 87 | 84 | 20 | 21 | |
| Maximum | 100 | 100 | 29 | 28 | |
| Treatment (n = 6) | Mean ± SD | 98 ± 3.742 | 94.50 ± 15.681 | 25.50 ± 3.082 | 24.50 ± 3.834 |
| Minimum | 92 | 72 | 22 | 20 | |
| Maximum | 103 | 120 | 30 | 30 | |
| Treated vs. control | p-value | 0.205 | 0.738 | 0.447 | 0.933 |
| Treated (11th day) vs. treated (21st day) | p-value | 0.606 | 0.629 | ||
| Group | Statistical Parameter | Blood Urea Nitrogen (BUN, 11th Day) | Blood Urea Nitrogen (BUN, 21st Day) | Serum Creatinine (11th Day) | Serum Creatinine (21st Day) |
|---|---|---|---|---|---|
| Control | Mean ± SD | 13.33 ± 1.75 | 18.50 ± 1.871 | 0.517 ± 0.075 | 0.500 ± 0.0894 |
| Minimum | 11 | 16 | 0.4 | 0.4 | |
| Maximum | 16 | 21 | 0.6 | 0.6 | |
| Treatment | Mean ± SD | 26.67 ± 2.73 | 15.17 ± 2.639 | 0.483 ± 0.075 | 0.483 ±0.0753 |
| Minimum | 23 | 12 | 0.4 | 0.4 | |
| Maximum | 31 | 19 | 0.6 | 0.6 | |
| Treated vs. control | p-value | 0 | 0.03 | 0.461 | 0.734 |
| Treated (11th vs. 21st day) | p-value | 0 | 0.734 | ||
| Group | Statistical Parameter | Serum Amylase (U/L) (11th Day) | Serum Amylase (U/L) (21st Day) | Random Blood Glucose (mg/dL) (11th Day) | Random Blood Glucose (mg/dL) (21st Day) |
|---|---|---|---|---|---|
| Control (n = 6) | Mean ± SD | 2683.17 ± 26.649 | 2680 ± 23.421 | 83.83 ± 7.35 | 69.33 ± 9.07 |
| Minimum | 2649 | 2655 | 73 | 60 | |
| Maximum | 2720 | 2700 | 90 | 85 | |
| Treatment (n = 6) | Mean ± SD | 2680 ± 23.45 | 2672 ± 17.07 | 43.66 ± 13.89 | 56.67 ± 6.18 |
| Minimum | 2655 | 2650 | 23 | 48 | |
| Maximum | 2710 | 2700 | 65 | 65 | |
| Treated vs. control | p-value | 0.831 | 0.515 | 0.000 | 0.018 |
| Treated (11th day) vs. treated (21st day) | p-value | 0.184 | 0.508 | ||
| Group | Statistical Parameter | Random Blood Glucose (mg/dL) | Random Blood Glucose (mg/dL) | Random Blood Glucose (mg/dL) | Random Blood Glucose (mg/dL) |
|---|---|---|---|---|---|
| Time Period | Baseline | 7th Day | 11th Day | - | |
| Control (n = 6) | Mean ± SD | 83.57 ± 7.232 | 82.67 ± 4.179 | 83.83 ± 7.360 | - |
| Minimum | 74 | 79 | 73 | - | |
| Maximum | 92 | 90 | 91 | - | |
| Treatment (n = 6) | Mean ± SD | 82.17 ± 4.535 | 60.33 ± 3.011 | 47.83 ± 9.517 | - |
| Minimum | 78 | 572 | 39 | - | |
| Maximum | 90 | 66 | 65 | - | |
| Treated vs. control | p-value | 0.710 | 0.000 | 0.000 | - |
| Time Period | Baseline | 7th Day | 14th Day | 21st Day | |
| Control (n = 6) | Mean ± SD | 72.50 ± 4.722 | 75.50 ± 6.979 | 75.83 ± 6.555 | 69.33 ± 9.070 |
| Minimum | 70 | 69 | 68 | 60 | |
| Maximum | 69 | 85 | 85 | 85 | |
| Treatment (n = 6) | Mean ± SD | 80.83 ± 9.042 | 60.00 ± 7.563 | 56.17 ± 4.355 | 56.67 ± 6.186 |
| Minimum | 74 | 79 | 73 | 48 | |
| Maximum | 92 | 90 | 91 | 65 | |
| Treated vs. control | p-value | 0.073 | 0.004 | 0.000 | 0.018 |
| Group | Statistical Parameter | Cardiac Troponin-I (ng/dL) (cTn-I, 11th Day) | Cardiac Troponin-I (ng/dL) (cTn-I, 21st Day) | Creatinine Kinase-Myocardial Band (U/L) (CK-MB, 11th Day) | Creatinine Kinase-Myocardial Band (U/L) (CK-MB, 21st Day) |
|---|---|---|---|---|---|
| Control (n = 6) | Mean ± SD | 0.29667 ± 0.055 | 0.25833 ± 0.02483 | 11 ± 2.098 | 13.83 ± 1.871 |
| Minimum | 0.25 | 0.23 | 9 | 8 | |
| Maximum | 0.4 | 0.27 | 14 | 12 | |
| Treatment (n = 6) | Mean ± SD | 0.3 ± 0.0522 | 0.26167 ± 0.0286 | 13.83 ± 2.14 | 13.67 ± 2.160 |
| Minimum | 0.26 | 0.22 | 12 | 11 | |
| Maximum | 0.4 | 0.3 | 16 | 17 | |
| Treated vs. control | p-value | 0.916 | 0.834 | 0.672 | 0.896 |
| Treated (11th day) vs. treated (21st day) | p-value | 0.497 | 0.786 | ||
| Histopathological Findings | Animal Group-I | Animal Group-II | ||||||||||
|---|---|---|---|---|---|---|---|---|---|---|---|---|
| (Control) | (Treated) | |||||||||||
| 1 | 2 | 3 | 4 | 5 | 6 | 1 | 2 | 3 | 4 | 5 | 6 | |
| Kidney | ||||||||||||
| Hyperemia | 0 | 0 | 0 | 0 | 0 | 0 | 0 | 0 | 0 | 0 | 1 | 0 |
| Necrosis | 0 | 0 | 0 | 0 | 0 | 0 | 1 | 0 | 0 | 0 | 0 | 1 |
| Inflammatory cell aggregation | 0 | 0 | 0 | 0 | 0 | 0 | 1 | 0 | 0 | 1 | 2 | 1 |
| Fibrosis | 0 | 0 | 0 | 0 | 0 | 0 | 0 | 0 | 1 | 1 | 0 | 0 |
| Glomerular injury | 0 | 0 | 0 | 0 | 0 | 0 | 1 | 1 | 2 | 1 | 2 | 1 |
| Steatosis | 0 | 0 | 0 | 0 | 0 | 0 | 0 | 1 | 1 | 1 | 1 | 1 |
| Ectasia/tubular injury | 0 | 0 | 0 | 0 | 0 | 0 | 1 | 1 | 1 | 2 | 2 | 2 |
| Liver | ||||||||||||
| Hyperemia | 0 | 0 | 0 | 0 | 0 | 0 | 0 | 0 | 0 | 0 | 0 | 0 |
| Necrosis | 0 | 0 | 0 | 0 | 0 | 0 | 0 | 0 | 0 | 0 | 0 | 1 |
| Inflammatory cell aggregation | 0 | 0 | 0 | 0 | 0 | 0 | 1 | 1 | 1 | 1 | 1 | 1 |
| Fibrosis | 0 | 0 | 0 | 0 | 0 | 0 | 1 | 0 | 0 | 1 | 0 | 1 |
| Steatosis | 0 | 0 | 0 | 0 | 0 | 0 | 2 | 1 | 3 | 2 | 2 | 2 |
| Scoring of Pancreas Tissue Slides | ||||||||||||
|---|---|---|---|---|---|---|---|---|---|---|---|---|
| on 11th Day | Control Animals | Treated Animals | ||||||||||
| Parameters | 1 | 2 | 3 | 4 | 5 | 6 | 1 | 2 | 3 | 4 | 5 | 6 |
| Edema | 0 | 0 | 0 | 0 | 0 | 0 | 1 | 1 | 1 | 1 | 1 | 1 |
| Necrosis | 0 | 0 | 0 | 0 | 0 | 0 | 1 | 1 | 1 | 0 | 1 | 0 |
| Inflammation | 0 | 0 | 0 | 0 | 0 | 0 | 1 | 1 | 2 | 1 | 1 | 1 |
| Hemorrhage | 0 | 0 | 0 | 0 | 0 | 0 | 0 | 0 | 0 | 0 | 0 | 0 |
| Fat necrosis | 0 | 0 | 0 | 0 | 0 | 0 | 0 | 0 | 0 | 0 | 0 | 0 |
| on 21st Day | Control Animals | Treated Animals | ||||||||||
| Parameters | 1 | 2 | 3 | 4 | 5 | 6 | 1 | 2 | 3 | 4 | 5 | 6 |
| Edema | 0 | 0 | 0 | 0 | 0 | 0 | 2 | 2 | 3 | 3 | 2 | 4 |
| Necrosis | 0 | 0 | 0 | 0 | 0 | 0 | 2 | 1 | 2 | 1 | 1 | 2 |
| Inflammation | 0 | 0 | 0 | 0 | 0 | 0 | 1 | 1 | 2 | 2 | 1 | 3 |
| Hemorrhage | 0 | 0 | 0 | 0 | 0 | 0 | 0 | 0 | 0 | 0 | 0 | 0 |
| Fat necrosis | 0 | 0 | 0 | 0 | 0 | 0 | 0 | 0 | 0 | 0 | 0 | 0 |
| Scoring of Heart Tissue Slides | ||||||||||||
|---|---|---|---|---|---|---|---|---|---|---|---|---|
| on 11th Day | Control Animals | Treated Animals | ||||||||||
| Parameters | 1 | 2 | 3 | 4 | 5 | 6 | 1 | 2 | 3 | 4 | 5 | 6 |
| Focal myocytes damage | 0 | 0 | 0 | 0 | 0 | 0 | 2 | 2 | 3 | 2 | 2 | 2 |
| Multifocal degeneration | 0 | 0 | 0 | 0 | 0 | 0 | 2 | 2 | 2 | 2 | 2 | 2 |
| Multifocal degeneration with inflammatory process | 0 | 0 | 0 | 0 | 0 | 0 | 0 | 2 | 2 | 0 | 1 | 1 |
| Myofibrillar degeneration/diffuse inflammatory process | 0 | 0 | 0 | 0 | 0 | 0 | 0 | 0 | 0 | 0 | 0 | 0 |
| Necrosis with diffuse inflammatory process | 0 | 0 | 0 | 0 | 0 | 0 | 0 | 0 | 0 | 0 | 0 | 0 |
| on 21st Day | Control Animals | Treated Animals | ||||||||||
| Scoring Parameters | 1 | 2 | 3 | 4 | 5 | 6 | 1 | 2 | 3 | 4 | 5 | 6 |
| Focal myocytes damage | 0 | 0 | 0 | 0 | 0 | 0 | 3 | 3 | 3 | 3 | 3 | 3 |
| Multifocal degeneration | 0 | 0 | 0 | 0 | 0 | 0 | 3 | 3 | 3 | 3 | 3 | 3 |
| Multifocal degeneration with inflammatory process | 0 | 0 | 0 | 0 | 0 | 0 | 1 | 2 | 3 | 3 | 3 | 2 |
| Myofibrillar degeneration/diffuse inflammatory process | 0 | 0 | 0 | 0 | 0 | 0 | 0 | 0 | 2 | 3 | 2 | 2 |
| Necrosis with diffuse inflammatory process | 0 | 0 | 0 | 0 | 0 | 0 | 0 | 0 | 0 | 0 | 0 | 0 |
Publisher’s Note: MDPI stays neutral with regard to jurisdictional claims in published maps and institutional affiliations. |
© 2021 by the authors. Licensee MDPI, Basel, Switzerland. This article is an open access article distributed under the terms and conditions of the Creative Commons Attribution (CC BY) license (https://creativecommons.org/licenses/by/4.0/).
Share and Cite
Kamil, M.; Fatima, A.; Ullah, S.; Ali, G.; Khan, R.; Ismail, N.; Qayum, M.; Irimie, M.; Dinu, C.G.; Ahmedah, H.T.; et al. Toxicological Evaluation of Novel Cyclohexenone Derivative in an Animal Model through Histopathological and Biochemical Techniques. Toxics 2021, 9, 119. https://doi.org/10.3390/toxics9060119
Kamil M, Fatima A, Ullah S, Ali G, Khan R, Ismail N, Qayum M, Irimie M, Dinu CG, Ahmedah HT, et al. Toxicological Evaluation of Novel Cyclohexenone Derivative in an Animal Model through Histopathological and Biochemical Techniques. Toxics. 2021; 9(6):119. https://doi.org/10.3390/toxics9060119
Chicago/Turabian StyleKamil, Muhammad, Arifa Fatima, Sami Ullah, Gowhar Ali, Rasool Khan, Naila Ismail, Mughal Qayum, Marius Irimie, Catalina Georgeta Dinu, Hanadi Talal Ahmedah, and et al. 2021. "Toxicological Evaluation of Novel Cyclohexenone Derivative in an Animal Model through Histopathological and Biochemical Techniques" Toxics 9, no. 6: 119. https://doi.org/10.3390/toxics9060119
APA StyleKamil, M., Fatima, A., Ullah, S., Ali, G., Khan, R., Ismail, N., Qayum, M., Irimie, M., Dinu, C. G., Ahmedah, H. T., & Cocuz, M. E. (2021). Toxicological Evaluation of Novel Cyclohexenone Derivative in an Animal Model through Histopathological and Biochemical Techniques. Toxics, 9(6), 119. https://doi.org/10.3390/toxics9060119