1. Introduction
The assessment of soil and sediment contamination by trace metals is a priority in the study of water bodies. The danger of increased content of toxic metals in the ecosystem is due to the fact that most metals have high biological activity, and their high concentrations can cause a toxic effect in vivo. In addition, toxic metals are slightly susceptible to biodegradation, and being in the biogeochemical cycle, they accumulate and are essentially not removed from the system. In this regard, constant monitoring is a primary and very important task to assess the toxic metal content in coastal soils and sediments of the rivers, especially in urbanized or industrial areas with a high level of technogenic load.
Coastal soils and sediments of rivers serve as a depositing medium of accumulating pollutants. Their chemical indicators reliably reflect the ecological condition of rivers and become of paramount importance in determining the degree of anthropogenic pollution of aquatic ecosystems, as well as their initial state, which are necessary for subsequent ecological and geochemical monitoring of the river network. However, in the sediments of rivers with a high flow rate, indicators of metal content do not reflect the complete picture of the pollution of the biota with toxic metals [
1]. This is typical for the rivers of the Zarafshon Valley with a high declivity. As a rule, the concentration of toxic metals in water is lower than in sediments. This is largely determined by their rapid transition from a dissolved state into suspended matter, which has a high sorption capacity, and vice versa. Therefore, bottom sediments in rivers accumulate information about heavy metal pollution in the water [
2,
3].
Soil and sediment pollution with toxic metals (TMs) has been attracting increasing interest. However, assessment of eco-environmental and human risks, particularly in rapidly industrialized and urbanized areas of the Zarafshon Valley, remains limited. The Tajikistan Government is working on an international framework on “Water for Sustainable Development, 2018–2028”. One of the key factors of this project is to establish effective management of the prevention of water resource contamination. Heavy metal pollution is the main aim of the discussion concerning the quality of soil and sediments of rivers, as well as health and remediation in Tajikistan.
The Zarafshon is a transboundary river between Tajikistan and Uzbekistan, and its purity, especially water, is an area of interest for both countries. In the aquatic systems of rivers, the processes of sorption of toxic metals from water into bottom sediments and the reverse process of desorption—from bottom sediments into water are constant and occurs everywhere. The migration of toxic metals from bottom sediments into water depends on many parameters, both chemical and physical. The chemical composition of bottom sediments is actively affected by the geological and geochemical features of the area (geogenic), as well as anthropogenic impacts. During floods, spring waters actively wash away particles of rock and soil into the water, thereby forming bottom sediments of rivers. In addition, strong winds are capable of raising dust from the surface of the earth, which later settles on the surface of rivers.
It should be noted that bottom sediments in the valley are mainly formed due to the washout of soil rocks. Moreover, for mountain rivers, the formation of bottom sediments mainly occurs due to the washing away of rocks, which consists of quartz sand and feldspars. Feldspars do not have sufficient hardness. They can be easily broken down and are carried away downstream of rivers, forming loams in a more calm flow.
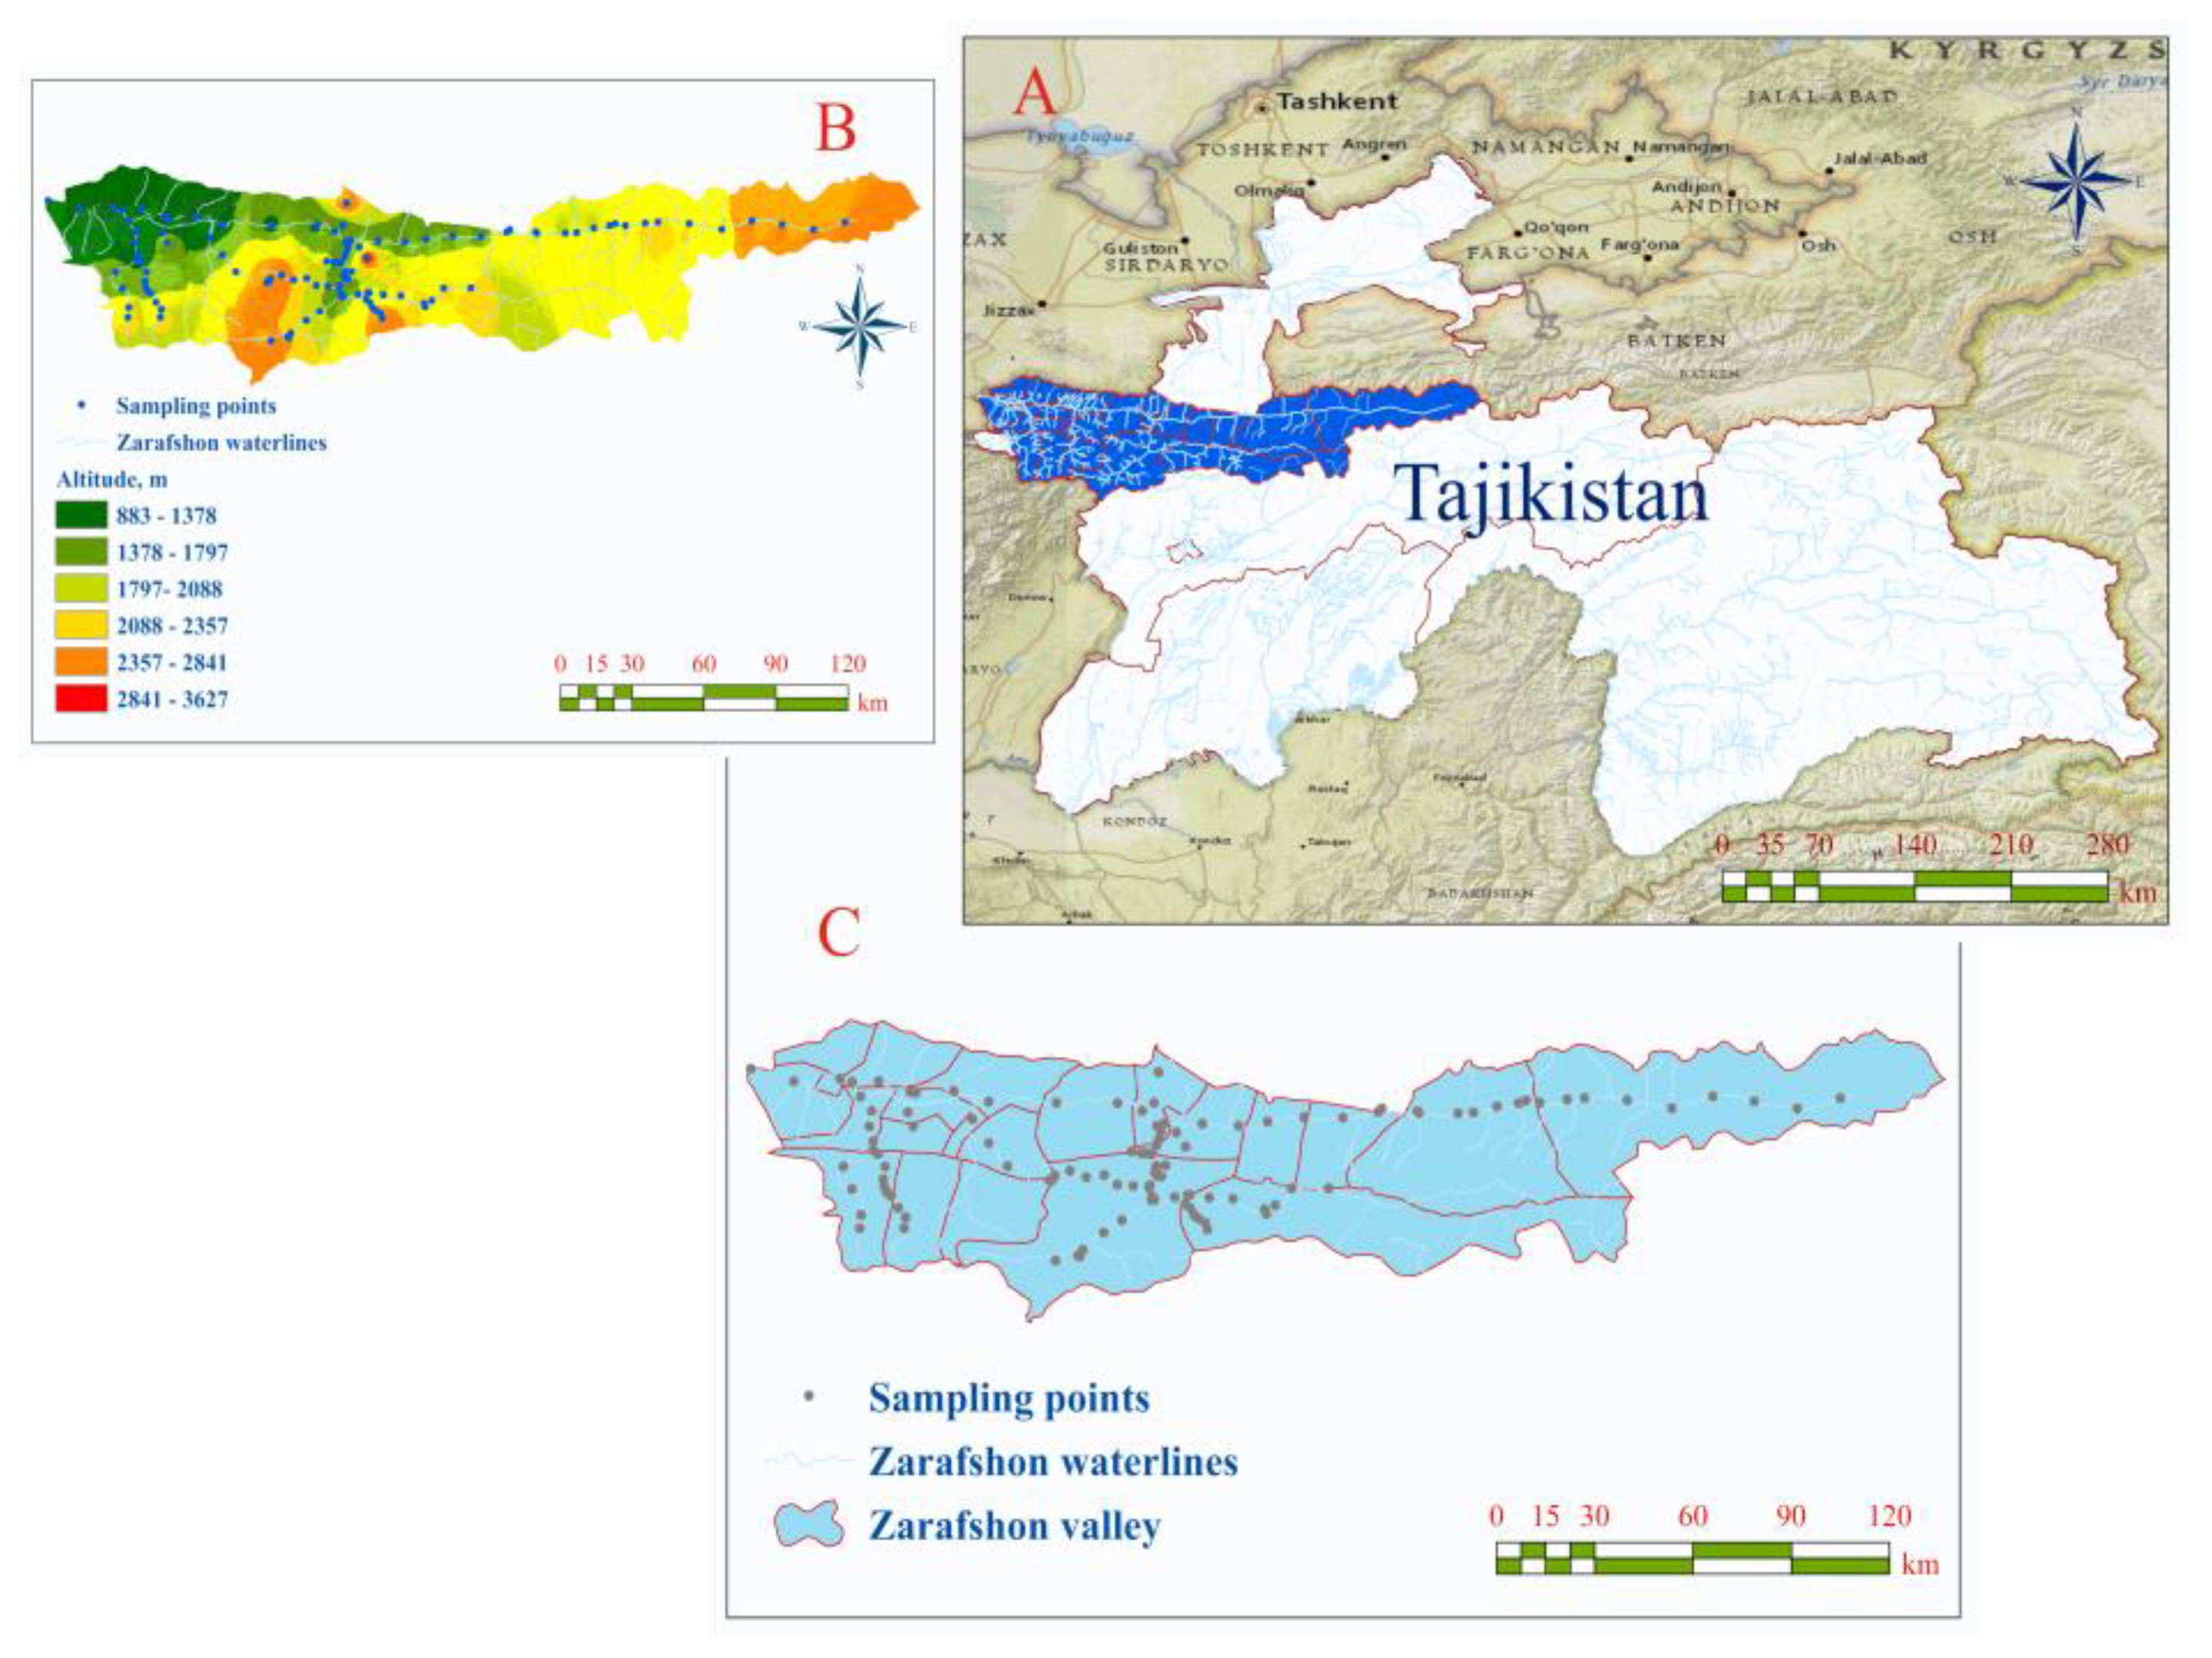
The Zarafshon River Basin consists of several zones with different geological composition. According to Vinogradov, the Zarafshon River Basin is divided into Turkestan-Alai, Turkestan-Zarafshon and Zarafshon-Gissar tectonic belts [
4]. In the Zarafshon-Gissar Belt, there are widely developed deposits of Au, Ag, Sb, Hg, W, Sn, Pb, Zn and other types of minerals. The mercury-antimony geochemical belt covers the ore deposits of Shing-Magiyan, Konchoch, Djidjikrut, Yagnob-Zakhob [
5]. Because of this, in the valley of Zarafshon mining industry is developed. Most of them are based on the extraction and processing of non-ferrous metals. Among them, the “Anzob” mining and metallurgical enterprises (AMME) have been operating for over 60 years. The “Taror” mining and metallurgical enterprises (TMME) have operated for 80 years in the last century. Recently, mining activity is underway at the Kumargi bolo and Konchoch gold deposits. AMME specializes in the production of antimony-mercury; TMME focuses on gold production. In Kumargi bolo and Konchoch, the complex mining of gold, antimony and mercury is carried out.
The activity of mining enterprises leads to soil and sediment pollution in investigated regions. In the Djidjikrut, Yagnob, Mastchohi kuhi regions, there are very small and low-fertility lands that are suitable for agricultural use. Most of the people use transported soil for farming. In many places, these lands are located above rivers and cannot be irrigated.
This study is the second part of a study of the distribution of chemical elements in the soil and sediment of the Zarafshon Valley. Detailed information on the geology and geochemical features of the region under study is described in the first part of this study, which is devoted to the sediment and soil geochemistry of the Zarafshon Valley, northwestern Tajikistan. The main goal of the study is to study the purity of the soil, the presence of toxic elements in the Zarafshon Valley under conditions of increased anthropogenic and natural impacts. As noted above, industrial activity is developed in this region, and water-treatment facilities and open wastewater storage of these industrial plants are located close to rivers. In this regard, there is always a high risk of pollution of rivers with toxic metals. At present, monitoring the metal pollution of transboundary rivers such as Zarafshon is an important task.
3. Results
The content of 38 elements—major elements (rock-forming) Si, Ti, Al, Fe, Mn, Mg, Ca, K, Na and trace elements Sc, V, Cr, Co, Ni, Zn, As, Br, Rb, Sr, Zr, Sb, Cs, Ba, La, Ce, Nd, Sm, Eu, Gd, Tb, Tm, Yb, Hf, Ta, W, Hg, Th, U were determined. The results of the concentrations of all elements in 116 soil and sediment samples are shown in [
15], along with reference values of the upper continental crust (UCC) [
16] and the chemical composition of the suspended matter of the world’s rivers (SMWR) [
17].
As this research is focused on the assessment of the ecological state of the investigated region, only the toxic elements such as V, Cr, Mn, Co, Ni, Zn, As, Sb, Ba, W, Hg, as well as Th and U (
Table 2) are discussed. The content of these elements exceeded the levels established by national regulations [
18] and neighboring Russian Federation [
19], and they can be considered as contaminants.
Despite weak radioactivity, natural uranium and thorium are toxic, and their high concentration in soils increases the radioactive background. When ingested through the use of vegetation or by air–water, uranium and thorium act on all organs, being a general cellular poison. The interaction of uranium, like many other toxic metals, is practically irreversible. It may bind to proteins, primarily to the sulfide groups of amino acids, disrupting their function. The molecular mechanism of action of uranium is associated with its ability to suppress enzyme activity. Thorium is weakly toxic, but as a naturally radioactive element, it contributes to the natural background of an organism’s irradiation [
20].
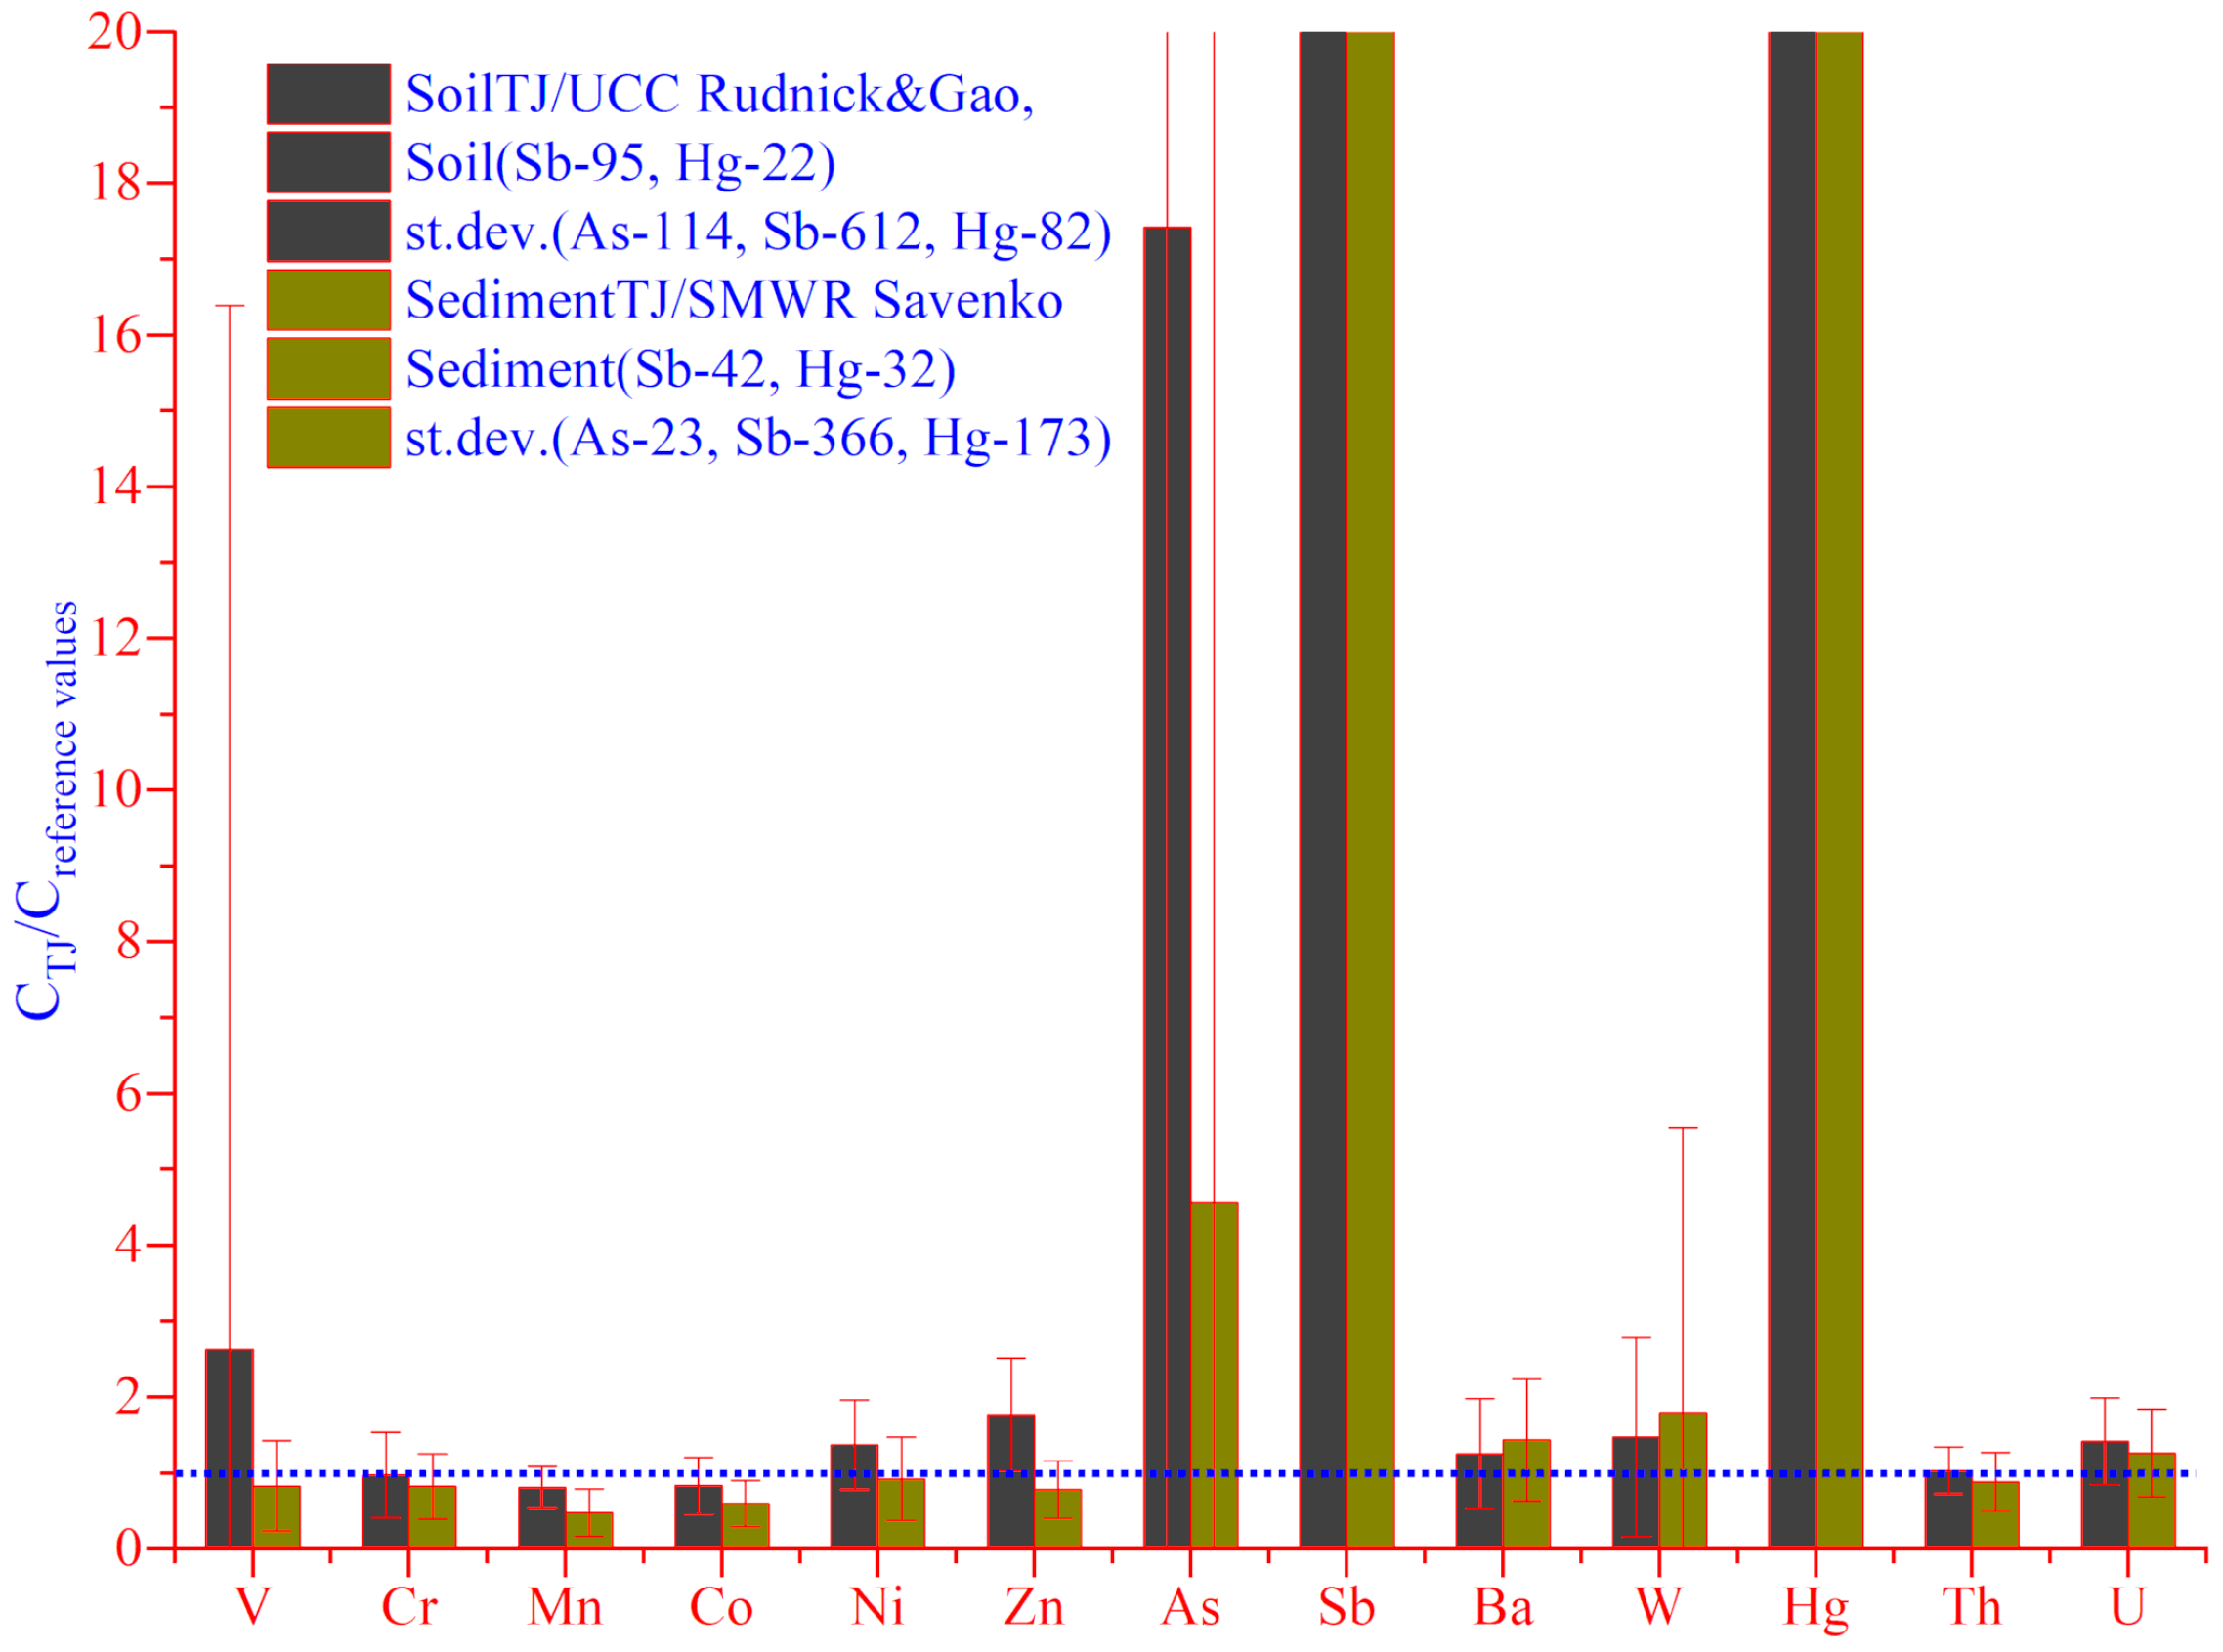
Moreover, for a better description and comparison in the column chart, the average values of soil were normalized by UCC and average values of sediment by SMWR (
Figure 2). According to our data provided in [
15] and (
Table 2), the coefficient of variation of experimental data varied between 29% for Th and 660% for As in soil samples and between 44% for Th and 869% for Sb in sediment samples. As well as for Hg which contents were very high, the coefficient of variation was 369% in soil and 534% in sediments, respectively. The high values of standard deviations (
Figure 2) and coefficients of variation (
Table 2) for As, Sb and Hg are associated with their increased concentrations in some regions with anthropogenic impacts (for example, around AMME, Konchoch, Mogiyon and Kurmagi bolo).
4. Discussion
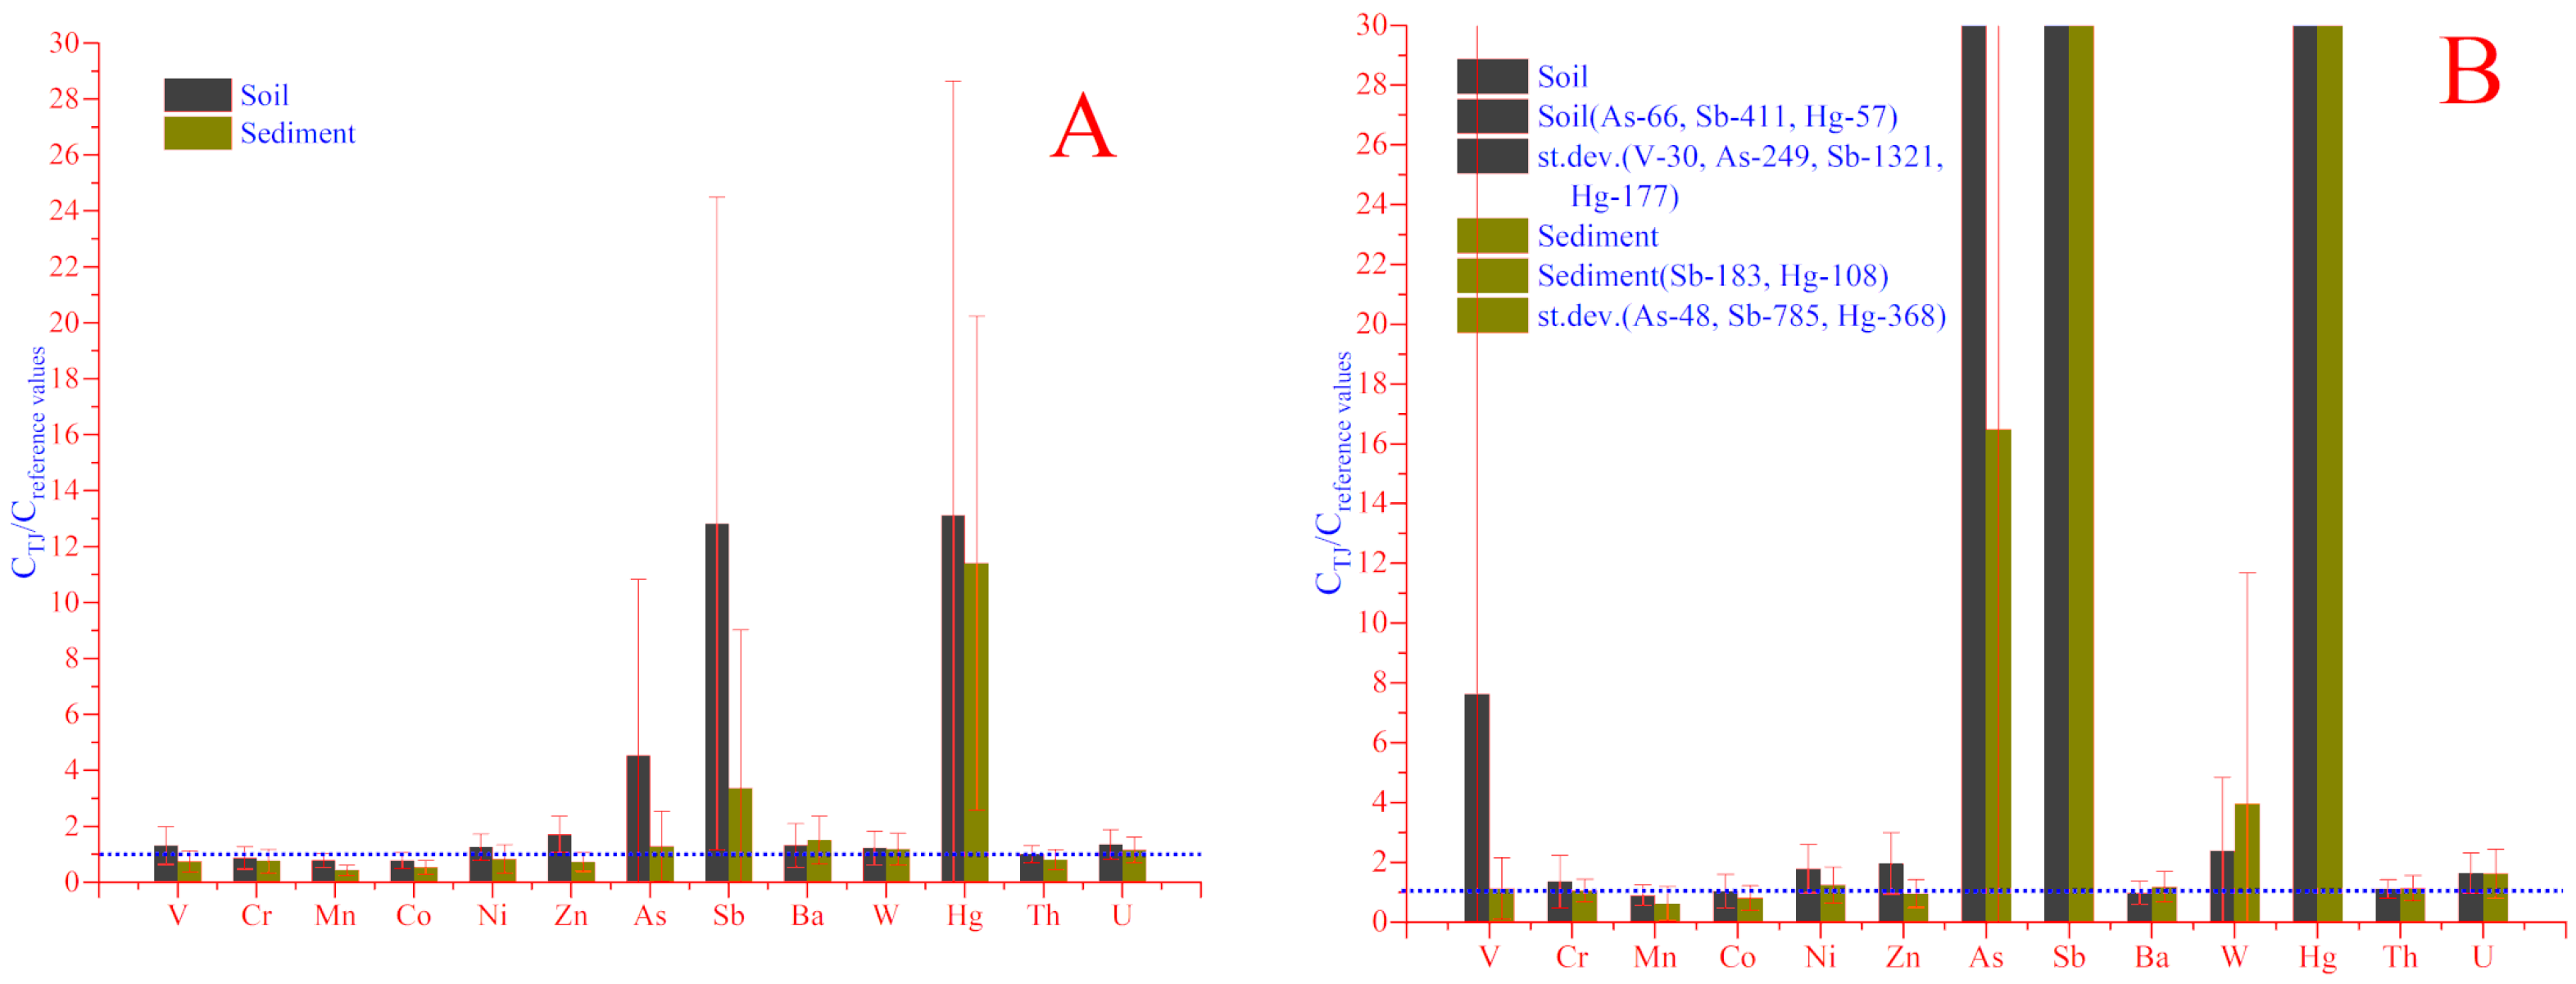
To appreciate the impact of natural and anthropogenic sources on the distribution of elements, all sampling zones were conditionally divided into two groups: the first ones includes samples unexposed to anthropogenic impacts (92 soil and 91 sediment samples, respectively), which were collected directly on the banks of the lakes, rivers and mountain tributaries, where any anthropogenic impact is absent (
Figure 3A). It should be noticed that the mountain bedrocks located directly in the sampling sites (e.g., pegmatite and granitoids) have a great impact on the elemental content of soil and sediment. The second group includes samples that were exposed to anthropogenic activity (24 soil and 25 sediment samples, respectively). These samples were collected around road tunnels, near the industrial zones, coal mining, mines and adits that appeared during the geological exploration. Some of the adits related to the mining and processing plants are still under exploration. After dividing into two groups, all data were separately normalized using reference values. As expected, the impact of anthropogenic sources was still quite high. In the unexposed soil and sediment samples (
Figure 3A), the content of As, Sb, Hg and partially Zn, Ba and U remained still higher than reference values.
It is known that most metals in a mobile form (cations or oxyanions) exhibit high toxicity and mobility (migration ability). In this research, a study to establish the concentration of mobile forms of toxic metals was not carried out due to the limitation of the laboratory facilities. This approach would make it possible to more objectively assess the ecological condition of soil and sediment compared by the study of the mass fraction of all forms.
The high content (except As, Sb, Hg) of V, Cr, Ni, Zn, Cs and W, as shown in (
Figure 3B) indicates soil exposure to anthropogenic impacts. The high content of V was determined in soil samples collected around the Anzob mining and processing plant (i-06, i-15, i-16 and i-17), in the gold-mining combine of Kumargi bolo (i-39 and i-40), around geological prospecting objects (adits) of Chore (i-42, i-44, i-45), and especially in the soil samples collected around the Shahriston Tunnel. During the tunnel construction, the shredded solid rocks were taken out and scattered on the surface over more than 7500 m2 near the Shahriston tributary. Thus, this may be one of the main sources of the high content of elements in soil and sediment in Shahriston. The content of V in soil of these areas (i-77, i-78 and i-79) varied between 154 and 14,500 mg/kg [
15].
In the case of sediments exposed to anthropogenic impact, except As, Sb, Hg, high content of Ni, Zn, W and U was also determined. Though the average values of V and Cr were close to the reference values (
Figure 3B) and their content varied between 27.3 and 655.0 and 20.5–147.0 mg/kg, respectively [
15]. As can be seen in (
Figure 3B), anthropogenic factors have an influence on the content of some toxic elements. However, even in the absence of any anthropogenic loading, the content of Sb, As, and Hg remains high. This is especially evident in the zones of mercury–antimony deposits. Except for this, the influence of geochemical features leads to increasing the content of natural radioactive elements–thorium (Th) and uranium (U) in all studied samples. Their average values were close to reference values (
Figure 3A,B), but if we consider each sample individually, it can be clearly seen that in some samples, the content of Th and U is higher than reference values [
15].
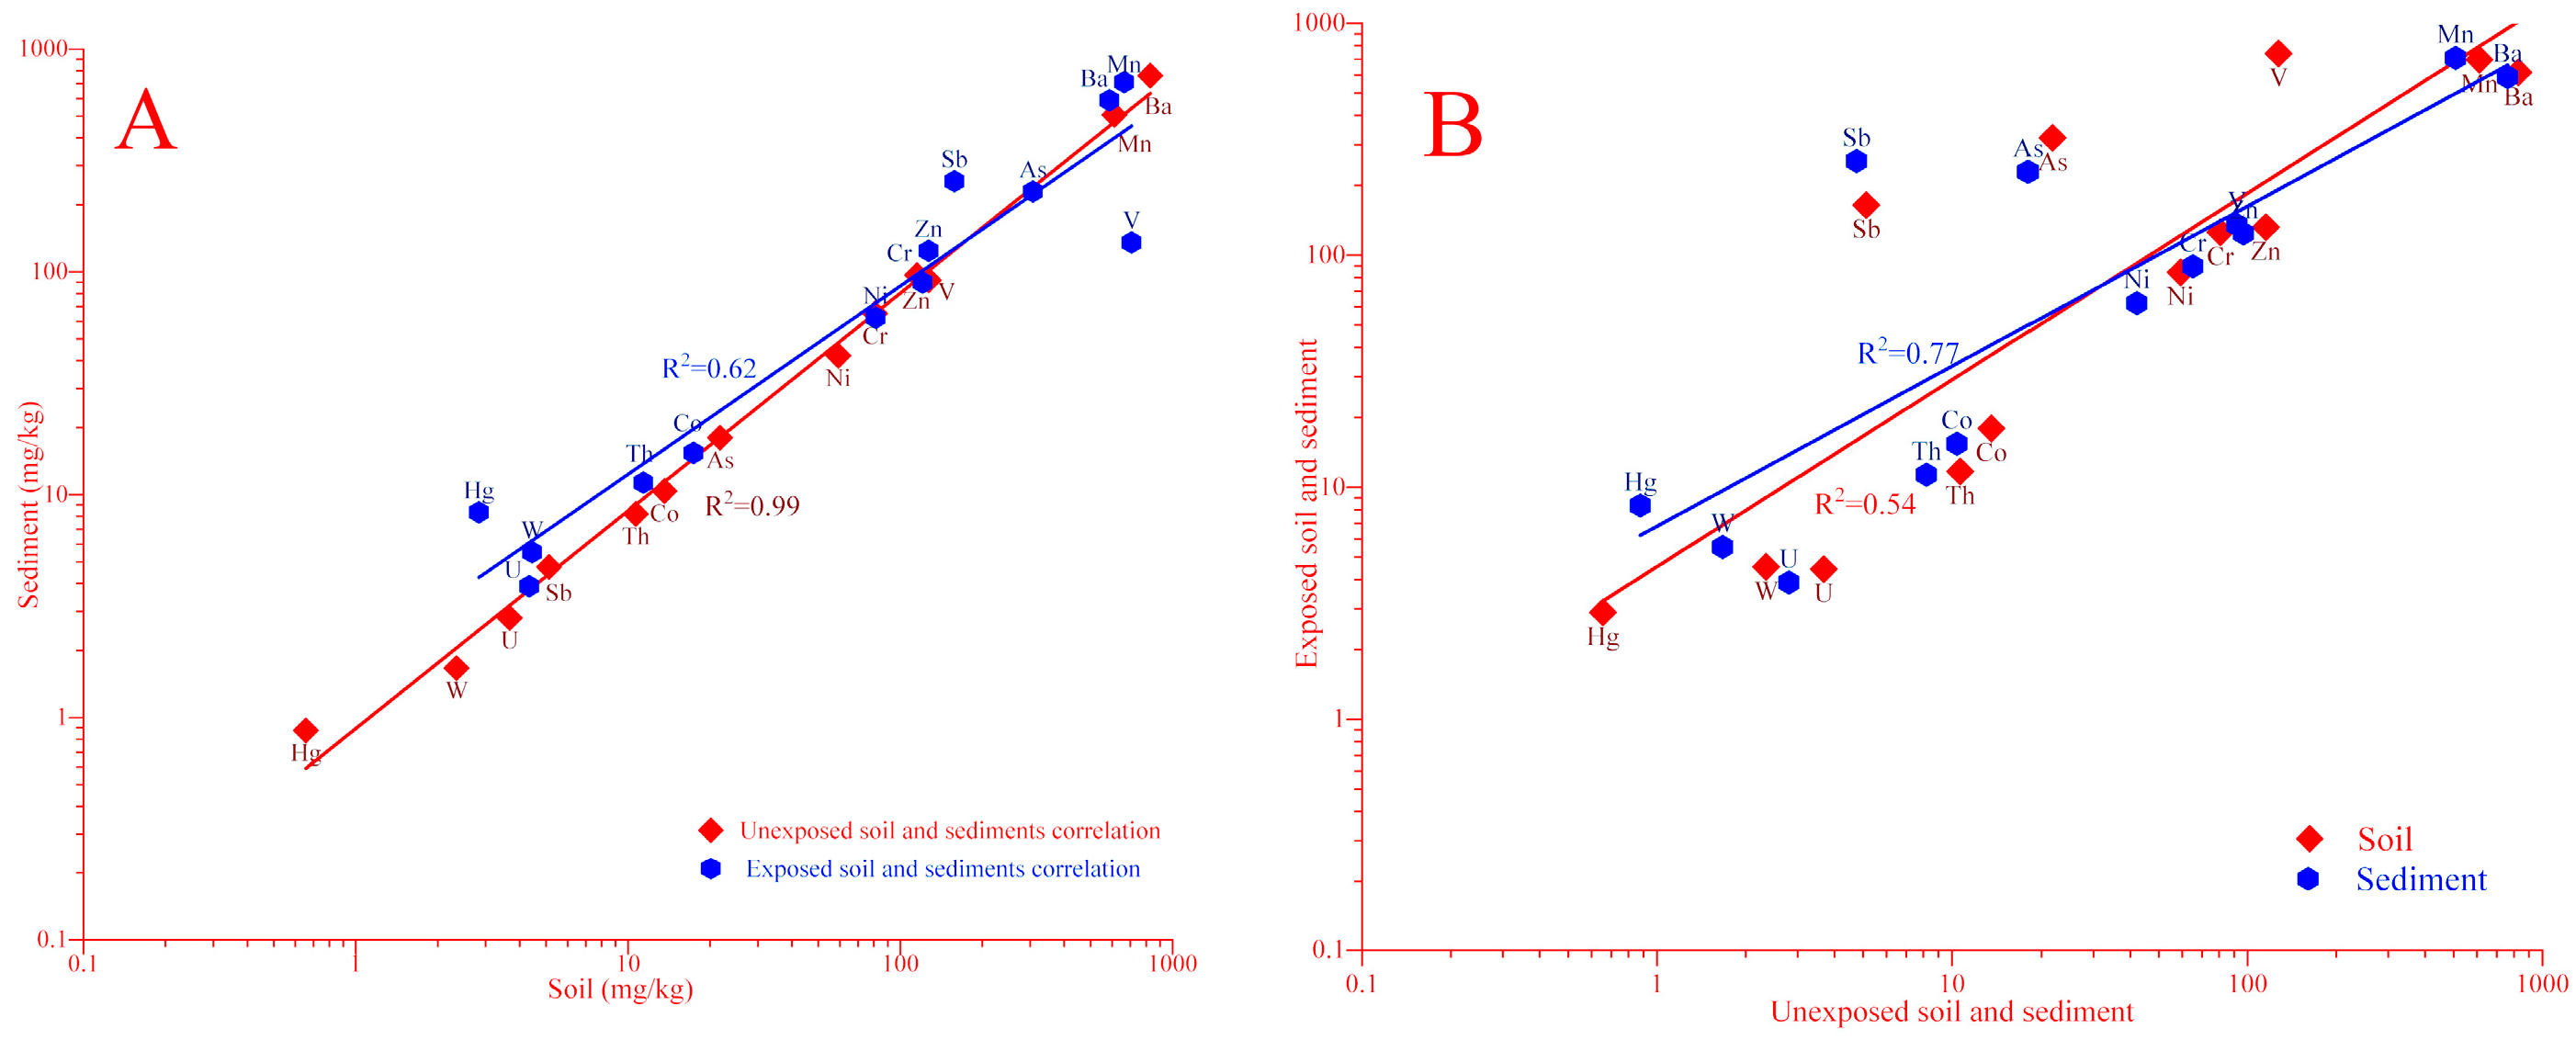
The average values of elements in unexposed soils and sediments, illustrated in (
Figure 4A—red line) indicates that there was a good linear correlation between them, which can be better described by a Pearson’s correlation coefficient equal to 0.99 at
p < 0.01. In the absence of normal distribution, the nonparametric Spearman correlation coefficient is the optimal approach for better interpretation of data. The relative similarity in terms of the content of investigated elements can evidence the practical identity of bottom sediments and soils. However, in the case of anthropogenically exposed soil and sediment (
Figure 4A—blue line), the correlation coefficient equal to 0.62. It can be seen that the statistical relationship between the average values of exposed and unexposed soil and sediment are very different. This indicates great changes in the elemental balance in the anthropogenically exposed samples.
In addition, the correlation between the anthropogenically exposed and unexposed samples (
Figure 3B lines red and blue) confirms that the higher contents of trace metals are in anthropogenically exposed samples. As it can be seen in (
Figure 4A), the values of Hg, Sb and V of anthropogenically exposed samples do not lie on the correlation line. It can be explained by the large variation in their values (
Table 2). In addition, the correlation between the anthropogenically exposed and unexposed samples (
Figure 3B lines red and blue) confirms that the higher contents of trace metals are observed in anthropogenically exposed samples.
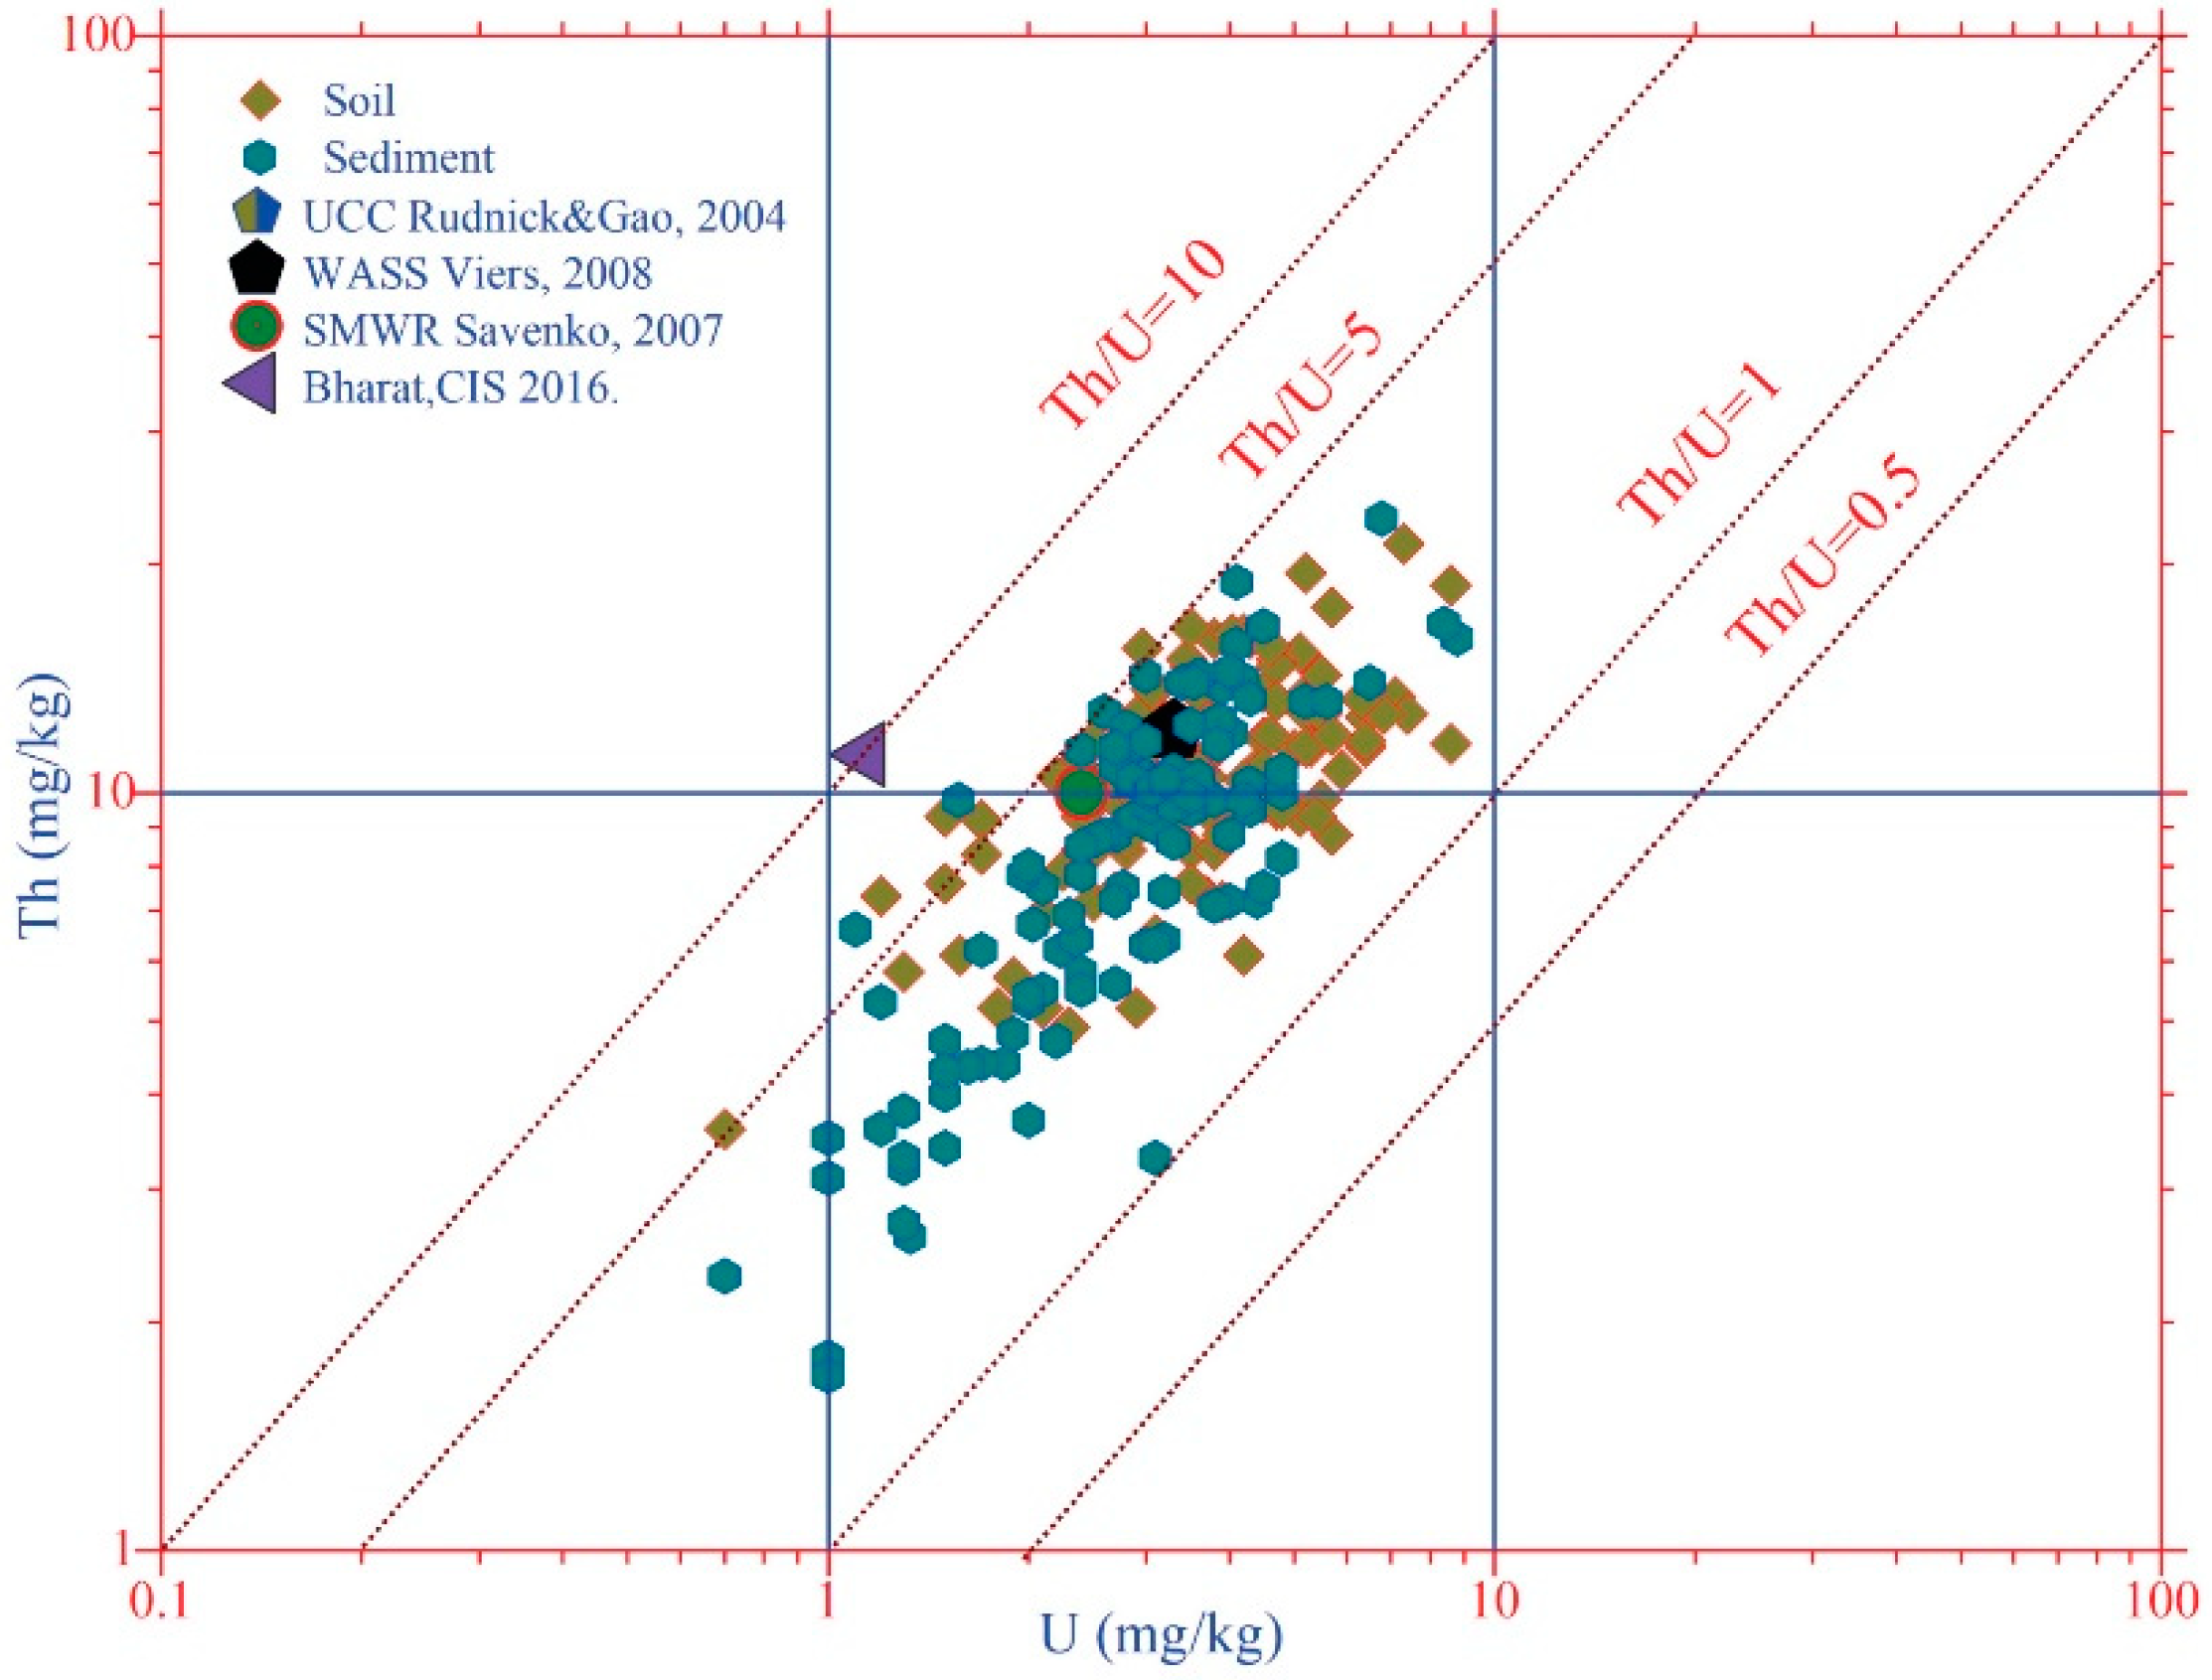
One of the important indicators of soil pollution is the ratio of thorium to uranium (Th/U). The Th/U ratio of 3–5 is observed in the overwhelming majority of soils in different regions, countries and continents, regardless of their types of origin [
20,
21]. The result of our study showed that the Th/U ratio in soils and in bottom sediments is predominantly at the regional level of 3.5–5 (
Figure 5). In rare cases, the Th/U ratio in the studied soils varies from 1.3 (at Th/U = 11.6/8.6 mg/kg) to 6.2 (at Th/U = 9.3/1.5 mg/kg) and in bottom sediments from 1.1 (at Th/U = 3.3/3.1 mg/kg) to 6.2 (at Th/U = 9.8/1.6 mg/kg), respectively.
In soils in the zone of anthropogenic impact (around the up and downstream of the Djidjikrut River, in the Konchoch adits and Mogiyon), the Th/U ratio is less than 3. Low Th/U ratios are observed around the upstream of Sarvoda, Mastchohi kuhi, Haftkul and the downstream of the Zarafshon River (in the Panjekent city), where practically there is no anthropogenic impact. In addition, low values of the Th/U ratio are observed in the main part of samples of bottom sediments. However, in the samples of bottom sediments from the lower reaches of the Shing and the Konchoch adit, the Th/U ratio is 6.0 (at 9.8/1.6 mg/kg) and 6.2 (at 6.6/1.1 mg/kg), respectively. According to [
20,
21], if the Th/U ratio is less than 2, and even less than 1, then it can be asserted that the studied samples do not belong to magmatic formations but to metasomatic or metasomatically transformed rocks. In addition, the presence of igneous rocks (Th/U >5) is also observed in some places.
The higher content of thorium and uranium content over UCC in soils is observed around the lower reaches of Djidjikrut and Yagnob rivers, around tributary Pete, in the Mastochohi kuhi region, Shakhriston and Mogiyon. In the sediments, a higher thorium and uranium content was found in the lower reaches of the Djidjikrut, in the tributaries of the Shakhriston and Mogiyon. The exceedance in all the indicated places varies 1–2.5 times, which is typical for these regions. The serious geochemical changes and health hazards by uranium and thorium are not observed in soils and sediments.
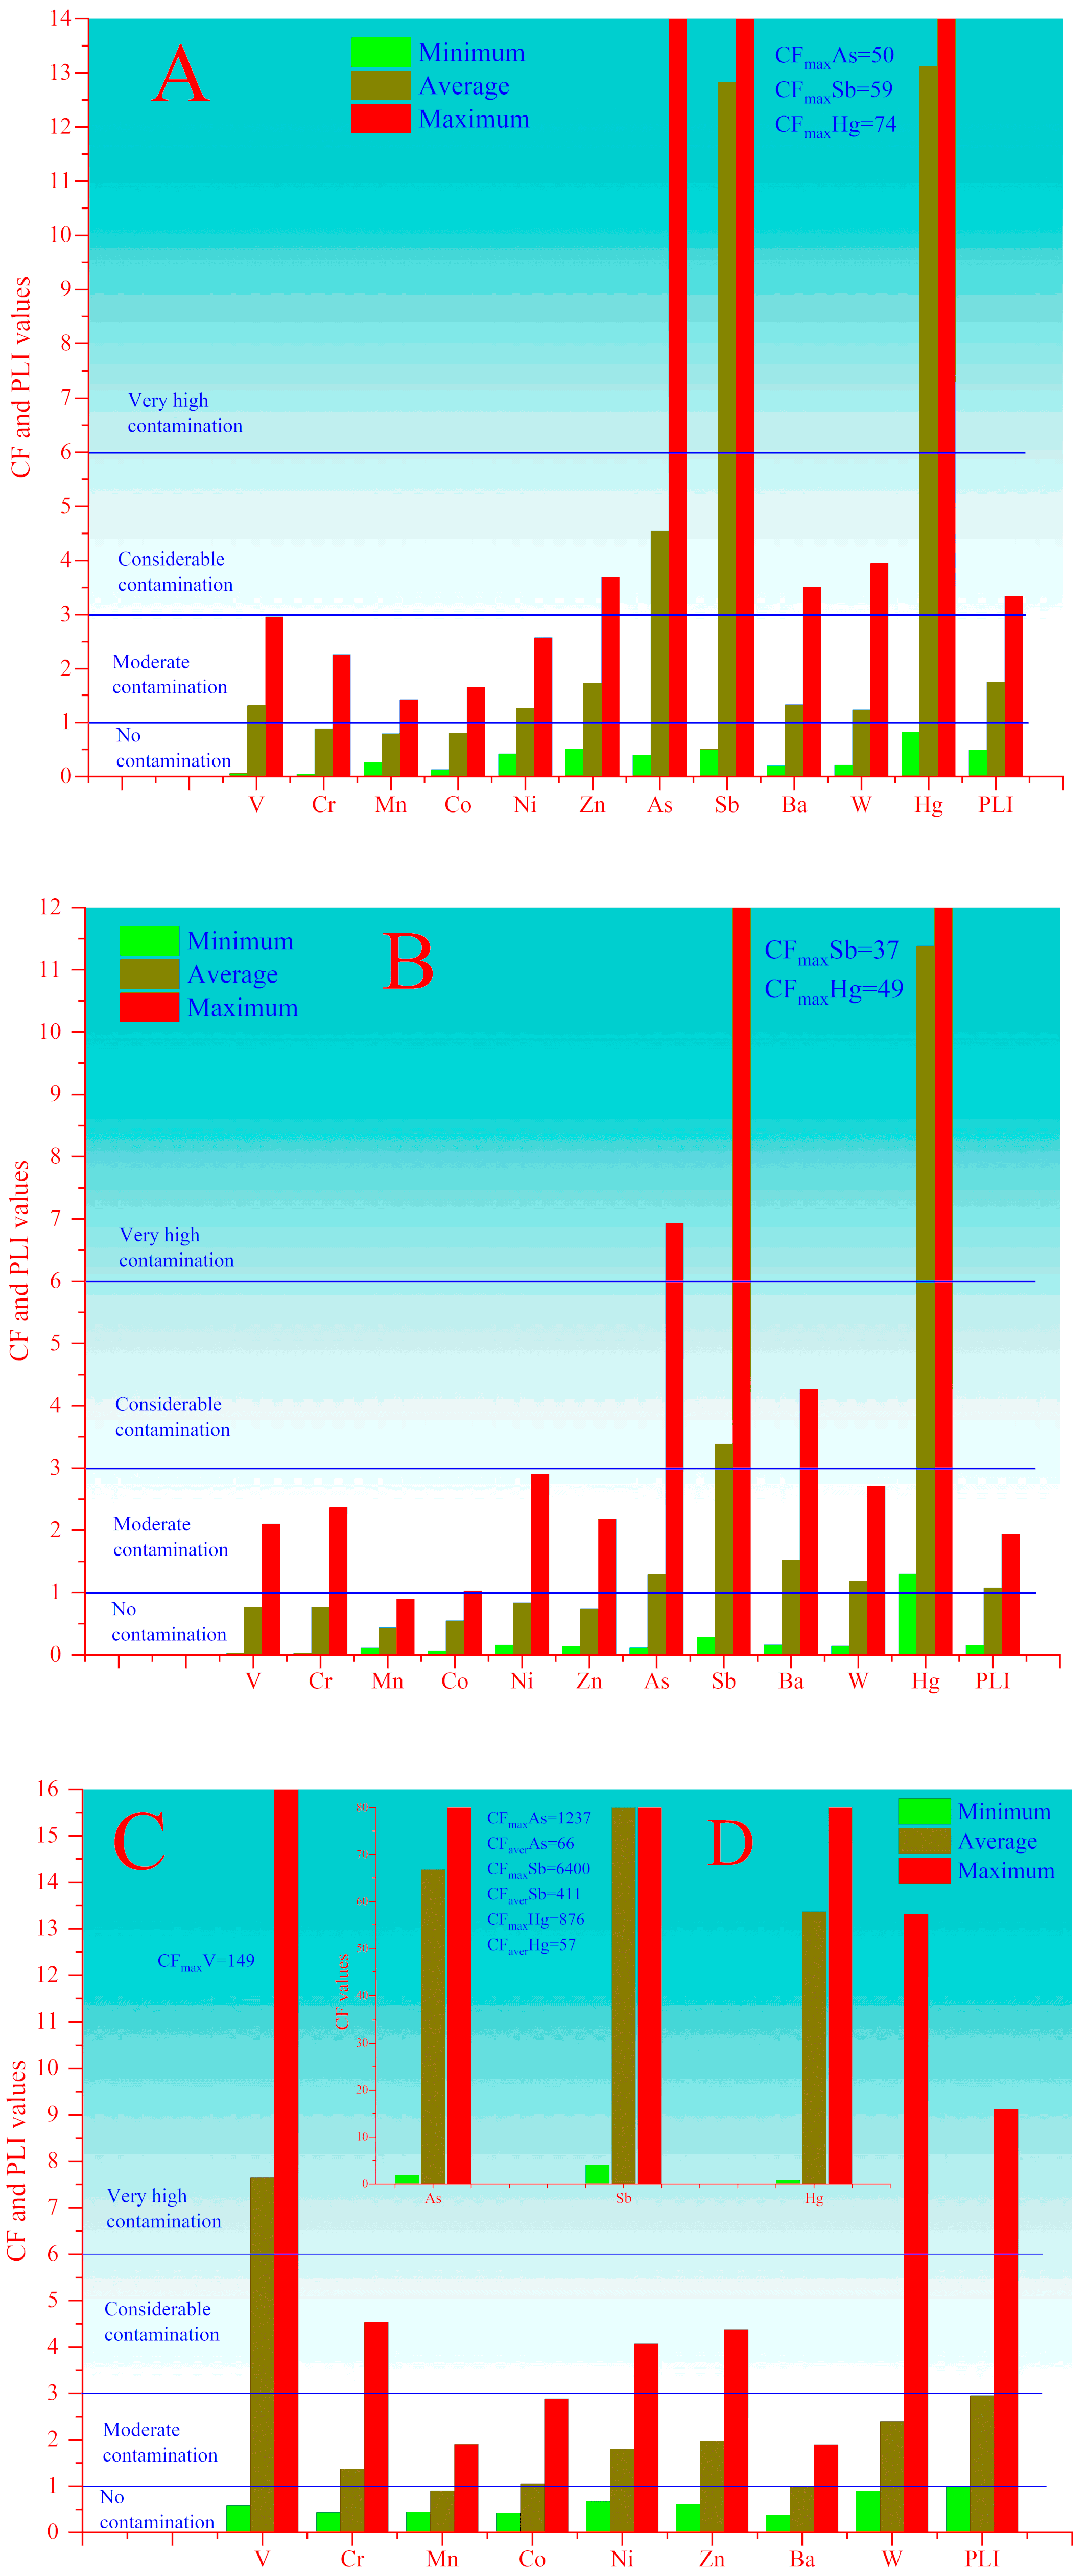
According to (
Figure 6A and
Table S1) the
CF values (more precisely comparing by UCC) in the unexposed soils are moderately contaminated by V, Cr, Mn, Co, Ni and Zn, moderate to considerable contaminated by Ba and W, and considerable to very high contaminated by As, Sb and Hg. However, this is exclusively depending on the geochemical features of these regions. In the case of anthropogenically exposed soils (
Figure 6C,D and
Table S1), the
CF varies between 0.76 and 876 for Hg, 1.9–1237 for As, 4.05–6400 for Sb and 0.58–149 for V. The minimum
CF values for these elements (
Figure 6A and
Table S1) were found in the upper reaches of the Zarafshon (Mastchohi kuhi) Yagnob, Sarvoda rivers (including the Alovdin lakes), as well as in upstream of Mogiyon river, which are assessed as clean zones.
In (
Figure 6B and
Table S1) shows the values of
CF for unexposed sediments. There is no contamination in unexposed sediments with Mn and Co. In addition, according to average values of
CF, there is no contamination with V, Cr, Ni and Zn; however, in individual places, values of
CF indicate moderate contamination. Average and maximum values of
CF for As and Sb indicate moderate to very high contamination, for Ba moderate to considerable contamination and for W moderate contamination. For Hg, even the lowest values of
CF indicate moderate contamination.
For anthropogenically exposed soils (
Figure 6C and
Table S1), the average values of
CF indicate very high contamination with V and moderate contamination with Cr, Ni, Zn, W, but for Mn, Co and Ba, the average values of
CF lie under the unit which indicates on the absence of contamination. The maximum values of
CF for V and W relate to the soils collected around Shahriston tunnel and Konchoch mine adit, respectively and indicate very high contamination. In addition, the high values of Cr, Ni and Zn for Konchoch mine adit point out moderate contamination. In the case of As, Sb, and Hg (
Figure 6D), the values of
CF vary in the following range 1.9–1237, 4–6400 and 0.7–876, respectively. The minimum values of
CF for Hg are observed in Saritag and Chore-3 (adit) 0.7–0.9, respectively. The average and maximum values of
CF in all anthropogenically exposed soil indicate very high contamination.
The
CF values of V, Cr, Ni, Zn and Ba indicate an absence of contamination in anthropogenically exposed sediments (
Figure 6E and
Table S1). However, the average and maximum values of
CF for W are higher than in anthropogenically exposed soil, which indicates considerable and very high contamination. In addition, anthropogenically exposed sediments (
Figure 6F and
Table S1) show characteristically very high contamination with As, Sb and Hg, which
CF values vary in the range 0.14–240, 0.49–3935 and 2.2–1818, respectively. In spite of the anthropogenic impacts in sediments from upstream of Djidjikrut River (around Anzob mining company), there is no contamination with As (CFAs = 0.14), and
CF values for Sb and Hg indicate very high contamination. The minimum values of
CF for As and Sb (CFAs = 0.8 and CFSb = 0.4) were found in Saritag and indicated an absence of contamination. The average and maximum values of
CF for As, Sb and Hg in all anthropogenically exposed sediments indicate very high contamination.
The values of
PLI for soils and sediments in the investigated region are shown in (
Table S1). In the case of unexposed soil and sediment samples (
Figure 6A,B), the
PLI values lower than unity were observed only upstream of Yagnob, Iskandardarya, Alovdin lakes and Sarvoda, as well as at upstream of Zarafshon, Shing and Mogiyon rivers, which can be considered unpolluted. All anthropogenically exposed samples may be considered as polluted since the
PLI ≥1.
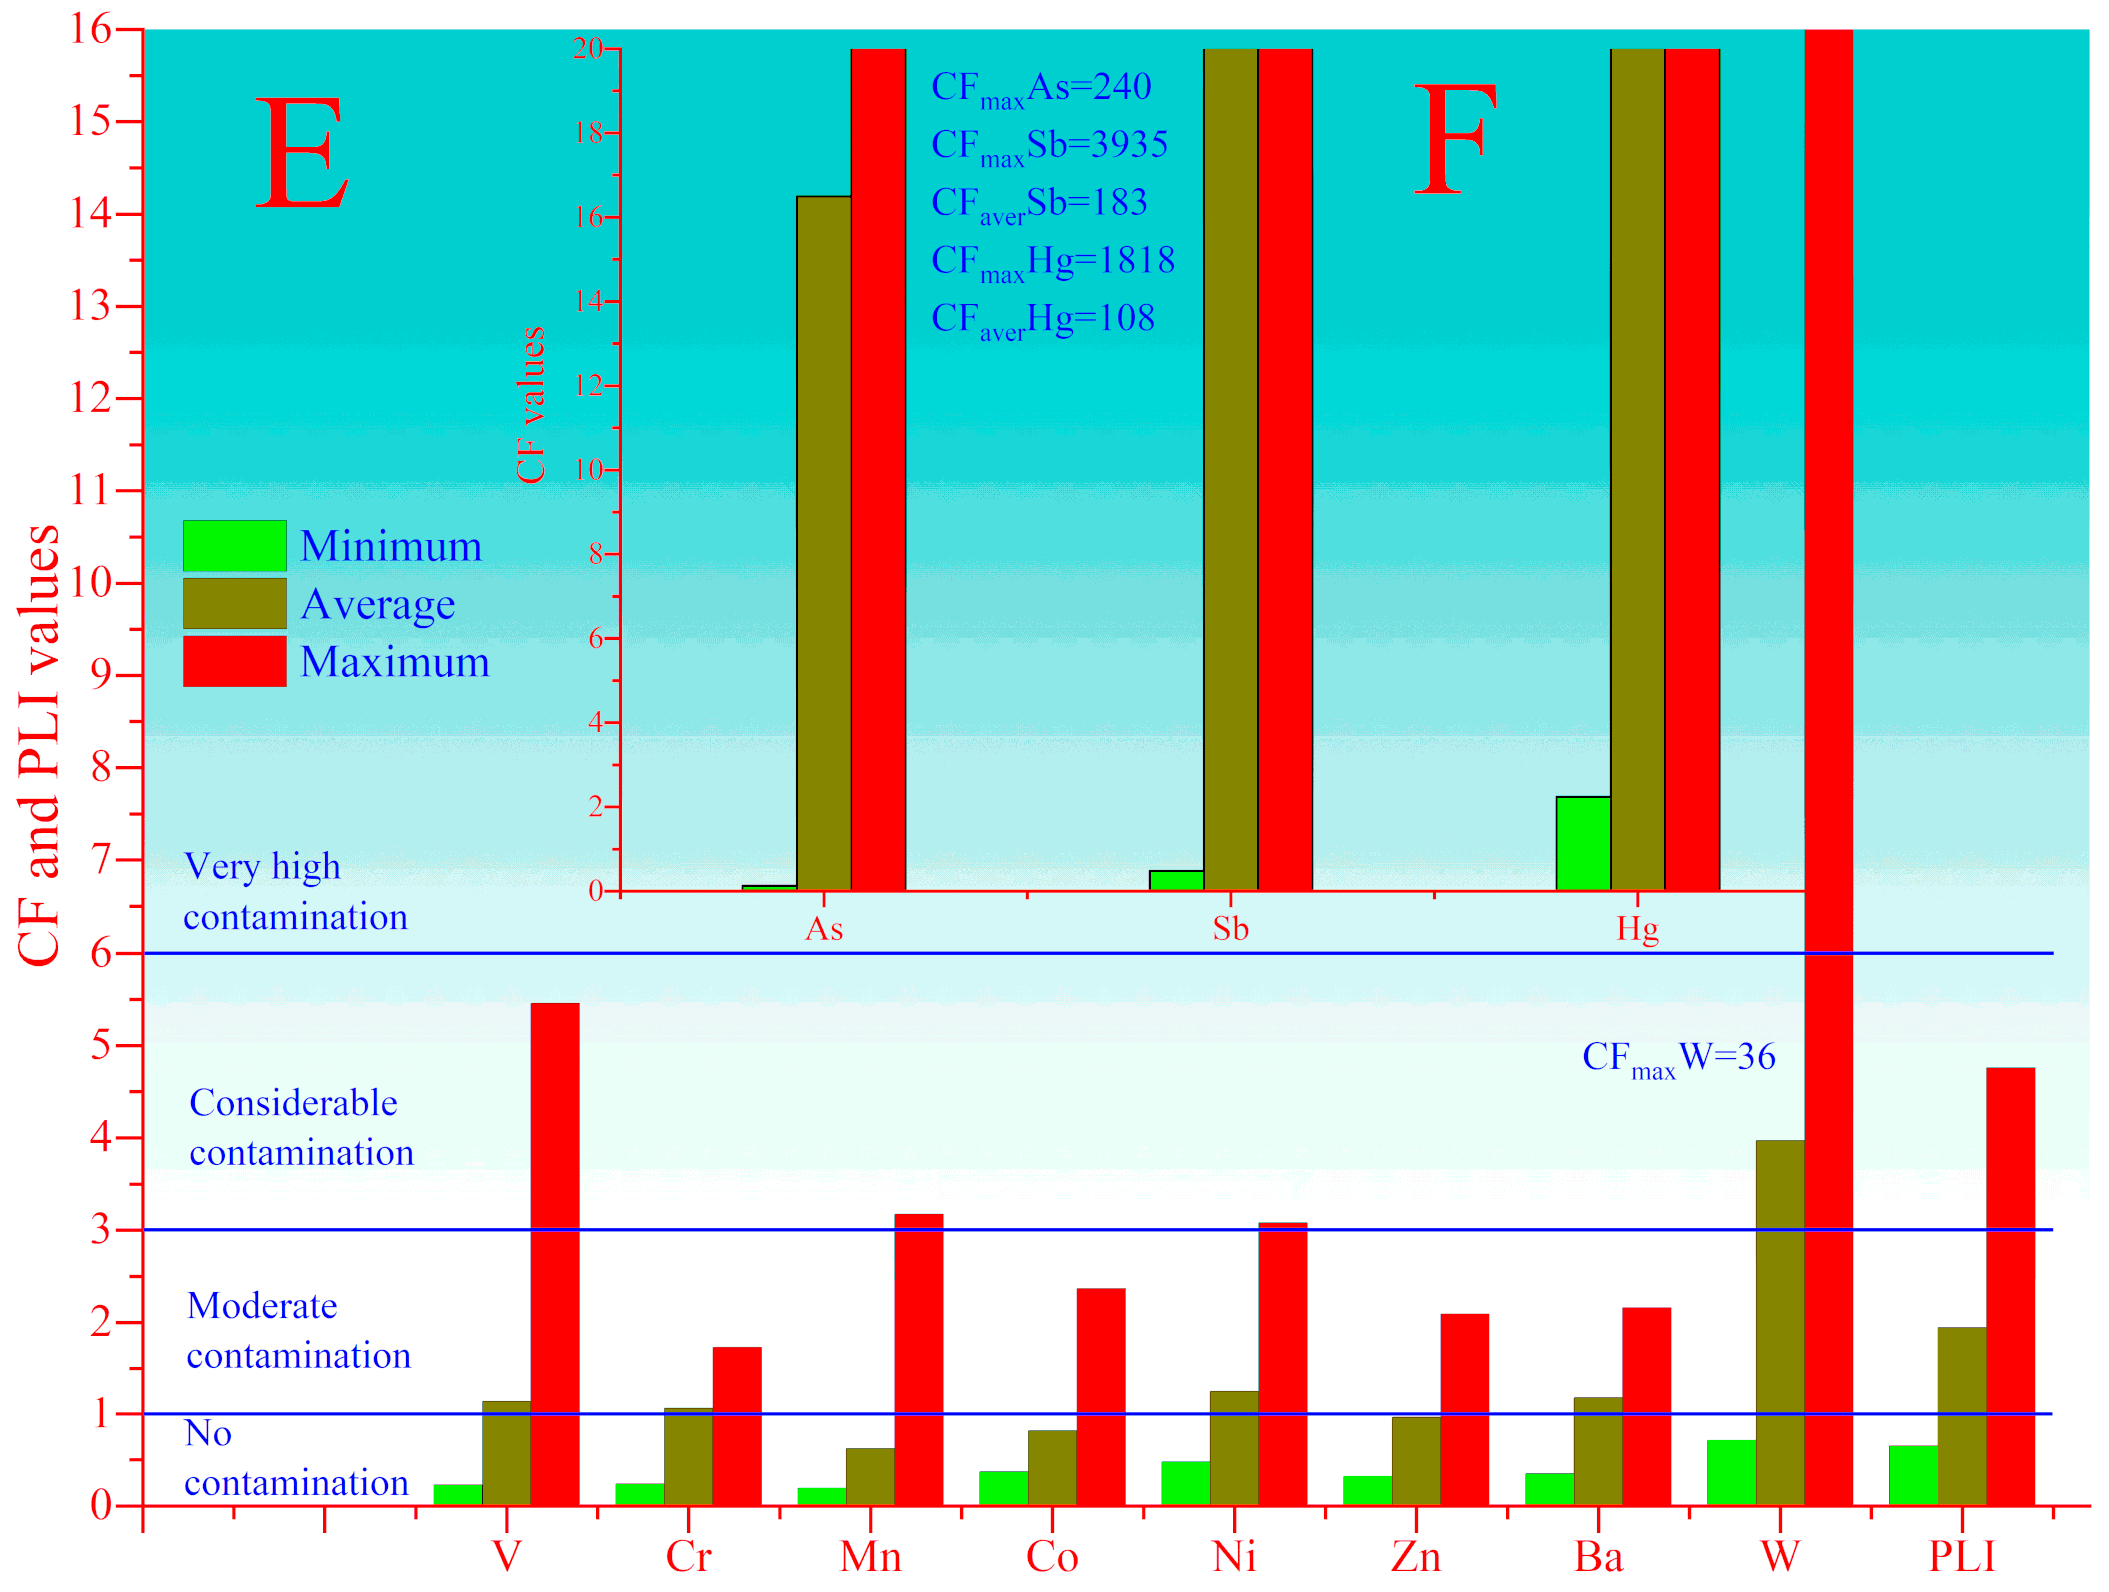
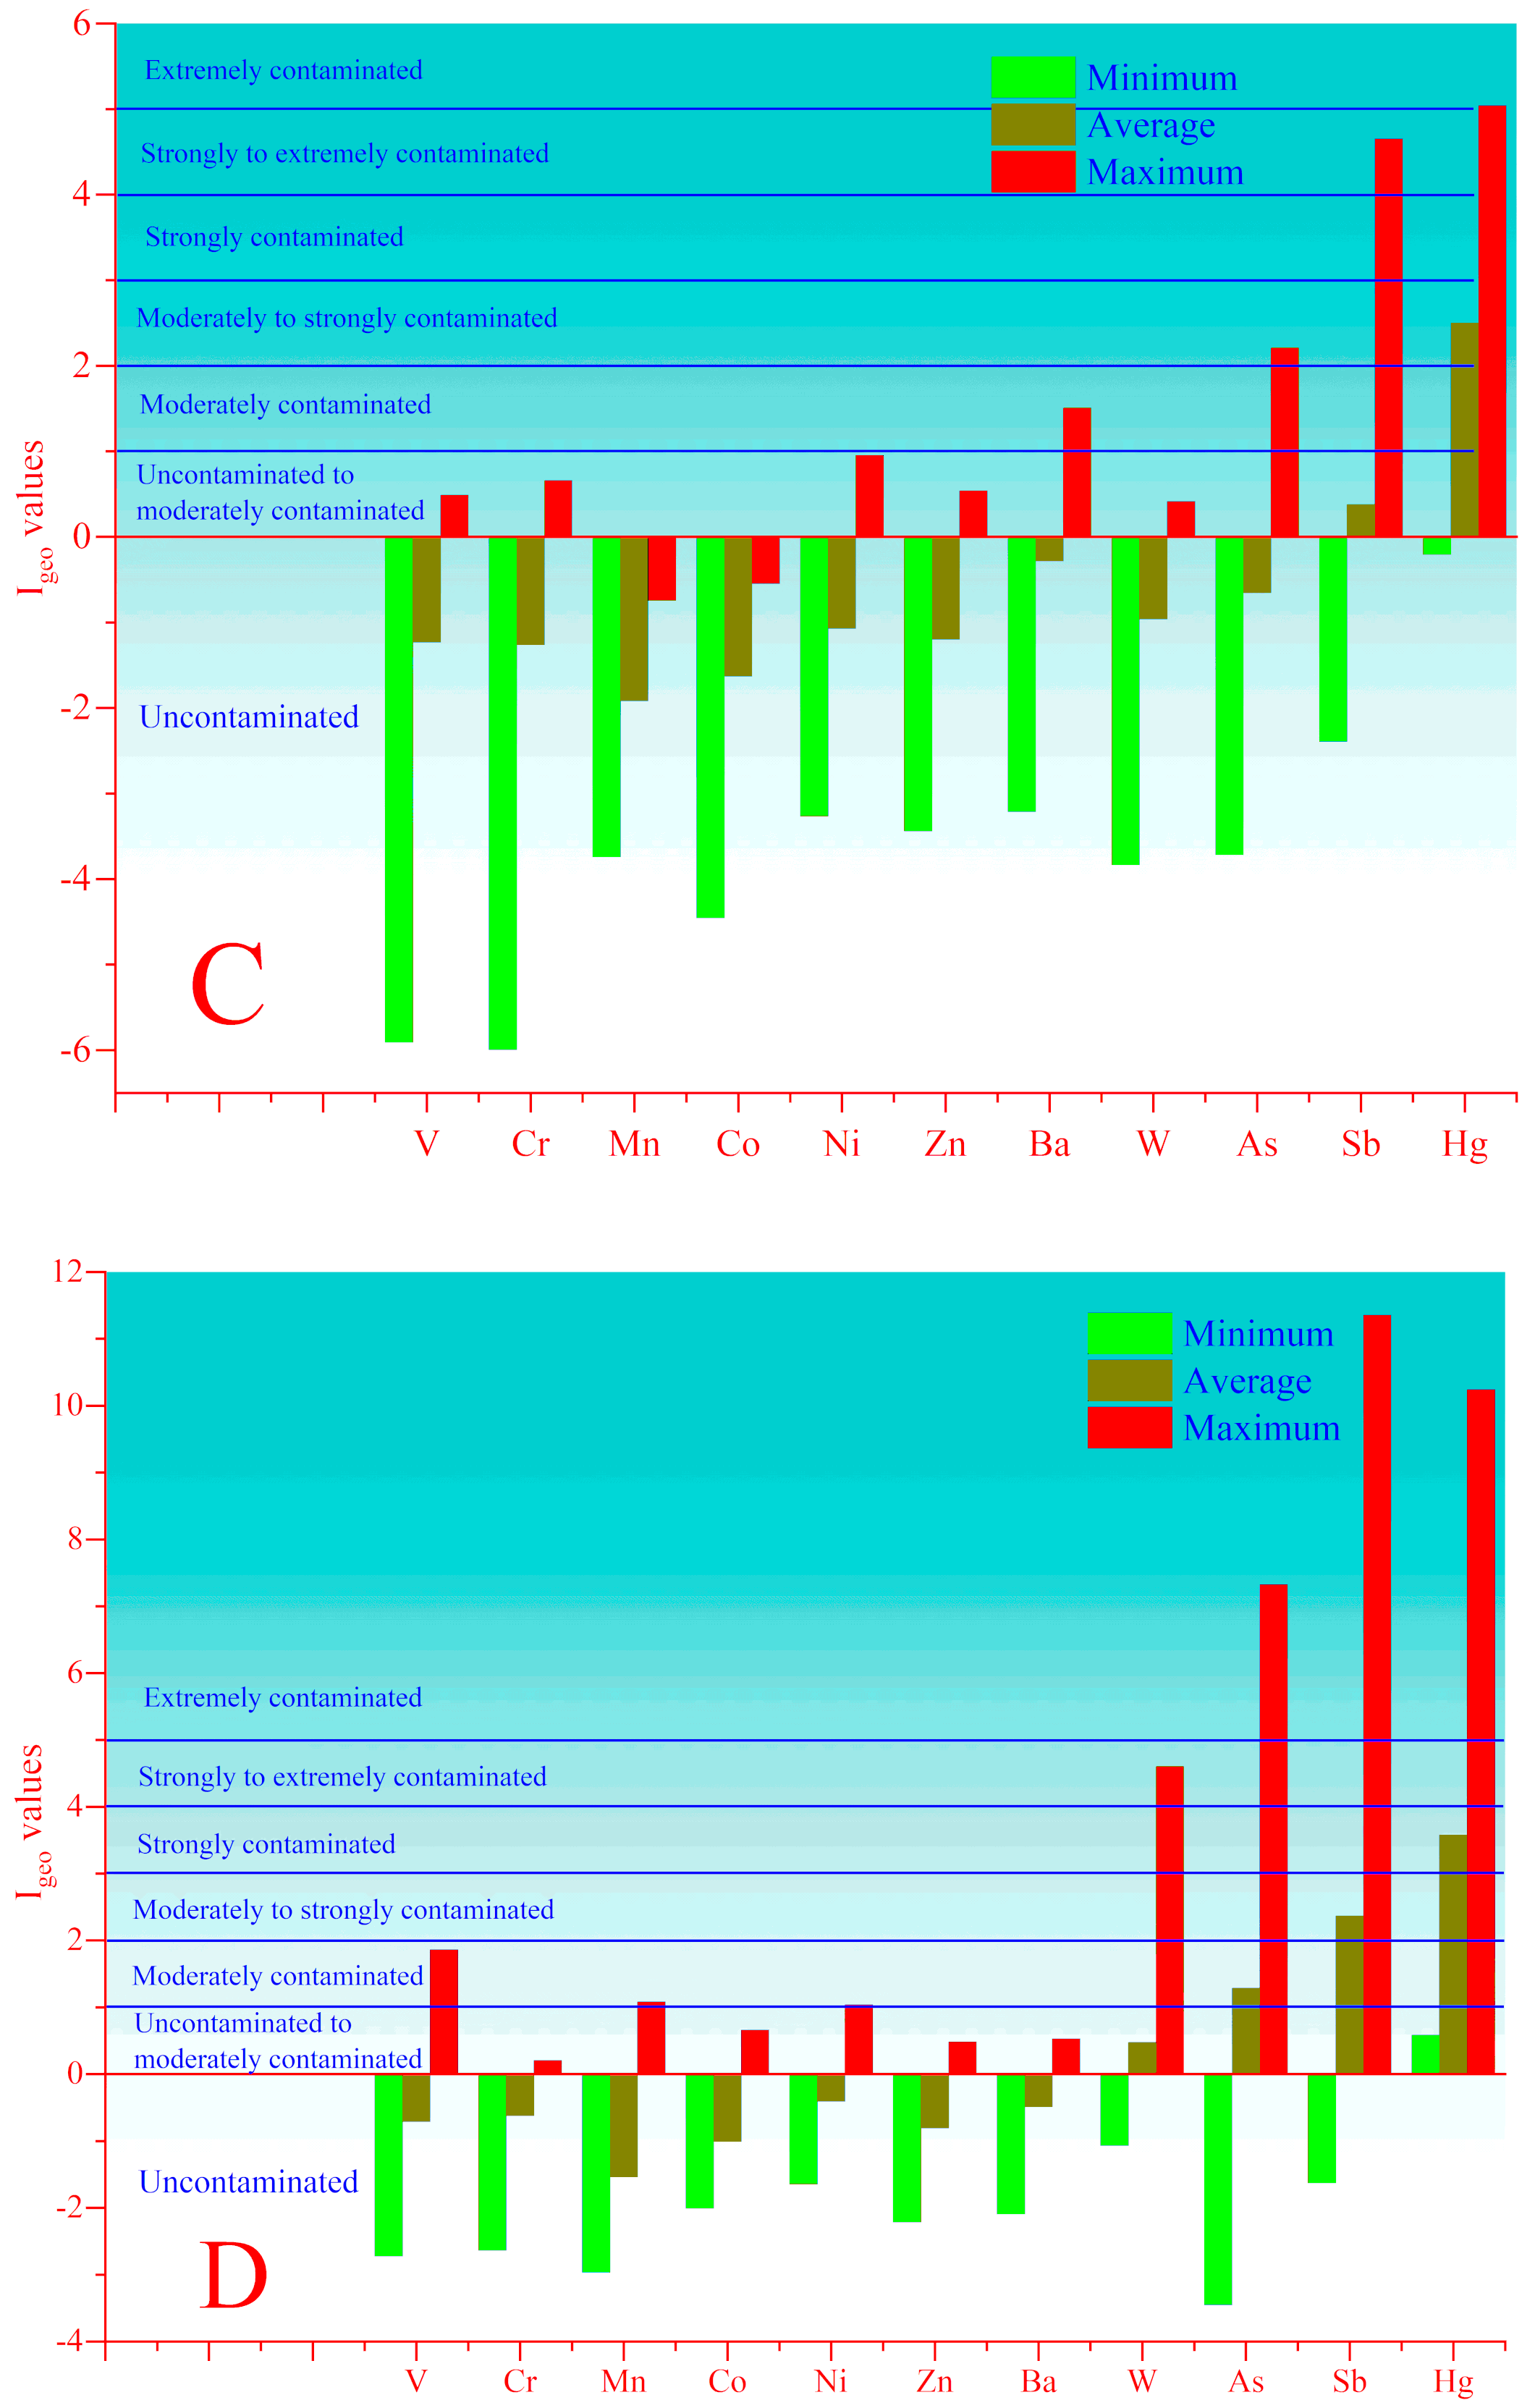
The minimum, average and maximum values of
Igeo for exposed and unexposed soil and sediment samples are depicted in (
Figure 7,
Table S2). How it is seen from (
Figure 7A and
Table S2) the minimum, and average values of
Igeo in the unexposed soils indicate an absence of any contamination with V, Cr, Mn, Co, Ni, Zn, Ba, W, but their maximum values (except Mn) are higher than zero, indicating uncontaminated to moderately contamination (class II) and moderately contamination (class III) environment. The average and maximum values indicate non-contamination to moderate contamination (class II) and strongly to extremely contamination (class V). In the case of Sb and Hg, their average and maximum values indicate moderately to strongly contaminated (class III) and extremely contaminated (class VI).
In the case of anthropogenically exposed soils (
Figure 7B and
Table S2), more intensive accumulation is observed for As, Sb and Hg, which average values indicate moderately to strongly contamination for Hg (class III), strongly contaminated for As and from strongly to extremely contamination (class V) for Sb. In addition, the maximum values of
Igeo for V, As, Sb and Hg reach 6.6, 9.6, 12 and 9.1 and indicate extreme contamination (class VI). The maximum values of
Igeo for Cr, Co, Ni and Zn indicate uncontaminated to moderately contaminated (class I) and for W strongly contaminated (class III).
It should be noted that there is no mining and industrial activity in the Mastchohi kuhi, and this region can be considered as clean. However, in some soils and sediments (
Figure 7A,C and
Table S2) collected in this region, the
Igeo for Hg reaches values higher than 3. In the case of sediment from tributary Obi Sara in Panjakent
Igeo for Sb and Hg varies between 1.42 and 2.0 and 1.42–2.74, respectively. In the Mogiyon River, the
Igeo for As and Sb only in one sapling site reached 3.75 and 5.79, respectively. Downstream of the Mogiyon River, the
Igeo for Hg varies between 2.0 and 3.74, and downstream of Zarafshon River for Sb and Hg, it varies between 2.06 and 2.57 and 2.0–3.22, respectively.
It is important to note that the Igeo values for toxic elements in sediments depend on their chemical forms, pH of water in the investigated system, solubility equilibrium of these metal compounds in water and many other chemical and biochemical factors. Except it, there are many physical factors—river slope or tributaries, volume and speed of water flow, narrowing and expansion of the riverbed and others, which can affect the accumulation of toxic elements in sediments.
High concentrations of As, Sb and Hg determined in the studied region could be explained by the irrigation of local fields with mine water from the adit. For example, the pH of water in the Konchoch mine adit is 2.7, which is equivalent to table vinegar. Such water dissolves many minerals and brings out to the surface. At the downstream of the adit located a different sizes plot of land on which local residents grow wheat and grass for mowing. In addition, willows and poplar, as well as fruit trees, grow along a polluted irrigation ditch. Furthermore, it can greatly affect the elemental balance and the water quality of Iskandarkul, which is located 3 km from these places. In this case, the observed discrepancy between the level of contamination assessed by Igeo and CF could be explained by the presence of some unitary criteria to characterize the contamination level.
To evidence the possible sources of anthropogenic or natural contamination, the corresponding matrix of the Spearman’s correlation coefficients were calculated (
Table 3 and
Table 4 for soils and sediments, respectively). The data reproduced in the correlation matrix (
Table 3A) confirms that the unexposed soil samples were noticed a good correlation only between Mn-Ba (r = 0.70). However, in soils exposed to anthropogenic impacts there are significant correlation between Cr-Ni (r = 0.72), Cr-Zn (r = 0.70), Cr-As (r = 0.79), Cr-Sb (r = 0.74), Cr-W (0.73) as well as between Mn-Co (r = 0.80), As-Sb (r = 0.96), As-W (r = 0.95) and Sb-W (r = 0.89) (
Table 4B) [
22]. Despite the high concentrations of Hg in soil samples, it does not correlate with any element (
Table 4A,B) even with Sb and As. In our opinion, it is due to the relatively low content of Hg in rocks. According to [
5,
23], the ratio between Sb and Hg in the Djidjikrut ore belt is 100 to 1, respectively.
In the case of unexposed sediments (
Table 4A) there are significantly correlations between Cr-Ni (r = 0.76), Mn-Co (r = 0.70), Mn-W (r = 0.70) and also Sb-Hg (r = 0.97). In addition, in anthropogenically exposed sediments it is noticed a significantly correlation between Cr-Zn (r = 0.72), Mn-Co (r = 0.77), Mn-Ni (r = 0.70), Mn-W (r = 0.76), Co-Ni (r = 0.75) as well as Sb-Hg (r = 0.97). A significantly positive correlation suggests also that these metals are redistributed in the soil and sediment by the same processes or had a similar source.
5. Conclusions
In order to assess the ecological state of the Zarafshon Valley, the elemental content of coastal soils and sediments of rivers as well as small and large tributaries in this region was investigated. The Zarafshon Valley is exposed to strong anthropogenic impacts from mining enterprises, which actively influence the ecological state of the region. In the course of the study, the concentrations of 13 elements, first and second hazard classes, As, Ba, Co, Cr, Mn, Ni, Sb, Hg, V W, Zn and also Th and U, were determined by NAA. Mainly in terms, the anomaly zones were observed by contents of As, Sb, Hg and partly V, W and Zn. It should be noted that the geochemical features of this region cannot be ruled out [
10,
15]. At the same time, the upper reaches of the Fann Mountains and Mastchohi kuhi can be considered as clean zones. The most heavily polluted is the lower reaches of the Djidjikrut river, below the Anzob mining and processing plant. Despite the excessively high concentration of toxic metals in the Djidjikrut River, their concentrations in bottom sediments after the AGOK (Yagnob and Fondarya) do not differ much from the overlying points along the Yagnob River. This can be explained by the fact that during floods and especially mudflows, river bottom sediments are washed away downstream and accumulate in the lower reaches of rivers.
The gross contents of Th and U showed almost the same variability of their contents both in soils and in sediment samples. The strong anomalies in the content of thorium and uranium were not observed in the studied regions. However, in isolated cases, the content of thorium and uranium exceed the upper continental crust values 1–2 times, indicating the peculiarities of rocks. The Th/U ratio mainly varies from 3 to 5. A decrease or increase of this ratio is typical for soils of industrial sites, their margins and in areas subjected to erosion.
Due to the fact that the sampling of soils and sediments were carried out at depths of 10–20 cm, at the moment, one can only assume that the technogenic genesis of investigated regions is within increased values. Nevertheless, areas with a clear excess of values require detailed studies, and it is the immediate task of further research. Thence, the considered data are insufficient to correct assessment of the ecological condition of the investigated region. To accomplish this task, it is necessary to carry out sampling of soils and sediments at different depths. Especially high contents of As, Sb Hg require careful examination using various physical-chemical or nuclear-physical methods. For a more accurate assessment of the pollution level and taking into account the mountainous of the investigated region, it will be better to use the values of the local background.
In addition, one of the important tasks in the future of this study is to determine the concentration of mobile forms—cations and oxyanions of toxic metals in soil and water samples, to establish the content of organic matter and the ratio of humic acids, the buffering capacity of soil–water system, acid–base characteristics of soils and sorption capacity of the soil-absorbed complex (SAC). Since from the point of view of ecogeochemistry, the main function of the SAC is to participate in complexation and exchange reactions with a toxic element. It makes it possible to determine the exchangeable forms of Ca, Mg, K, Na, as well as the hydrolytic acidity and pH of soils in different layers of the soil cover.

 ,
, 


