Article

Freshwater Quality Criteria for Typical Quinolone Antibiotics: Norfloxacin, Enrofloxacin, and Ciprofloxacin


1
School of Environmental & Municipal Engineering, Qingdao University of Technology, Qingdao 266520, China
2
Chinese Research Academy of Environmental Sciences, Beijing 100012, China
*
Authors to whom correspondence should be addressed.
Toxics 2026, 14(10), 864; https://doi.org/10.3390/toxics14100864
Submission received: 27 August 2026 / Revised: 20 September 2026 / Accepted: 24 September 2026 / Published: 29 September 2026

Abstract

As a broad-spectrum antimicrobial agent, quinolones are widely used in animal husbandry. When applied to animals, 60–90% of antibiotics will be excreted in the form of the original drug or metabolites by animal excretion, contaminated soil, surface water, and ground water, affecting the normal life activities of plants, animals and microorganisms, and ultimately affecting human health through the food chain. Since some quinolone antibiotics are synthetic antibacterial agents and are used in large quantities, this paper discusses the technical routes, formulation processes, and results of three typical quinolone antibiotics. According to the existing technical guidelines in China, the optimal fitting model was used to derive the short-term water-quality criteria (SWQC) of norfloxacin as 0.019 mg/L and the long-term water-quality criteria (LWQC) as 0.0008 mg/L; the SWQC of enrofloxacin as 8.685 mg/L and the LWQC as 0.0625 mg/L; and the SWQC of ciprofloxacin as 0.5 mg/L and the LWQC as 0.106 mg/L.

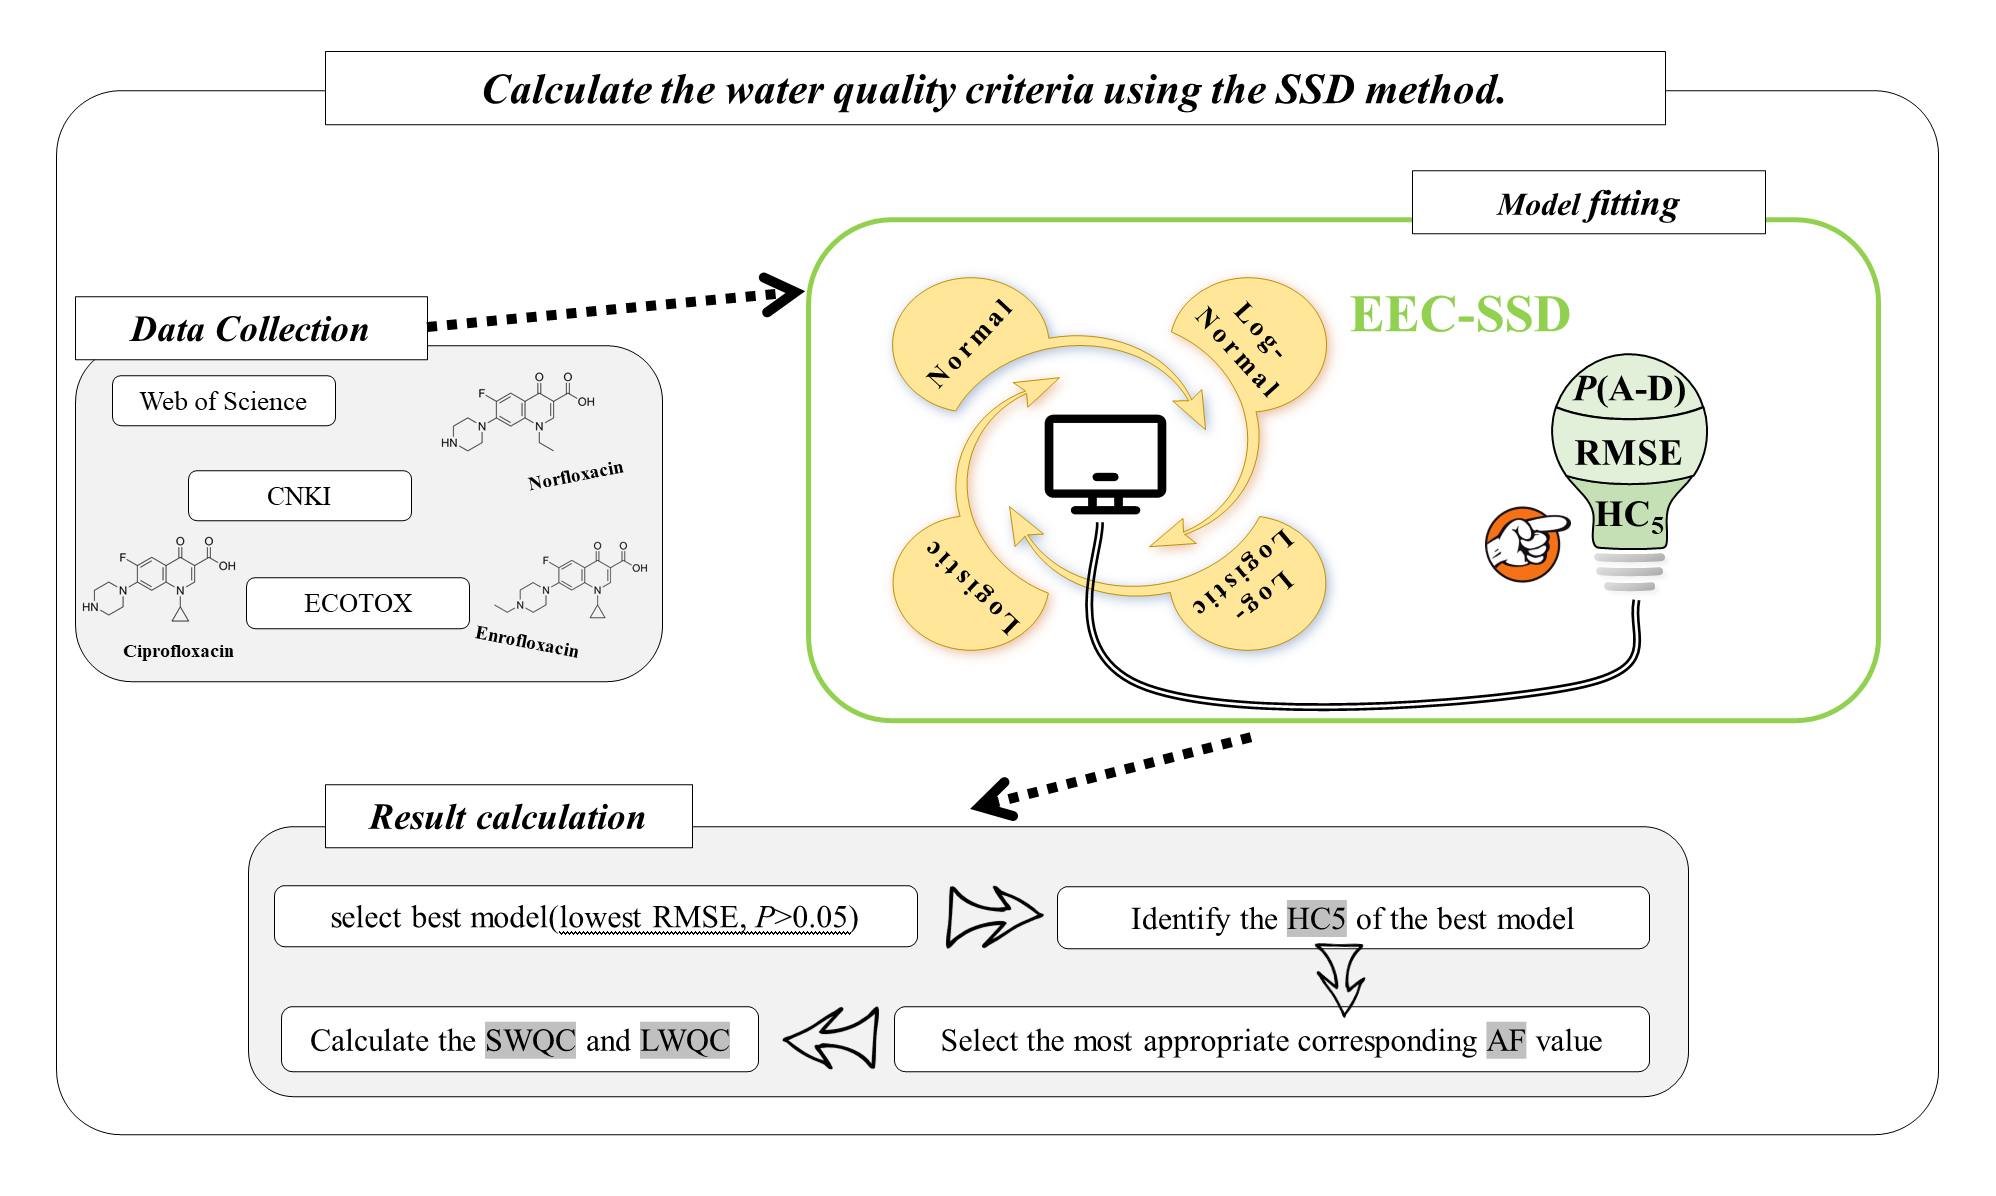
Graphical Abstract

1. Introduction

Antibiotics are extensively applied in human medicine, livestock production, and aquaculture, playing a critical role in disease control and productivity enhancement [1]. However, their widespread and continuously increasing use has raised growing concerns regarding the ecological risks associated with their environmental residues [2]. Aquatic systems serve as the primary sinks and transmission pathways for environmental antibiotics [3]. In these systems, antibiotic residues can disrupt microbial community structure and function [4,5,6], promote resistance selection and propagation [7,8], and induce toxicity in non-target organisms [9,10], including algal growth inhibition, invertebrate developmental toxicity, and endocrine disruption in fish [11,12], ultimately impairing ecosystem stability [13,14]. Furthermore, the antibiotic-driven dissemination of antibiotic resistance genes (ARGs) further amplifies ecological and human health risks [15,16]. Collectively, these impacts have intensified concerns about the potential effects of antibiotics on marine biota and ecosystem integrity.
Quinolone antibiotics are a class of broad-spectrum, highly effective, and low-toxicity antimicrobial agents, primarily used for the prevention and treatment of various bacterial infections in humans and animals. They are widely applied in fields such as healthcare, animal husbandry, agricultural planting, and aquaculture [17,18]. A WHO survey (1998) reported that annual quinolone consumption in the United States, Japan, South Korea, and the European Union was approximately 50 t as specialty products and 70 t as generic products, compared with 1350 t and 470 t, respectively, in China [19]. In 2018, global veterinary antibiotic consumption was approximately 81,000 tons, with an estimated dosage of 75.16–82.56 mg per kilogram of animal weight [20,21]. Ardakani [22] reported that in 2017, antimicrobial usage (AMU) in chickens, cattle, and pigs—comprising 93.75% of all food animals—amounted to 93,309 tonnes of active ingredients [23]. This figure is projected to rise by 11.5% to 104,079 tonnes by 2030. Following administration to humans or animals, 40–90% of antibiotics are excreted as parent compounds or metabolites and enter the environment via livestock and poultry manure [24]. In 2010, livestock and poultry manure discharged into the environment in China reached 4.5 billion t. Environmental monitoring has detected quinolone antibiotics in various environmental compartments, including water, sediments, and soil [25,26]. Notably, antibiotic concentrations in the water and soil surrounding some farms can reach abnormally high levels [27,28]. Currently, China widely employs high-performance liquid chromatography–tandem mass spectrometry (HPLC-MS/MS) for the detection of quinolone antibiotics [29,30]. Enrofloxacin is a compound that originates from a group of fluoroquinolones that are widely used in veterinary medicine as antibacterial agents (this antibiotic is not approved for use as a drug in humans) [31]. Norfloxacin is a third-generation quinolone antibacterial agent with inhibitory effects on bacteria. It is commonly used to treat enteritis, dysentery, respiratory tract infections, urinary tract infections, gonorrhea, and prostatitis caused by susceptible bacteria. However, this drug can delay bone formation in minors, thereby affecting their growth and development. Ciprofloxacin is also a third-generation quinolone antibacterial agent with broad-spectrum antibacterial activity and potent bactericidal effects. Its antibacterial activity against almost all bacteria is two to four times stronger than that of norfloxacin and enoxacin. However, it may cause side effects such as gastrointestinal reactions, central nervous system symptoms, and allergic reactions [32]. Basic information about the three quinolone antibiotics is shown in Table 1. This article demonstrates the technical route and the derived results for three representative quinolone antibiotics, which significantly support the future revision of water-quality criteria (WQC) for quinolone antibiotics in China.
In terms of derivation methods, the species sensitivity distribution method (SSD method) and the assessment factor method (AF method) are the most frequently used approaches for deriving antibiotic WQC. Since the antibiotic WQC values obtained by the SSD method and the toxicity percentile rank method are relatively close, the SSD method was selected. The SSD model is widely used; by integrating acute or chronic toxicity data from multiple species, it estimates the predicted no-effect concentration (PNEC) that protects a specified proportion of species (usually 95%) [33,34,35,36]. However, there are currently relatively few domestic studies on fluoroquinolone antibiotics. In this study, the commonly used norfloxacin (NOR), enrofloxacin (ENR), and ciprofloxacin (CIP) were selected as the research objects. The SSD method was used to calculate the WQC values for the three fluoroquinolone antibiotics, aiming to provide a reference for deriving WQC for fluoroquinolone antibiotics. On this basis, recommended reference values for SWQC and LWQC were derived.

2. Materials and Methods

2.1. Technical Approach to Criteria Development

2.1.1. Technical Approach

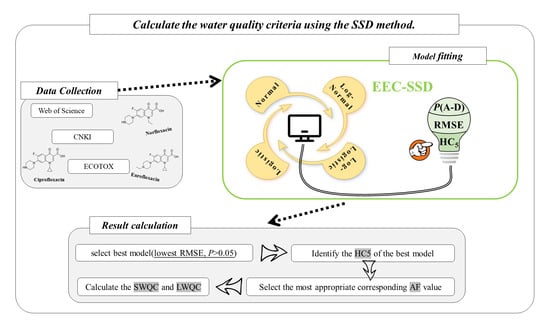
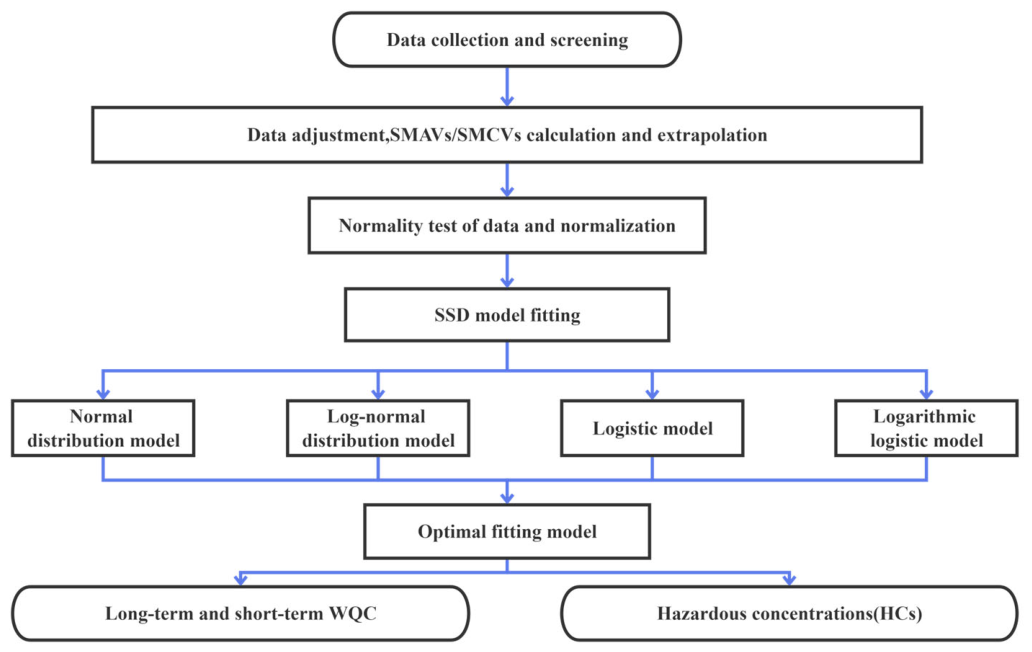
The technical route adopted in this study was based on the “Technical Guideline for Deriving Water Quality Criteria for Freshwater Organisms” issued by the Ministry of Ecology and Environment of China (MEE) [37], and is illustrated in Figure 1.

2.1.2. WQCs Derivation Based on the SSD Model

The SSD approach was employed to derive WQCs, ensuring that the tested organisms collectively represented at least three trophic levels. Acute toxicity values (ATVs) were used to calculate acute response values (AVEs) at equivalent effect levels, while chronic toxicity values (CTVs) were used to compute chronic effect values (CVEs). All toxicity data were log-transformed prior to generating cumulative frequency distributions.
Four distribution models, the normal, log-normal, logistic and log-logistic distributions, were fitted to the SSD to estimate the hazardous concentration affecting 5% of species (HC5) [38]. A satisfactory model fit was indicated by a p-value greater than 0.05, and the model with the lowest root mean square error (RMSE) was selected for subsequent WQC derivation. The WQCs derived from HC5 (SHC5) based on acute toxicity data are called short-term WQCs (SWQC), while those derived from HC5 (LHC5) based on chronic toxicity data are called long-term WQCs (LWQC).

2.2. Collection and Screening of Toxicity Data

Toxicity data were collected from the published literature and publicly available toxicity databases. The English-language literature was retrieved from the Web of Science (https://www.webofscience.com), the Chinese-language literature from the CNKI database (https://www.cnki.net), and toxicity records from the ECOTOX database (https://cfpub.epa.gov/ecotox, accessed on 27 January 2026).

2.2.1. Data Collection and Screening Rationales

Data collection and screening were performed in accordance with the guidelines. The exposure conditions adhered to the following principles:
(1) The experimental system (flow-through, semi-static, or static) was selected based on the physicochemical properties of the pollutant. Data from flow-through tests were preferred over semi-static tests, which in turn were preferred over static tests. For substances that are unstable in the test system, measured exposure concentrations were recorded. Only toxicity data for native Chinese freshwater organisms or for exotic species occurring in natural waters of China were collected.
(2) The test system satisfied the biological requirements of the test organisms. Water-quality parameters were maintained within stable ranges suitable for the test species. Dilution water was prepared according to standard test methods or from aerated tap water; distilled or deionized water was not used directly as dilution water.
(3) For acute toxicity data of aquatic animals (mainly LC50 and EC50), the exposure duration was approximately 24 h for rotifers, 48 h for daphnids and chironomids, and 96 h for other species. For chronic toxicity data of aquatic animals (mainly NOEC, LOEC, MATC, EC10, and EC20), the exposure duration was ≥48 h for rotifers and ≥21 days or covered a sensitive life stage (e.g., a fish early-life-stage test) for other species.
(4) For acute toxicity data of aquatic plants (mainly LC50 and EC50), the exposure duration was approximately 96 h. For chronic toxicity data of aquatic plants (mainly NOEC, LOEC, MATC, EC10, EC20, and EC50), the exposure duration was ≥21 days or spanned at least one generation.
(5) Toxicity data derived from measured concentrations were preferred over those based on nominal concentrations.
(6) For acute data of the same species, the priority order was LC50 > EC50. For chronic data of the same species, the priority order was EC20 > MATC > NOEC = EC10 > LOEC. Full life-cycle toxicity data were preferred over partial life-cycle data, and single-life-stage data were avoided whenever possible. For chronic plant data, LOEC was additionally prioritized over EC50.
(7) Life stages relatively sensitive to the target pollutant, such as larval and embryonic stages, were selected.
(8) Toxicity endpoint data for the same species and pollutant that differed by more than 10-fold were considered outliers; if the cause of such discrepancies could not be resolved, all data for that species were discarded [37].

2.2.2. Data Quality Evaluation

Data quality was evaluated and classified in accordance with the guidelines [38]. Based on the evaluation results, data were categorized as follows: fully reliable data (obtained using standard toxicity test methods), data of limited reliability (from tests not conducted according to standard methods but judged reliable by experts), unreliable data (data generated through processes lacking credibility, together with non-preferred data produced by integrating information from different sources, e.g., without chemical monitoring), and uncertain data (lacking sufficient experimental details to permit a reliability judgment). Among these, fully reliable data and data of limited reliability were considered acceptable for criteria derivation.

2.3. Toxicity Data Preprocessing

A model was constructed based on the physicochemical properties of the pollutant and the results of toxicity studies. Water-quality parameters (e.g., temperature, hardness, pH, organic matter content, and suspended particulate matter content) or their transformed forms were used as the independent variable (x), and the corresponding toxicity values or their transformed forms were used as the dependent variable (y). A correlation regression analysis was then performed to determine the influence of water-quality parameters on pollutant toxicity. When this influence is significant and the underlying pattern is clearly established, an appropriate model must be established or applied to adjust the toxicity data.

2.3.1. Calculation of the Acute Value for the Same Effect

Classify the species, and take the EC50 as the growth-type ATV and the LC50 as the survival-type ATV. Then, substitute them into Formula (1) to calculate the growth-type AVE and survival-type AVE for each species.
A V E i , k = A T V i , k , 1 × A T V i , k , 2 × ⋯ × A T V i , k , m m
where AVE is the acute value for the same effect (μg/L or mg/L), i is the one species (dimensionless), k is the acute toxic endpoint (generally categorized into growth endpoints and survival endpoints, dimensionless), m is the number of ATVs, and ATV is the acute toxicity value (μg/L or mg/L).
The lower AVE between the growth-based AVE and the survival-based AVE is included in the subsequent calculation. If only one AVE is obtained, that value is directly used [37].

2.3.2. Calculation of the Chronic Value for the Same Effect

For each species, chronic toxicity data (MATC, EC10, EC20, NOEC, LOEC, EC50, and LC50) were categorized by effect type (growth or reproduction) and assigned as growth-based or reproduction-based Chronic Toxicity Values (CTVs), while LC50 values were assigned as survival-based CTVs. These were then separately substituted into Formula (2) to calculate the species-specific growth-based CVE, reproduction-based CVE, and survival-based CVE.
C V E i , k = C T V i , k , 1 × C T V i , k , 2 × ⋯ × C T V i , k , m m
where CVE is the chronic value for the same effect (μg/L or mg/L), i is the one species(dimensionless), k is the acute toxic endpoint (generally categorized into growth endpoints and survival endpoints, dimensionless), m is the number of CTVs, and CTV is the chronic toxicity value (μg/L or mg/L).
When multiple CVEs are available for a given species, the minimum value is retained for use in subsequent analyses; when only a single CVE value is available, it is used directly without further selection [37].

2.3.3. Calculation of the Cumulative Frequency

The lgAVE and lgCVE values were sorted separately in ascending order, and R rank was assigned accordingly (the lowest toxicity value received rank 1, the second lowest rank 2, and so forth; in cases where two or more species exhibited identical toxicity values, they were arbitrarily assigned consecutive ranks). The acute and chronic cumulative frequencies (FR) were subsequently computed for each species following Formula (3) [39]:
F R = σ 1 R f N + 1 × 100 %
where FR is the cumulative frequency, R is the rank of toxicity values (dimensionless), f is the frequency (number of species corresponding to toxicity rank R), and N is the total sum of all frequencies.

3. Results

3.1. Toxicity Data

A total of 94 acute data points were obtained in this study, covering 7 phyla, 16 families, and 21 species. A total of 79 chronic data points were obtained, covering 5 phyla, 13 families, and 18 species.

3.2. AVEs and CVEs

The three calculated typical quinolone antibiotics, AVEs and CVEs, for the baseline water-quality condition are listed in Table 2, Table 3 and Table 4.
A total of 69 groups of AVE and CVE data were obtained.

3.3. Normality and Normalization of the AVEs and CVEs

SSD model fitting was performed with the log-transformed acute toxicity values (lgAVE) and log-transformed chronic toxicity values (lgCVE) as the independent variable (x) and the corresponding cumulative frequency (FR) as the dependent variable (y). Four distribution models were applied: normal distribution, log-normal distribution, logistic, and log-logistic models. The fitting was carried out using the recommended software: “National Ecological Environment Criteria Calculation Software-Species Sensitivity Distribution Method, EEC-SSD, Version 1.0 [40]”.
Goodness-of-fit was evaluated based on the following parameters:
(a) Root mean square error (RMSE), with a value closer to 0 indicating higher precision of the model fit.
(b) The p-value from the Anderson-Darling (A-D) test, where p > 0.05 indicates that the model passes the test and conforms to the theoretical distribution.
Based on the goodness-of-fit results and professional judgment, among the models with p > 0.05, the one with the smallest RMSE was selected as the best-fit model. The curve obtained from the best-fit model showed good agreement with the data points used in the fitting, thereby ensuring that the WQC extrapolated from the SSD curve are statistically reasonable and reliable.

3.4. Model Results

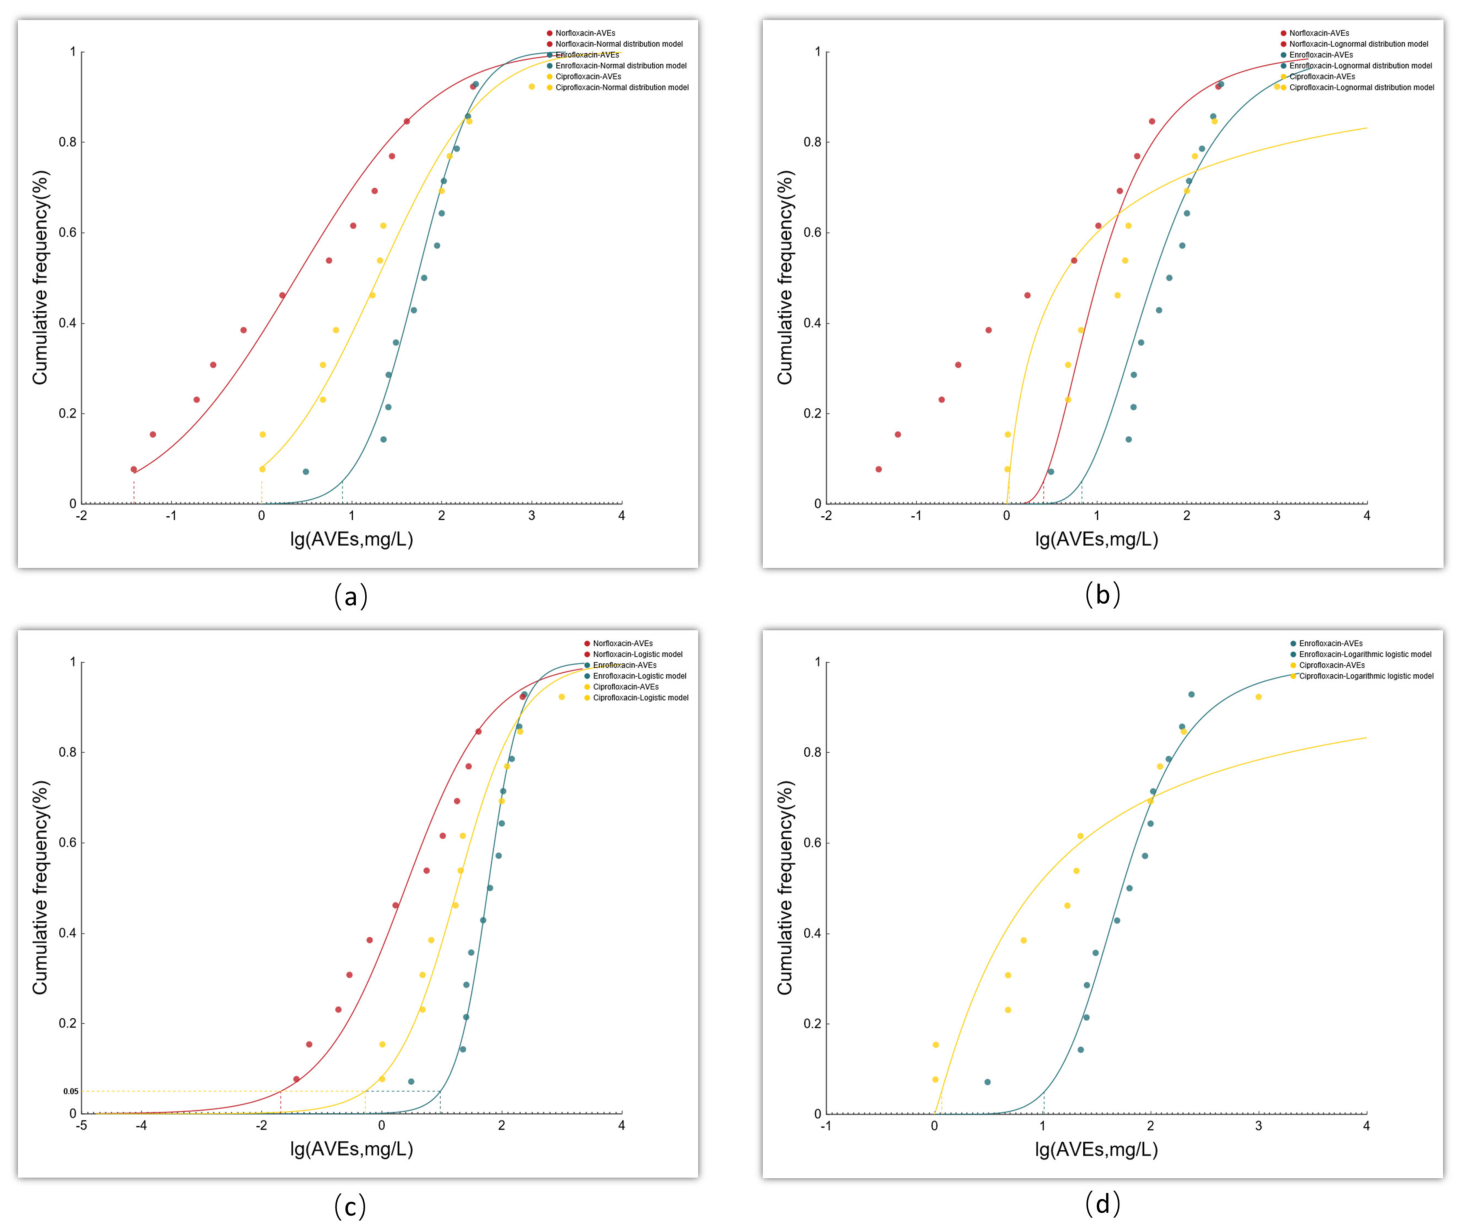
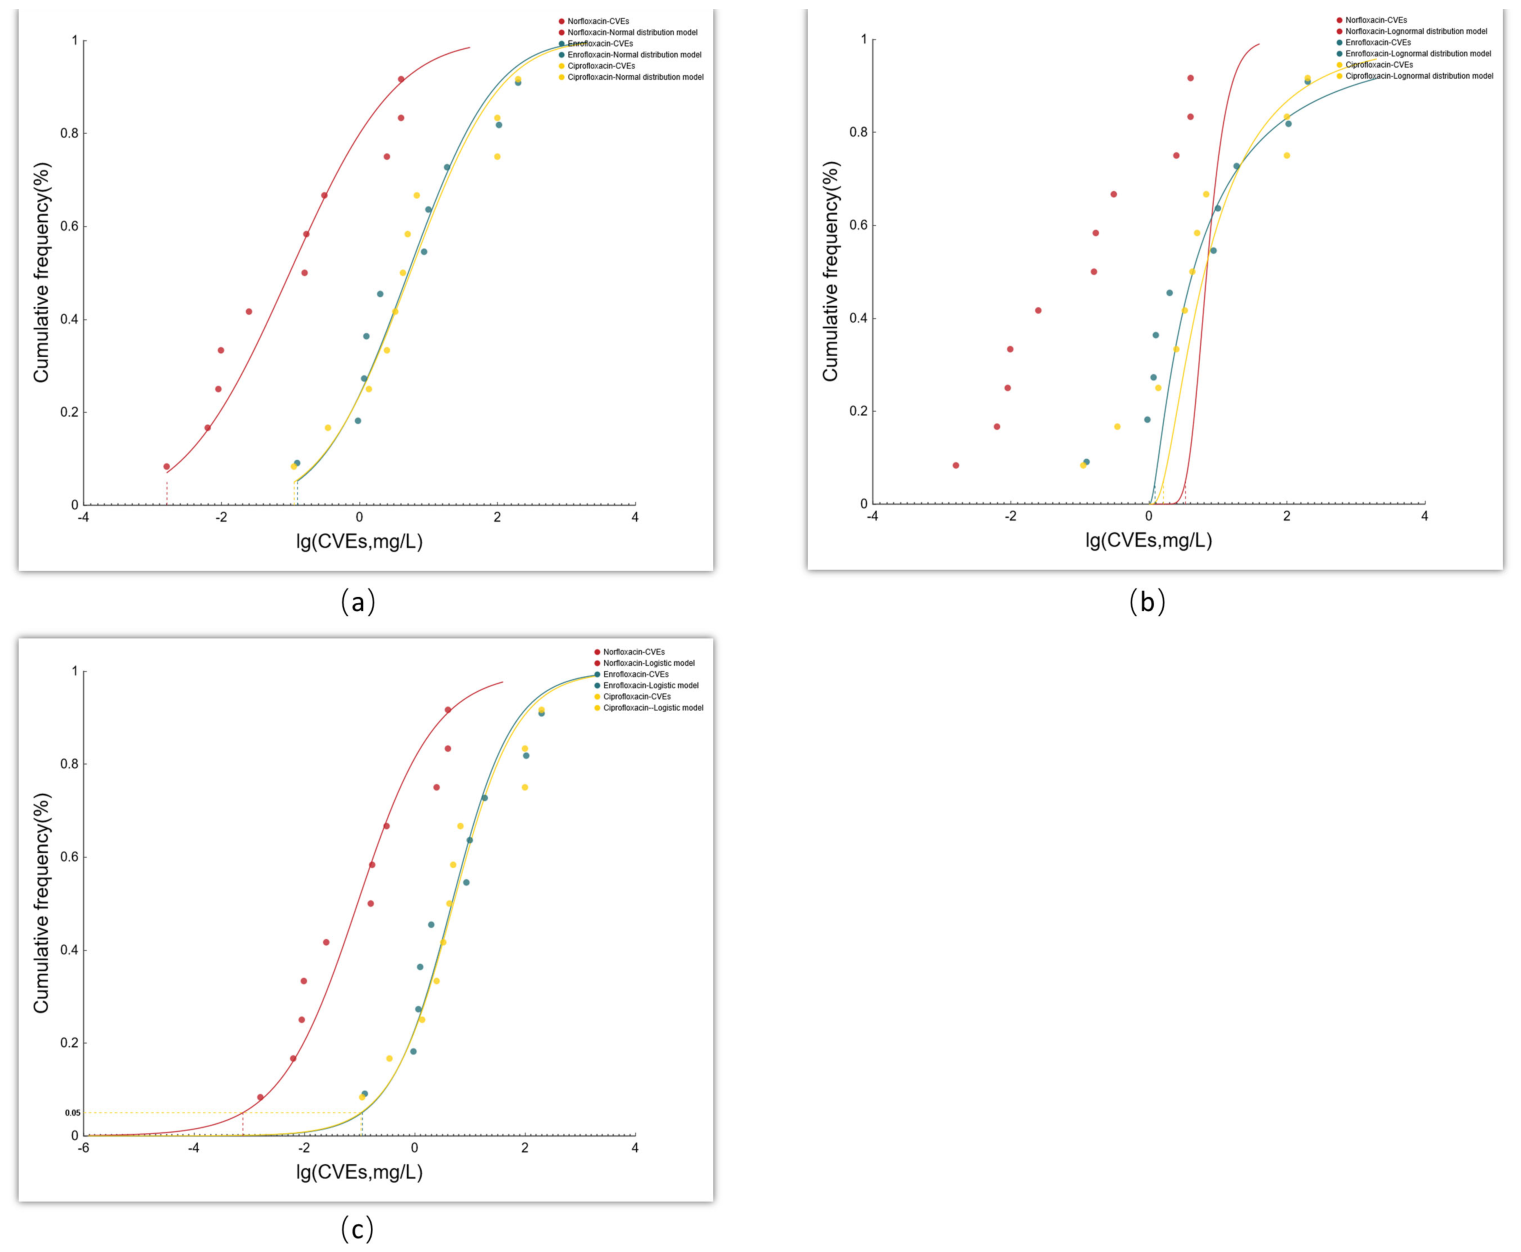
The 69 groups of AVEs and CVEs were fitted with four models (normal, log-normal, logistic and log-logistic). The fitting results for the acute toxicity values (AVEs) are presented in Figure 2, while those for the chronic toxicity values (CVEs) are presented in Figure 3.

3.5. Benchmark Setting

The benchmark extrapolation was conducted using Formulas (4) and (5) to obtain the short-term and long-term water-quality benchmarks, respectively.
S W Q C = S H C 5 S A F  
where SWQC is the short-term water-quality criteria for aquatic organisms (μg/L or mg/L), SHC5 is the hazardous concentration for 5% of species, derived from the acute toxicity data using the fitted SSD curve (μg/L or mg/L), and SAF is the assessment factor applied to the short-term water-quality benchmarks for aquatic organisms (dimensionless).
L W Q C = L H C 5 L A F  
where LWQC is the long-term water-quality criteria for aquatic organisms (μg/L or mg/L), LHC5 is the hazardous concentration for 5% of species, derived from the chronic toxicity data using the fitted SSD curve (μg/L or mg/L), and LAF is the assessment factor applied to the long-term water-quality benchmarks for aquatic organisms (dimensionless).
The assessment factor (AF) was determined based on factors such as the amount of data used for criteria derivation, the coverage of the tested species, and the distribution of the data-fitting, and it generally ranges from two to five. When the number of species represented by valid toxicity data exceeded 15, the AF was set to two; when the number of species was 15 or fewer, an AF of three was generally adopted [41,42]. In special circumstances (e.g., when algae accounted for more than 50% of the data or when the tail of the SSD curve showed poor fit), the AF was determined by expert judgment.
A self-audit of the criteria derivation process was conducted in accordance with the guidelines. The toxicity data used for criteria derivation met the following requirements simultaneously: (1) at least three trophic levels were covered, including producers, primary consumers, and secondary consumers; (2) at least three phyla and eight families of biological taxa were included [41]; (3) at least eight species were included, comprising a cyprinid fish (Osteichthyes), a non-cyprinid fish (Osteichthyes), zooplankton, and aquatic plants. Hence, the criteria derivation process did not deviate from the guidelines.

4. Discussion

The process data and the resultant water-quality benchmark values for the three typical fluoroquinolone antibiotics are summarized in Table 5, Table 6 and Table 7.

5. Conclusions

In this study, WQC were derived for norfloxacin, enrofloxacin, and ciprofloxacin—three quinolone antibiotics that are widely used and frequently detected in the environment. The derived SWQC were 0.019 mg/L for norfloxacin, 8.685 mg/L for enrofloxacin, and 0.5 mg/L for ciprofloxacin; the LWQC were 0.0008, 0.0625, and 0.106 mg/L, respectively. To date, no authoritative institution in China has issued freshwater environmental quality standards or WQC for norfloxacin, enrofloxacin, and ciprofloxacin. Moreover, research in China on the systematic derivation of freshwater aquatic-life WQC and human health benchmark values for these three typical quinolones remains relatively limited. Therefore, there is an urgent need to conduct research on WQC derivation, so as to provide theoretical support for the formulation of water environment standards for emerging pollutants in China and the implementation of relevant environmental governance measures.

Author Contributions

Conceptualization, N.H. and Q.P.; Methodology, N.H. and Q.P.; Software, Q.P.; Validation, Q.P.; Formal analysis, Q.P.; Investigation, Q.P., B.H. and B.Z.; Resources, N.H.; Data curation, B.H. and B.Z.; Writing—original draft preparation, Q.P.; Writing—review and editing, Q.P., W.T. and B.S.; Visualization, Q.P.; Supervision, N.H. All authors have read and agreed to the published version of the manuscript.

Funding

This research received no external funding.

Institutional Review Board Statement

Not applicable.

Informed Consent Statement

Not applicable.

Data Availability Statement

Data available in a publicly accessible repository.

Conflicts of Interest

The authors declare no conflicts of interest.

Abbreviations

The following abbreviations are used in this manuscript:
AFAssessment factor
AMUAntimicrobial usage
ARGsAntibiotic resistance genes
ATVAcute toxicity value
AVEAcute value for the same effect
CIPCiprofloxacin
CTVChronic toxicity value
CVEChronic value for the same effect
ECXx% effect concentration
ENREnrofloxacin
FRCumulative frequency
HCXHazardous concentration for x% of species
HPLC-MS/MSHigh-performance liquid chromatography–tandem mass spectrometry
LAFAssessment factor applied to the long-term water-quality benchmarks for aquatic organisms
LC50Median lethal concentration
LHC5Hazardous concentration for 5% of species, derived from the chronic toxicity data using the fitted SSD curve
LOECLowest observed effect concentration
LWQCLong-term water-quality criteria
MATCMaximum acceptable toxicant concentration
MEEMinistry of Ecology and Environment of China
NOECNo observed effect concentration
NORNorfloxacin
RMSERoot mean square error
SAFAssessment factor applied to the short-term water-quality benchmarks for aquatic organisms
SHC5Hazardous concentration for 5% of species, derived from the acute toxicity data using the fitted SSD curve
SSDSpecies sensitivity distribution
SWQCShort-term water-quality criteria for aquatic organisms

References

  1. Kayal, A.; Mandal, S. Microbial degradation of antibiotic: Future possibility of mitigating antibiotic pollution. Environ. Monit. Assess. 2022, 194, 639. [Google Scholar] [CrossRef] [Scilit] [PubMed]
  2. Zhang, T.; Fan, L.; Zhang, Y.N. Antibiotic resistance genes in aquatic systems: Sources, transmission, and risks. Aquat. Toxicol. 2025, 284, 107392. [Google Scholar] [CrossRef] [Scilit] [PubMed]
  3. Li, Y.; Zhang, Y.; Wang, D.; Zhao, J.; Yu, H.; Chen, Y.; Yang, J. Effect of antibiotics on diverse aquatic plants in aquatic ecosystems. Aquat. Toxicol. 2025, 281, 107289. [Google Scholar] [CrossRef] [Scilit] [PubMed]
  4. Lu, T.; Zhu, Y.; Ke, M.; Peijnenburg, W.J.G.M.; Zhang, M.; Wang, T.; Chen, J.; Qian, H. Evaluation of the taxonomic and functional variation of freshwater plankton communities induced by trace amounts of the antibiotic ciprofloxacin. Environ. Int. 2019, 126, 268–278. [Google Scholar] [CrossRef] [Scilit] [PubMed]
  5. Posada-Perlaza, C.E.; Ramírez-Rojas, A.; Porras, P.; Adu-Oppong, B.; Botero-Coy, A.M.; Hernández, F.; Anzola, J.M.; Díaz, L.; Dantas, G.; Reyes, A.; et al. Bogotá River anthropogenic contamination alters microbial communities and promotes spread of antibiotic resistance genes. Sci. Rep. 2019, 9, 11764. [Google Scholar] [CrossRef] [Scilit] [PubMed]
  6. Zhou, Z.; Zhang, Z.; Feng, L.; Zhang, J.; Li, Y.; Lu, T.; Qian, H. Adverse effects of levofloxacin and oxytetracycline on aquatic microbial communities. Sci. Total Environ. 2020, 734, 139499. [Google Scholar] [CrossRef] [Scilit] [PubMed]
  7. Jing, K.; Li, Y.; Yao, C.; Jiang, C.; Li, J. Towards the fate of antibiotics and the development of related resistance genes in stream biofilms. Sci. Total Environ. 2023, 898, 165554. [Google Scholar] [CrossRef] [Scilit] [PubMed]
  8. Zhao, K.; Si, T.; Liu, S.; Liu, G.; Li, D.; Li, F. Co-metabolism of microorganisms: A study revealing the mechanism of antibiotic removal, progress of biodegradation transformation pathways. Sci. Total Environ. 2024, 954, 176561. [Google Scholar] [CrossRef] [Scilit] [PubMed]
  9. Duan, W.; Cui, H.; Jia, X.; Huang, X. Occurrence and ecotoxicity of sulfonamides in the aquatic environment: A review. Sci. Total Environ. 2022, 820, 153178. [Google Scholar] [CrossRef] [Scilit] [PubMed]
  10. Yu, C.; Li, C.; Zhang, Y.; Du, X.; Wang, J.H.; Chi, Z.Y.; Zhang, Q. Effects of environment-relevant concentrations of antibiotics on seawater Chlorella sp. biofilm in artificial mariculture effluent. Algal Res. 2023, 70, 103008. [Google Scholar] [CrossRef] [Scilit]
  11. Li, Z.; Lu, T.; Li, M.; Mortimer, M.; Guo, L.H. Direct and gut microbiota-mediated toxicities of environmental antibiotics to fish and aquatic invertebrates. Chemosphere 2023, 329, 138692. [Google Scholar] [CrossRef] [Scilit] [PubMed]
  12. Zhu, Y.; Yao, S.; Wang, X.; Wang, J.; Cao, H.; Tao, Y. Variable cyanobacterial death modes caused by ciprofloxacin in the aquatic environment: Prioritizing antibiotic-photosynthetic protein interactions for risk assessment. Water Res. 2025, 271, 122885. [Google Scholar] [CrossRef] [Scilit] [PubMed]
  13. Gunathilaka, M.L.; Bao, S.; Liu, X.; Li, Y.; Pan, Y. Antibiotic pollution of planktonic ecosystems: A review focused on community analysis and the causal chain linking individual-and community-level responses. Environ. Sci. Technol. 2023, 57, 1199–1213. [Google Scholar] [CrossRef] [Scilit] [PubMed]
  14. Liu, X.; Li, J.; Wang, R.; Ni, R.; Duan, C.; Yu, J.; Jeppesen, E.; Pan, Y. Antibiotics disrupt bacteria–phytoplankton symbioses: Unveiling ecological risks in aquatic ecosystems. Oikos 2025, 2025, e11201. [Google Scholar] [CrossRef] [Scilit]
  15. Behere, M.; Thathola, P.; Sahoo, T.P.; Raval, I.; Haldar, S. Role of antibiotic residues in development of antibiotic resistance in coastal bacterial communities. Reg. Stud. Mar. Sci. 2025, 89, 104340. [Google Scholar] [CrossRef] [Scilit]
  16. Lu, J.; Zhang, Y.; Wu, J.; Wang, J.; Zhang, C.; Lin, Y. Occurrence and spatial distribution of antibiotic resistance genes in the Bohai Sea and Yellow Sea areas, China. Environ. Pollut. 2019, 252, 450–460. [Google Scholar] [CrossRef] [Scilit] [PubMed]
  17. Zhang, Y.; Yan, X.J.; Sun, Y.; Wu, H.; Lu, J.F. Current situation of antibiotic abuse in China and its residues distribution in the environment. Contemp. Chem. Ind. 2019, 48, 2660–2662, 2666. [Google Scholar]
  18. Lan, X.J.; Liu, Y.R.; Lv, Z.Z.; Hou, H.Q.; Ji, J.H.; Wang, L.H.; Liu, X.M. Research advance in residues and ecological risks of fluoroquinolone antibiotics in agricultural soil in China. Acta Agric. Jiangxi 2019, 31, 108–115. [Google Scholar]
  19. World Health Organization. Use of Quinolones in Food Animals and Potential Impact on Human Health; WHO: Geneva, Switzerland, 1998. [Google Scholar]
  20. Matthew, T.S.; Krista, D.; Eric, R.L.; Thomas, U.M.; Emily, F.; Ruth, S.; Ingrid, M.L.; Ying, T.; Jonathan, U.P.; van den Brink, M.R.M.; et al. Inhibiting antibiotic-resistant Enterobacteriaceae by microbiota-mediated intracellular acidification. J. Exp. Med. 2019, 216, 84–98. [Google Scholar] [CrossRef] [Scilit] [PubMed]
  21. Sun, L.; Liu, S.; Wang, J.; Wang, L. Analysis of risk factors for multiantibiotic-resistant infections among surgical patients at a children’s hospital. Microb. Drug Resist. 2019, 25, 297–303. [Google Scholar] [CrossRef] [Scilit] [PubMed]
  22. Ardakani, Z.; Aragrande, M.; Canali, M. Global antimicrobial use in livestock farming: An estimate for cattle, chickens, and pigs. Animal 2024, 18, 101060. [Google Scholar] [CrossRef] [Scilit] [PubMed]
  23. Calayag, A.M.B.; Widmer, K.W.; Rivera, W.L. Antimicrobial susceptibility and frequency of Bla and qnr genes in Salmonella enterica isolated from slaughtered pigs. Antibiotics 2021, 10, 1442. [Google Scholar] [CrossRef] [Scilit] [PubMed]
  24. Boulanger, B.; Vargo, J.D.; Schnoor, J.L.; Hornbuckle, K.C. Evaluation of perfluorooctane surfactants in a wastewater treatment system and in a commercial surface protection product. Environ. Sci. Technol. 2005, 39, 5524–5530. [Google Scholar] [CrossRef] [Scilit] [PubMed]
  25. Díaz-Cruz, M.S.; Barceló, D. Determination of antimicrobial residues and metabolites in the aquatic environment by liquid chromatography tandem mass spectrometry. Anal. Bioanal. Chem. 2006, 386, 973–985. [Google Scholar] [CrossRef] [Scilit] [PubMed]
  26. Khetan, S.K.; Collins, T.J. Human pharmaceuticals in the aquatic environment: A challenge to green chemistry. Chem. Rev. 2007, 107, 2319–2364. [Google Scholar] [CrossRef] [Scilit] [PubMed]
  27. Leung, H.W.; Minh, T.B.; Murphy, M.B.; Lam, J.C.W.; So, M.K.; Martin, M.; Lam, P.K.S.; Richardson, B.J. Distribution, fate and risk assessment of antibiotics in sewage treatment plants in Hong Kong, South China. Environ. Int. 2012, 42, 1–9. [Google Scholar] [CrossRef] [Scilit] [PubMed]
  28. Gao, L.H.; Shi, Y.L.; Li, W.H.; Niu, H.Y.; Liu, J.M.; Cai, Y.Q. Occurrence of antibiotics in eight sewage treatment plants in Beijing, China. Chemosphere 2012, 86, 665–671. [Google Scholar] [CrossRef] [Scilit] [PubMed]
  29. Yao, Q.Y.; He, D.C.; Gong, D.X.; Ding, Z.R.; Zhao, B.; Zhang, M.W.; Li, Y.Q. Simultaneous Determination of Five Fluoroquinolone Antibiotics and in Wastewater by High Performance Liquid Chromatography-Tandem Mass Spectrometry. Environ. Monit. China 2017, 33, 139–146. [Google Scholar]
  30. Song, X.J.; Li, T.T.; Zhao, Y.; Yang, W.Y. Determination of 14 quinolones in seawater using solidphase extraction and ultra-high performance liquid chromatography-tandem mass spectrometry. Chem. Res. 2023, 34, 319–327, 332. [Google Scholar]
  31. Grabowski, Ł.; Gaffke, L.; Pierzynowska, K.; Cyske, Z.; Choszcz, M.; Węgrzyn, G.; Węgrzyn, A. Enrofloxacin—The Ruthless Killer of Eukaryotic Cells or the Last Hope in the Fight against Bacterial Infections? Int. J. Mol. Sci. 2022, 23, 3648. [Google Scholar] [CrossRef] [Scilit] [PubMed]
  32. LeBel, M. Ciprofloxacin: Chemistry, mechanism of action, resistance, antimicrobial spectrum, pharmacokinetics, clinical trials, and adverse reactions. Pharmacother. J. Hum. Pharmacol. Drug Ther. 1988, 8, 3–30. [Google Scholar] [CrossRef] [Scilit] [PubMed]
  33. Adams, W.J.; Claytor, C. Calculating aqueous environmental quality standards to protect human health: Derivation of a predicted No-effect concentration. Environ. Toxicol. Chem. 2021, 40, 291–292. [Google Scholar] [CrossRef] [Scilit] [PubMed]
  34. Li, L.; He, Y.; Song, K.; Xie, F.; Li, H.; Sun, F. Derivation of water quality criteria of zinc to protect aquatic life in Taihu Lake and the associated risk assessment. J. Environ. Manag. 2021, 296, 113175. [Google Scholar] [CrossRef] [Scilit] [PubMed]
  35. Li, Y.; Mu, D.; Wu, H.Q.; Liu, H.J.; Wang, Y.H.; Ma, G.C.; Duan, X.M.; Zhou, J.J.; Zhang, C.M.; Lu, X.H.; et al. Derivation of copper water quality criteria in Bohai Bay for the protection of local aquatic life and the ecological risk assessment. Mar. Pollut. Bull. 2023, 190, 114863. [Google Scholar] [CrossRef] [Scilit] [PubMed]
  36. Xu, Y.Q.; Huang, P.; Li, X.W.; Liu, S.S.; Lu, B.Q. Derivation of water quality criteria for paraquat, bisphenol A and carbamazepine using quantitative structure-activity relationship and species sensitivity distribution (QSAR-SSD). Sci. Total Environ. 2024, 948, 174739. [Google Scholar] [CrossRef] [Scilit] [PubMed]
  37. MEE. Technical Guideline for Deriving Water Quality Criteria for the Protection of Freshwater Aquatic Organisms (HJ 831-2022); Minisitry of Ecology and Environment of China: Beijing, China, 2022. (In Chinese)
  38. De Laender, F.; De Schamphelaere, K.A.; Vanrolleghem, P.A.; Janssen, C.R. Do we have to incorporate ecological interactions in the sensitivity assessment of ecosystems? An examination of a theoretical assumption underlying species sensitivity distribution models. Environ. Int. 2008, 34, 390–396. [Google Scholar] [CrossRef] [Scilit] [PubMed]
  39. Zhu, X. Improvement of Species Sensitivity Distributions Model for Aquatic Ecological Risk Assessment. Master’s thesis, Zhejiang University, Hangzhou, China, 2017. [Google Scholar]
  40. EEC-SSD, Version 1.0. P. R. C. National Ecological Environment Criteria Calculation Software-Species Sensitivity Distribution Method. National Ecological Environment Criteria Commission: Beijing, China, 2021. (In Chinese)
  41. Stephan, C.E.; Mount, D.I.; Hansen, D.J.; Gentile, J.H.; Chapman, G.A.; Brungs, W.A. Guidelines for Deriving Numerical National Water Quality Criteria for the Protection of Aquatic Organisms and Their Uses; U.S. Environmental Protection Agency: Washington, DC, USA, 1985.
  42. Wen, J.; Cui, X.; Gibson, M.; Li, Z. Water quality criteria derivation and ecological risk assessment for triphenyltin in China. Ecotoxicol. Environ. Saf. 2018, 161, 397–401. [Google Scholar] [CrossRef] [Scilit] [PubMed]
Figure 1. Technical pathway for developing national WQC for three typical quinolone antibiotics.
Toxics 14 00864 g001
Figure 2. The fitting results of the four models for AVEs ((a): normal distribution model; (b): log-normal distribution model; (c): logistic model; (d): log-logistic model; The dashed lines in the figure are auxiliary lines used to indicate the HC5 of each antibiotic).
Toxics 14 00864 g002
Figure 3. The fitting results of the four models for CVEs ((a): normal distribution model; (b): log-normal distribution model; (c): logistic model; The dashed lines in the figure are auxiliary lines used to indicate the HC5 of each antibiotic).
Toxics 14 00864 g003
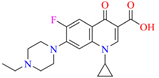
Table 1. Basic information about the three quinolone antibiotics.
AntibioticCAS NumberMolecular FormulaMolecular WeightChemical Structures
Norfloxacin70458-96-7C16H18FN3O3319.33Toxics 14 00864 i001
Enrofloxacin93106-60-6C19H22FN3O3359.39Toxics 14 00864 i002
Ciprofloxacin85721-33-1C17H18FN3O3331.34Toxics 14 00864 i003
Table 2. Norfloxacin AVEs and CVEs of the baseline water-quality condition.
SpeciesAVEs (mg/L)SpeciesCVEs (mg/L)
Microcystis wesenbergii0.038Microcystis aeruginosa0.0016
Microcystis aeruginosa0.062Microcystis wesenbergii0.0063
Anabaena variabilis0.19Anabaena flosaguas0.009
Anabaena flosaguas0.29Anabaena variabilis0.0098
Synechococcus leopoliensis0.63Anabaena sp.0.025
Nostoc commune Vauch.1.7Synechococcus leopoliensis0.16
Anabaena sp.5.6Daphnia magna0.17
Chlorella vulgaris10.4Nostoc commune Vauch.0.31
Raphidocelis subcapitata18Ceriodaphnia dubia2.5
Selenastrum capricornutum28.04Selenastrum capricornutum4.01
Ceriodaphnia dubia40.98Chlorella vulgaris4.02
Daphnia magna223.12
Table 3. Enrofloxacin AVEs and CVEs of the baseline water-quality condition.
SpeciesAVEs (mg/L)SpeciesCVEs (mg/L)
Raphidocelis subcapitata3.1Chlorella pyrenoidosa0.125
Chlorella vulgaris22.58Pseudokirchneriella subcapitata0.952
Litopenaeus vannamei25.54Chrysosporum ovalisporum1.17
Daphnia carinata25.74Chlorella vulgaris1.26
Ceriodaphnia dubia30.98Ceriodaphnia dubia2
Microcystis aeruginosa49Daphnia magna8.66
Daphnia magna63.74Pimephales promelas10
Scenedesmus quadricauda88.8Litopenaeus vannamei18.65
Oryzias latipes100Barchydanio rerio var105.56
Danio rerio105.56Moina macrocopa200
Gobiocypris rarus146.99
Tetradesmus obliquus195.6
Moina macrocopa239.04
Table 4. Ciprofloxacin AVEs and CVEs of the baseline water-quality condition.
SpeciesAVEs (mg/L)SpeciesCVEs (mg/L)
Lemna gibba1.02Eisenia fetida0.112
Daphnia magna1.03Lemna gibba0.35
Chironomus riparius4.8Selenastrum capricornutum1.37
Lumbriculus variegatus4.8Ceriodaphnia dubia2.5
Raphidocelis subcapitata6.7Oncorhynchus mykiss3.31
Microcystis aeruginosa17Ceriodaphnia dubia4.27
Chlorella vulgaris20.614Raphidocelis subcapitata5
Ceriodaphnia dubia22.45Daphnia magna6.77
Xenopus laevis100Xenopus laevis100
Danio rerio122.47Brachydanio rerio100
Lemna minor L.203Closterium ehrenbergii Menegh200
Dugesia japonica1000
Table 5. Model fitting results for acute WQC.
Acute ToxicityAntibioticHC5HC10HC25HC50HC75HC90HC95RMSEp (A–D)
Normal distribution modelNorfloxacin0.0380.0680.3692.40515.66884.625232.2200.058>0.05
Enrofloxacin14.24619.20031.60854.99295.697157.543212.2760.075>0.05
Ciprofloxacin1.0001.4885.76225.936116.735452.0641016.4830.056>0.05
Log-normal distribution modelNorfloxacin2.5603.1565.00010.37129.950116.708337.443\ *>0.05
Enrofloxacin17.37021.43931.57251.41689.702158.271229.9320.071>0.05
Ciprofloxacin1.0401.0901.3773.955369.999\\0.160<0.05
Logistic modelNorfloxacin0.0210.0700.4172.47514.70087.315293.3410.064>0.05
Enrofloxacin13.81219.21331.21450.71082.385133.844186.1830.075>0.05
Ciprofloxacin0.6751.7206.79526.848106.083419.1641067.2120.061>0.05
Logarithmic logistic modelNorfloxacin\\\\\\\\\
Enrofloxacin16.87321.40531.51048.70579.537138.182209.2580.076>0.05
Ciprofloxacin1.1101.2542.0309.1621023.4672.62 × 1092.89 × 10200.129<0.05
* “\”indicates that no specific value was fitted.
Table 6. Model fitting results for chronic WQC.
Acute ToxicityAntibioticHC5HC10HC25HC50HC75HC90HC95RMSEp (A–D)
Normal distribution modelNorfloxacin0.0020.0030.0150.0970.6363.4369.4320.073>0.05
Enrofloxacin0.1250.1250.5372.93516.05174.063184.9270.056>0.05
Ciprofloxacin0.3500.3521.0963.87613.70342.70784.3140.084>0.05
Log-normal distribution modelNorfloxacin3.3973.8694.9616.90410.28315.78321.164\ *>0.05
Enrofloxacin1.9582.3643.6717.83626.008137.880549.414\>0.05
Ciprofloxacin1.4211.6172.2514.26813.40679.891400.221\>0.05
Logistic modelNorfloxacin0.0010.0030.0150.0920.5513.28911.0880.076>0.05
Enrofloxacin0.0530.1440.6202.67311.51949.636134.0540.067>0.05
Ciprofloxacin0.2130.4281.1983.3529.38126.25252.8590.075>0.05
Logarithmic logistic modelNorfloxacin\\\\\\\\\
Enrofloxacin\\\\\\\\\
Ciprofloxacin\\\\\\\\\
* “\”indicates that no specific value was fitted.
Table 7. Summary of the results of WQC derivation.
AntibioticCriteria CategoryNumber of SpeciesWQC (mg/L)
NorfloxacinSWQC120.019
LWQC110.0008
EnrofloxacinSWQC78.685
LWQC50.0625
CiprofloxacinSWQC100.5
LWQC60.106
Disclaimer/Publisher’s Note: The statements, opinions and data contained in all publications are solely those of the individual author(s) and contributor(s) and not of MDPI and/or the editor(s). MDPI and/or the editor(s) disclaim responsibility for any injury to people or property resulting from any ideas, methods, instructions or products referred to in the content.