3.1. Toluene Adsorption on Dealuminated Zeolites
The N
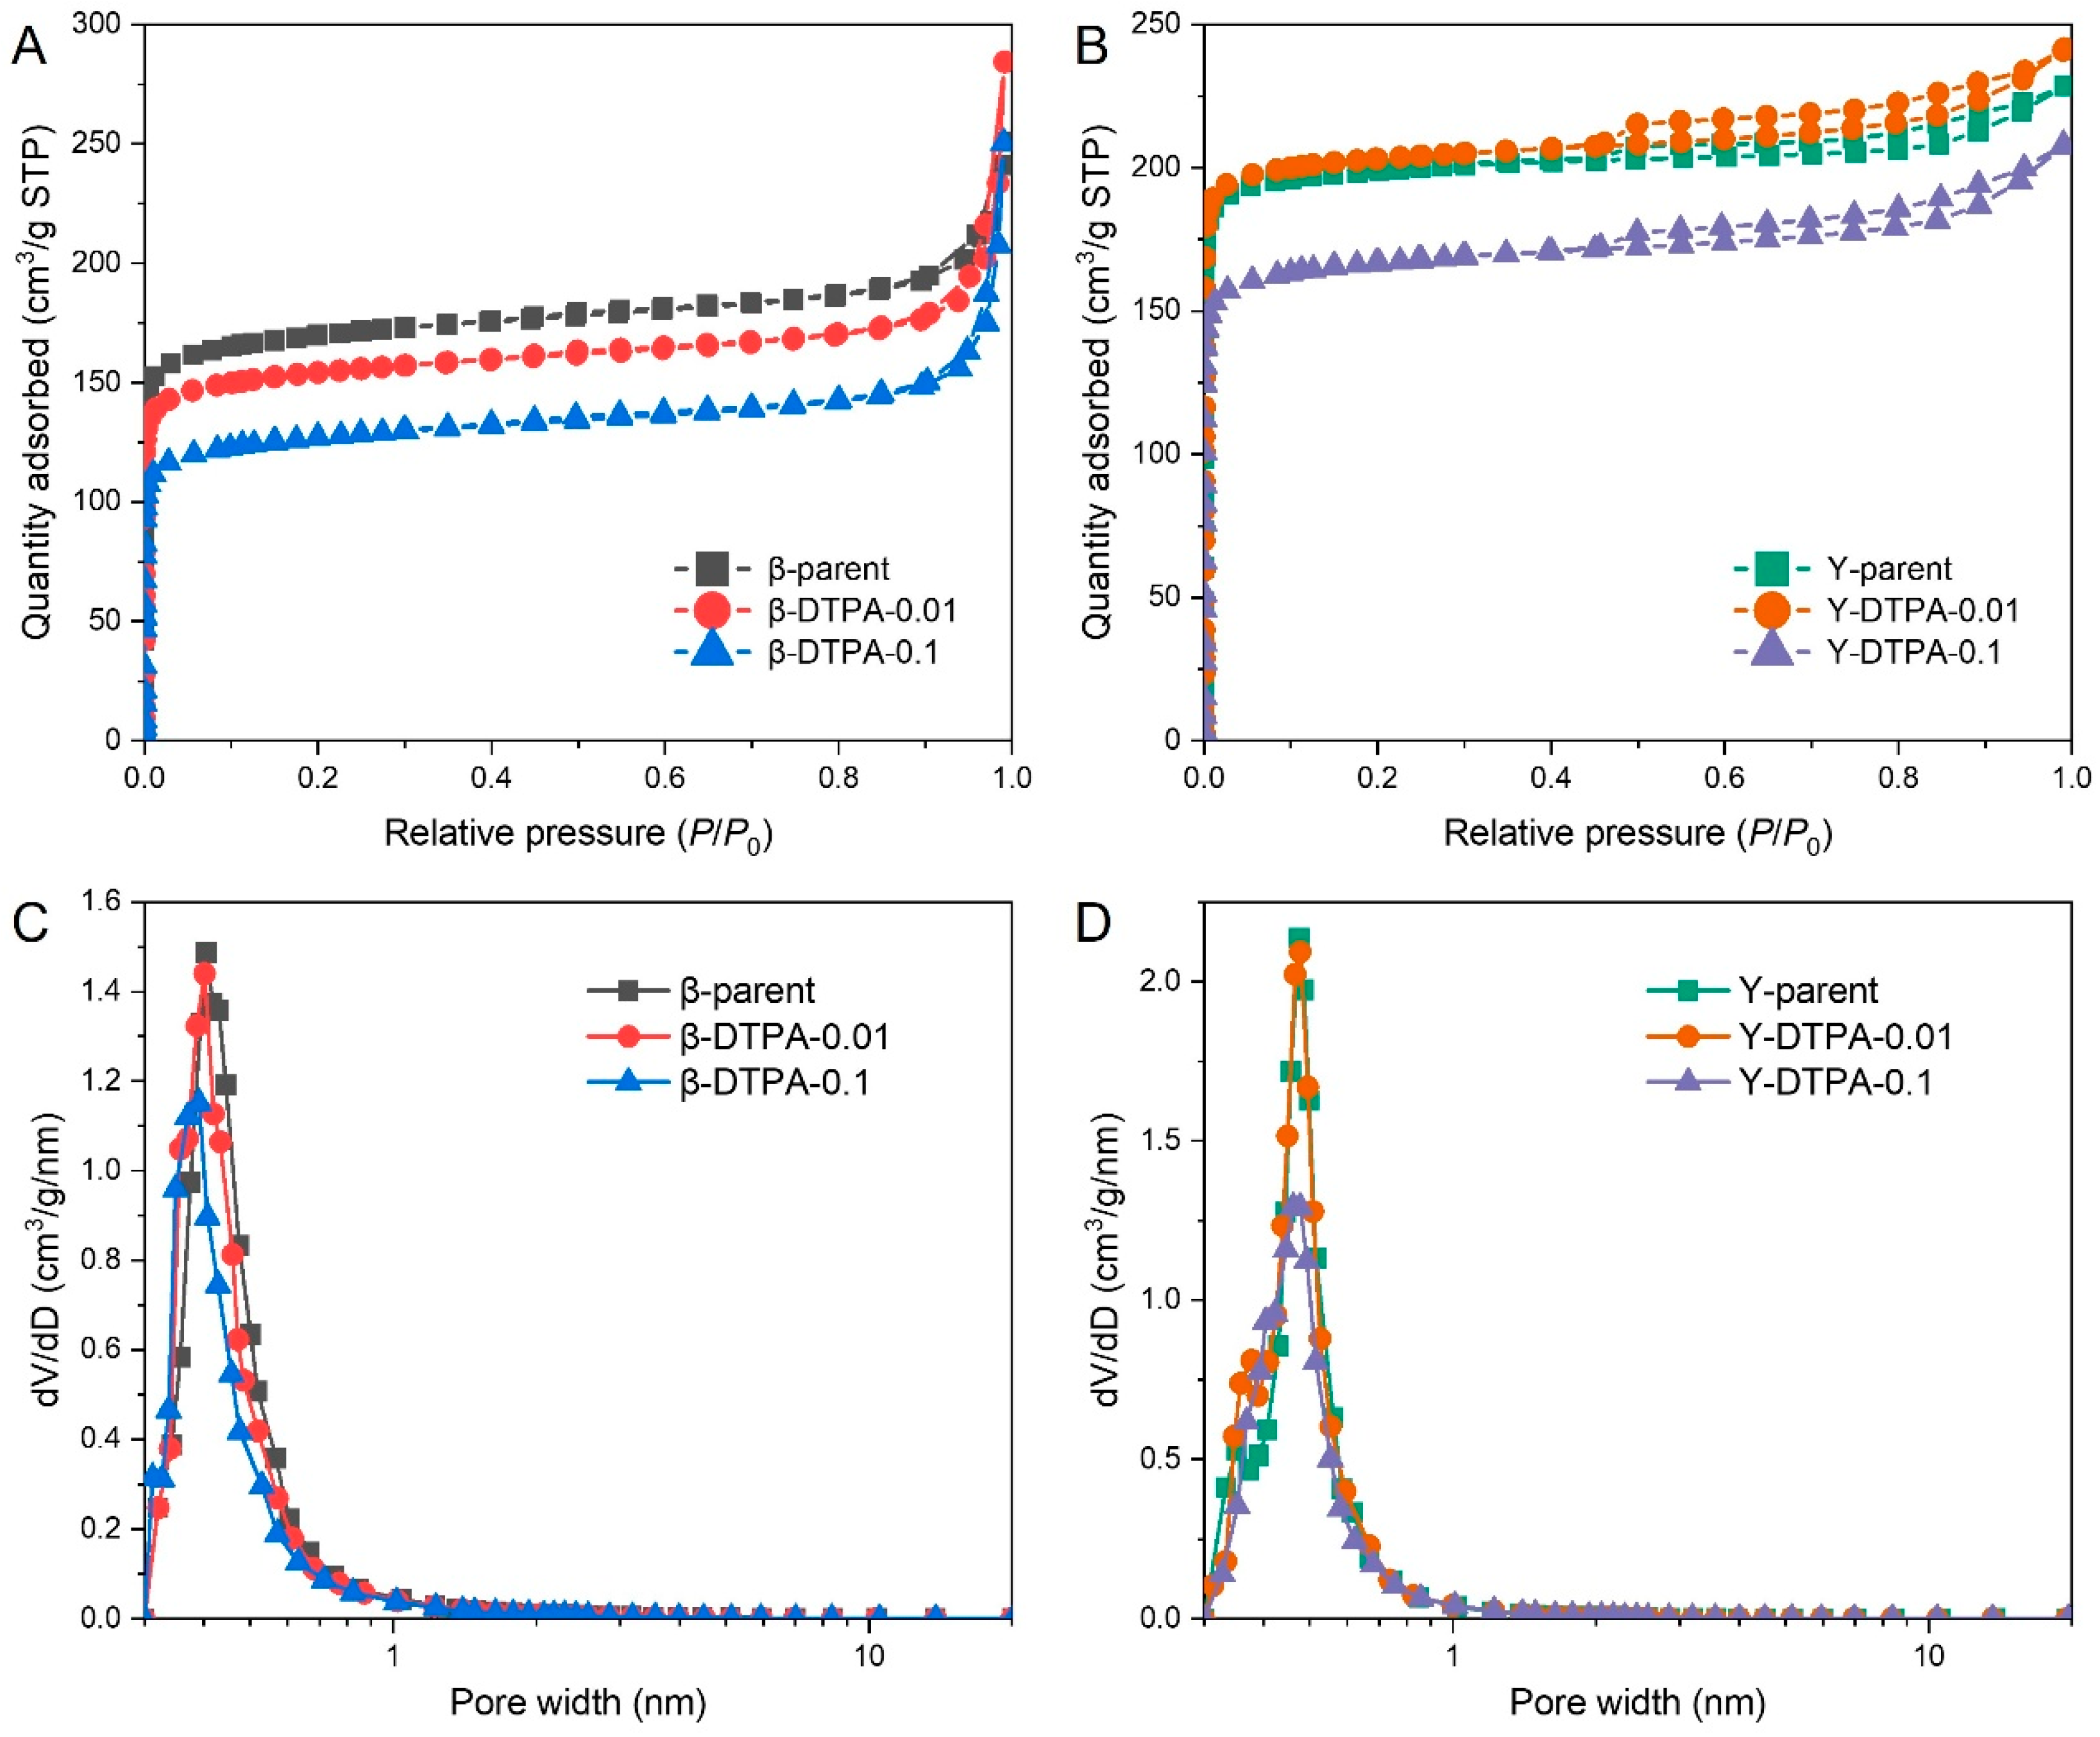
2 adsorption–desorption isotherms of Beta and Y zeolites before and after chelation treatment are shown in
Figure 1A,B. The isotherms of Beta zeolites are close to type I, with a distinct increase in N
2 uptake at high relative pressures (
P/
P0 > 0.9), indicating the coexistence of micropores and intercrystalline mesopores. This is further supported by the pore hierarchy (i.e.,
Vmic/
Vt ranging from 0.47 to 0.63) listed in
Table 1. After DTPA treatment, both β-DTPA-0.01 and β-DTPA-0.1 samples show a significant decrease in N
2 uptake at
P/
P0 < 0.01, although the isotherm type remains unchanged. This suggests that the loss of microporosity arises from partial framework destruction and the formation of amorphous species, which can probably migrate into the channels and block the micropores during DTPA chelation. Similar pore-blocking effects have also been reported when amorphous species are deposited within zeolite channels [
18]. Specifically, the BET surface area of the parent Beta zeolite decreases from 670 m
2/g to 609 m
2/g and 496 m
2/g, while the micropore volume drops from 0.24 cm
3/g to 0.23 cm
3/g and 0.18 cm
3/g, respectively. The corresponding DFT pore size distribution (PSD) profiles of the Beta zeolites, shown in
Figure 1C, also confirm the reduced microporosity centered around approximately 0.6 nm. The Y zeolites exhibit typical type I isotherms, with a small hysteresis loop appearing at
P/
P0 > 0.4, indicating that microporosity is dominant with a small amount of mesopores. This is consistent with their high pore hierarchy values (
Vmic/
Vt of 0.76 to 0.86). After treatment with 0.01 M DTPA, a slight increase in N
2 uptake is observed, and the surface area increases from 810 m
2/g to 827 m
2/g. This suggests that mild chelation with DTPA may help remove pore-blocking EFAl species with minimal damage to the FAU zeolite framework. However, when the DTPA concentration is increased to 0.1 M, a notable decrease is observed in both surface area and micropore volume, from 810 m
2/g to 670 m
2/g and from 0.30 cm
3/g to 0.25 cm
3/g, respectively. These changes in porosity are also supported by the corresponding DFT PSD data in
Figure 1D.
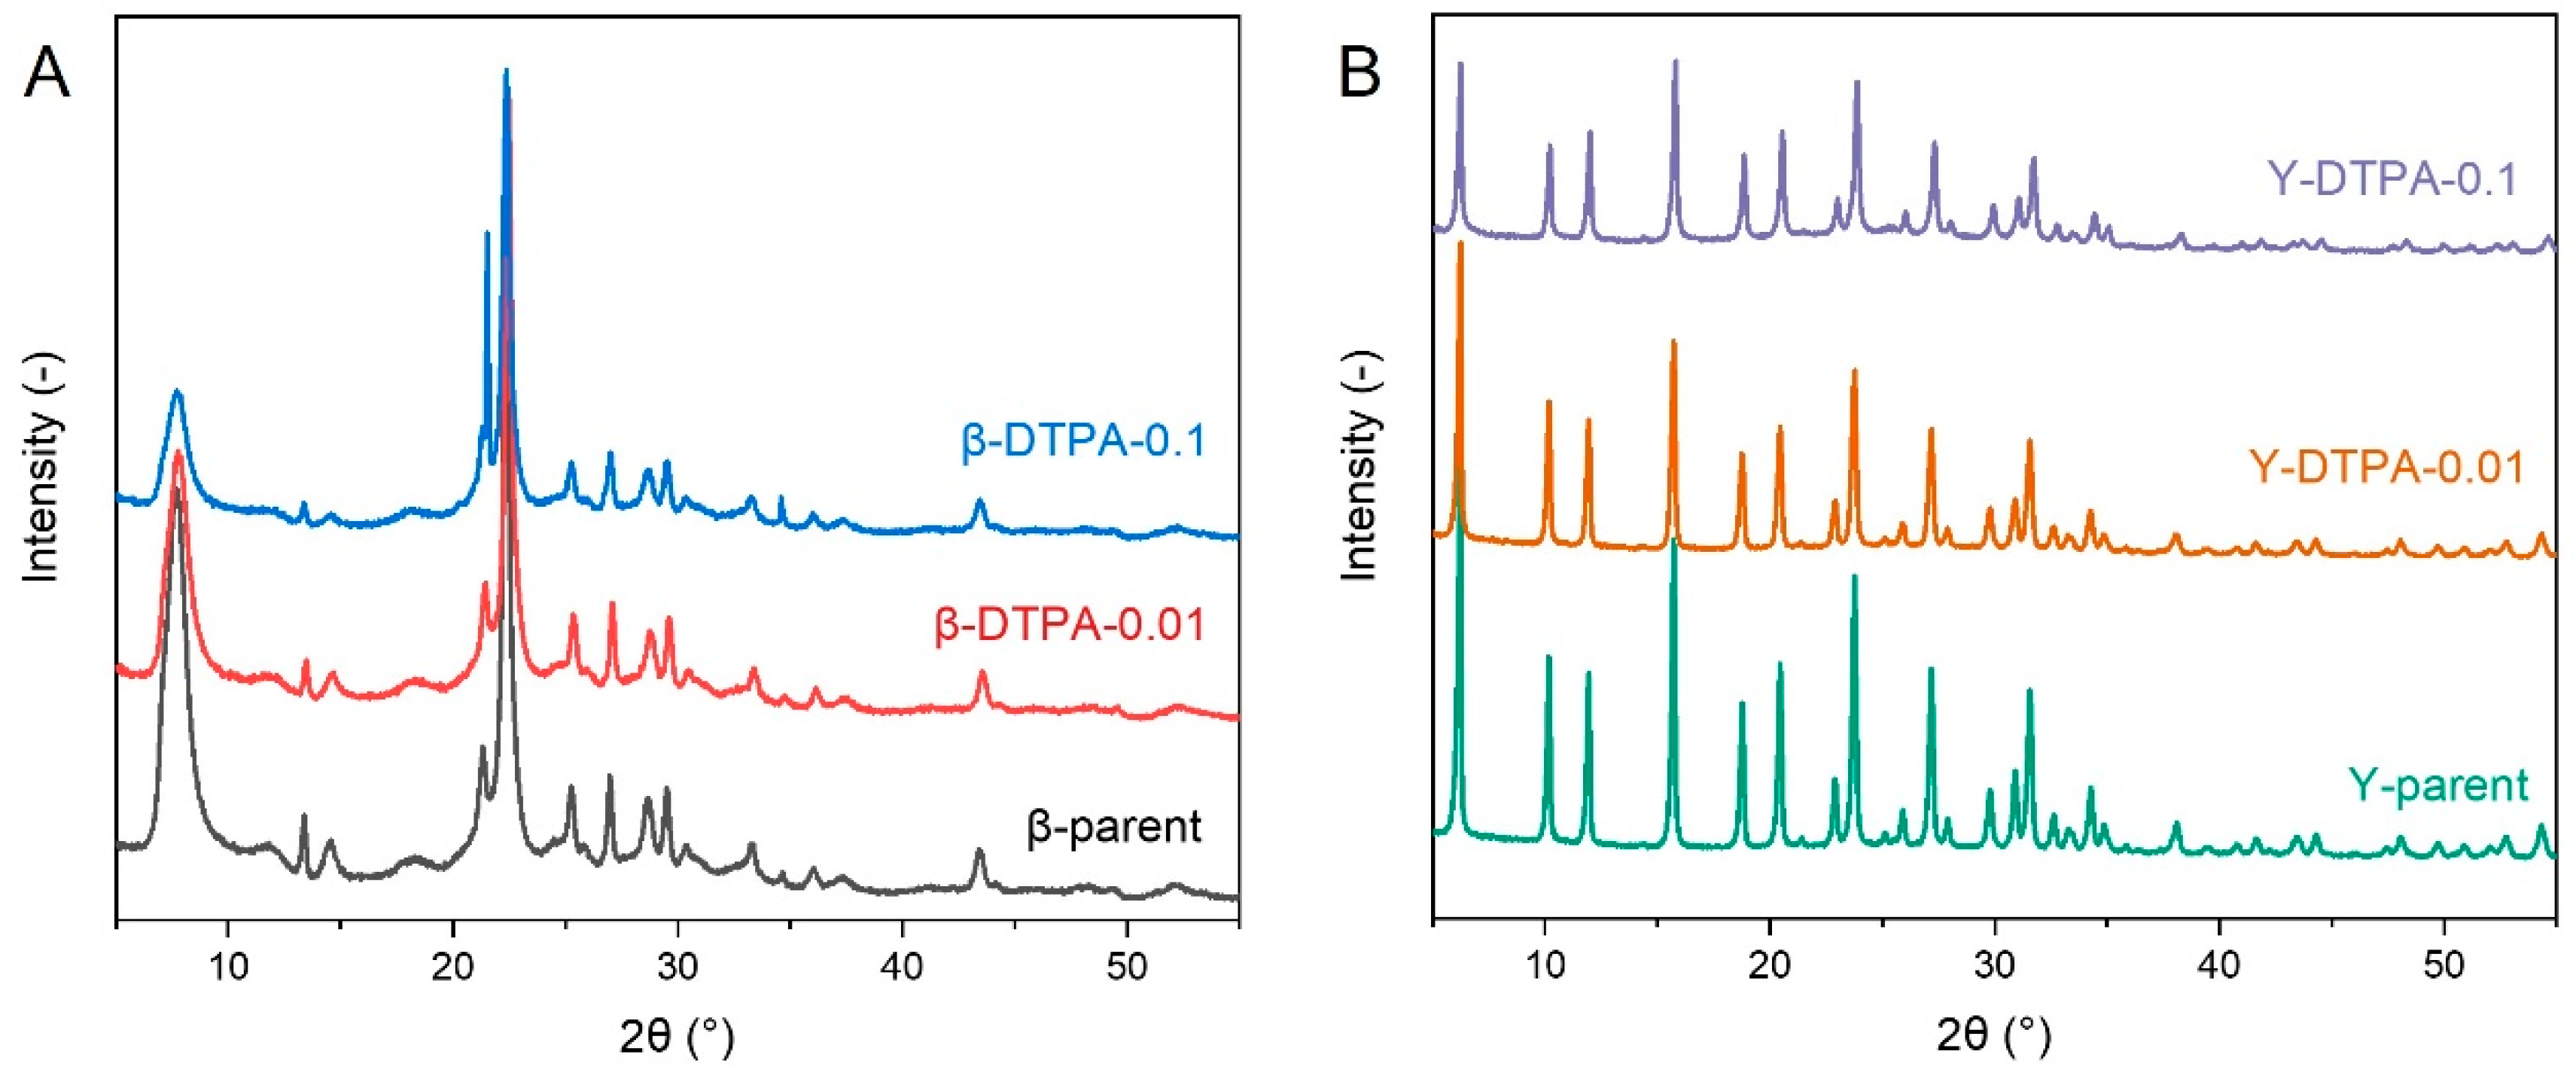
The structural stability of Beta and Y zeolites is differently affected by DTPA treatment, as shown by the XRD patterns of the parent and modified zeolites in
Figure 2. As for the Beta zeolite, the diffraction peak positions in
Figure 2A remain unchanged after treatment with 0.01 M and 0.1 M DTPA, indicating that the BEA-type framework is preserved. However, a noticeable decrease in peak intensity is observed, with the relative crystallinity declining from 100% in the parent Beta to 80% in β-DTPA-0.01 and 62% in β-DTPA-0.1. This suggests that even at a low DTPA concentration of 0.01 M, distinctive removal of framework aluminum occurs, evidenced by the increase in SAR from 12.5 to 17.5, accompanied by a decrease in the total acid amount from 1.27 mmol/g to 0.84 mmol/g (
Table S1). The extent of structural degradation intensifies with increasing DTPA concentration to 0.1 M (SAR further increases to 23.5). Differently, as shown in
Figure 2B, the Y zeolite treated with 0.01 M DTPA maintains a relative crystallinity above 90%, while treatment with 0.1 M DTPA leads to a more significant reduction to 55%. Even after 0.1 M DTPA treatment, the Si/Al ratio of the Y zeolite increases only to 5.7, which is consistent with previous reports on chelation treatment of Y zeolite [
19]. All these changes in crystallinity align with the observed loss of pore volume after DTPA treatment. The differing sensitivity to DTPA-induced dealumination between Beta and Y zeolites can be attributed to their different framework topologies. Beta zeolite features a three-dimensional, fully connected 12-membered ring (12-MR) channel system, which allows partial diffusion of the bulky DTPA molecules into the pore network even at low concentrations. This leads to more extensive structural degradation in Beta. In contrast, Y zeolite has a cage-like structure composed of supercages interconnected by relatively narrow channels, which sterically hinder the diffusion of DTPA molecules, thereby limiting the extent of dealumination within the Y zeolite framework.
Figure 3A,B present the dynamic toluene (420 ppm) adsorption curves, highlighting the contrasting behavior of Beta and Y zeolites. For the Beta zeolite, the parent sample exhibits a high toluene uptake capacity of 120 mg/g within 150 min. After treatment with 0.01 M DTPA, the capacity decreases to 106 mg/g, and further drops to 78 mg/g at 0.1 M. This decrease indicates that the loss of porosity caused by DTPA-induced dealumination has a strong negative impact on toluene capture performance. In contrast, the parent Y zeolite shows a much lower adsorption capacity of 59 mg/g, significantly lower than any of the Beta samples. This can be attributed to its much lower SAR (2.6) compared to that of Beta (12.5), resulting in a framework with higher polarity, which limits its affinity toward toluene molecules with weak polarity. After DTPA treatment, a clear enhancement in toluene adsorption capacity is observed: Y-DTPA-0.01 reaches 82 mg/g and Y-DTPA-0.1 further increases to 110 mg/g, even surpassing the modified Beta samples. Despite the reduction in surface area in dealuminated Y zeolites, the improved toluene adsorption capacity can be ascribed to more favorable framework chemistry, particularly the reduced polarity. Although the dynamic adsorption behavior within 150 min did not reach complete equilibrium, kinetic model fitting (using pseudo-first-order and pseudo-second-order models) was employed to provide an overall understanding of toluene adsorption on Beta and Y zeolites and to predict the saturated adsorption capacity. As shown in
Figure S1 and
Table 2, the pseudo-first-order model provides a significantly better fit (
R2 > 0.995) compared to the pseudo-second-order model. This suggests that toluene uptake on these zeolites follows a physical adsorption mechanism rather than a chemical one [
20]. Specifically, the pseudo-first-order rate constant
K1 for toluene adsorption on Beta zeolites follows the trend: β-parent > β-DTPA-0.01 > β-DTPA-0.1, whereas for Y zeolites, the trend is reversed: Y-parent < Y-DTPA-0.01 < Y-DTPA-0.1. This trend in the pseudo-first-order constant
K1 indicates that DTPA modification impairs the adsorption kinetics of Beta zeolites but significantly enhances those of Y zeolites, highlighting a more favorable kinetic response to dealumination in the latter.
Overall, mild treatment with low-concentration DTPA (0.01 M) effectively preserves the crystallinity and pore structure of both Y and Beta zeolites, while notably enhancing the toluene adsorption capacity and kinetics of Y zeolite.
3.2. Pt Loading and Toluene Catalytic Oxidation
The obtained Beta and Y zeolites were used as supports for Pt loading via an impregnation method (theoretical Pt content 0.5 wt%), and DTPA treatment was found to influence the Pt loading in a concentration-dependent manner. XPS analysis was conducted to determine the actual content and valence states of Pt species on the zeolites, as summarized in
Table 3 (survey spectra are provided in
Figure S2). In general, the actual Pt contents on Y zeolites were found to be higher than those on Beta zeolites, indicating that Y zeolite offers a more favorable environment for Pt dispersion, likely due to its relatively larger BET surface area. Interestingly, a consistent trend was observed across both zeolite types: treatment with 0.01 M DTPA resulted in higher Pt loading compared to the parent samples. For example, the Pt content increased from 0.18 at% on parent Beta to 0.21 at% on β-DTPA-0.01-Pt. This enhancement can be attributed to the removal of EFAl species from the zeolite pores, which facilitates better diffusion and stabilization of Pt species. However, when the DTPA concentration was increased to 0.1 M, the Pt loading on β-DTPA-0.1-Pt and Y-DTPA-0.1-Pt decreased to 0.13 at% and 0.34 at%, respectively, being even lower than those on their parent counterparts. This decrease in Pt loading content is due to the loss of available anchoring sites caused by the reduced surface area after a more severe dealumination.
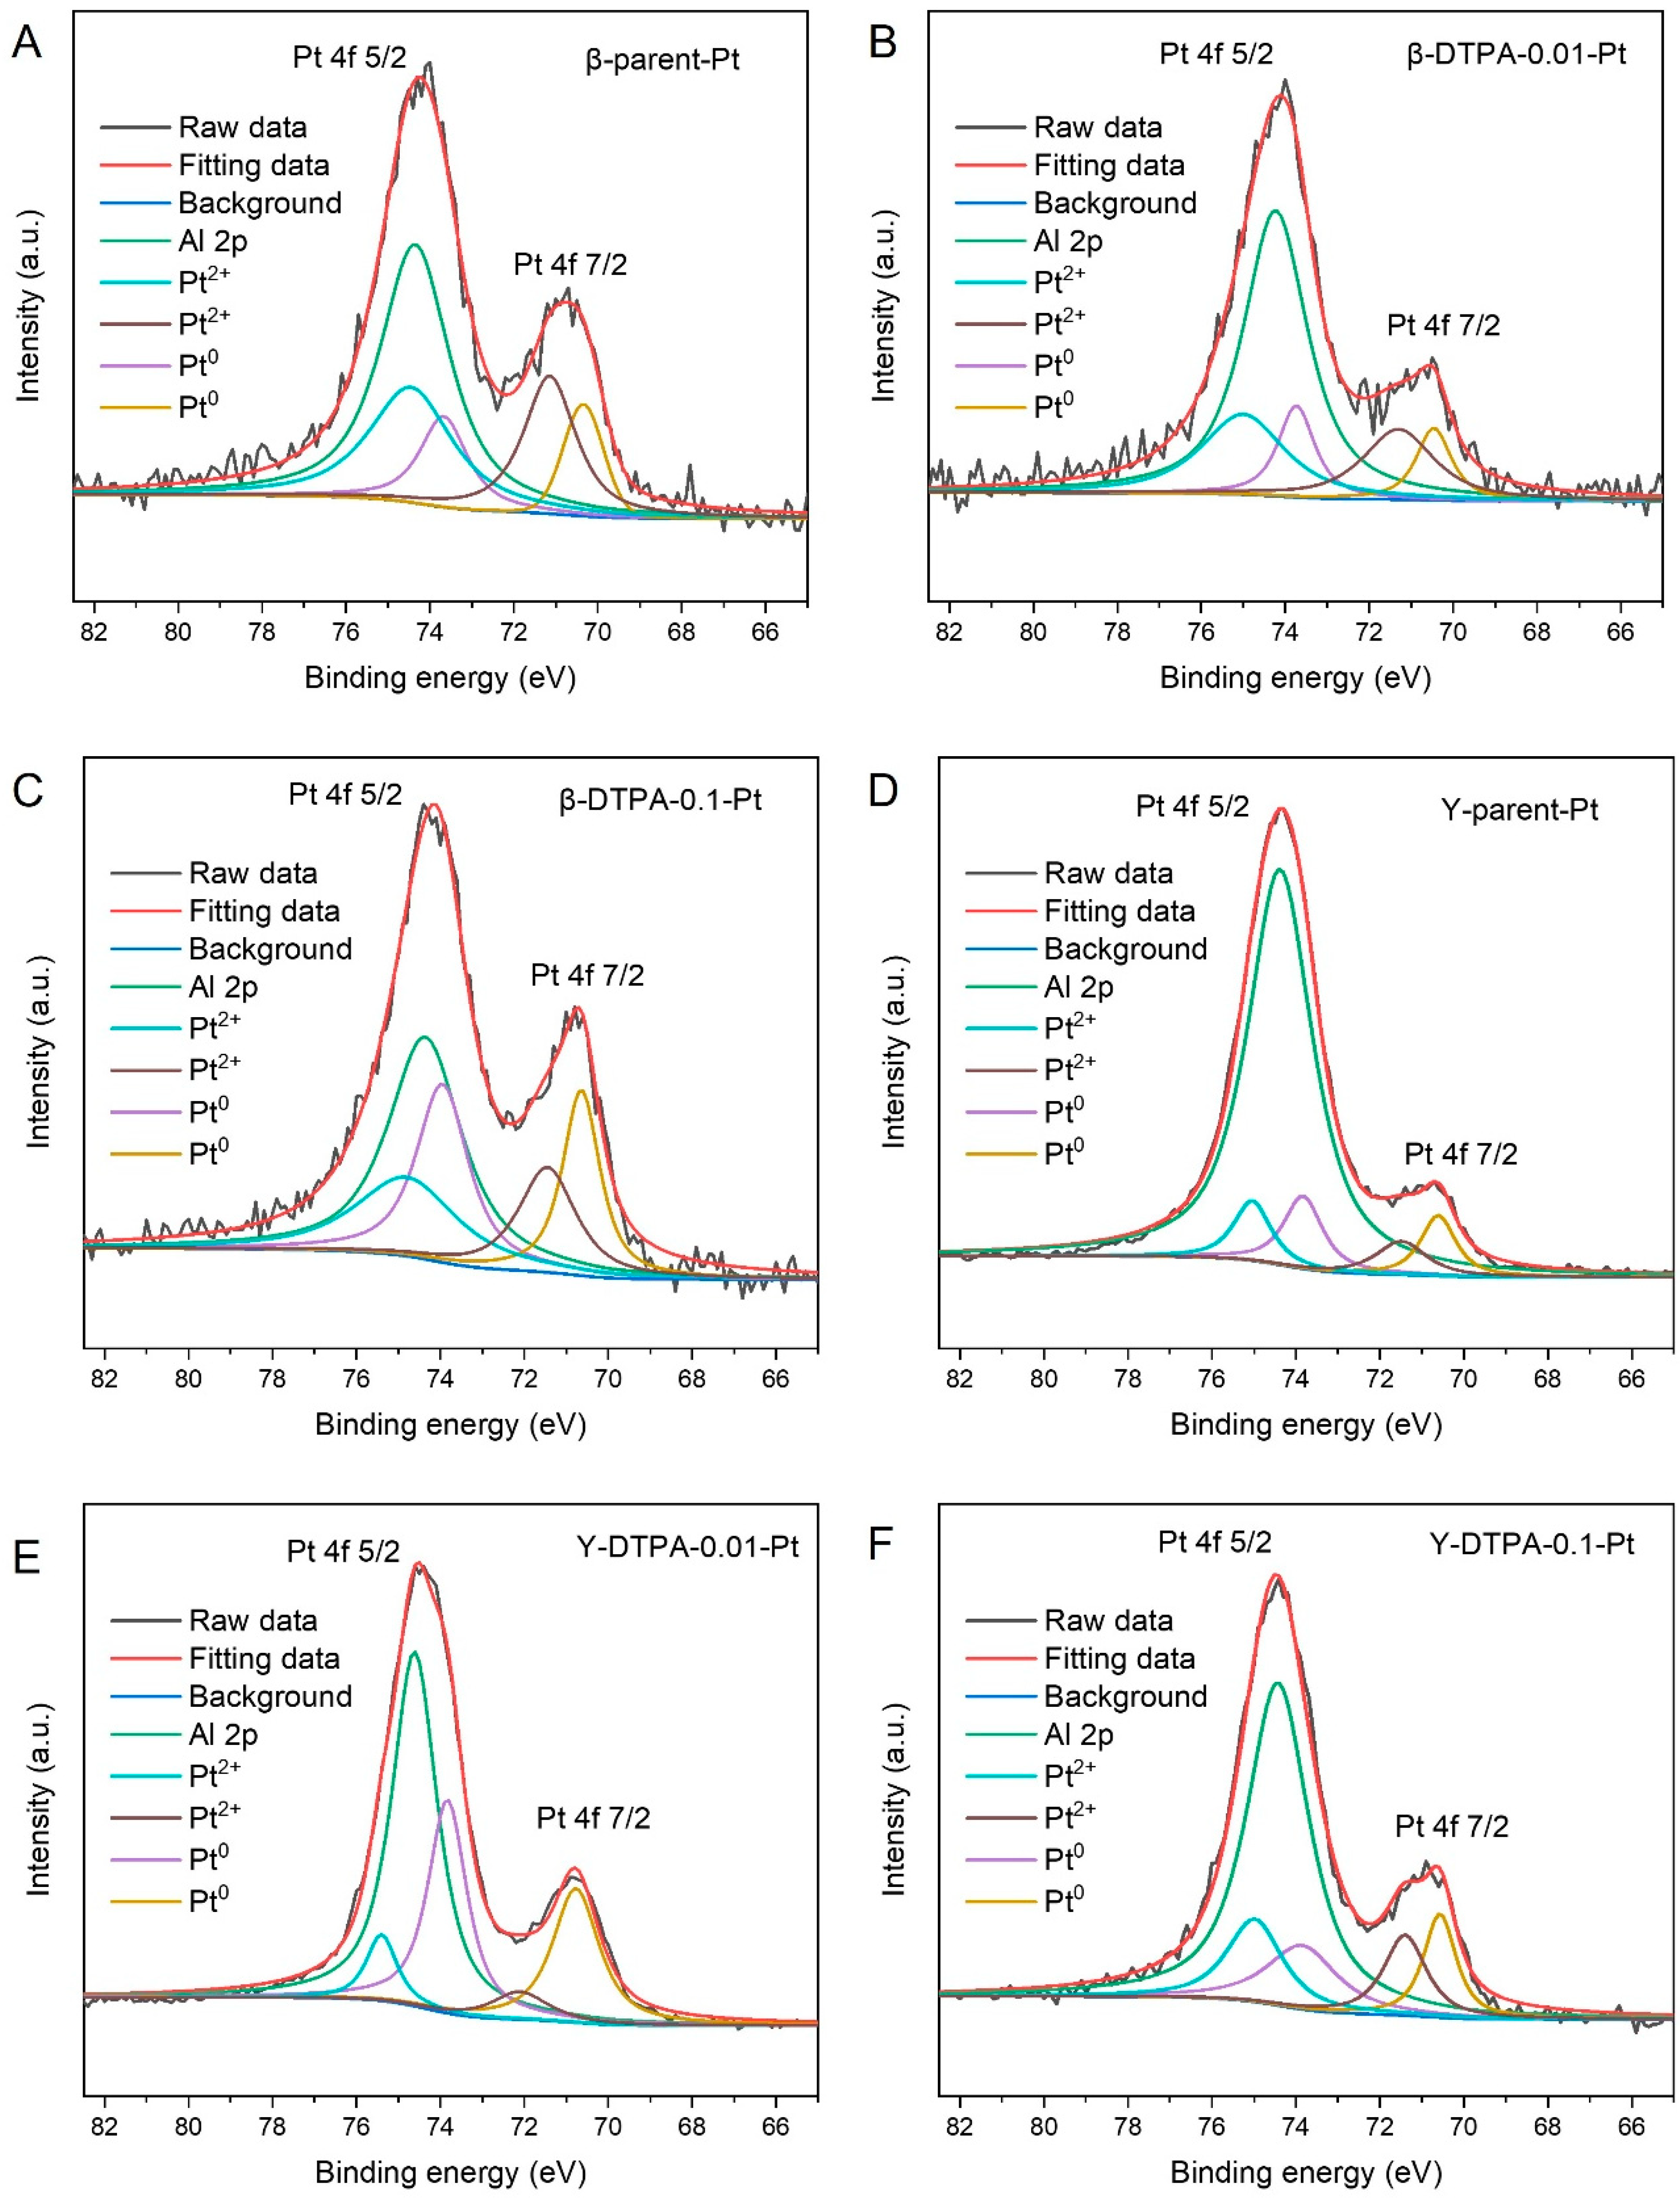
Figure 4A–F show the high-resolution Pt 4f XPS spectra of all Pt-loaded zeolites. The spectra were deconvoluted into Pt
0 and Pt
2+ species, with the Pt 4f
7/2 and Pt 4f
5/2 peaks exhibiting a fixed splitting of approximately 3.3 eV in binding energy. Specifically, the binding energies for Pt
0 are 71.2 eV (4f
7/2) and 74.5 eV (4f
5/2), while those for Pt
2+ appear at 72.4 eV (4f
7/2) and 75.7 eV (4f
5/2). Notably, no peaks corresponding to Pt
4+ species were observed in any sample. Additionally, the Al 2p signal at around 74.2 eV overlaps with the Pt 4f
5/2 signals, which complicates the deconvolution of Pt species [
21]. To quantitatively evaluate the valence states and redox properties of Pt species on the zeolites, the area ratio of Pt
0 to Pt
2+ was calculated and is listed in
Table 3. In this study, the Pt
0/Pt
2+ ratios of β-parent-Pt and Y-parent-Pt are 0.47 and 0.69, respectively. After treatment of the zeolite supports with 0.01 M DTPA, the Pt
0/Pt
2+ ratios slightly increased to 0.50 for β-DTPA-0.01-Pt and 0.70 for Y-DTPA-0.01-Pt. When the DTPA concentration was increased to 0.1 M, the Pt
0/Pt
2+ ratios significantly increased to 1.14 for β-DTPA-0.1-Pt and 0.98 for Y-DTPA-0.1-Pt. These results indicate that treatment with 0.1 M DTPA substantially increases the proportion of metallic Pt
0 on the zeolite surface, whereas the effect is negligible at the lower concentration of 0.01 M. The higher proportion of Pt
0 is attributed to the formation of more Pt
0 clusters or nanoparticles on the zeolite supports.
Based on the above analysis, sample Y-DTPA-0.01-Pt, which exhibits the highest Pt content along with a moderate Pt
0/Pt
2+ ratio, was selected as a representative for further discussion. SEM images of Y-DTPA-0.01-Pt are shown in
Figure 5A–C.
Figure 5A shows the typical aggregation characteristics of FAU crystals, with each crystal having geometric shapes ranging from hundreds of nanometers to microns. Higher-magnification images in
Figure 5B,C reveal that the external surfaces of Y-DTPA-0.01-Pt remain smooth, with some nanosized particles observed on the surface, which are tentatively attributed to Pt nanoparticles introduced by impregnation.
Figure 5D–F present SEM-EDS elemental maps of Si, Al, and Pt across the zeolite surface, showing that Pt species are uniformly distributed on the external surface of Y-DTPA-0.01-Pt. HRTEM images in
Figure 5G illustrate that the internal framework of Y-DTPA-0.01-Pt remains dense and well-ordered, indicating that the mild 0.01 M DTPA treatment did not cause visible damage to the FAU zeolite microstructure. In addition, darker features at the nanometer scale are visible throughout the zeolite matrix, suggesting the presence of uniformly dispersed Pt nanoparticles. An HRTEM image in
Figure 5H provides a clearer view of the Pt nanocrystals, form which the particle size distribution was extracted using threshold segmentation methods and is shown in
Figure 6. It presents that the size of Pt nanoparticles loaded on Y-DTPA-0.01-Pt nearly follows a normal distribution, mostly within the size range of 7 to 9 nm. Although the frequency of particles in the 0–3 nm range is relatively low, some nano- or sub-nanometer Pt species (e.g., ultra-small clusters or single atoms) may not be able to be detected by the TEM with such a resolution.
Figure 5I with a higher magnification shows lattice fringes with a spacing of 0.226 nm for the Pt nanoparticles, corresponding to the (111) plane of metallic Pt
0 rather than Pt oxide, confirming the presence of Pt
0 nanoparticles.
Figure 7A,B show the toluene catalytic oxidation efficiency over the Beta and Y series zeolite catalysts loaded with Pt, respectively. Overall, the Y-series catalysts require significantly lower temperatures for toluene oxidation compared to their Beta-series counterparts. For example, Y-DTPA-0.01-Pt achieves 90% toluene removal efficiency at 150 °C, while β-DTPA-0.01-Pt reaches only 15% at the same temperature. This difference can be supported by characterization results, which reveal higher Pt content and more developed micropores for the Y-series zeolites, providing a greater number of active sites for catalytic oxidation. As shown in
Figure 7A, the T
90 values (the temperature at which toluene removal efficiency is 90%) for the Beta-series catalysts follow the order: β-DTPA-0.01-Pt > β-DTPA-0.1-Pt > β-Parent-Pt. A similar trend is observed for the Y-series catalysts in
Figure 7B, with the sequence Y-DTPA-0.01-Pt > Y-DTPA-0.1-Pt > Y-Parent-Pt. These results confirm that DTPA treatment of the supports enhances the catalytic performance of Pt-loaded zeolites for toluene oxidation. In addition, catalysts supported on zeolites treated with mild DTPA chelation (0.01 M) outperform those treated more severely (0.1 M). This can be tentatively attributed to a higher Pt loading content in Y-DTPA-0.01-Pt than Y-DTPA-0.1-Pt, making the active sites in the former is more sufficient than in the latter. Compared with conventionally post-treated zeolite catalysts, Beta-DTPA-0.01 obtained via chelation exhibits a higher specific surface area than the HNO
3-treated sample (as listed in
Table S2), while its Pt-loaded counterpart achieves a markedly lower T
90 in toluene oxidation (ca. 160 °C vs. 190 °C). For Y zeolite, although Y-DTPA-0.01-Pt shows a T
90 comparable to that of catalysts post-treated by NH
4HF
2 and NH
4OH treatments (ca. 150 °C vs. 149 °C), the chelation strategy employed here avoids the use of fluorides, thereby mitigating potential environmental concerns [
22].
Figure 7C,D illustrate the CO
2 selectivity during toluene catalytic oxidation. As for the Beta series, all catalysts exhibit CO
2 selectivity high to 99% at temperatures above 200 °C, indicating the nearly complete conversion from toluene into CO
2 and H
2O. At lower temperatures (150 and 175 °C), the selectivity decreases to approximately 92%, accompanied by the formation of partial oxidation intermediates such as benzaldehyde or benzoic acid. Among Y series samples, the Y-DTPA-0.01-Pt catalyst delivers the best overall performance in the Y series, achieving both the highest toluene conversion and excellent CO
2 selectivity, i.e., exceeding 90% even at 150 °C and reaching complete oxidation above 200 °C. In comparison, Y-DTPA-0.1-Pt, which contains fewer Pt active sites, exhibits lower selectivity, and the untreated Y-parent-Pt performs also being worse than Y-DTPA-0.01-Pt. The superior performance of Y-DTPA-0.01-Pt can be attributed to its combination of the highest Pt loading content and a moderate Pt
0/Pt
2+ ratio, which together enhance both toluene oxidation and CO
2 selectivity, confirming the effectiveness of moderate dealumination by DTPA imposed on zeolite support.
3.3. Mechanisms for Defect-Pt Interaction
Y-DTPA-0.01-Pt exhibits the highest catalytic performance for toluene oxidation among all samples, however, the specific state of Pt species on the zeolite support remains to be further elucidated.
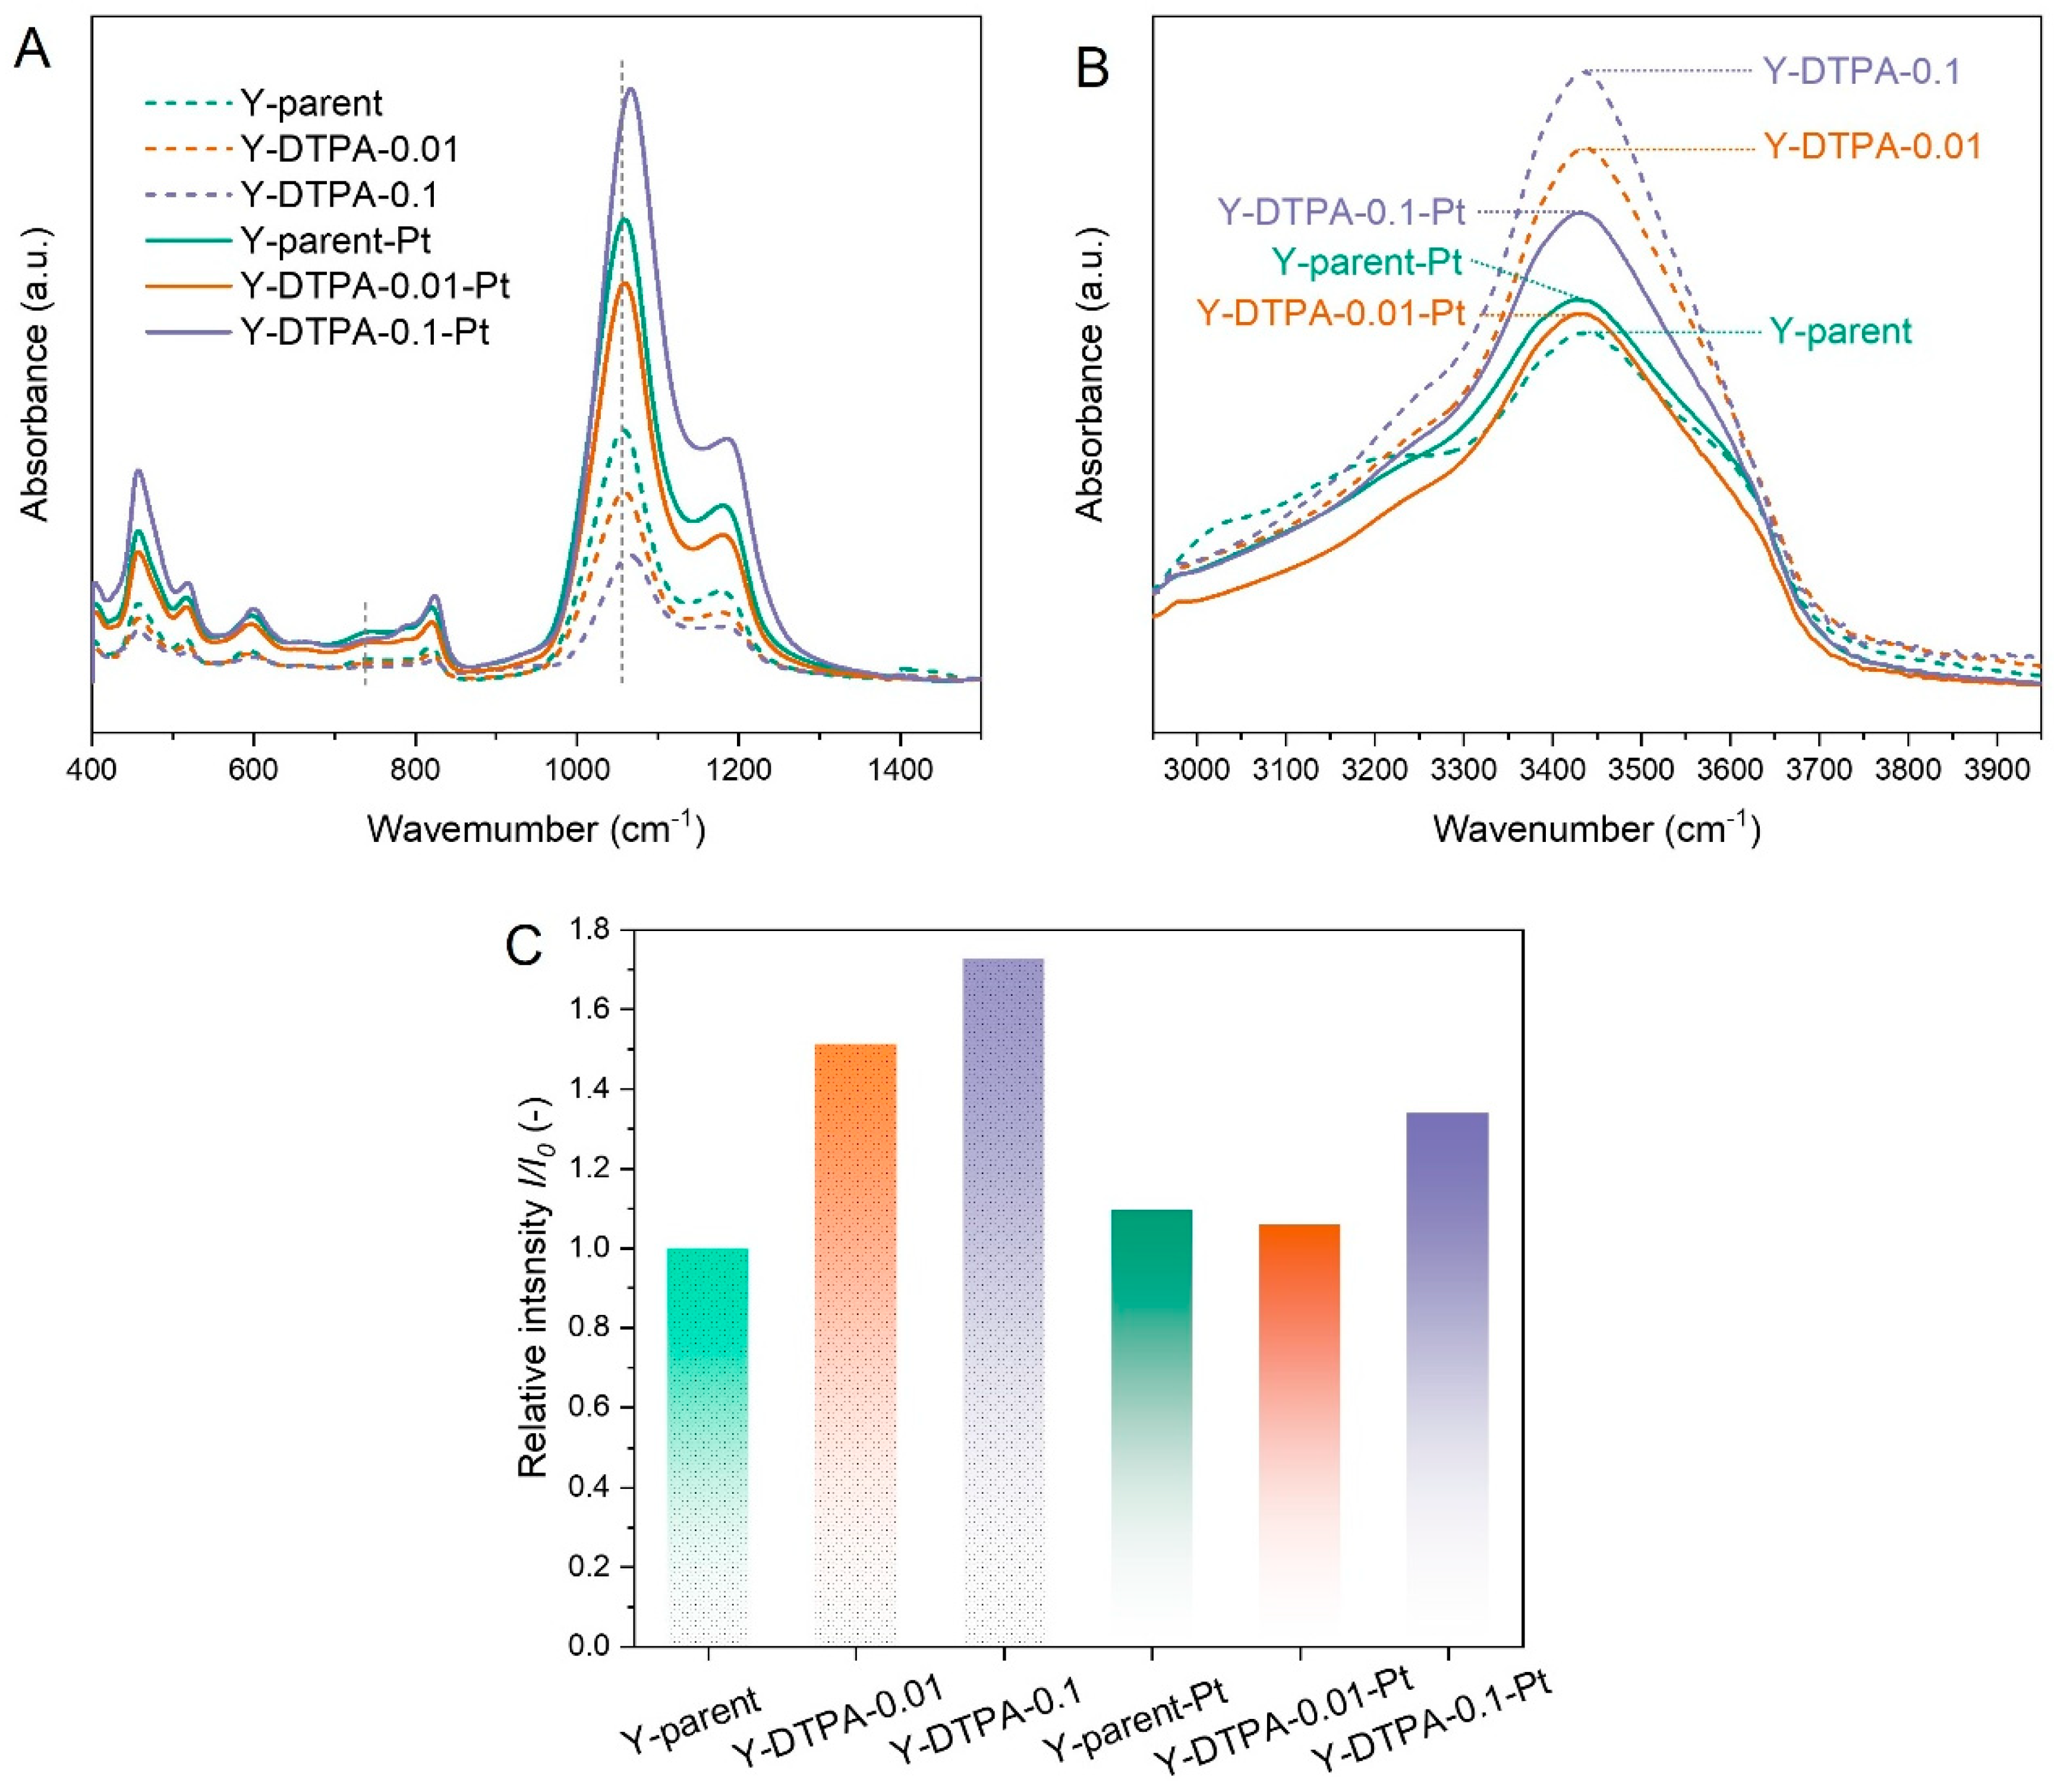
Figure 8 presents the FTIR spectra of Y zeolites before and after Pt loading. As shown in
Figure 8A, in the wavenumber range of 400–1500 cm
−1, all samples display a characteristic band at 717 cm
−1, corresponding to the symmetric and asymmetric stretching vibrations of external linkages in double six-membered rings (6-MRs). This indicates that the fundamental FAU framework remains largely intact after DTPA treatment. However, the intensity of this band decreases after 0.01 M DTPA treatment, with a more significant reduction observed for the 0.1 M treated sample. In addition, a shift of the band around 1010 cm
−1 (attributed to the internal asymmetric stretching vibrations of the framework) toward higher wavenumbers is observed after 0.1 M DTPA treatment. These spectral changes, in conjunction with the XRD and XRF results, confirm the successful removal of framework Al, which serves as a prerequisite for the formation of structural vacancies and silanol (Si–OH) defects.
To directly confirm the formation of silanol defects in the dealuminated zeolites, DRIFTS measurements were performed, and the spectra in the ca. 3500 cm
−1 region are shown in
Figure 8B. The absorption band in the 3400–3600 cm
−1 range is attributed to internally H-bonded silanol nests [
23]. As summarized in
Figure 8C, the relative intensity (
I/
I0) was defined as the silanol signal intensity relative to that of the parent Y zeolite, where
I and
I0 are the silanol peak intensities in DRIFT spectra of the modified and parent zeolites, respectively. The
I/
I0 values for Y-DTPA-0.01 and Y-DTPA-0.1 are 1.50 and 1.75, respectively, both higher than that of Y-parent (1.00), confirming the successful introduction of silanol nest defects, and their concentrations increase with an increase in DTPA concentration used for dealumination. After Pt loading, the silanol-related signal intensity in DRIFT spectra markedly decreases. As for Y-DTPA-0.01-Pt, the
I/
I0 drops to 1.05, nearly equivalent to the parent zeolite, indicating that most of the internal silanol nests were consumed through strong interaction with dispersed Pt
2+. In the case of Y-DTPA-0.1-Pt, the
I/
I0 remains at 1.28, implying that although some silanol defects were utilized to anchor Pt, a significant portion remained unoccupied. These observations are in line prior studies proposing that silanol nest defects serve as: (1) anchoring sites for Pt
2+ ions via strong interactions, stabilizing them as single-atom species and/or (2) nucleation centers for the formation of metallic Pt
0 clusters [
12,
23].
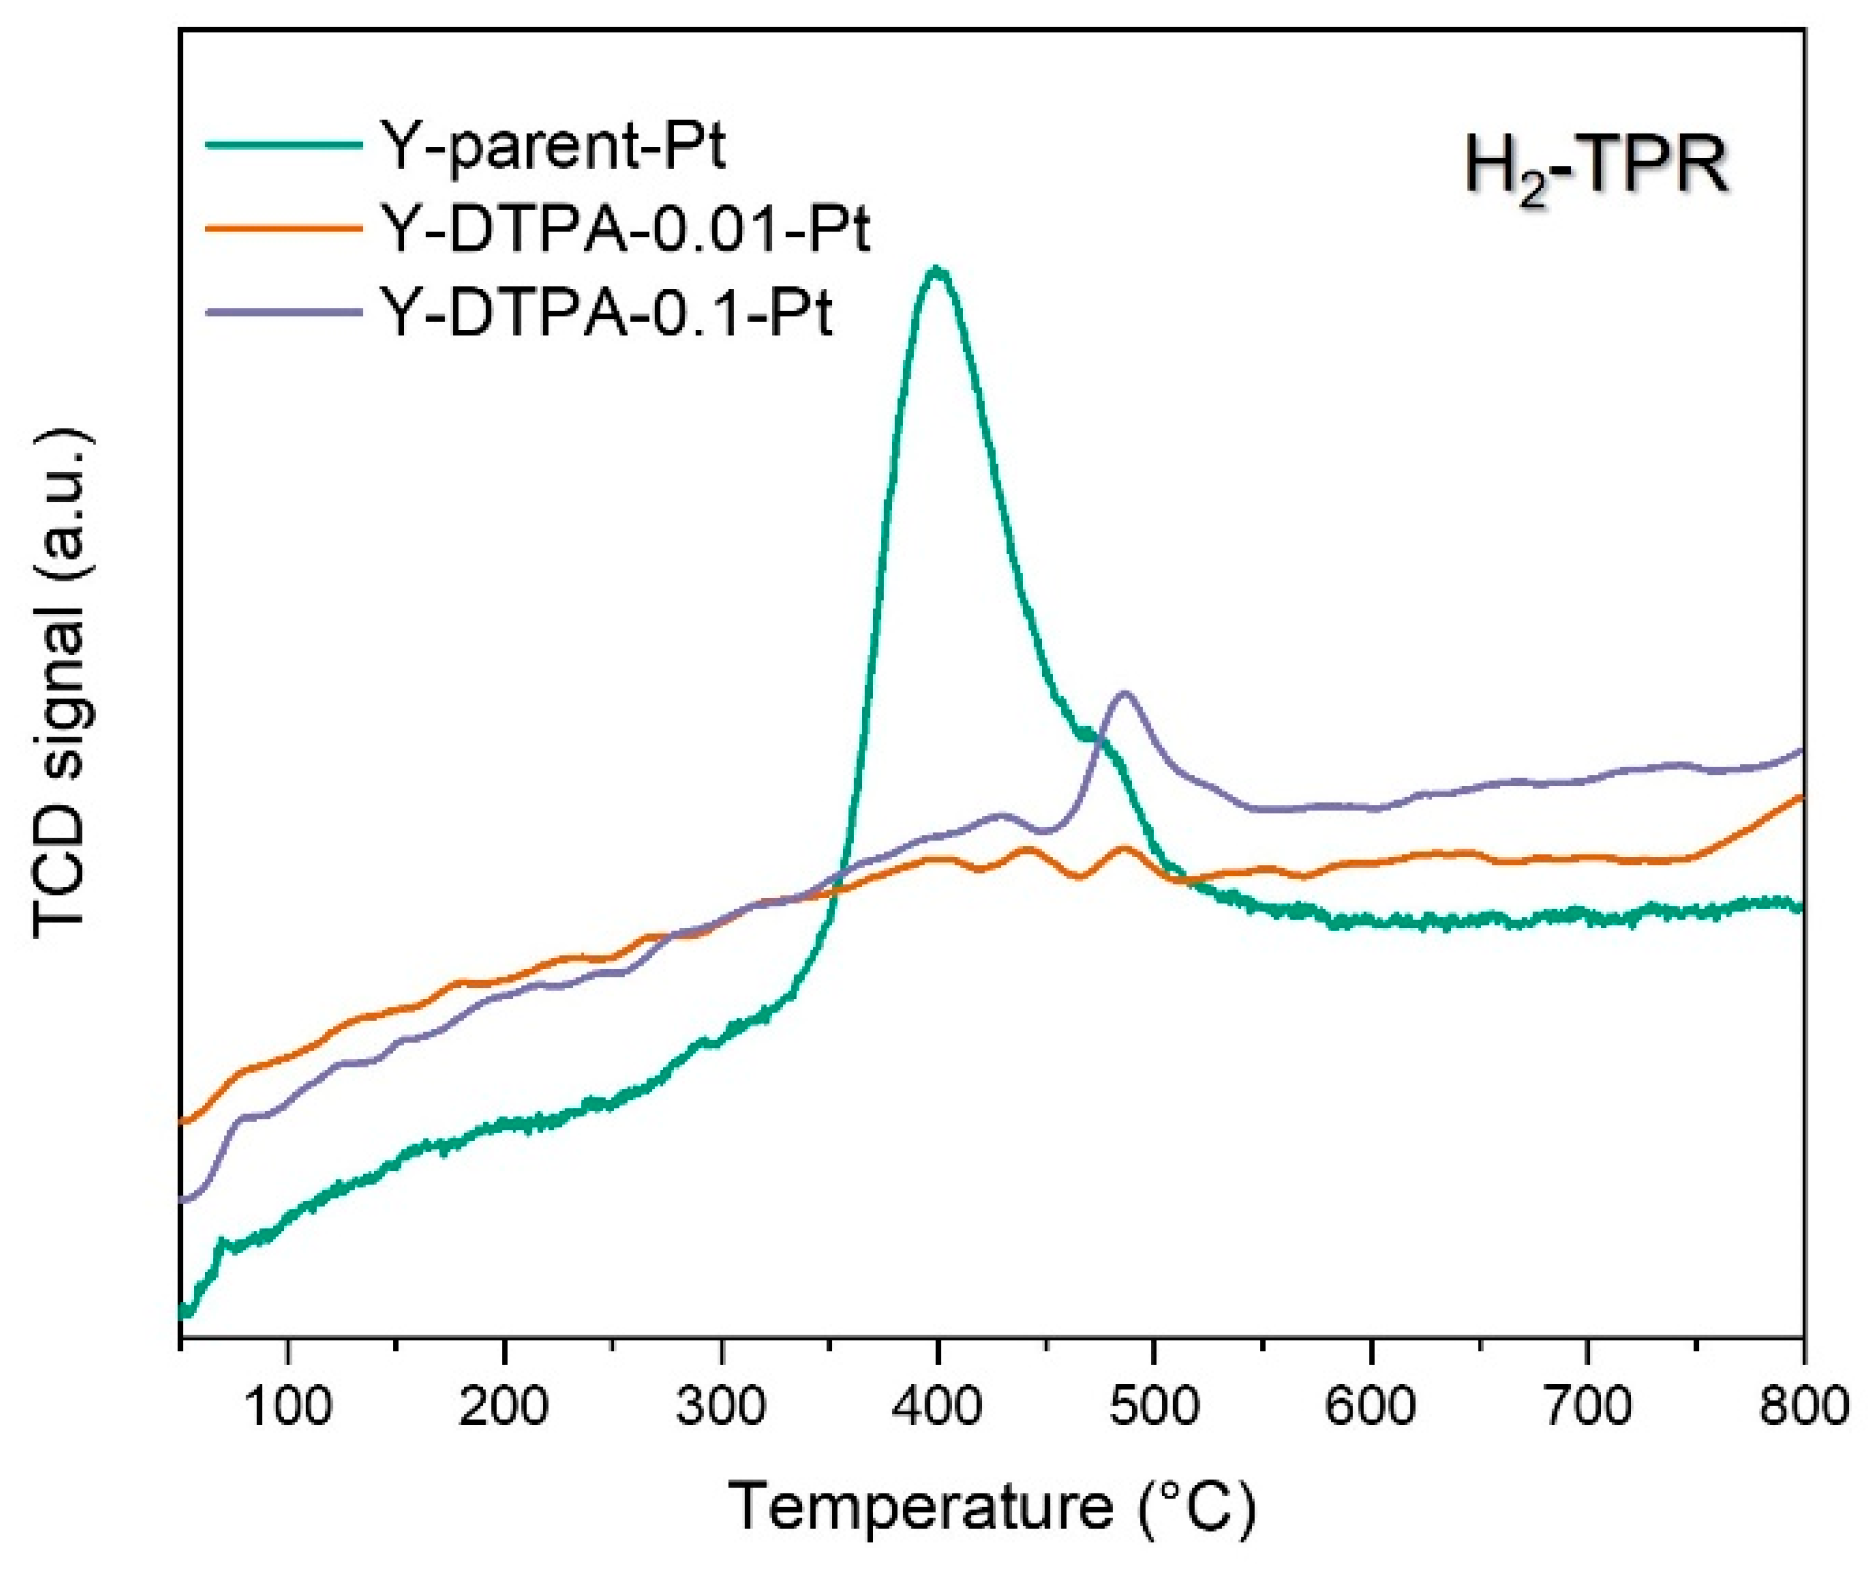
To further elucidate the status of Pt species anchored at defect sites in Y zeolite, H
2-TPR analysis was conducted, and the corresponding reduction profiles of Pt-loaded Y zeolites are shown in
Figure 9. As for the Y-parent-Pt catalyst using the parent Y zeolite as support, a considerable H
2 consumption peak centered around 400 °C is observed, indicating the presence of reducible Pt oxides, such as PtO. This observation aligns with the lack of framework defects or anchoring sites in the parent Y zeolite, which limits the stabilization of metallic Pt
0 clusters or isolated Pt
2+ anchored in silanol nests). During calcination, Pt precursors without strong interaction with the support tend to aggregate and oxidize in air, leading to PtO formation in Y-parent-Pt. Although PtO has catalytic activity for toluene oxidation, it is generally considered less effective than metallic Pt
0. In contrast, both Y-DTPA-0.01-Pt and Y-DTPA-0.1-Pt samples exhibit very weak H
2-TPR signals, suggesting an almost absence of oxidized PtO species. The Pt
2+ detected by XPS in Y-DTPA-0.01-Pt can thus be attributed to isolated Pt
2+ ions strongly anchored at silanol nests or hydroxylated vacancies, i.e., defect sites introduced via DTPA-mediated dealumination, which stabilize the Pt species in a highly dispersed state. These strongly anchored Pt
2+ can be reflected in XPS but with nearly no reducibility in H
2 gas flow, even at temperature high to 500 °C.
For the support treated with a higher concentration of DTPA (Y-DTPA-0.1), more severe dealumination occurs, resulting in a wider range of internal defects [
24]. It is likely that multiple neighboring Al sites are simultaneously removed, leading to the formation of larger defect vacancy clusters. These oversized vacancies hinder the anchoring of Pt as isolated Pt
2+ species. Instead, such large defect sites may provide sufficient space for the aggregation and reduction of Pt, facilitating the formation of nanoscale metallic Pt
0 clusters adjacent to the vacancies during high-temperature calcination. This explains the highest Pt
0/Pt
2+ ratio observed for Y-DTPA-0.1-Pt. In summary, the Pt species on Y-DTPA-0.01-Pt exist as a well-balanced mixture of Pt
0 nanoparticles and highly dispersed Pt
2+anchored in Si–OH defect nests, rather than forming PtO with inferior catalytic activity. Combined with the highest Pt loading enabled by the well-preserved pore structure of its support, this balance between Pt
0 nanoparticles and defect-stabilized Pt
2+ underlies the superior catalytic performance for toluene oxidation.
