Abstract
Evidence highlights the association between endocrine-disrupting chemicals (EDCs) found in personal care and household products (PCHPs) and adverse reproductive and developmental health outcomes. Women are disproportionately at risk due to frequent use of PCHPs, encountering a variety of different chemicals daily. Despite known health risks, existing policies often fail to provide adequate protection, with gaps remaining in understanding women’s knowledge, risk perceptions, and beliefs about EDCSs in PCHP, as well as how these influence avoidance behaviours. This study examines women’s knowledge, health risk perceptions, beliefs, and avoidance behaviors regarding EDCs commonly found in PCHPs, including bisphenol A, lead, parabens, phthalates, perchloroethylene, and triclosan. Guided by the Health Belief Model, a questionnaire was administered to 200 women in the preconception and conception periods in Toronto, Canada. Analyses revealed that lead and parabens were the most recognized EDCs, while triclosan and perchloroethylene were the least known. Greater knowledge of lead, parabens, bisphenol A, and phthalates significantly predicted chemical avoidance in PCHPs. Higher risk perceptions of parabens and phthalates also predicted greater avoidance. Women with higher education and chemical sensitivities were more likely to avoid lead. These findings support the need for targeted education to improve awareness to reduce EDC exposure—especially among women.
Keywords:
Health Belief Model; parabens; perceptions; knowledge; EDCs; personal care products; women’s health; Canada 1. Introduction
Individuals are increasingly exposed to harmful chemicals in everyday consumer products, which have become a significant part of daily life [1,2]. Among these, personal care and household products (PCHPs) are major sources of endocrine-disrupting chemicals (EDCs), with exposure occurring through dermal absorption, inhalation, or ingestion [3,4]. Women, as the primary users of PCHPs, may be particularly vulnerable to EDC exposure, encountering an estimated 168 different chemicals daily [5].
Personal care products include hygiene, grooming, and cosmetic items such as shampoo, toothpaste, and lotions [6], while household products like floor polish and dish soap serve cleaning functions [7]. Research indicates that individuals use at least two personal care products per day, averaging 11 applications within 24 h, totaling up to 44 applications daily, while dish, and stove cleaners are used daily, highlighting the frequent usage of a variety of PCHPs in a given day [3,6,7].
Manufacturers of PCHPs frequently add chemicals to enhance quality and shelf-life [4]. These additives—such as color enhancers, preservatives, plasticizers, antimicrobials, and solvents—often include EDCs like lead, parabens, bisphenol A (BPA), phthalates, triclosan, and perchloroethylene (PERC) [2,3,8].
Chronic exposure to these EDCs poses significant health risks (see Table 1) [9]. For instance, lead, used in cosmetics, disrupts hormonal functions and fetal development [10,11]. Parabens and phthalates, common in moisturizers, disinfectants, and air fresheners, are linked to reproductive toxicity and carcinogenic effects through estrogen mimicry [12,13]. BPA, found in plastic packaging, impairs reproduction and fetal growth [14]. Triclosan, present in antiseptics and soaps, is associated with miscarriage, infertility, and developmental toxicity [15,16]. PERC, used in dry cleaning and floor cleaners, is classified as a human carcinogen and reproductive toxicant [17,18].

Table 1.
Roles, sources, and health impacts of commonly found EDCs in PCHPs.
Study Scope and Objectives
Growing public concern in Canada has prompted calls for more transparent product labeling, particularly regarding broad terms such as “parfum” and “fragrance” [22]. These terms can hide the presence of dozens to hundreds of undisclosed chemical ingredients, many of which are known EDCs and fragrance allergens, even in PCHPs labelled “green” or “eco-friendly” [23]. The absence of full disclosures of ingredients poses significant challenges for consumers, who may unknowingly be exposed to EDCs, carcinogens, and other hazardous substances. Enhanced labeling standards are therefore critical to support informed decision-making and protect public health. However, it can take several years to test and form regulatory action [24]. Given this lag, it is imperative to increase awareness of these issues and of safer alternatives, such as chemical-free, vegan, and natural products [25]. Adopting safer alternatives has been shown to lower EDC exposure from PCHPs [26]; thus, understanding the factors that drive EDC avoidance is critical.
A recent study indicated a significant lack of awareness among women regarding the presence of harmful chemicals such as EDCs in PCHPs [27]. To highlight this, undergraduate female college students in California, USA were surveyed about their personal care product usage; 80% of women reported being unsure whether their products contained harmful chemicals, and 48.6% questioned their safety for daily use [28]. Research on pregnant women suggests a similar trend: while 60% recognize EDCs as health risks, those with higher education are more likely to engage in avoidance behaviors [29]. However, despite awareness of risks, only a small proportion intend to reduce cosmetic use during pregnancy [30]. Women who actively read product labels are more likely to mitigate exposure [31]. However, among reproductive-aged women aware of risks, only 29% adopt avoidance behaviors, highlighting a gap between awareness and action [32].
Research gaps remain regarding women’s access to product safety resources and their health risk perceptions of hazardous EDCs in PCHPs, along with their associated health risks, beliefs, and avoidance behaviors. To address the gaps, this study aimed to achieve the following: (i) assess women’s knowledge (access to resources), health risk perceptions, beliefs, and avoidance behavior related to EDC exposure in PCHPs; and (ii) examine associations between demographic factors and knowledge (access to resources), health risk perceptions, beliefs, and avoidance behaviour concerning EDC exposure in PCHPs. To achieve these objectives, the Health Belief Model (HBM) was used. The HBM aims to explain behavior change by evaluating an individual’s motivation and perceived ability to adopt healthier behaviors. For instance, a woman who perceives a heightened risk of breast cancer due to paraben exposure and understands its health implications may become more concerned about chemical-based PCHPs. If she believes that choosing paraben-free products can lower her risk, she is more likely to adjust her purchasing behavior accordingly.
2. Methods
2.1. Study Design
This study utilized a researcher-designed questionnaire based on the HBM. The questionnaire underwent pilot testing, and preliminary analyses indicated an acceptable reliability of participants’ responses and constructs measured using Cronbach’s alpha [33]. The questionnaire was subsequently used to assess women’s knowledge, health risk perceptions, beliefs, and avoidance behaviors regarding EDCs in PCHPs.
The questionnaire began by collecting information about demographic characteristics, followed by dedicated sections for each EDC: lead, parabens, phthalates, BPA, triclosan, and PERC. Within each section, four scales measured participants’ knowledge, health risk perceptions, beliefs, and avoidance behaviors regarding each EDC. Beliefs were measured using five items assessing participants’ views on the health impacts of each EDC. Health risk perceptions were measured with seven items evaluating the perceived health risks associated with EDC exposure. Knowledge was assessed through six items examining access to information, perceived sufficiency of product safety knowledge, and interest in further information. Avoidance behavior was measured with six items focusing on purchasing practices related to avoiding EDCs in PCHPs. Items utilized a six-point Likert scale (ranging from Strongly Agree to Strongly Disagree), with the exception of avoidance behavior, which used a five-point scale (from Always to Never).
2.2. Sample
The study focused on women aged 18 to 35, a range selected to capture the pre-conception and conception stages. According to Statistics Canada, women typically have their first child between the ages of 25 and 35, with an average age of 32 [34]. Furthermore, the study population was selected based on the higher usage of PCHPs by women, with the recognition that their exposure to EDCs from PCHPs may have implications for prenatal and postnatal exposures in infants. To meet the inclusion criteria, participants must have identified as female (sex at birth) and been able to read and write in English. The exclusion criteria were those identifying their sex as male at birth, and those who were outside of the 18–35 age range. Ethical approval for the study was granted by the Ontario Tech University Ethics Committee [REB#16949].
2.3. Data Collection
The questionnaire was distributed to participants in person and online via a Google Forms link. Most of the study participants (90%) were recruited in-person at the 2022 Toronto National Women’s Show (Toronto, Canada, 18–19 November 2022) and Ontario Tech University (9 February 2023). The research team members were readily available to help participants with filling out the questionnaire, as well as engaging in conversations with respondents on their behaviours and selection of PCHPs. Additionally, some of these participants were invited to participate in a semi-structured interview about their decision-making around PCHPs.
For the final recruitment method, an online promotional campaign was launched across various social media platforms (such as Instagram and LinkedIn) between December 2022 and January 2023. Participants were recruited voluntarily and provided written informed consent after reviewing the study details, ensuring their understanding of the research procedures. All data collected were anonymized to protect participant confidentiality.
2.4. Data Analysis
Data analysis was conducted using SPSS v.28. All data was cleaned and coded prior to analysis. The coding system used was similar to those from previous studies, which was the utilization of a Likert-scale coded in a positive direction [35,36]. Mean imputation was used to fill in ‘unsure’ responses. If the respondent answered ‘unsure’, their response was imputed using the average of their other responses in that scale [37]. All of the surveys were used (n = 200) for the interpretation of results.
2.4.1. Calculating Respondent Scores
An index was created for knowledge (score range: 6–30), health risk perceptions (score range: 7–35), beliefs (score range: 5–25), and avoidance behavior (score range: 6–30) by summing the Likert-scale responses for each participant, resulting in four distinct composite scores for each of the six EDCs [35,38]. Descriptive statistics, including mean, standard deviation, and median, were used to summarize respondent scores and assess the central tendency and variation for each index. Participants who were aware of a given EDC had four corresponding composite scores for that chemical. A higher score resulted in a higher level of understanding for each construct.
2.4.2. Examining Respondent Scores and Associations with Demographic Variables
This study analyzed associations between knowledge, health risk perceptions, beliefs, and avoidance behavior as outcome variables in relation to demographic factors. Since the outcome variables exhibited a non-normal distribution, non-parametric statistical tests were used [39]. The Mann–Whitney U test was applied for comparisons involving two subgroups, while the Kruskal–Wallis H test was used for sociodemographic variables with more than two subgroups. Due to low respondent awareness of triclosan and PERC, the analysis focused on lead, parabens, BPA, and phthalates.
Demographic variables included age, ethnicity, annual household income, education level, and household chemical sensitivity. Age was categorized as ‘early adulthood’ (18–25 years) and ‘later adulthood’ (26–35 years). Ethnicity was classified as non-white or white. The responses were used to dichotomize education into ‘post-secondary completion’ versus ‘non-completion’ due to the high proportion of secondary education in the sample. Household income was categorized as above or below the Low-Income Cut-Off (LICO), adjusted for household size and pre-tax income within the Census Metropolitan Area [40]. Chemical sensitivity was grouped into three categories: diagnosed in oneself or a household member, don’t know, or no diagnosis.
2.4.3. Estimates Associated with EDC Avoidance in PCHP
Multivariable ordinal regression assessed the relationship between avoidance behavior (dependent variable) toward EDCs in PCHPs and knowledge, health risk perceptions, beliefs, age, ethnicity, education, household income, and self-reported chemical sensitivity (independent variables). Multicollinearity was evaluated using the variance inflation factor (VIF) to ensure variable validity [41,42].
Avoidance behavior, the primary outcome, was analyzed across four ordinal variables for lead, parabens, BPA, and phthalates. The avoidance behavior index (range: 6–30) was categorized using quartile-based cutoffs [43]. Lead, parabens, and phthalates each had four categories, while BPA had three, reflecting a 75th percentile score of 30, with 25% of participants exhibiting maximum avoidance for BPA in PCHPs.
3. Results
3.1. Sample Characteristics
The sample characteristics can be found in Table 2. Of the 200 participants, 57% (n = 114) were aged 18–25, and 38% (n = 76) were 26–35. In terms of ethnicity, 58% (n = 134) identified as non-white, and 42% (n = 84) were white. Regarding annual household income (CAD$), 65% (n = 131) had incomes above the LICO, and 21% (n = 42) had incomes equal to or below the LICO. The sample was highly educated, with 66% (n = 133) holding post-secondary degrees or higher, and 29% (n = 58) only completing high school. Most respondents (79%) were born in Canada, while 19% (n = 38) were born outside of Canada. Additionally, 10% (n = 20) reported diagnosed chemical sensitivities. A small subset (n = 3) were pregnant, 5% (n = 9) were attempting pregnancy, and 13% (n = 26) had a child under 18. Statistical tests found no significant differences between recruitment sites, allowing for data pooling into a single sample.
Table 2.
Sociodemographic characteristics of the study sample (n = 200).
3.2. Respondent Scores
Figure 1 illustrates the distribution of participant responses indicating that they had ‘never heard’ of specific EDCs of interest. The chemicals with the highest proportion of participants reporting lack of familiarity were PERC (n = 184), triclosan (n = 183), phthalates (n = 141), and BPA (n = 123). A comparatively lower number of participants indicated unfamiliarity with parabens (n = 55) and lead (n = 40). The results of the respondent scores from all indices are presented in Table 3. From this analysis, it was found that health risk perception scores for parabens displayed the lowest scores for all dimensions out of all EDCs. Triclosan and PERC displayed the highest scores across all indices.
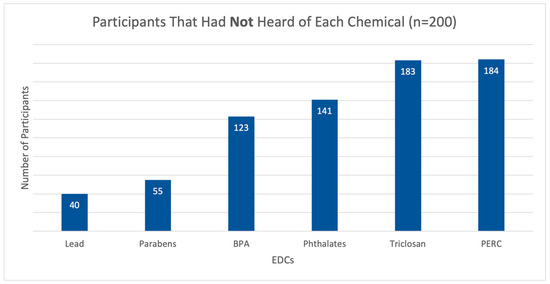
Figure 1.
Proportion of participants who had never heard of lead, parabens, BPA, phthalates, triclosan, and PER.
Table 3.
Respondent scores of indices related to knowledge, risk perceptions, beliefs, and avoidance behavior for each EDC [33].
3.3. Respondent Scores and Associations with Demographic Variables
Bivariate analysis identified six statistically significant associations between ethnicity, income, chemical sensitivity diagnosis, and household income for lead, parabens, BPA, and phthalates (Table 4). A statistically significant association was observed between education level and the knowledge of lead. Participants without post-secondary education had a higher mean rank (87.5) compared to those with post-secondary education (71.5) (Table 3). Education level was also significantly associated with the knowledge of parabens. Participants without post-secondary education had a higher mean rank (81.0) than those with post-secondary education (63.5).
Table 4.
Bivariate results on relationships between age, ethnicity, education, income, MCS and indices related to knowledge, health risk perceptions, beliefs, and avoidance behaviour for four EDCs.
A significant association was found between education level and belief in the harm of parabens. Participants without post-secondary education had a higher mean rank (78.0) than those with post-secondary education (62.3). A significant association was observed between chemical sensitivity diagnosis and health risk perceptions of lead. Participants with a diagnosed chemical sensitivity (or a household member with a diagnosis) had a higher mean rank (100.1) compared to those who were unsure or did not report a diagnosis. Ethnicity was significantly associated with health risk perceptions of BPA. For instance, white participants had a higher mean rank (39.7) than non-white participants (28.6).
A statistically significant association was found between household income and avoidance behavior toward parabens. Participants with incomes at or below the LICO had a higher mean rank (78.6) compared to those above the LICO (59.6). Household income was also significantly associated with avoidance behavior toward phthalates. Participants with incomes at or below the LICO had a higher mean rank (33.6) than those above the LICO (23.6).
Table 5 presents the results of the ordinal regression analysis, identifying nine significant associations between demographic and physical variables, knowledge, health risk perceptions, beliefs, and avoidance of EDCs in PCHPs. A multicollinearity check confirmed no collinearity between independent variables prior to analysis.
Table 5.
Ordinal regression model of avoidance behaviour for lead, parabens, phthalates, and BPA.
Knowledge was a significant predictor of avoidance behavior across all models, with positive associations observed for lead (OR = 1.41, 95% CI [1.25, 1.62], p < 0.001), parabens (OR = 1.26, 95% CI [1.10, 1.44], p < 0.001), BPA (OR = 1.73, 95% CI [1.25, 2.38], p < 0.001), and phthalates (OR = 1.57, 95% CI [1.18, 2.08], p < 0.001). Health risk perceptions were also a significant factor related to an increased avoidance of parabens (OR = 1.17, 95% CI [1.05, 1.30], p < 0.01) and phthalates (OR = 1.26, 95% CI [1.01, 1.57], p < 0.05).
Beliefs toward the harm of parabens demonstrated a significant positive relationship with avoidance behavior (OR = 1.14, 95% CI [1.02, 1.28], p < 0.05). Participants with a self-reported diagnosis of chemical sensitivity were significantly more likely to avoid lead (OR = 5.86, 95% CI [1.62, 21.1], p < 0.01) compared to those without a diagnosis or those unsure of having a diagnosis. Conversely, not completing post-secondary education was significantly associated with lower avoidance of lead (OR = 0.21, 95% CI [0.09, 0.53], p < 0.001) compared to individuals who completed post-secondary education.
4. Discussion
EDCs such as lead, parabens, BPA, phthalates, triclosan, and PERC are pervasive in consumer products, yet a considerable portion of women remain uninformed about them. In this study, it was uncovered that the majority of participants, specifically 94%, were unfamiliar with PERC, followed by 93% who had never heard of triclosan. Despite PERC and triclosan being the least recognized, they attained the highest mean scores in knowledge, health risk perceptions, beliefs, and avoidance behavior when compared to all six EDCs. This could potentially be attributed to participants having engaged in comprehensive research on multiple chemical ingredients, thereby fostering a predisposition toward adopting avoidance concerning chemical exposures stemming from PCHPs [31].
The awareness of EDCs varied among participants. Only 29% had heard of phthalates, lower than the 44% reported in previous studies [32]. BPA awareness was also low, with 38% awareness in comparison to 93% in previous studies [32]. In contrast, 72% were familiar with parabens, higher than the 24% reported by a previous study [31]. Despite significant media attention in the early 2010s, BPA recognition was relatively low in our study [44]. This discrepancy may be explained by the younger age of our sample (18–25 years), as they may have had less exposure to earlier public discussions on BPA. Furthermore, parabens have been receiving greater attention in mainstream media due to health concerns, prompting a shift toward “paraben-free” product labels [45]. This may explain the higher recognition of parabens in our study compared to previous ones.
Among the six EDCs analyzed, lead had the lowest mean avoidance behavior score in PCHPs despite being the most widely recognized by participants. This discrepancy suggests that while awareness of lead is high—likely due to extensive historical media coverage and public health campaigns following its 2012 ban in Canadian consumer products [46]—this recognition does not necessarily translate into active avoidance behaviors. One possible explanation is that the ban may have led participants to perceive lead as a resolved risk, reducing the urgency to seek or avoid products containing it. This pattern aligns with the HBM, which states that perceived susceptibility and severity—along with cues to action—are key drivers of behavior change. In the absence of current or perceived personal risk, participants may not actively avoid lead-containing PCHPs, assuming regulatory action has already eliminated the threat. The avoidance of lead in PCHPs was significantly associated with knowledge, post-secondary education, and self-reported household chemical sensitivity. Participants with post-secondary education were more likely to avoid lead than those without, aligning with prior research showing that relatively highly educated women adopt more behaviors to reduce chemical exposure [29,32,47]. Additionally, individuals with diagnosed chemical sensitivity—either in themselves or a household member—were more likely to avoid lead. Those with chemical sensitivities often experience physical symptoms from exposure and may exhibit heightened chemical awareness and avoidance behaviors [48]. Notably, 10% of participants in this study reported a chemical sensitivity, a higher prevalence than in previous studies [49,50]. This increase may be because the questionnaire asked for an MCS diagnosis of the entire household, as opposed to previous studies where only the individual participant was asked.
Participants scoring higher on the knowledge scale were found to be significantly and positively associated with avoiding lead, parabens, BPA, and phthalates in their PCHPs. This may suggest that knowledge can aid in helping women choose healthier PCHP alternatives. This finding is aligned with recent findings, where women who had more knowledge of the danger products posed to their health with long-term use were more likely to purchase alternative products [31,51]. Furthermore, a participant scoring higher on the health risk perception scale was positively associated with avoiding parabens and phthalates in their PCHPs, and a higher belief score emerged as an estimate in avoiding parabens in PCHPs. Overall, these findings suggest that higher health risk perceptions and beliefs toward the harmful effects of EDCs may result in a higher likelihood of avoiding PCHPs containing EDCs, in line with previous findings [32,52].
The results of this study support and validate the HBM, the guiding theoretical framework for this research. According to the HBM, individuals are more likely to engage in preventive behaviors—such as avoiding EDCs in PCHPs—when they possess adequate knowledge, perceive a high level of risk, and hold strong beliefs about the potential health consequences of exposure [53]. In our study, participants with higher composite scores in knowledge, health risk perceptions, and beliefs also reported higher avoidance behaviors, aligning with the HBM’s core constructs. Importantly, they also highlight how targeted public health interventions that enhance knowledge, clarify personal risk, and strengthen belief in the effectiveness of avoidance strategies may effectively motivate consumers to choose EDC-free PCHPs [54]. Future campaigns might benefit from integrating HBM-informed messaging to encourage more widespread adoption of safer product choices [55].
A key limitation of this study is that the sampling method led to a sample that was predominantly highly educated and of higher socioeconomic status, potentially underrepresenting lower-income populations. Other limitations include sample size, recall bias, and response bias. Despite these limitations, this work adds to the under-researched area of women’s knowledge, health risk perceptions, beliefs, and avoidance behaviours relating to EDCs commonly found in PCHPs. The study results emphasize the importance of education and the distribution of knowledge to this group of women so that they can better protect themselves, their families, and a potentially growing fetus from harmful chemicals with endocrine-disrupting potential.
For future research, we recommend using a larger sample size than 200 as well as a wider age interval to capture more of the population. Future research may benefit from including men as well as gender-diverse groups in analysis to further understand the health perspectives of these groups, as well as sampling in different geographical locations, as this may affect the results and recognition of different EDCs [27].
Author Contributions
Conceptualization, A.T. and C.B.; Methodology, A.T., N.K.R. and C.B.; Validation, J.A.-D.; Formal analysis, A.T.; Investigation, A.T., N.K.R., J.A.-D. and C.B.; Resources, C.B.; Writing—original draft, A.T.; Writing—review & editing, A.T., N.K.R., J.A.-D. and C.B.; Supervision, C.B.; Project administration, C.B.; Funding acquisition, C.B. All authors have read and agreed to the published version of the manuscript.
Funding
This study was funded using internal funds from the Faculty of Health Sciences, Ontario Tech University, Oshawa/Ontario (Grant Number #16949) on 13 October 2022.
Institutional Review Board Statement
This research followed the ethical guidelines outlined by the Canadian Tri-Council Policy Statement. This research is scientifically sound, has benefits that significantly outweigh the potential for harm, adopted an adequate process for informed consent, and implemented a fair selection of participants. Ethical approval was granted by the Research Ethics Board at Ontario Tech University. REB # 16949.
Informed Consent Statement
Informed consent was obtained from all subjects involved in the study.
Data Availability Statement
The data that support the findings of this study are available from the corresponding author, Adrianna Trifunovski, upon request.
Acknowledgments
We would like to acknowledge all study participants for their contributions to this study.
Conflicts of Interest
The authors declare no conflicts of interest.
References
- Hartmann, S.; Klaschka, U. Interested consumers’ awareness of harmful chemicals in everyday products. Environ. Sci. Eur. 2017, 29, 29. [Google Scholar] [CrossRef]
- Klančič, V.; Gobec, M.; Jakopin, Ž. Halogenated ingredients of household and personal care products as emerging endocrine disruptors. Chemosphere 2022, 303, 134824. [Google Scholar] [CrossRef]
- Khalid, M.; Abdollahi, M. Environmental Distribution of Personal Care Products and Their Effects on Human Health. Iran. J. Pharm. Res. 2021, 20, e124466. [Google Scholar] [CrossRef]
- Johnson, P.I.; Favela, K.; Jarin, J.; Le, A.M.; Clark, P.Y.; Fu, L.; Harley, K.G. Chemicals of concern in personal care products used by women of color in three communities of California. J. Expo. Sci. Environ. Epidemiol. 2022, 32, 864–876. [Google Scholar] [CrossRef]
- Mercola, D. Beware of Chemicals in Beauty & Personal Care. Bhoomi. 2015. Available online: https://bhoomimagazine.org/2015/12/31/beware-of-chemicals-in-beauty-personal-care/ (accessed on 2 May 2023).
- Lang, C.; Fisher, M.; Neisa, A.; MacKinnon, L.; Kuchta, S.; MacPherson, S.; Probert, A.; Arbuckle, T. Personal care product use in pregnancy and the postpartum period: Implications for exposure assessment. Int. J. Environ. Res. Public Health 2016, 13, 105. [Google Scholar] [CrossRef]
- Garcia-Hidalgo, E.; von Goetz, N.; Siegrist, M.; Hungerbühler, K. Use-patterns of personal care and household cleaning products in switzerland. Food Chem. Toxicol. 2017, 99, 24–39. [Google Scholar] [CrossRef]
- Martín-Pozo, L.; Gómez-Regalado, M.; Moscoso-Ruiz, I.; Zafra-Gómez, A. Analytical methods for the determination of endocrine disrupting chemicals in cosmetics andpersonal care products: A review. Talanta 2021, 234, 122642. [Google Scholar] [CrossRef]
- Segal, T.R.; Giudice, L.C. Before the beginning: Environmental exposures and reproductive and obstetrical outcomes. Fertil. Steril. 2019, 112, 613–621. [Google Scholar] [CrossRef]
- Papanikolaou, N.C.; Hatzidaki, E.G.; Belivanis, S.; Tzanakakis, G.N.; Tsatsakis, A.M. Lead toxicity update. A brief review. Med. Sci. Monit. 2005, 11, RA329. [Google Scholar]
- Al-Saleh, I.; Al-Enazi, S.; Shinwari, N. Assessment of lead in cosmetic products. Regul. Toxicol. Pharmacol. 2009, 54, 105–113. [Google Scholar] [CrossRef]
- Malas, M. Canada Misses the Mark (Again) in Its Decision to Not Ban Harmfulphthalates—Environmental Defence. Environmental Defence. 16 January 2018. Available online: https://environmentaldefence.ca/2018/01/16/canada-misses-mark-not-ban-phthalates/ (accessed on 7 December 2024).
- Wan, M.; Co, V.; El-Nezami, H. Endocrine disrupting chemicals and breast cancer: A systematic review of epidemiological studies. Crit. Rev. Food Sci. Nutr. 2021, 62, 6549–6576. [Google Scholar] [CrossRef]
- Siddique, S.; Kubwabo, C.; Harris, S.A. A review of the role of emerging environmental contaminants in the development of breast cancer in women. Emerg. Contam. 2016, 2, 204–219. [Google Scholar] [CrossRef]
- Environmental Protection Agency. Triclosan. USEPA. 25 April 2017. Available online: https://www.epa.gov/ingredients-used-pesticide-products/triclosan (accessed on 22 March 2023).
- Green, M.P.; Harvey, A.J.; Finger, B.J.; Tarulli, G.A. Endocrine disrupting chemicals: Impacts on human fertility and fecundity during the peri-conception period. Environ. Res. 2021, 194, 110694. [Google Scholar] [CrossRef]
- Barton, C. Tetrachloroethylene. In Encyclopedia of Toxicology; Elsevier: Amsterdam, The Netherlands, 2014; pp. 498–502. [Google Scholar] [CrossRef]
- Bloom, M.S.; Varde, M.; Newman, R.B. Environmental toxicants and placental function. Best Pract. Res. Clin. Obstet. Gynaecol. 2022, 85, 105–120. [Google Scholar] [CrossRef]
- Hopf, N.B. Identification of Research Needs to Rsolve the Carcinogenicity of High-Priority Iarc Carcinogens [PDF]. 2010. Available online: https://publications.iarc.fr/_publications/media/download/3795/3bd750c699c77431d0db7b28b0123fa12c901a38.pdf (accessed on 2 May 2025).
- Karwacka, A.; Zamkowska, D.; Radwan, M.; Jurewicz, J. Exposure to modern, widespread environmental endocrine disrupting chemicals and their effect on the reproductive potential of women: An overview of current epidemiological evidence. Hum. Fertil. 2017, 22, 2–25. [Google Scholar] [CrossRef]
- Alofe, O.; Kisanga, E.; Inayat-Hussain, S.H.; Fukumura, M.; Garcia-Milian, R.; Perera, L.; Vasiliou, V.; Whirledge, S. Determining the endocrine disruption potential of industrial chemicals using an integrative approach: Public databases, in vitro exposure, and modeling receptor interactions. Environ. Int. 2019, 131, 104969. [Google Scholar] [CrossRef]
- Government of Canada. Canada Gazette, Part 1, Volume 1, Number 1: Regulations Amending Certain Regulations Concerning the Disclosure of Cosmetic Ingredients. 2023. Available online: https://gazette.gc.ca/rp-pr/p1/2023/2023-02-11/html/reg4-eng.html (accessed on 3 May 2025).
- Steinemann, A. Fragranced consumer products: Exposures and effects from emissions. Air Qual. Atmos. Health 2016, 9, 861–866. [Google Scholar] [CrossRef]
- Office of the Auditor General of Canana. Report 3—Chemicals in Consumer Products and Cosmetics. 2016. Available online: https://www.oag-bvg.gc.ca/internet/English/parl_cesd_201605_03_e_41382.html (accessed on 9 May 2025).
- Mukherjee, S.; Das, A.; Chowdhury, A.; Biswas, A.; Roy, S.; Majumdar, S.; Paul, S. Harmful effect of personal care products on ecosystem and the possible alternative approach. Biocatal. Agric. Biotechnol. 2024, 57, 103065. [Google Scholar] [CrossRef]
- Harley, K.G.; Kogut, K.; Madrigal, D.S.; Cardenas, M.; Vera, I.A.; Meza-Alfaro, G.; She, J.; Gavin, Q.; Zahedi, R.; Bradman, A.; et al. Reducing phthalate, paraben, and phenol exposure from personal care products in adolescent girls: Findings from the hermosa intervention study. Environ. Health Perspect. 2016, 124, 1600–1607. [Google Scholar] [CrossRef]
- Llanos, A.A.; Rockson, A.; Getz, K.; Greenberg, P.; Portillo, E.; McDonald, J.A.; Teteh, D.K.; Villasenor, J.; Lozada, C.; Franklin, J.; et al. Assessment of personal care product use and perceptions of use in a sample of US adults affiliated with a university in the northeast. Environ. Res. 2023, 236, 116719. [Google Scholar] [CrossRef]
- Hart, L.B.; Walker, J.; Beckingham, B.; Shelley, A.; Alten Flagg, M.; Wischusen, K.; Sundstrom, B. A characterization of personal care product use among undergraduate female college students in South Carolina, USA. J. Expo. Sci. Environ. Epidemiol. 2020, 30, 97–106. [Google Scholar] [CrossRef]
- Barrett, E.S.; Sathyanarayana, S.; Janssen, S.; Redmon, J.; Nguyen, R.H.; Kobrosly, R.; Swan, S.H. Environmental health attitudes and behaviors: Findings from a large pregnancy cohort study. Eur. J. Obstet. Gynecol. Reprod. Biol. 2014, 176, 119–125. [Google Scholar] [CrossRef]
- Marie, C.; Cabut, S.; Vendittelli, F.; Sauvant-Rochat, M.-P. Changes in cosmetics use during pregnancy and risk perception by women. Int. J. Environ. Res. Public Health 2016, 13, 383. [Google Scholar] [CrossRef]
- Rouillon, S.; El Ouazzani, H.; Rabouan, S.; Migeot, V.; Albouy-Llaty, M. Determinants of risk perception related to exposure to endocrine disruptors during pregnancy: A qualitative and quantitative study on french women. Int. J. Environ. Res. Public Health 2018, 15, 2231. [Google Scholar] [CrossRef]
- Ricke, I.J.; Oglesby, A.; Lyden, G.R.; Barrett, E.S.; Moe, S.; Nguyen, R.H.N. Knowledge, Attitudes, and Behaviors Regarding Chemical Exposure among a Population Sample of Reproductive-Aged Women. Int. J. Environ. Res. Public Health 2022, 19, 3015. [Google Scholar] [CrossRef]
- Trifunovski, A.; Rotondi, N.K.; Abbass-Dick, J.; Al Ghali, R.; Barakat, C. The Development and Reliability Testing of a Tool to Assess Women’s Perceptions and Avoidance of Endocrine Disruptors in Personal and Household Products. Environments 2025, 12, 138. [Google Scholar] [CrossRef]
- Statistics Canada. Fertility: Overview, 2012 to 2016. 2018. Available online: https://www150.statcan.gc.ca/n1/pub/91-209-x/2018001/article/54956-eng.htm (accessed on 6 October 2022).
- Sullivan, G.M.; Artino, A.R. Analyzing and interpreting data from likert-type scales. J. Grad. Med. Educ. 2013, 5, 541–542. [Google Scholar] [CrossRef]
- Lee, M.; You, M. Safety behaviors to reduce risk of using chemical household products: An application of the risk perception attitude framework. Int. J. Environ. Res. Public Health 2020, 5, 1528. [Google Scholar] [CrossRef]
- Denman, D.C.; Baldwin, A.S.; Betts, A.C.; McQueen, A.; Tiro, J.A. Reducing “i don’t know” responses and missing survey data: Implications for measurement. Med. Decis. Mak. 2018, 38, 673–682. [Google Scholar] [CrossRef]
- Guo, Z.; Chen, Y.; Zhang, Y.; Ding, C.; Li, M.; Xu, L.; Jin, J. Associations among risk perception, health efficacy, and health behaviors for cardiovascular disease: An application of risk perception attitude framework. Front. Cardiovasc. Med. 2023, 10, 1201789. [Google Scholar] [CrossRef] [PubMed] [PubMed Central]
- du Prel, J.-B.; Röhrig, B.; Hommel, G.; Blettner, M. Choosing statistical tests: Part 12 of a series on evaluation of scientific publications. Dtsch. Arztebl. Int. 2010, 107, 343–348. [Google Scholar] [CrossRef] [PubMed]
- Statistics Canada. Low-Income Cut-Offs. Government of Canada. 2021. Available online: https://www.canada.ca/en/employment-social-development/services/foreign-workers/caregiver/financial-ability.html (accessed on 8 April 2023).
- Farrar, D.E.; Glauber, R.R. Multicollinearity in Regression Analysis: The Problem Revisited. Rev. Econ. Stat. 1967, 49, 92–107. [Google Scholar] [CrossRef]
- Mansfield, E.R.; Helms, B.P. Detecting Multicollinearity. Am. Stat. 1982, 36, 158–160. [Google Scholar] [CrossRef]
- Zhou, S.; Wu, L.; Si, H.; Shen, B. Longitudinal association between uric acid and incident sarcopenia. Nutrients 2023, 15, 3097. [Google Scholar] [CrossRef]
- Good Authority. How the Media Put Bpa on the Agenda in the States. 2013. Available online: https://goodauthority.org/news/how-the-media-put-bpa-on-the-agenda-in-the-states/?utm (accessed on 3 April 2025).
- Mordor Intelligence. (n.d.). Organic Skincare Products Market Size. Available online: https://www.mordorintelligence.com/industry-reports/organic-skin-care-market#:~:text=Paraben%2Dfree%20Products%20are%20Being,paraben%2Dfree%2C%20and%20organic (accessed on 9 May 2025).
- Government of Canada. Safety of Cosmetic Ingredients. 2020. Available online: https://www.canada.ca/en/health-canada/services/consumer-product-safety/cosmetics/labelling/safety-ingredients.html (accessed on 5 May 2025).
- FitzPatrick, M. Endocrine Disrupting Chemicals and Personal Care Products: Risk Awareness and Exposure Assessment for Women’s Reproductive Health. Ph.D. Thesis, Boston University, Boston, MA, USA, 2021. Available online: https://open.bu.edu/items/9b1d4020-eb0c-4fd9-9604-6c3be994f30f (accessed on 7 October 2022).
- Molot, J.; Sears, M.; Anisman, H. Multiple chemical sensitivity: It’s time to catch up to the science. Neurosci. Biobehav. Rev. 2023, 151, 105227. [Google Scholar] [CrossRef]
- Lu, X.; Hisada, A.; Anai, A.; Nakashita, C.; Masuda, S.; Fujiwara, Y.; Kunugita, N.; Katoh, T. Study of the correlation between multiple chemical sensitivity and personality using the quick environmental exposure sensitivity inventory questionnaire and the temperament and character inventory. J. Occup. Environ. Med. 2020, 62, e348–e354. [Google Scholar] [CrossRef] [PubMed]
- Steinmann, A. International prevalence of chemical sensitivity, co-prevalence with asthma and autism, and effects from fragranced consumer products. Air Qual. Atmos. Health 2019, 12, 519–527. [Google Scholar] [CrossRef]
- Chung, C.; Park, J.; Song, J.-E.; Park, S. Determinants of protective behaviors against endocrine disruptors in young korean women. Asian Nurs. Res. 2020, 14, 165–172. [Google Scholar] [CrossRef]
- Yoon, C.-M.; Kim, H.-J. Influencing factors of behavior for reducing exposure to endocrine disrupting chemicals and demand for related education. Eur. J. Investig. Health Psychol. Educ. 2022, 12, 295–305. [Google Scholar] [CrossRef]
- Rosenstock, I.M.; Strecher, V.J.; Becker, M.H. Social learning theory and the health belief model. Health Educ. Q. 1988, 15, 175–183. [Google Scholar] [CrossRef]
- Dodson, R.E.; Boronow, K.E.; Susmann, H.; Udesky, J.O.; Rodgers, K.M.; Weller, D.; Woudneh, M.; Brody, J.G.; Rudel, R.A. Consumer behavior and exposure to parabens, bisphenols, triclosan, dichlorophenols, and benzophenone-3: Results from a crowdsourced biomonitoring study. Int. J. Hyg. Environ. Health 2020, 230, 113624. [Google Scholar] [CrossRef] [PubMed]
- Albadr, T.; Alfawzan, S.; Aljarba, B.; Alshehri, R.; Mahboub, S. Use of health belief model to explain the behaviour of following safety measures during the use of household chemical products among adult females in Riyadh. Int. J. Res. Med. Sci. 2020, 9, 9–14. [Google Scholar] [CrossRef]
Disclaimer/Publisher’s Note: The statements, opinions and data contained in all publications are solely those of the individual author(s) and contributor(s) and not of MDPI and/or the editor(s). MDPI and/or the editor(s) disclaim responsibility for any injury to people or property resulting from any ideas, methods, instructions or products referred to in the content. |
© 2025 by the authors. Licensee MDPI, Basel, Switzerland. This article is an open access article distributed under the terms and conditions of the Creative Commons Attribution (CC BY) license (https://creativecommons.org/licenses/by/4.0/).