


Pollution Risk Assessment of Potentially Toxic Elements in Soils Using Characterization and Microbiological Analysis: The Case of a Rare and Precious Metal Mining Site in Wuzhou, Guangxi

Abstract

1. Introduction
2. Materials and Methods
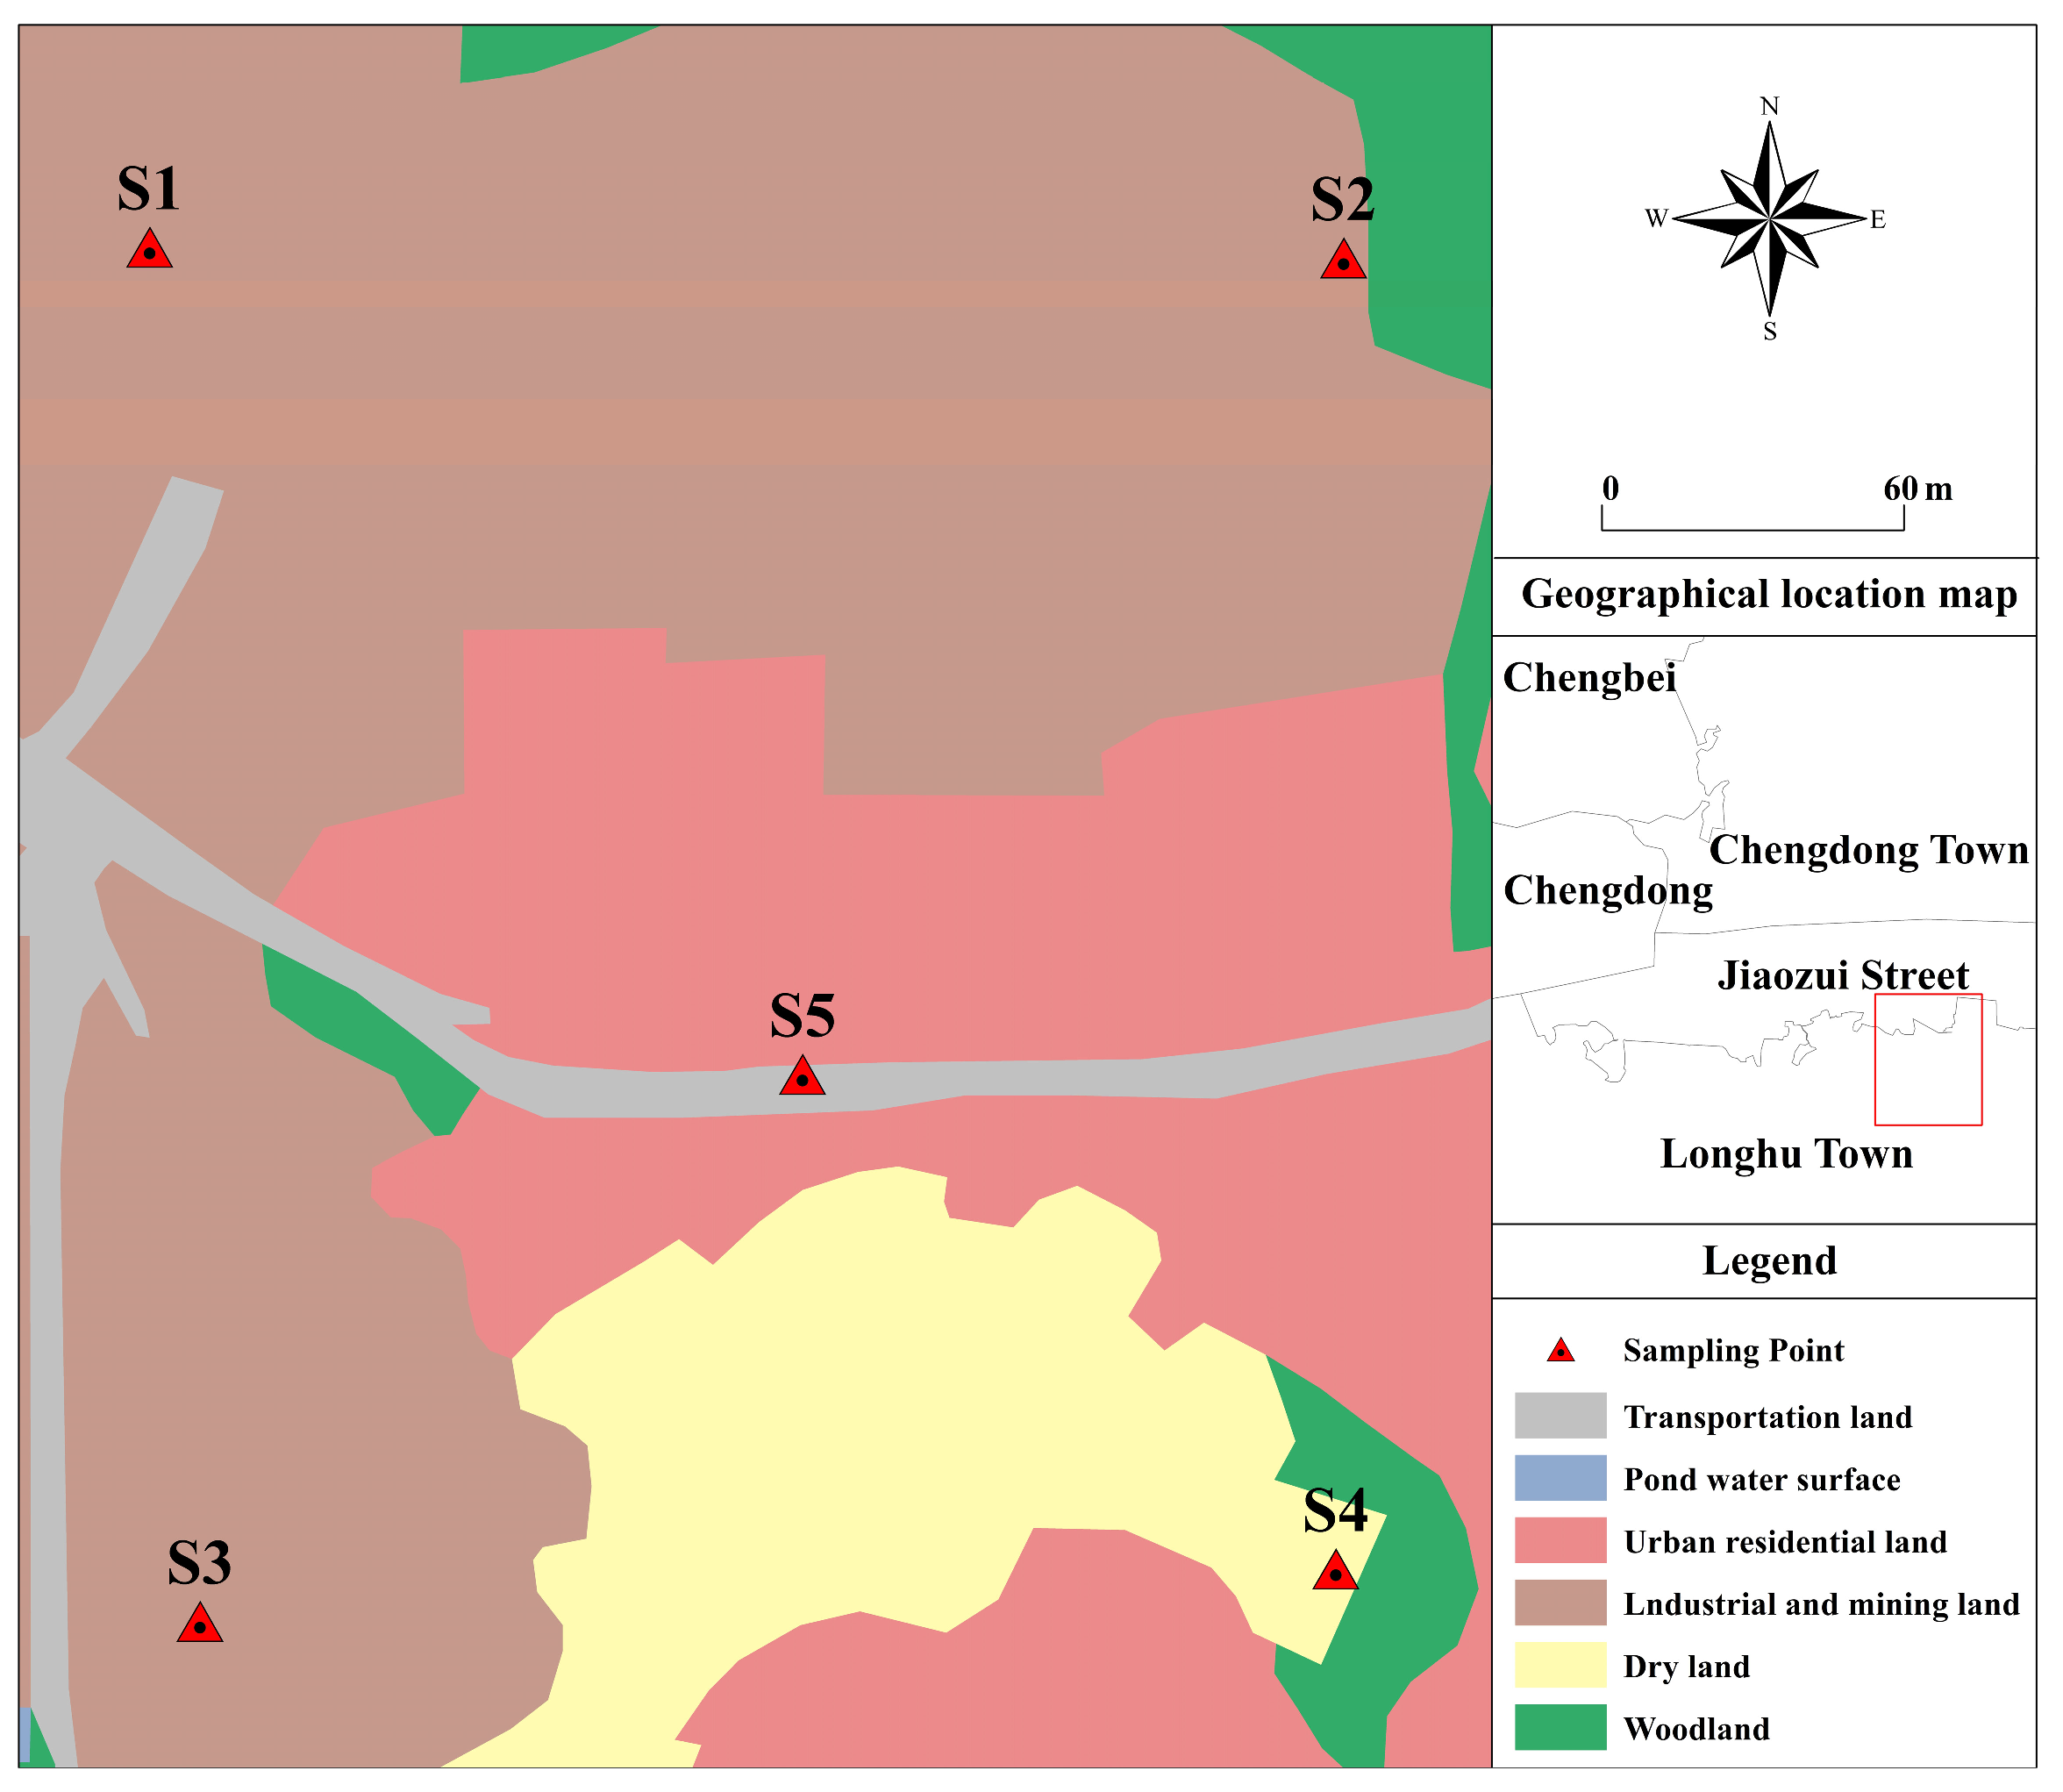
2.1. Site Characteristics
2.2. Sample Collection and Processing
2.3. Impact Assessment Method of PTE Pollution in Soil
2.3.1. Single Pollution Index Method
2.3.2. Nemerow Index Method
2.3.3. Index of Geoaccumulation (Igeo) Method
2.3.4. PMF Model Construction
2.3.5. Extraction and High-Throughput Sequencing of Microbial DNA
2.3.6. Data Analysis and Processing
3. Results
3.1. PTE Content in Soil Samples
3.2. Assessment of PTE Pollution in Soil
3.2.1. Single Factor and Nemerow Index Methods
3.2.2. Index of Geoaccumulation (Igeo)
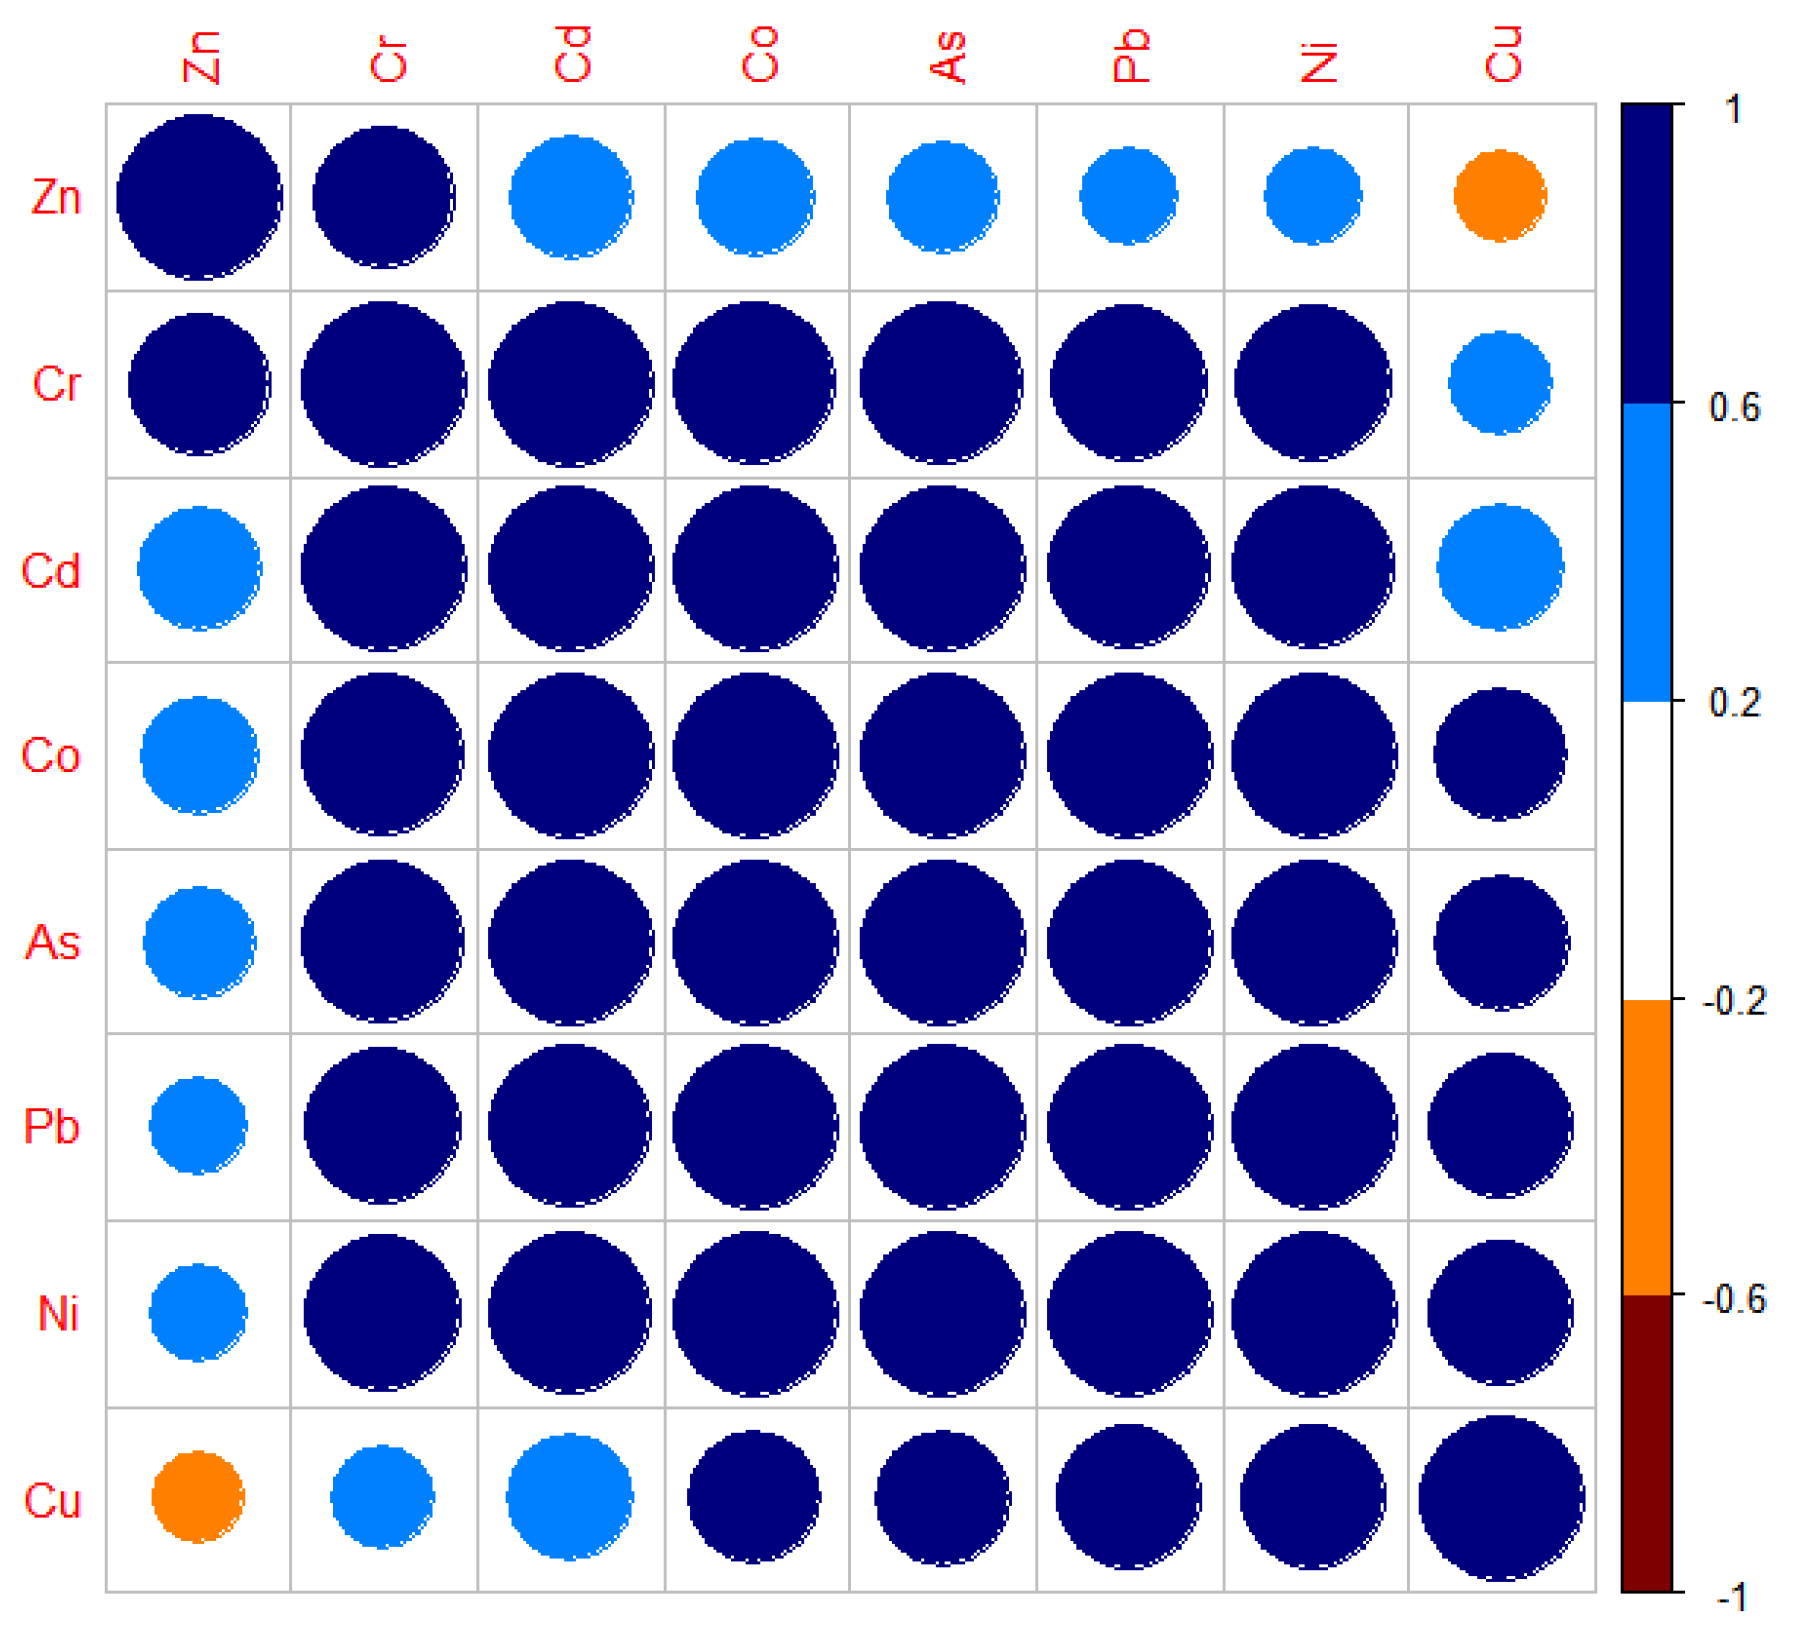
3.3. Correlation Analysis and Source Apportionment of PTEs in Soil
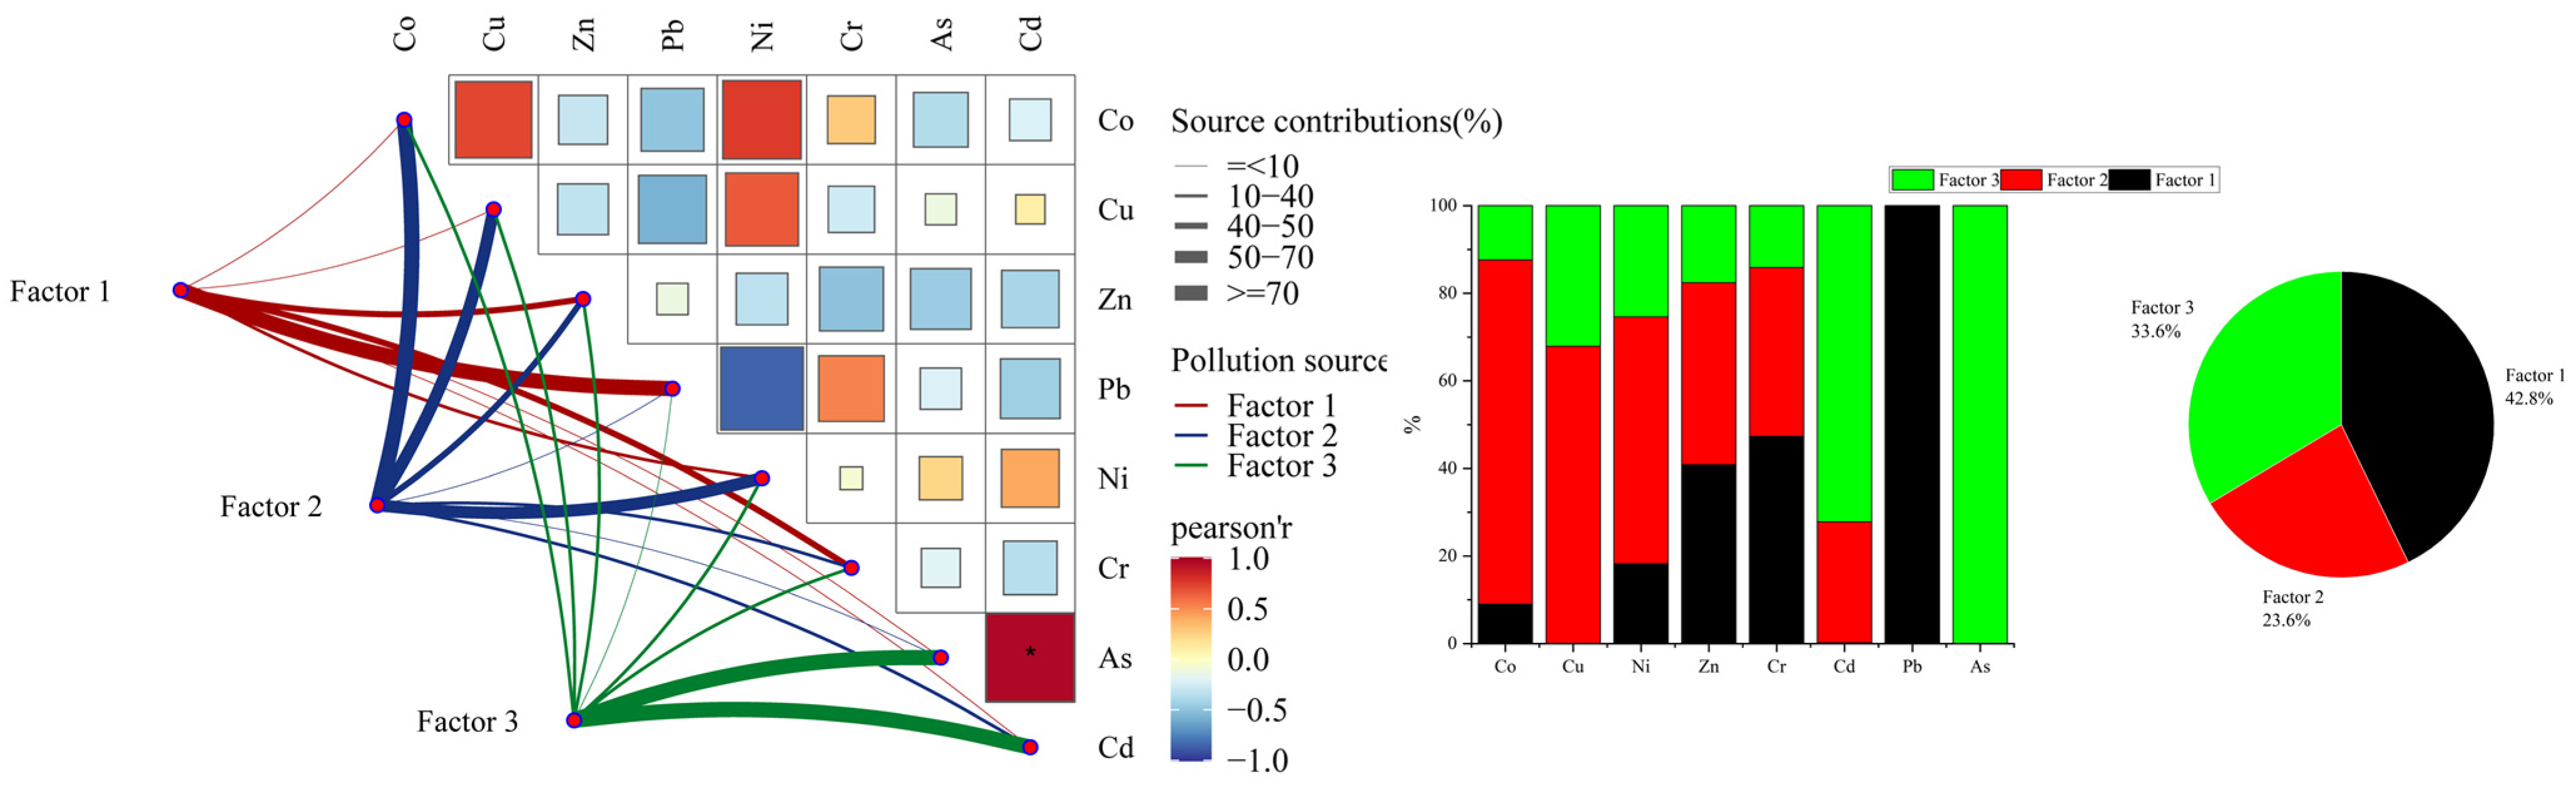
3.4. Source Apportionment of Potential Toxic Elements in PMF Model
3.5. Characterization of Soil
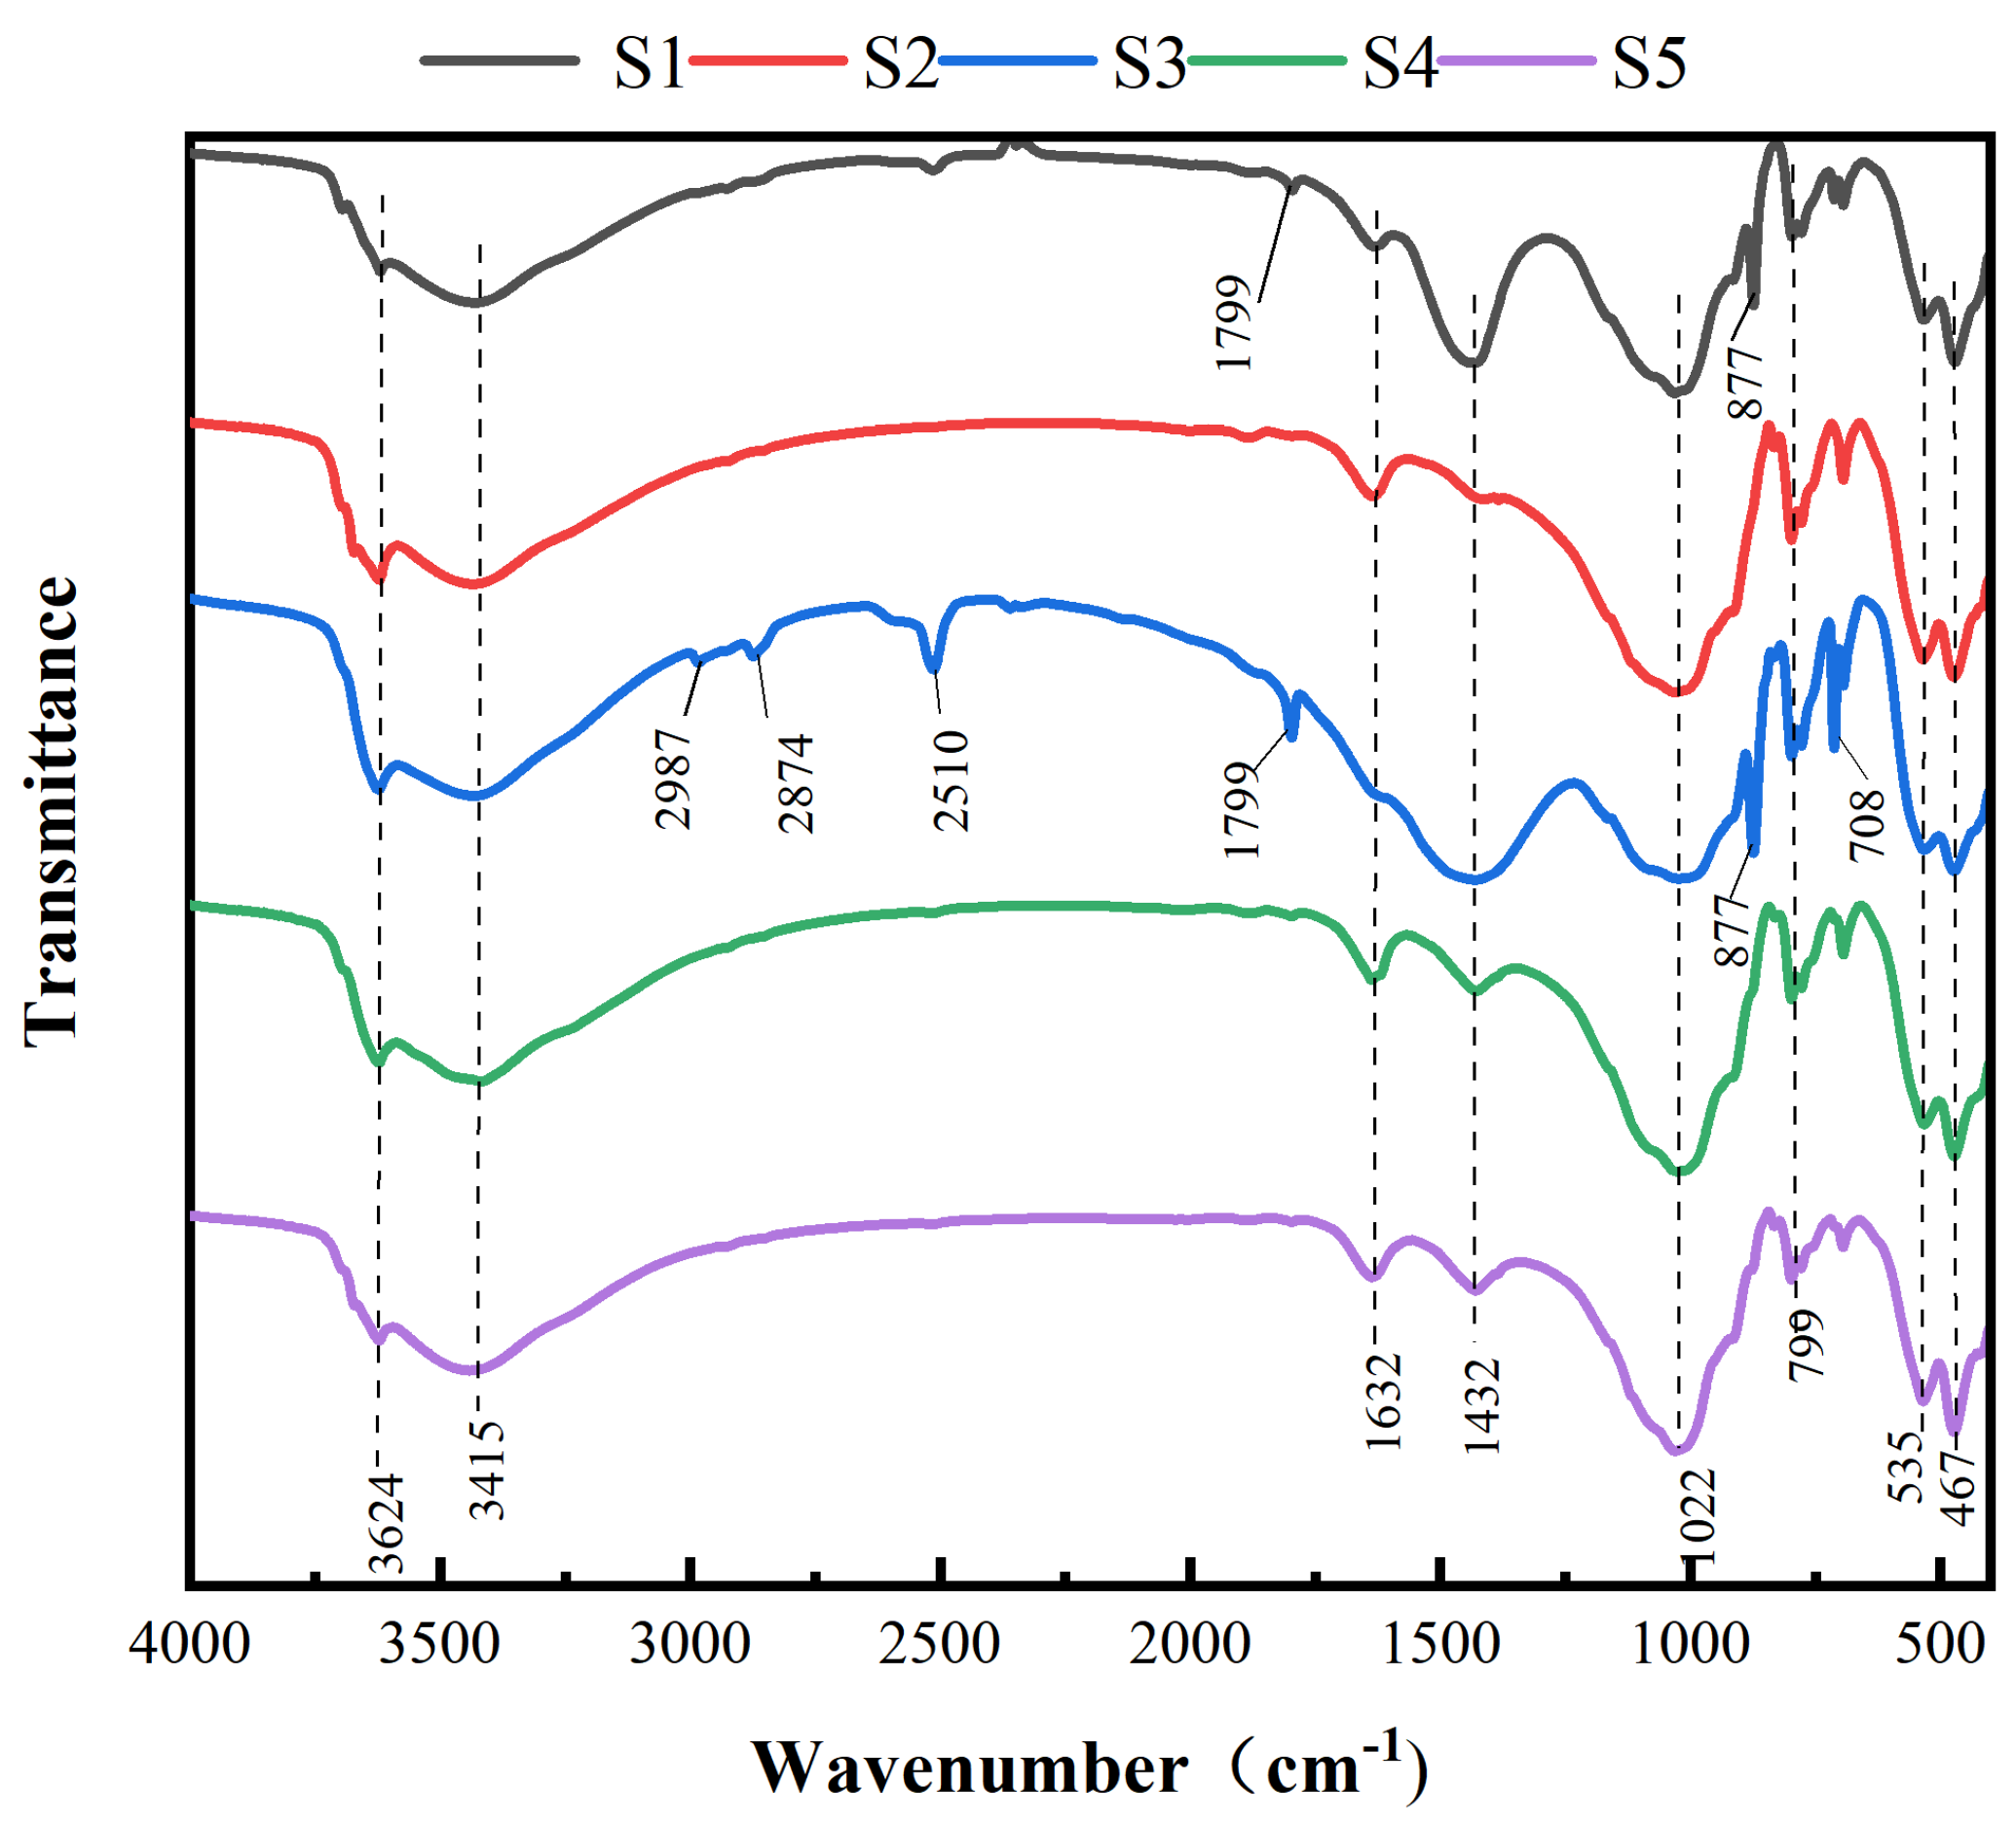
3.5.1. FTIR Analysis
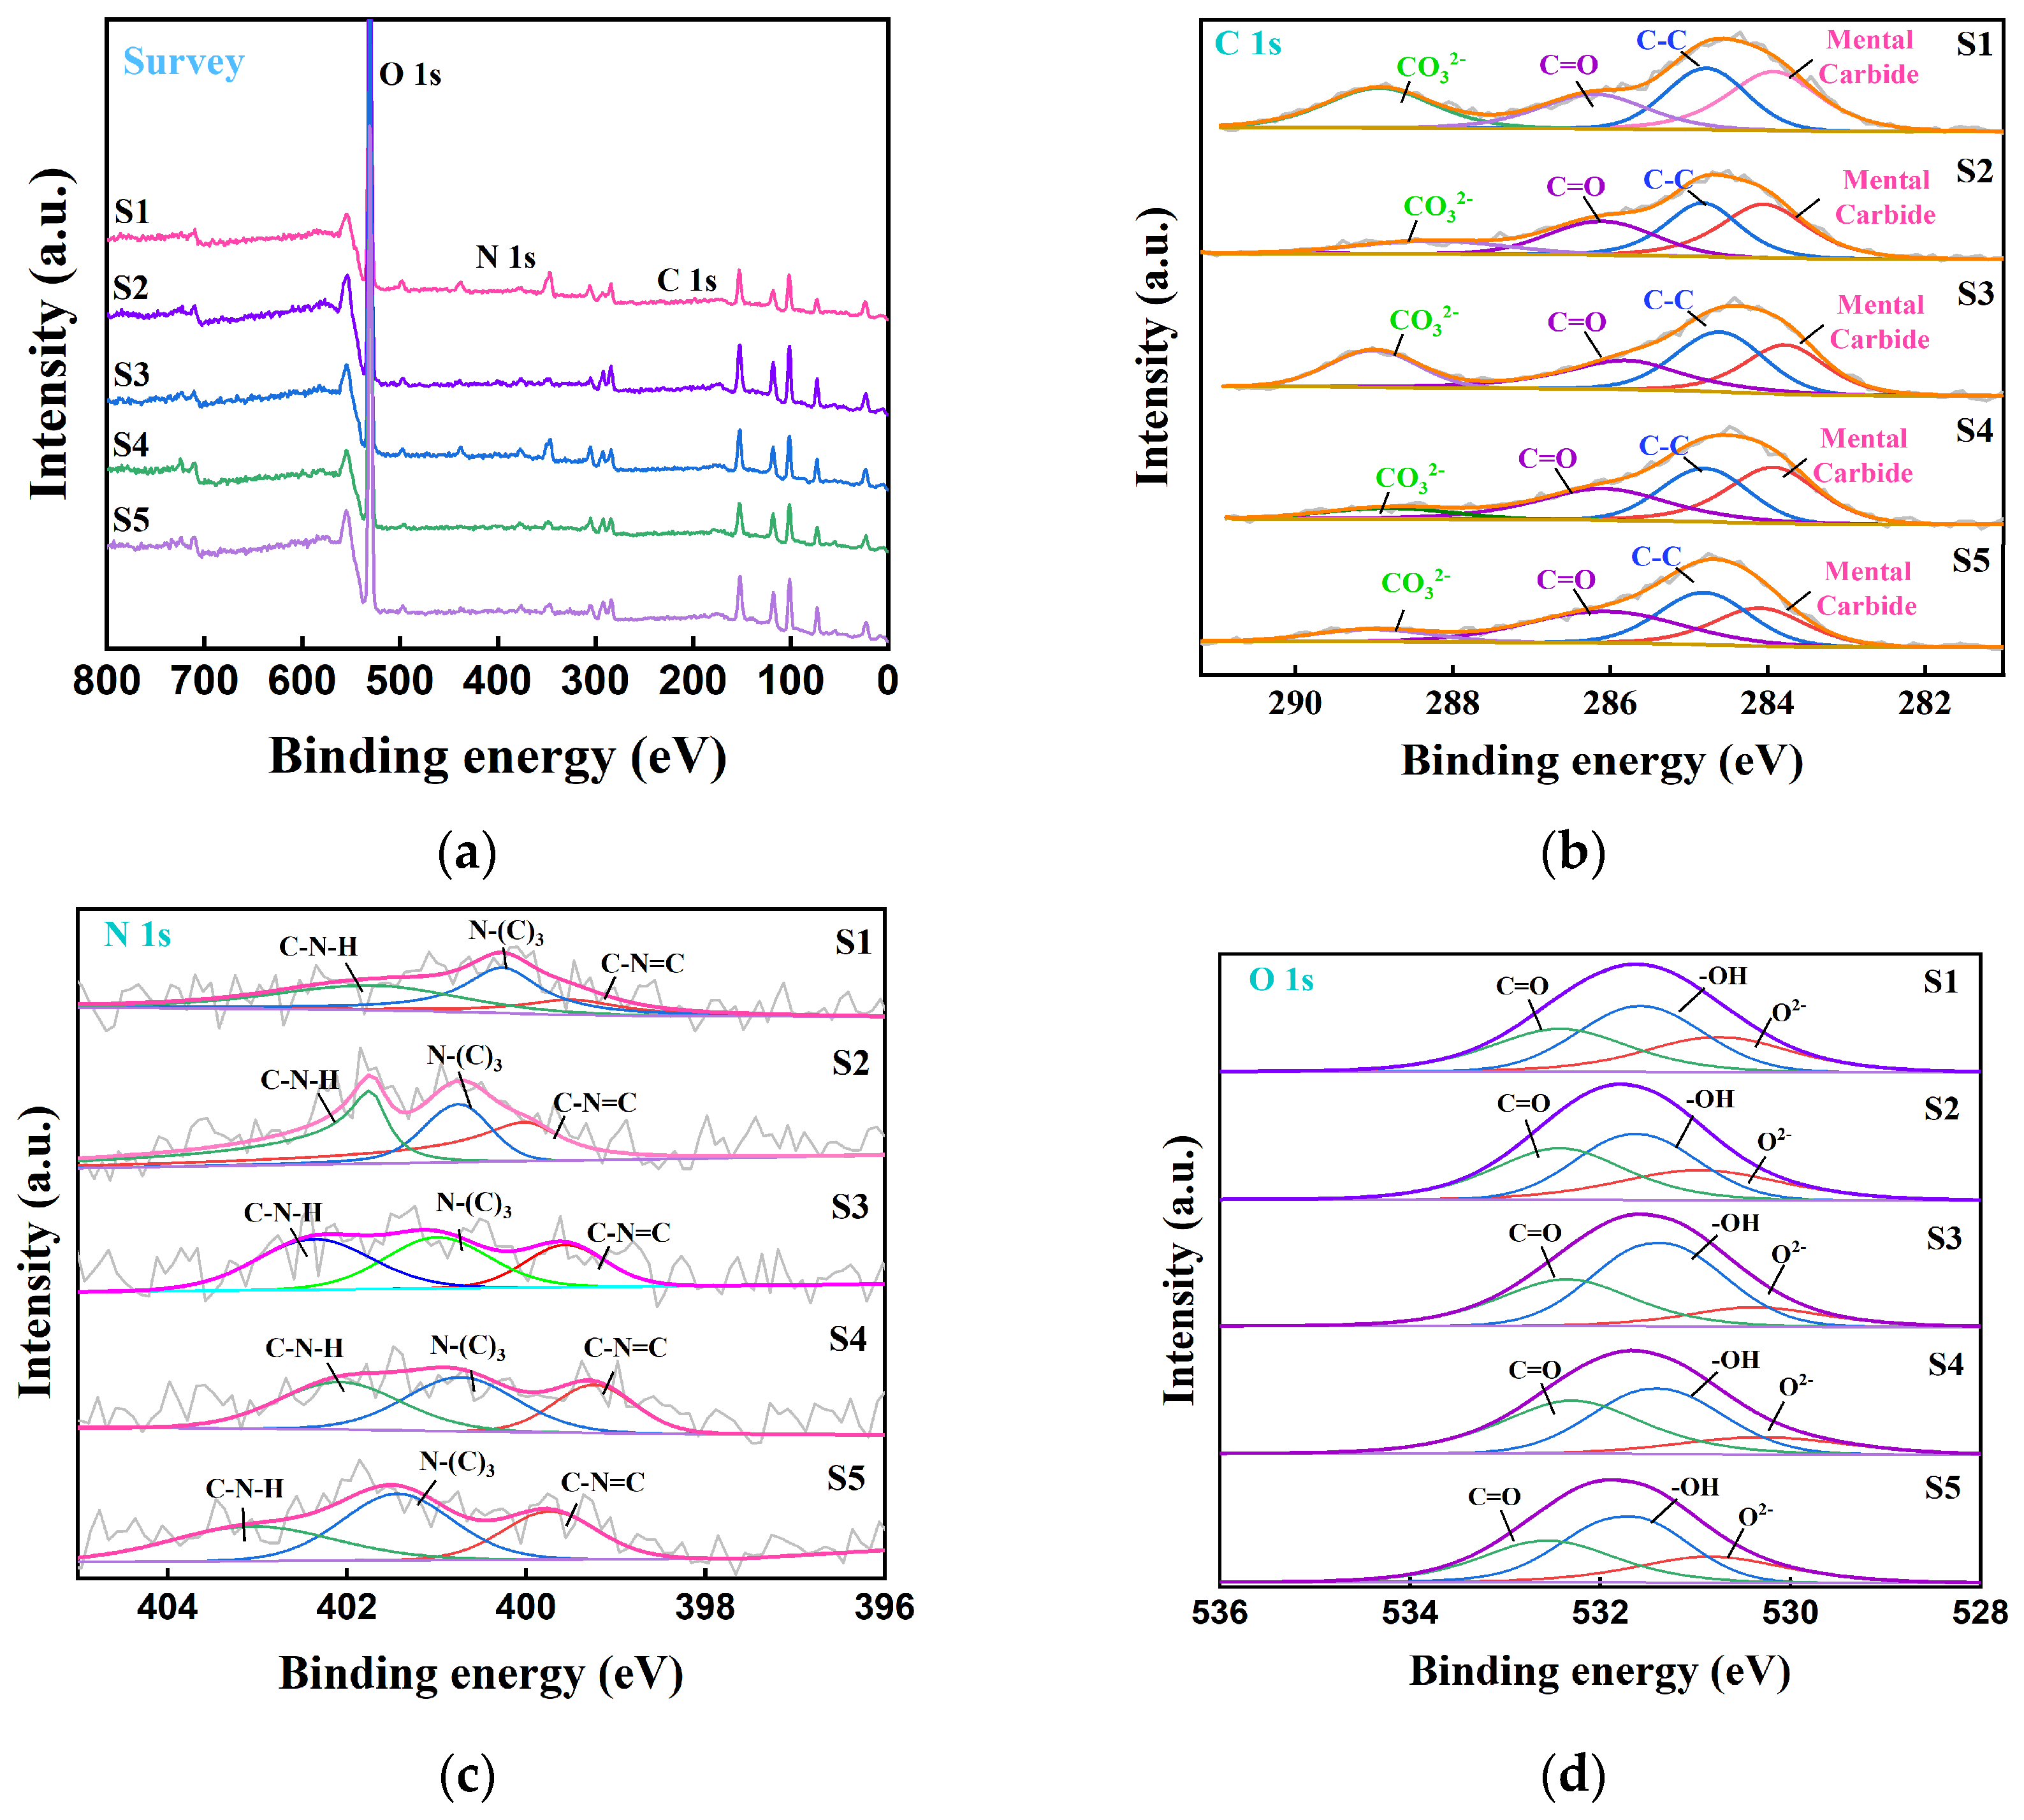
3.5.2. XPS Analysis
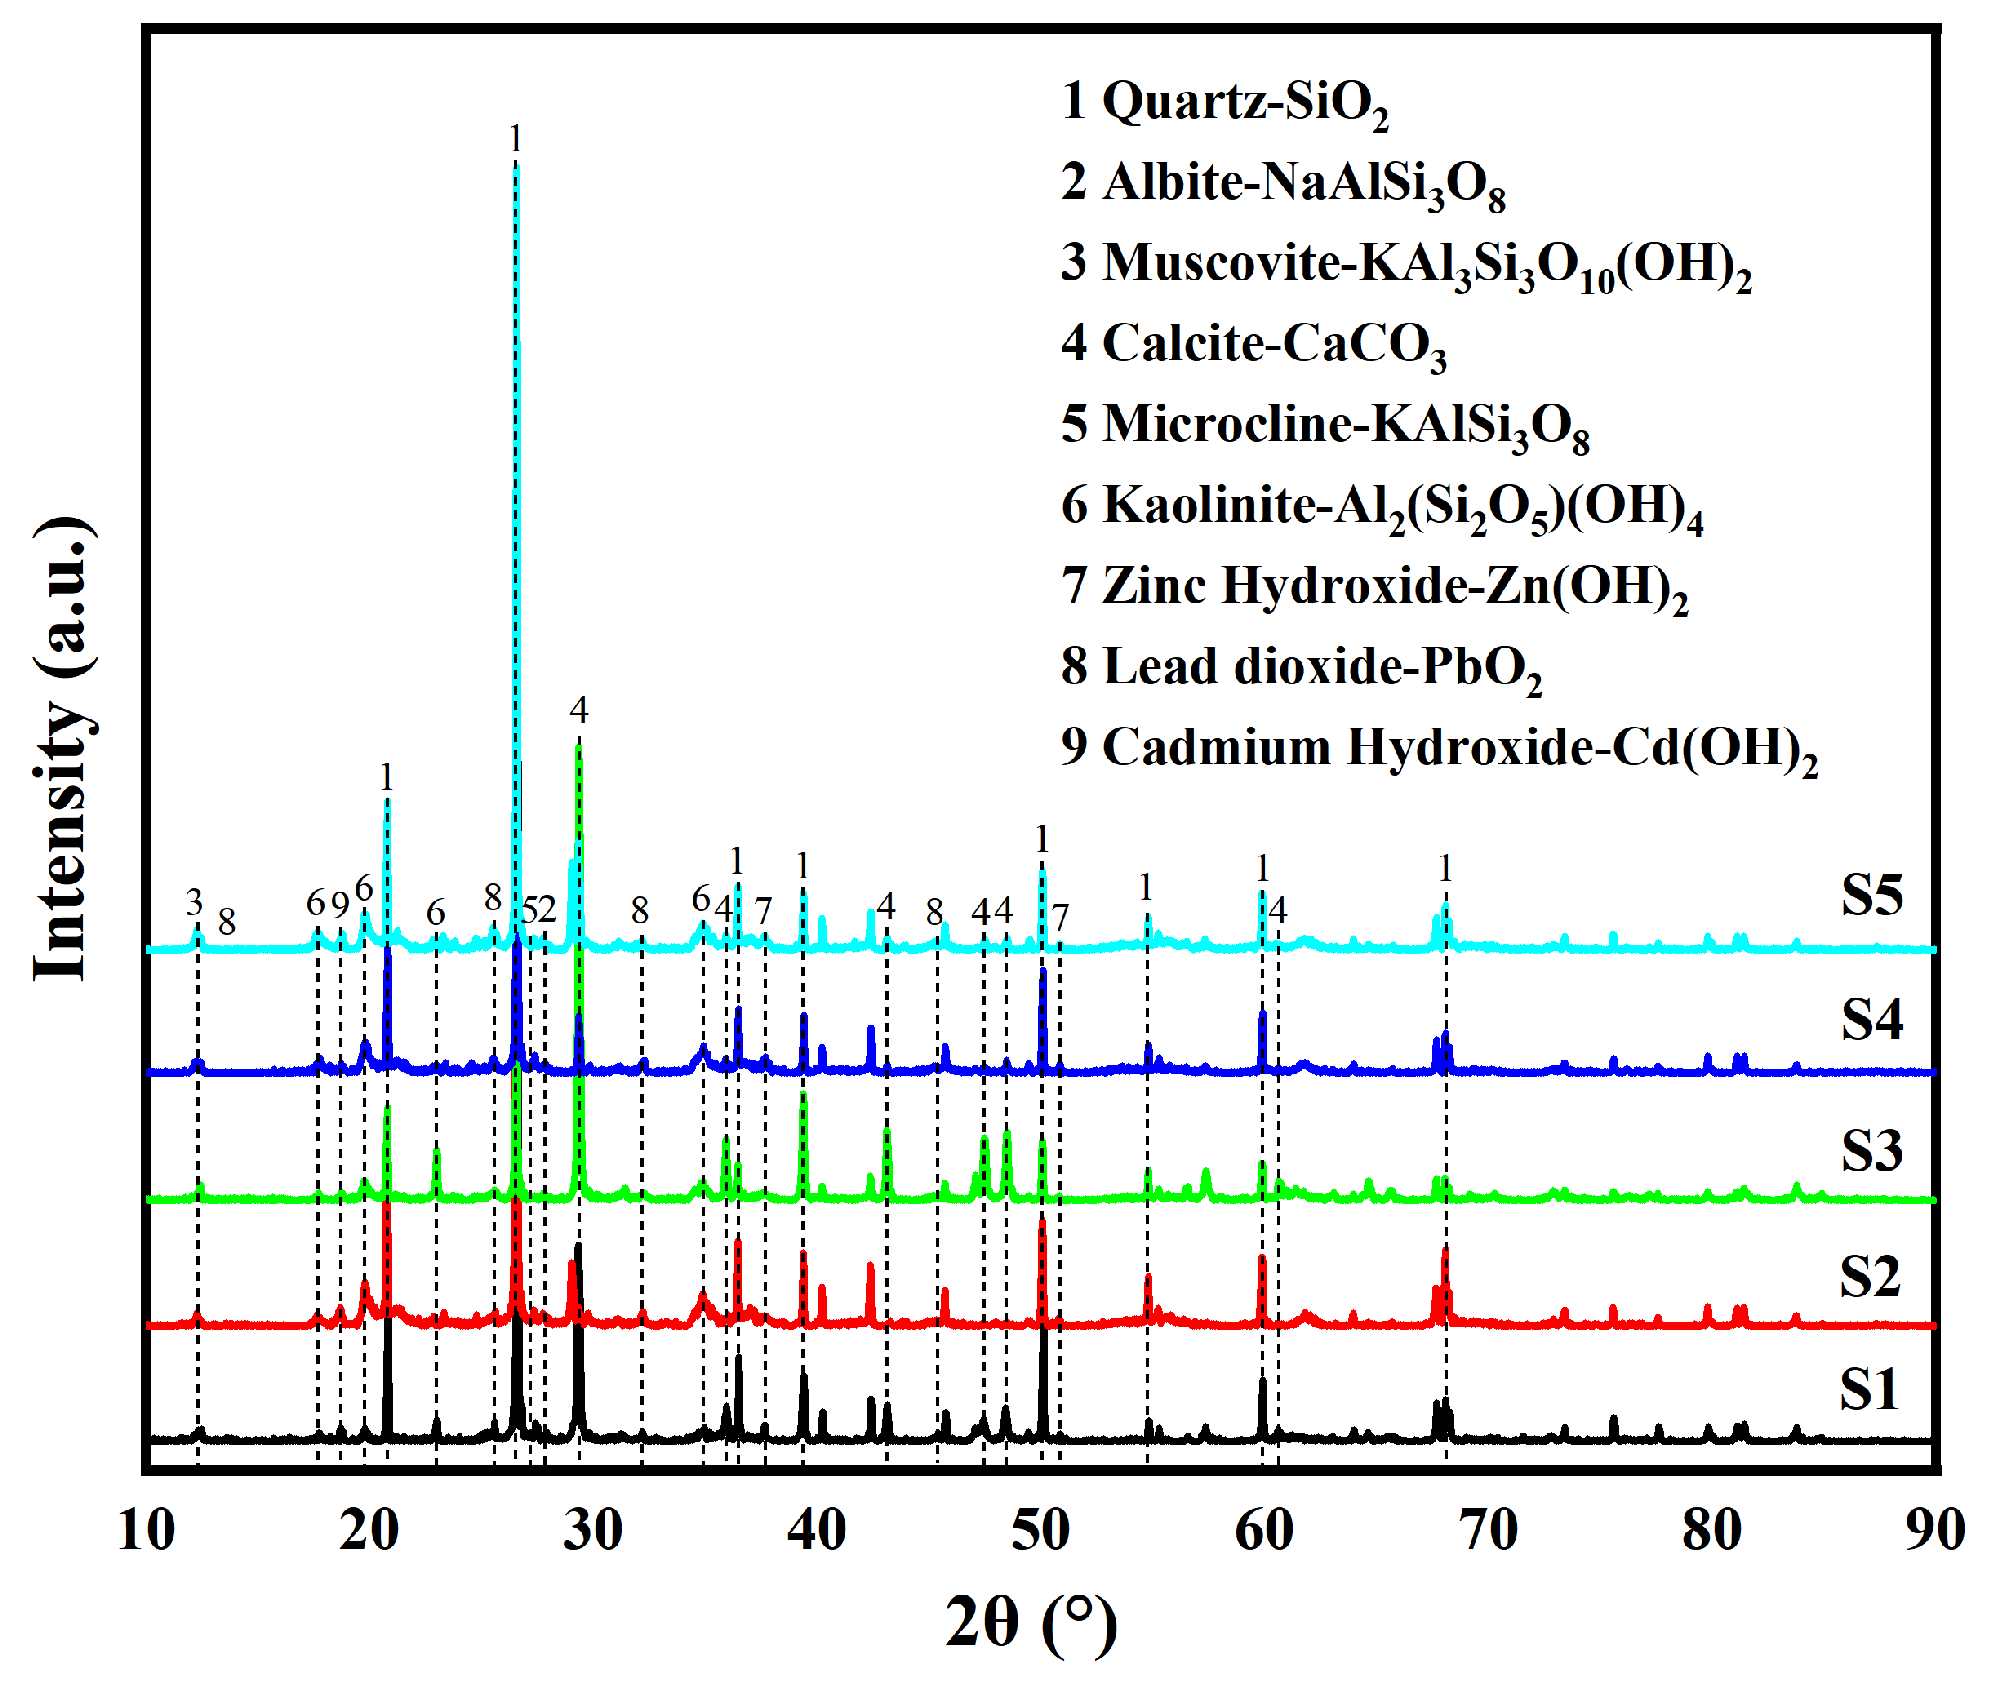
3.5.3. XRD Analysis
3.6. Microbial Community Analysis
3.6.1. OTU Cluster Analysis
3.6.2. Diversity Index Analysis
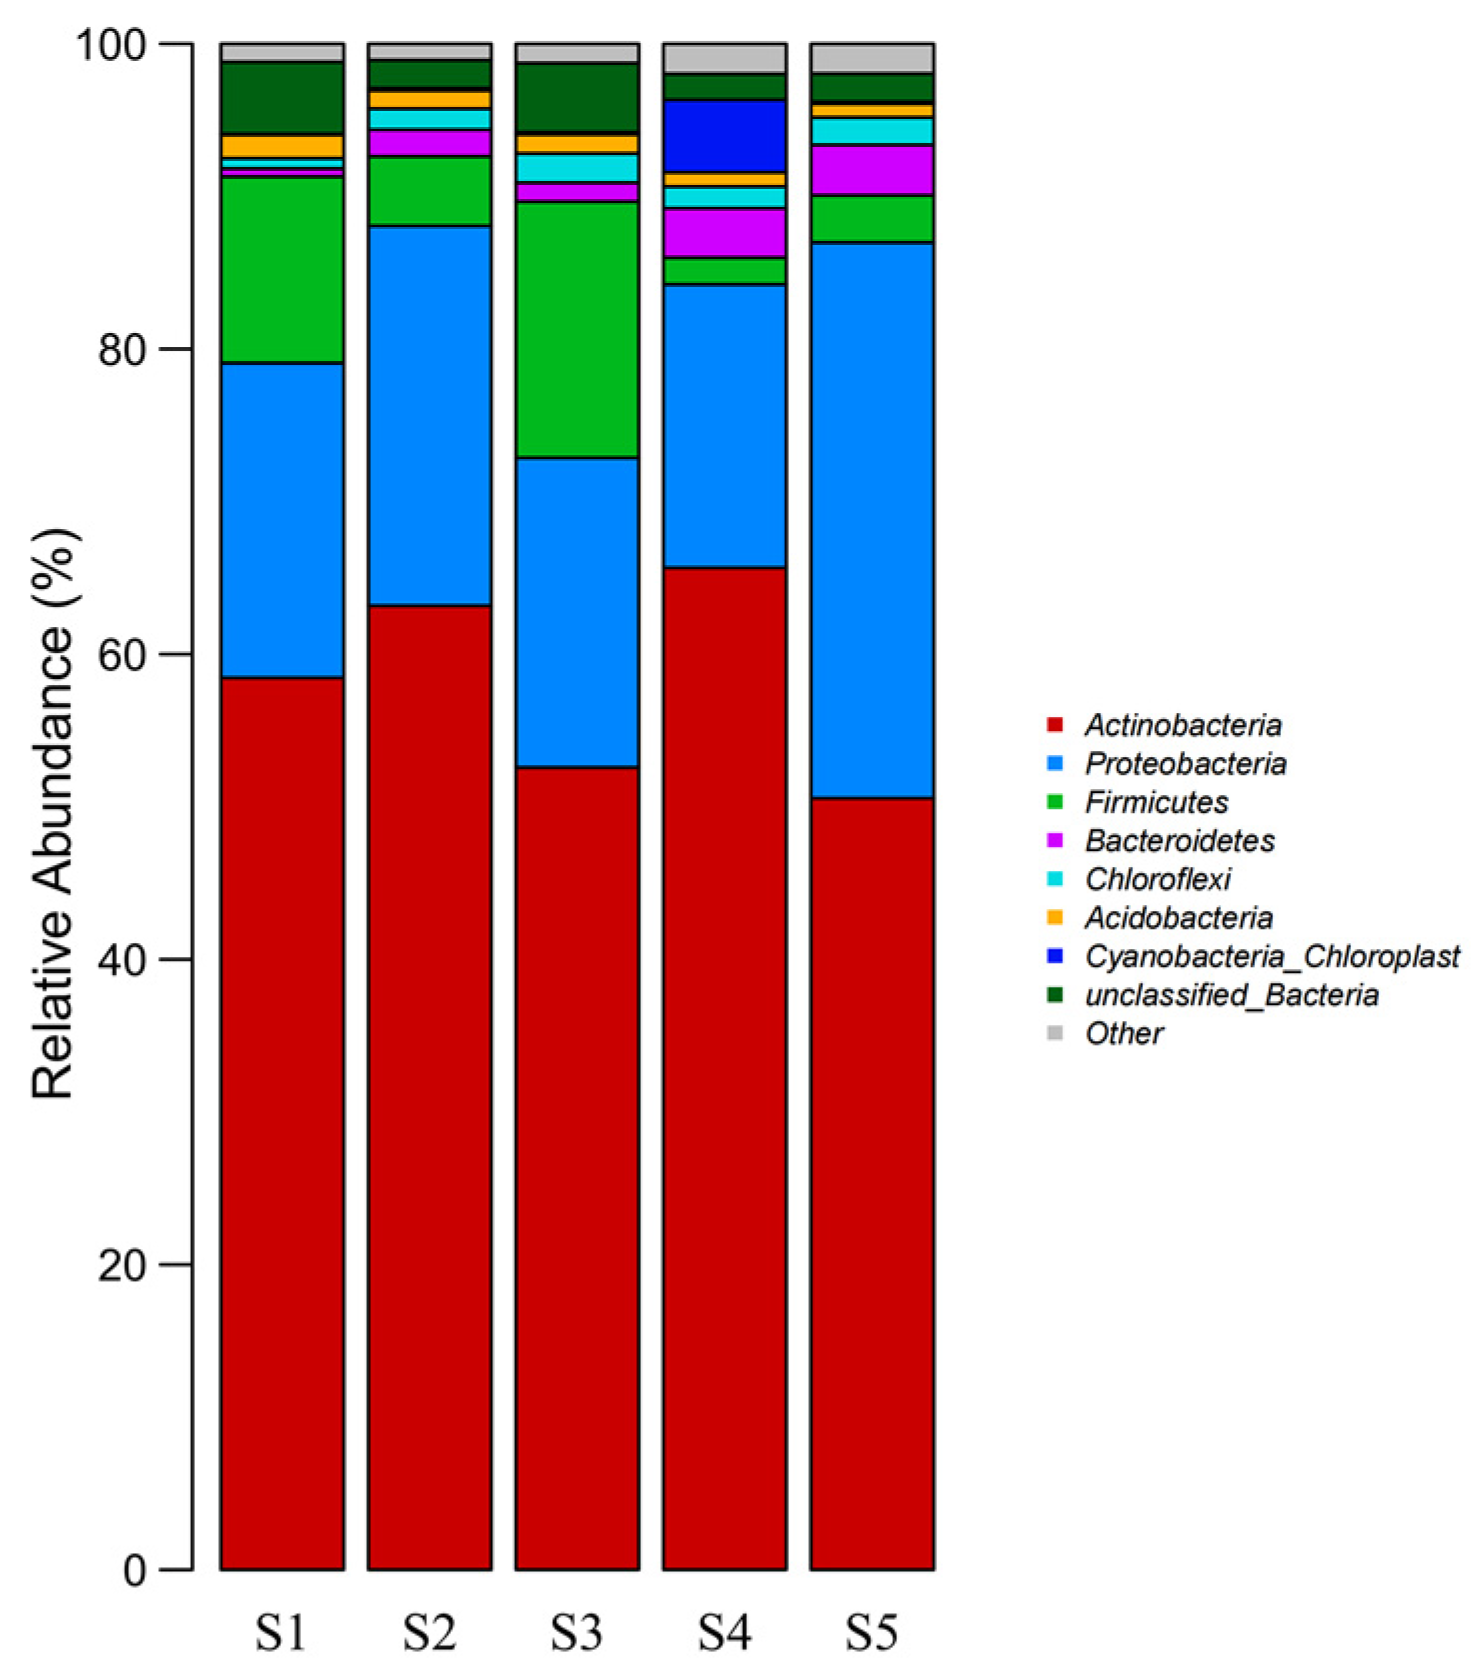
3.6.3. Microbial Community Structure at the Phylum Level in the Samples Collected at Different Sites
3.6.4. Microbial Community Structure at the Genus Level in the Samples Collected at Different Sites
4. Conclusions
- (1)
- The average contents of Cd, Co, As, Pb, Zn, and Cu in the soil at the site were higher than the background levels in the soils of Guangxi Province. The CV of Cd, As, Pb, and Cu exceeded 1, with a high degree of dispersion, which was greatly affected by external factors.
- (2)
- The single factor pollution index showed that Cd and As were heavily polluting, Co was slightly polluting, and the other PTEs were non-polluting. The geoaccumulation index showed that Cd was highly accumulated; Pb, As, and Co were moderately accumulated; Cu and Zn were mildly accumulated; and Ni and Cr were not accumulated. The load of Co in principal component 2 was relatively high, and there was a correlation with most other PTEs, which may be due to pollution caused by the inclusion of some of the production waste residue and exogenous soil in backfill of the site.
- (3)
- The results of infrared spectroscopy showed that C=O in the soil was chelated with PTEs, leading to the disappearance of C=O’s characteristic peaks in protein and polypeptide substances. The PTEs in the soil samples exerted greater damage to the total carbohydrates in the soil, and there was a variable amount of PTE pollution. XPS analysis showed that metal carbides appeared in the high-resolution C 1s spectrum, O2− appeared in the high-resolution O 1s spectrum, mainly from the metal oxides produced by the PTEs, and the soil was polluted with Pb, Zn, and Cd to a certain extent. The XRD results showed that cadmium hydroxide, lead oxide, and zinc hydroxide were present in all five sampling sites (S1–S5), indicating that the five samples were contaminated by PTEs such as cadmium, lead, and zinc.
- (4)
- The risks of Cd, Zn, Cu, and Pb in the soil of the study area were high, mainly due to the joint effects of human activities and natural conditions. Measures should be taken to improve the quality of soil and the surrounding environment and reduce pollution by PTEs.
- (5)
- Actinobacteria and Proteobacteria were the dominant microbial phyla in soil in the study area. The dominant bacterial genera were Nocardioides, Janibacter, Dietzia, Micromonospora, Saccharopolyspora, and Pseudarthrobacter.
- (6)
- According to the PMF model, the soil properties in the study area are jointly influenced by agricultural activity sources, transportation and industry, and the metal smelting and electronic manufacturing industries.
Author Contributions
Funding
Institutional Review Board Statement
Informed Consent Statement
Data Availability Statement
Conflicts of Interest
References
- Gao, H.Z.; Lu, Q.P. Near Infrared Spectral Analysis and Measuring System for Primary Nutrient of Soil. Spectrosc. Spect. Anal. 2011, 31, 1245–1249. [Google Scholar] [CrossRef]
- Dangi, S.R.; Bañuelos, G.; Buyer, J.S.; Hanson, B.; Gerik, J. Microbial community biomass and structure in saline and non-saline soils associated with salt- and boron-tolerant poplar clones grown for the phytoremediation of selenium. Int. J. Phytoremediat. 2018, 20, 129–137. [Google Scholar] [CrossRef]
- Liu, X.; Yang, Z.; Li, B.; Wu, Z.; Wang, L.; Yu, T.; Li, C.; He, Z.; Xie, M.; Deng, C.; et al. Source Apportionment and Analysis of Potentially Toxic Element Sources in Agricultural Soils Based on the Positive Matrix Factorization and Geo-Detector Models. Land 2025, 14, 146. [Google Scholar] [CrossRef]
- Aoshima, K. Itai-itai disease: Renal tubular osteomalacia induced by environmental exposure to cadmiumhistorical review and perspectives. Soil Sci. Plant Nutr. 2016, 62, 319–326. [Google Scholar] [CrossRef]
- Qin, S.; Liu, H.; Nie, Z.; Rengel, Z.; Gao, W.; Li, C.; Zhao, P. Toxicity of cadmium and its competition with mineral nutrients for uptake by plants: A review. Pedosphere 2020, 30, 168–180. [Google Scholar] [CrossRef]
- Wang, X.; Han, Z.; Wang, W.; Zhang, B.; Wu, H.; Nie, L.; Zhou, J.; Chi, Q.; Xu, S.; Liu, H.; et al. Continental-scale geochemical survey of lead (Pb) in mainland China’s pedosphere: Concentration, spatial distribution and influences. Appl. Geochem. 2019, 100, 55–63. [Google Scholar] [CrossRef]
- Shi, P.; Zhang, Y.; Li, Z.; Li, P.; Xu, G. Influence of land use and land cover patterns on seasonal water quality at multi-spatial scales. Catena 2017, 151, 182–190. [Google Scholar] [CrossRef]
- Ma, L.; Abuduwaili, J.; Liu, W. Spatial Distribution and Ecological Risks of the Potentially-Toxic Elements in the Surface Sediments of Lake Bosten, China. Toxics 2020, 8, 77. [Google Scholar] [CrossRef]
- Akindele, E.O.; Omisakin, O.D.; Oni, O.A.; Aliu, O.O.; Omoniyi, G.E.; Akinpelu, O.T. Heavy metal toxicity in the water column and benthic sediments of a degraded tropical stream. Ecotoxicol. Environ. Saf. 2020, 190, 110153. [Google Scholar] [CrossRef]
- Chen, Z.W.; Xu, J.; Yang, F.; Hou, Z.L.; Ren, K.; Yu, L.S.; Yang, S.Y.; Li, Z.; Zhang, X.B. Comprehensive Monitoring and Ecological Risk Assessment of Heavy Metals in Soil and Surface Water of Chishui River Basin in Upper Reaches of the Yangtze River. Water 2023, 15, 2069. [Google Scholar] [CrossRef]
- Guo, G.H.; Wu, F.C.; Xie, F.Z.; Zhang, R.Q. Spatial distribution and pollution assessment of heavy metals in urban soils from southwest China. J. Environ. Sci. 2012, 24, 410–418. [Google Scholar] [CrossRef]
- Yu, Y.; Lu, Y.-N.; Wang, W.-J.; Qu, X.-D.; Liu, J.-T.; Wen, C.-Y. Spatio-Temporal Distribution and Risk Assessment of Heavy Metals in Middle and Lower Reaches of Le’an River. Environ. Sci. 2020, 41, 691–701. [Google Scholar] [CrossRef]
- Alengebawy, A.; Abdelkhalek, S.T.; Qureshi, S.R.; Wang, M.-Q. Heavy Metals and Pesticides Toxicity in Agricultural Soil and Plants: Ecological Risks and Human Health Implications. Toxics 2021, 9, 42. [Google Scholar] [CrossRef] [PubMed]
- Su, K.; Wang, Q.; Li, L.; Cao, R.; Xi, Y. Water quality assessment of Lugu Lake based on Nemerow pollution index method. Sci. Rep. 2022, 12, 13613. [Google Scholar] [CrossRef]
- Su, K.; Wang, Q.; Li, L.; Cao, R.; Xi, Y.; Li, G. Water quality assessment based on Nemerow pollution index method: A case study of Heilongtan reservoir in central Sichuan province, China. PLoS ONE 2022, 17, e0273305. [Google Scholar] [CrossRef]
- Zhao, D.; Sang, Y.M.; Zhang, Q.; Man, Y.; Han, Y.H.; Wu, B.; Guo, C.Y.; Gu, Q.B. Spatial Distribution, Risk Assessment, Source Apportionment and Stabilization Performance of Potentially Toxic Elements in Sediments of Dongdagou River, Northwest China. Water Air Soil Pollut. 2024, 235, 352. [Google Scholar] [CrossRef]
- Shi, L.Y.; Ma, Z.B.; Zhang, D.E.; Xue, S.G.; He, X.S.; Huo, K.; Wang, G.H.; Yi, J. Pollution evaluation and source analysis of heavy metals in copper smelting site in Yellow River Basin. Chin. J. Nonferrous Met. 2023, 33, 3462–3475. [Google Scholar] [CrossRef]
- Guo, W.; Zhang, H.; Wang, M.; Yin, X.; Wang, Z. Arsenic Removal from Contaminated Soil Inside Non-Ferrous Metal Smelter by Washing. Soil Sediment Contam. 2020, 29, 151–164. [Google Scholar] [CrossRef]
- Tang, X.X. Study on the Interaction of Cadmium, Zinc, and Selenium in Soil of Typical High Cadmium Geological Background Areas in Guangxi. Master’s Thesis, Chongqing Three Gorges University, Chongqing, China, 2024. [Google Scholar] [CrossRef]
- Hou, X.J.; Zhang, Y.L.; Liu, X.; Zhou, C.S.; Dang, X.J.; Hu, J.N. An evaluation and analysis method of heavy metal pollution in soil of agricultural land around mining areas based on double index method. Int. J. Environ. Pollut. 2024, 74, 35–49. [Google Scholar] [CrossRef]
- Li, W.X.; Zhang, X.X.; Wu, B.; Sun, S.L.; Chen, Y.S.; Pan, W.Y.; Zhao, D.Y.; Cheng, S.P. A comparative analysis of environmental quality assessment methods for heavy metal-contaminated soils. Pedosphere 2008, 18, 344–352. [Google Scholar] [CrossRef]
- Wei, J.; Zheng, X.; Liu, J. Modeling Analysis of Heavy Metal Evaluation in Complex Geological Soil Based on Nemerow Index Method. Metals 2023, 13, 439. [Google Scholar] [CrossRef]
- Wang, Y.; Sun, W.; Zhao, Y.L.; He, P.Y.; Wang, L.D.; Nguyen, L.T.T. Assessment of Heavy Metal Pollution Characteristics andEcological Risk in Soils around a Rare Earth Mine in Gannan. Sci. Program. 2022, 2022, 5873919. [Google Scholar] [CrossRef]
- Yang, Y.L.; Zhang, D.W.; Quan, J.; Wang, P.W.; Xu, Y. Water quality assessment of Middle Route of South-North Water Diversion Project based on modified Nemerow index method. Water Supply 2021, 21, 1005–1015. [Google Scholar] [CrossRef]
- Odewande, A.A.; Abimbola, A.F. Contamination indices and heavy metal concentrations in urban soil of Ibadan metropolis, southwestern Nigeria. Environ. Geochem. Health 2008, 30, 243–254. [Google Scholar] [CrossRef]
- Mookan, V.P.; Machakalai, R.K.; Srinivasan, S.; Sigamani, S.; Kolandhasamy, P.; Gnanamoorthy, P.; Moovendhan, M.; Srinivasan, R.; Hatamleh, A.A.; Ai-Dosary, M.A. Assessment of metal contaminants along the Bay of Bengal-Multivariate pollution indices. Mar. Pollut. Bull. 2023, 192, 115008. [Google Scholar] [CrossRef]
- Paatero, P.; Tapper, U. POSITIVE MATRIX FACTORIZATION—A Nonnegative Factor Model with Optimal Utilization of Error-Estimates of Date Values. Environmetrics 1994, 5, 111–126. [Google Scholar] [CrossRef]
- Deng, J.Y.; Yu, D.; Wu, H.; Du, J.Y.; Pu, S.Y. Soil contamination characteristics and source analysis of a copper smelting site in Guangxi. Acta Sci. Circumstantiae 2023, 43, 290–299. [Google Scholar] [CrossRef]
- Shao, H.Q.; Zhang, Y.W.; Qu, C.; Li, W.H.; Zhao, Y.J.; Liu, N.; Cai, H.M.; Wu, C.D.; Liu, J.M. Analysis of heavy metal contamination in the soil and enrichment capabilities ofterrestrial plants around a typical vanadium smelter area. Chin. J. Eng. 2020, 42, 302–312. [Google Scholar] [CrossRef]
- Zhao, J.; Gao, Y.; Wang, Y.; Zhao, Y.J. The effect of different afforestation tree species on plant diversity after 50 years on Mount Tai, China. Appl. Ecol. Environ. Res. 2022, 19, 4515–4526. [Google Scholar] [CrossRef]
- Pan, X.; Zhang, S.; Zhong, Q.; Gong, G.; Wang, G.; Guo, X.; Xu, X. Effects of soil chemical properties and fractions of Pb, Cd, and Zn on bacterial and fungal communities. Sci. Total Environ. 2020, 715, 136904. [Google Scholar] [CrossRef]
- Větrovsky, T.; Baldrian, P. An in-depth analysis of actinobacterial communities shows their high diversity in grassland soils along a gradient of mixed heavy metal contamination. Biol. Fertil. Soils 2015, 51, 827–837. [Google Scholar] [CrossRef]
- Ausuri, J.; Dell’Anno, F.; Vitale, G.A.; Esposito, F.P.; Funari, V.; Franci, G.; Galdiero, M.; Della Sala, G.; Tedesco, P.; Coppola, D.; et al. Bioremediation of Multiple Heavy Metals Mediated by Antarctic Marine Isolated Dietzia psychralcaliphila JI1D. J. Mar. Sci. Eng. 2022, 10, 1669. [Google Scholar] [CrossRef]
- Bofill, R.; Orihuela, R.; Romagosa, M.; Domenech, J.; Atrian, S.; Capdevila, M. Caenorhabditis elegans metallothionein isoform specificity—Metal binding abilities and the role of histidine in CeMT1 and CeMT2. FEBS J. 2009, 276, 7040–7069. [Google Scholar] [CrossRef] [PubMed]
- Ortuzar, M.; Trujillo, M.E.; Román-Ponce, B.; Carro, L. Micromonospora metallophores: A plant growth promotion trait useful for bacterial-assisted phytoremediation? Sci. Total Environ. 2020, 739, 139850. [Google Scholar] [CrossRef]


| Single Factor Pollution Index | Level | Nemerow Comprehensive Pollution Index | Level |
|---|---|---|---|
| ≤ 1 | Class I, without pollution | ≤ 0.7 | Class I, no pollution |
| ∈ (1, 2] | Class II, slight pollution | ∈ (0.7, 1.0] | Class II, slight pollution |
| ∈ (2, 3] | Class III, mild pollution | ∈ (1.0, 2.0] | Class III, mild pollution |
| ∈ (3, 5] | Class IV, moderate pollution | ∈ (2.0, 3.0] | Class IV, moderate pollution |
| > 5 | Class V, severe pollution | > 3.0 | Class V, severe pollution |
| Igeo | ≤ 0 | < 1 | 1 < 2 | 2 < 3 | 3 < 4 | 4 < 5 | 5 < 10 |
|---|---|---|---|---|---|---|---|
| Level | Without accumulation | Mild to moderate accumulation | Moderate accumulation | Medium to strong accumulation | Strong accumulation | Strong to extremely severe accumulation | Extremely severe accumulation |
| Species | Category | |||
|---|---|---|---|---|
| Co | Weak | |||
| Cu | Weak | |||
| Zn | Weak | |||
| Pb | Weak | |||
| Ni | Weak | |||
| Cr | Weak | |||
| As | Weak | |||
| Cd | Weak | |||
| Number of base runs: | 20 | |||
| Base user-selected seed: | 48 | |||
| Number of factors: | 3 | |||
| Extra modeling uncertainty (%): | 20 | |||
| Factor 1 | Factor 2 | Factor 3 | Unmapped | |
| Boot Factor 1 | 200 | 0 | 0 | 0 |
| Boot Factor 2 | 1 | 199 | 0 | 0 |
| Boot Factor 3 | 8 | 14 | 178 | 0 |
| PTE | Minimum (mg/kg) | Maximum (mg/kg) | Average (mg/kg) | Standard Deviation (mg/kg) | Coefficient of Variation | Screening Value (mg/kg) | Background Concentration |
|---|---|---|---|---|---|---|---|
| Cd | 5.6 | 432.7 | 143.1 | 147.9 | 1.03 | 20.0 | 0.27 |
| Co | 12.4 | 93.3 | 47.6 | 31.6 | 0.66 | 20.0 | 10.40 |
| As | 21.5 | 425.2 | 110.2 | 157.2 | 1.42 | 20.0 | 20.50 |
| Cr | 80.6 | 92.5 | 82.8 | 6.5 | 0.07 | 90.0 | 82.10 |
| Ni | 32.5 | 38.6 | 30.3 | 4.4 | 0.14 | 150.0 | 26.60 |
| Pb | 5.1 | 728.8 | 264.3 | 274.2 | 1.04 | 400.0 | 24.00 |
| Zn | 130.9 | 318.6 | 187.9 | 72.6 | 0.39 | 500.0 | 75.60 |
| Cu | 32.5 | 286.9 | 83.5 | 104.0 | 1.24 | 2000.0 | 27.80 |
| PTE | Single Factor Pollution Index Range | Average Value of Single Factor Pollution Index | Pollution Index | Comprehensive Pollution Index | Pollution Level |
|---|---|---|---|---|---|
| Cd | 0.279~21.635 | 7.154 | Severe pollution | 10.42 | Severe pollution |
| Co | 0.618~4.484 | 2.378 | Slightly pollution | ||
| As | 0.074~21.261 | 5.312 | Severe pollution | ||
| Cr | 0.228~0.805 | 0.625 | Without pollution | ||
| Ni | 0.083~0.257 | 0.166 | Without pollution | ||
| Pb | 0.013~1.820 | 0.660 | Without pollution | ||
| Zn | 0.261~0.637 | 0.375 | Without pollution | ||
| Cu | 0.001~0.143 | 0.038 | Without pollution |
| PTE | Index of Geoaccumulation | Pollution Level |
|---|---|---|
| Cu | 0.895 | Mild to moderate accumulation |
| Zn | 0.729 | Mild to moderate accumulation |
| Pb | 2.876 | Medium to strong accumulation |
| Ni | −0.675 | Without accumulation |
| Cr | −1.526 | Without accumulation |
| As | 1.789 | Moderate accumulation |
| Co | 1.608 | Moderate accumulation |
| Cd | 8.481 | Extremely severe accumulation |
| Pearson | Cu | Zn | Pb | Ni | Cr | As | Co | Cd |
|---|---|---|---|---|---|---|---|---|
| Cu | 1.000 | |||||||
| Zn | −0.322 | 1.000 | ||||||
| Pb | 0.776 | 0.347 | 1.000 | |||||
| Ni | 0.776 | 0.347 | 1.00 ** | 1.000 | ||||
| Cr | 0.405 | 0.726 | 0.884 * | 0.884 * | 1.000 | |||
| As | 0.681 | 0.473 | 0.990 ** | 0.990 * | 0.942 * | 1.000 | ||
| Co | 0.643 | 0.516 | 0.981 ** | 0.981 * | 0.959 * | 0.999 ** | 1.000 | |
| Cd | 0.587 | 0.574 | 0.964 ** | 0.964 * | 0.977 ** | 0.992 ** | 0.997 ** | 1.000 |
| PTE | Component 1 | Component 2 | Component 3 |
|---|---|---|---|
| Zn | −0.402 | 0.124 | −0.860 |
| Pb | −0.841 | −0.005 | 0.464 |
| Cr | −0.245 | 0.360 | 0.842 |
| Co | 0.632 | 0.739 | 0.181 |
| Cd | 0.570 | −0.811 | 0.103 |
| Cu | 0.767 | 0.400 | −0.081 |
| Ni | 0.899 | 0.172 | 0.054 |
| As | 0.374 | −0.890 | 0.249 |
| Sample Number | Chao1 | Shannon | ACE | Simpson | Shannoneven | Coverage |
|---|---|---|---|---|---|---|
| 1 | 746.69 | 4.26 | 750.33 | 0.05 | 0.65 | 1.00 |
| 2 | 998.07 | 4.62 | 986.71 | 0.03 | 0.78 | 1.00 |
| 3 | 965.35 | 4.81 | 965.30 | 0.03 | 0.70 | 1.00 |
| 4 | 872.17 | 4.66 | 861.87 | 0.03 | 0.69 | 1.00 |
| 5 | 1094.20 | 4.72 | 1088.85 | 0.04 | 0.69 | 1.00 |
Disclaimer/Publisher’s Note: The statements, opinions and data contained in all publications are solely those of the individual author(s) and contributor(s) and not of MDPI and/or the editor(s). MDPI and/or the editor(s) disclaim responsibility for any injury to people or property resulting from any ideas, methods, instructions or products referred to in the content. |
© 2025 by the authors. Licensee MDPI, Basel, Switzerland. This article is an open access article distributed under the terms and conditions of the Creative Commons Attribution (CC BY) license (https://creativecommons.org/licenses/by/4.0/).
Share and Cite
Sun, Y.; Yang, Z.; Dong, K.; Hui, F.; Wang, D.; Huang, Y. Pollution Risk Assessment of Potentially Toxic Elements in Soils Using Characterization and Microbiological Analysis: The Case of a Rare and Precious Metal Mining Site in Wuzhou, Guangxi. Toxics 2025, 13, 270. https://doi.org/10.3390/toxics13040270
Sun Y, Yang Z, Dong K, Hui F, Wang D, Huang Y. Pollution Risk Assessment of Potentially Toxic Elements in Soils Using Characterization and Microbiological Analysis: The Case of a Rare and Precious Metal Mining Site in Wuzhou, Guangxi. Toxics. 2025; 13(4):270. https://doi.org/10.3390/toxics13040270
Chicago/Turabian StyleSun, Yi, Zixuan Yang, Kun Dong, Fujiang Hui, Dunqiu Wang, and Yecheng Huang. 2025. "Pollution Risk Assessment of Potentially Toxic Elements in Soils Using Characterization and Microbiological Analysis: The Case of a Rare and Precious Metal Mining Site in Wuzhou, Guangxi" Toxics 13, no. 4: 270. https://doi.org/10.3390/toxics13040270
APA StyleSun, Y., Yang, Z., Dong, K., Hui, F., Wang, D., & Huang, Y. (2025). Pollution Risk Assessment of Potentially Toxic Elements in Soils Using Characterization and Microbiological Analysis: The Case of a Rare and Precious Metal Mining Site in Wuzhou, Guangxi. Toxics, 13(4), 270. https://doi.org/10.3390/toxics13040270