
Atmospheric Heavy Metal Pollution Characteristics and Health Risk Assessment Across Various Type of Cities in China

 ,
,  ,
, 
Abstract

1. Introduction
2. Materials and Methods
2.1. Data Sources and Processing
2.2. Methodology for Classifying Urban Typologies
2.3. Health Risk Assessment
3. Results and Discussion
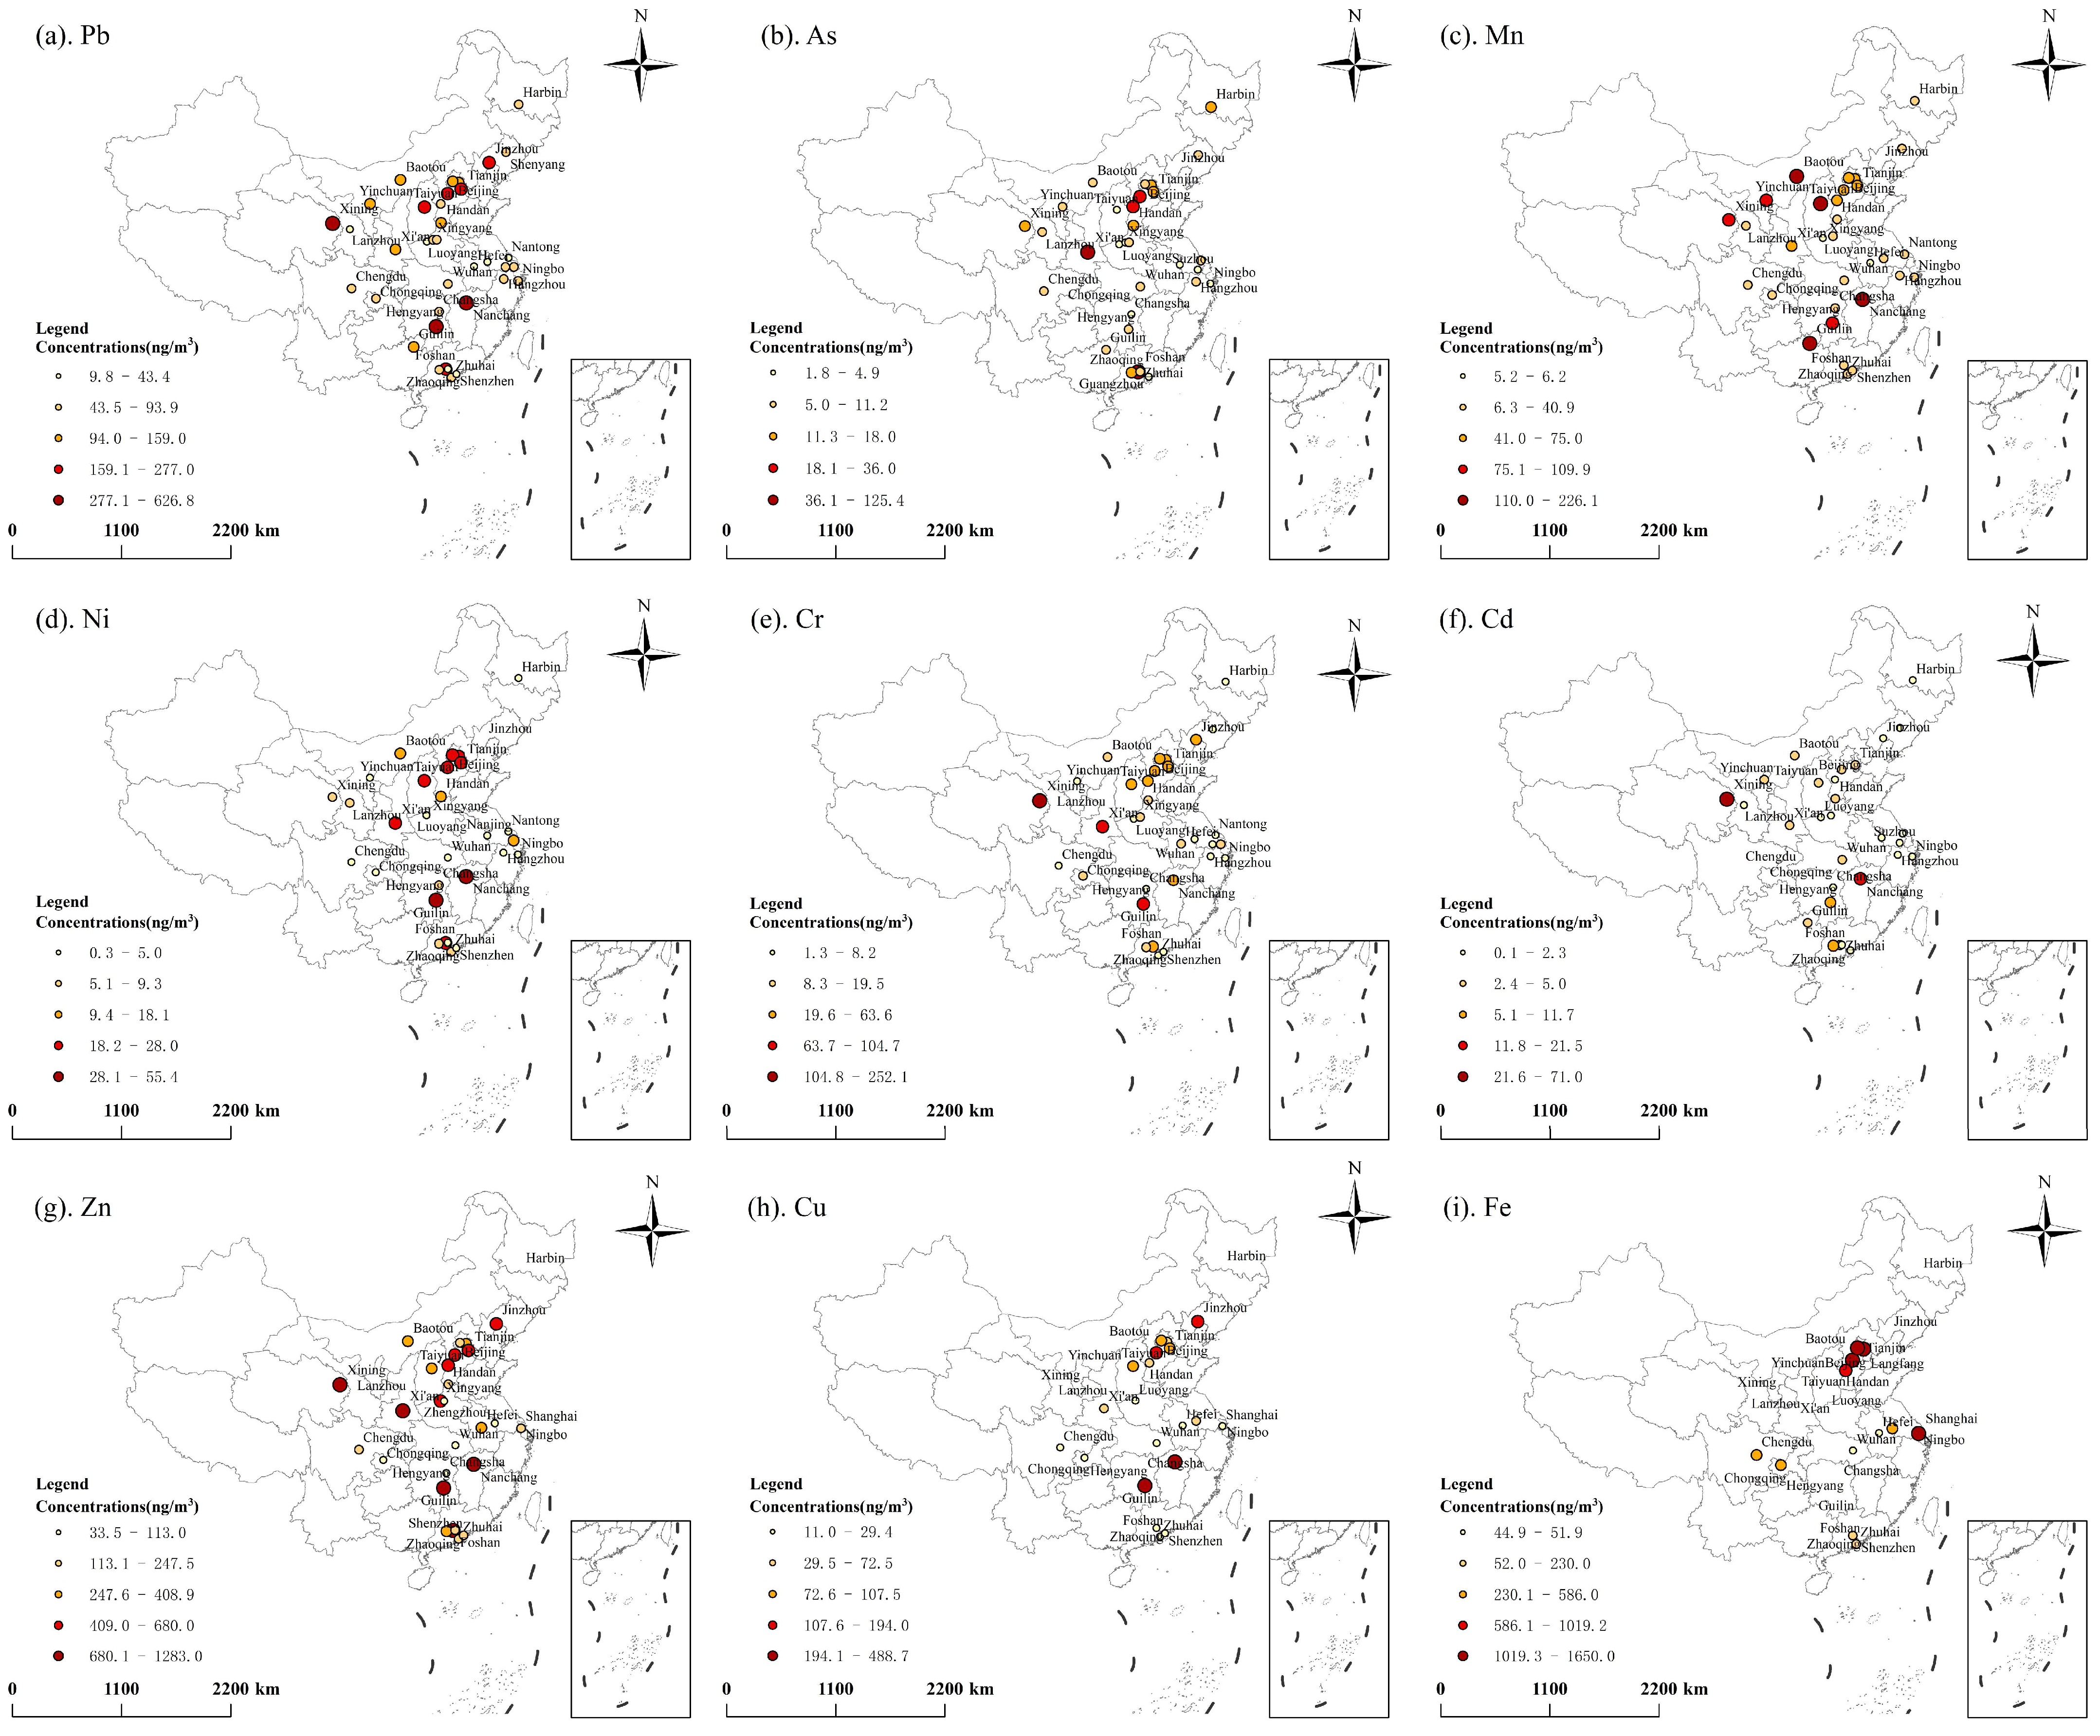
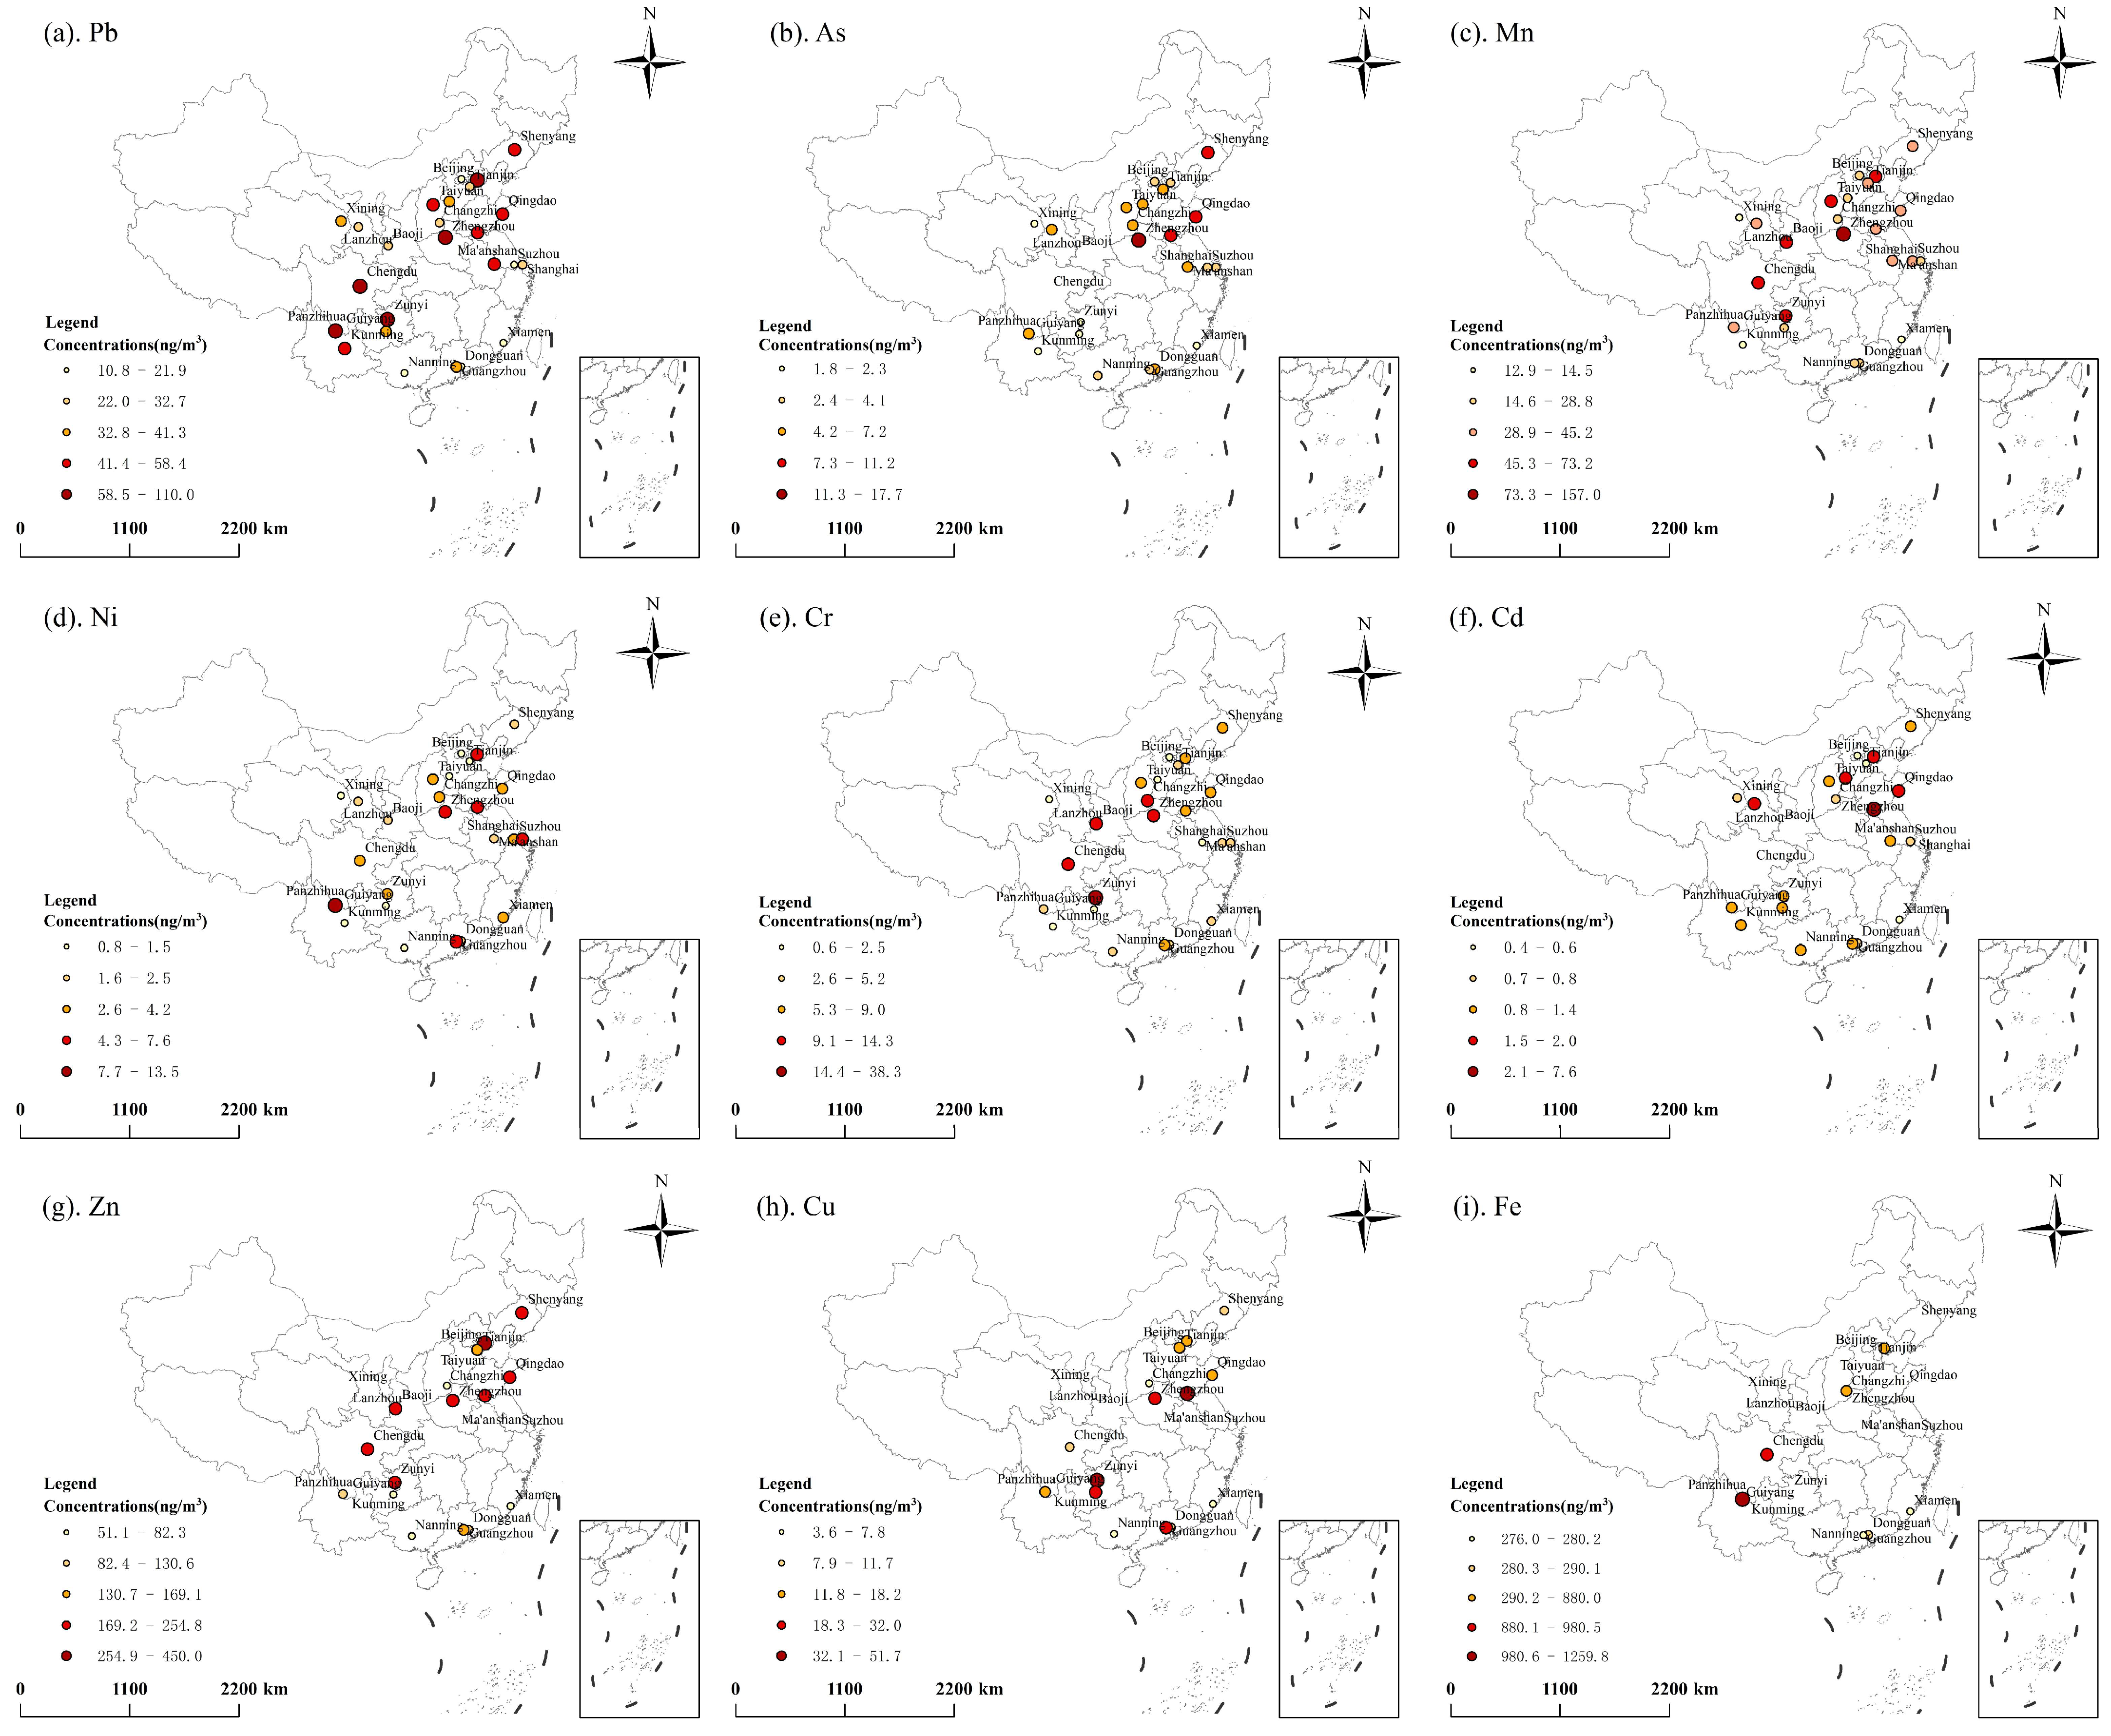
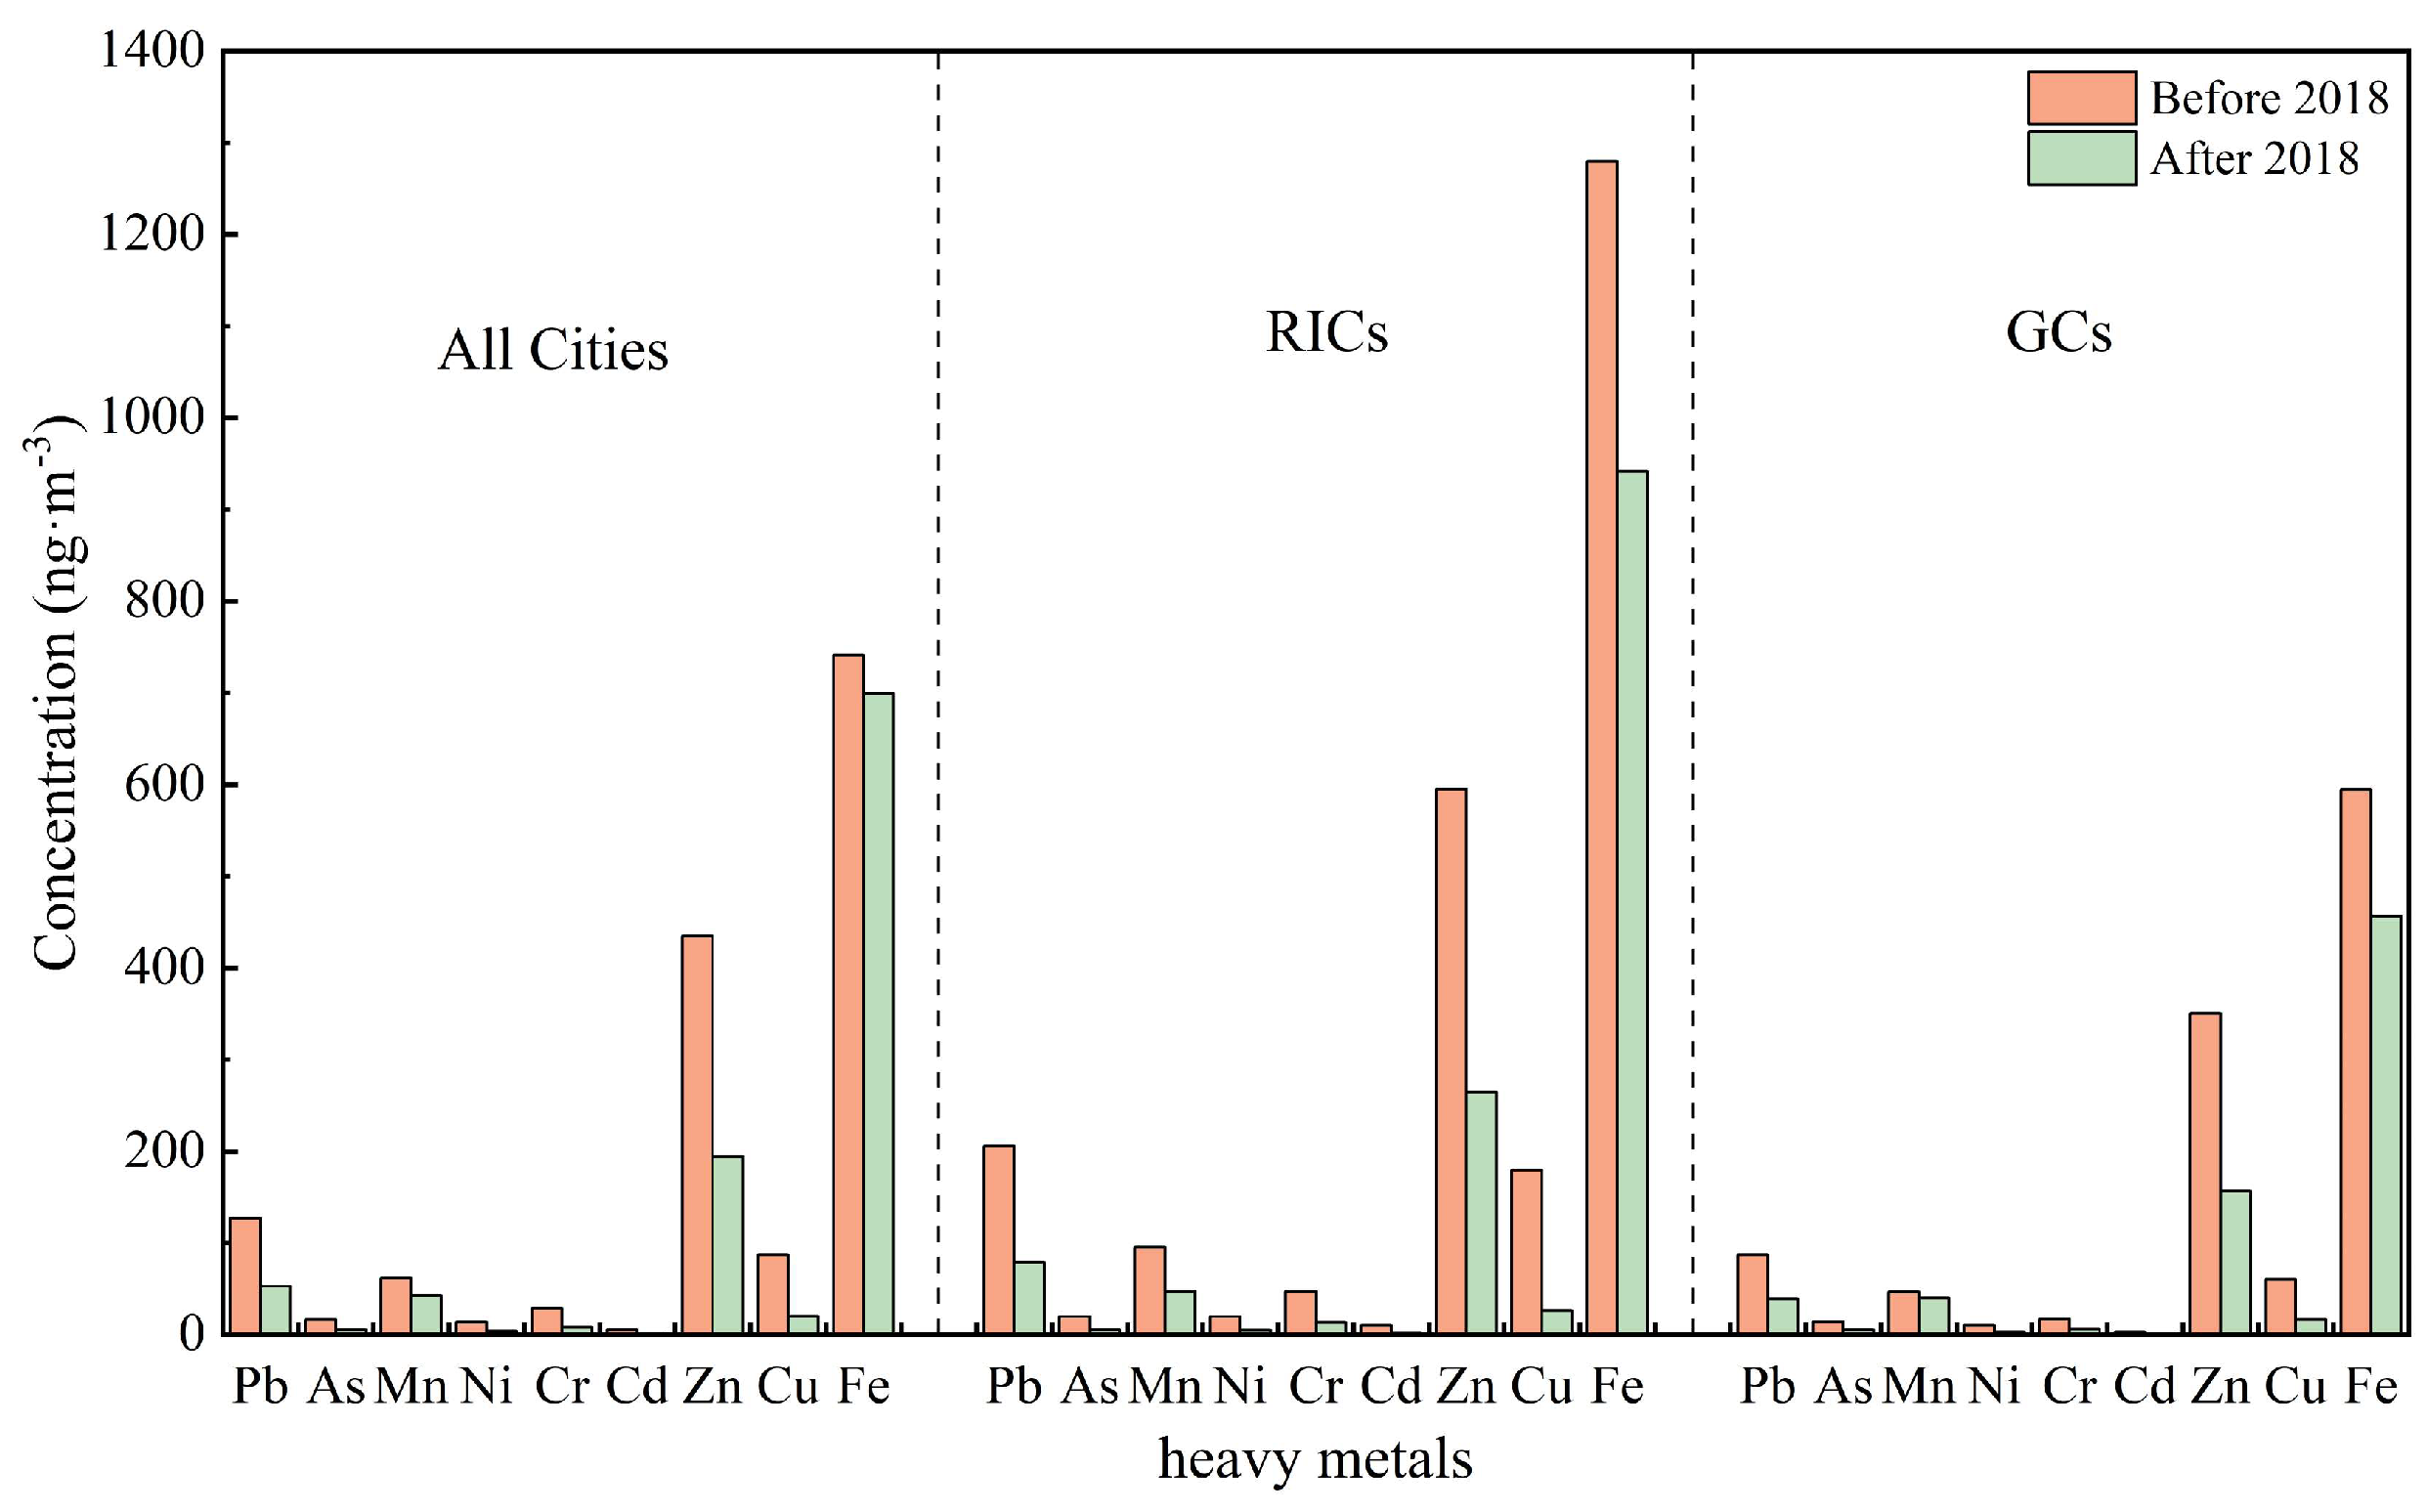
3.1. Changes in PM2.5 and Heavy Metal Concentrations Before and After 2018
3.2. Comparison of PM2.5 and Heavy Metal Concentrations Between RICs and GCs Before and After 2018
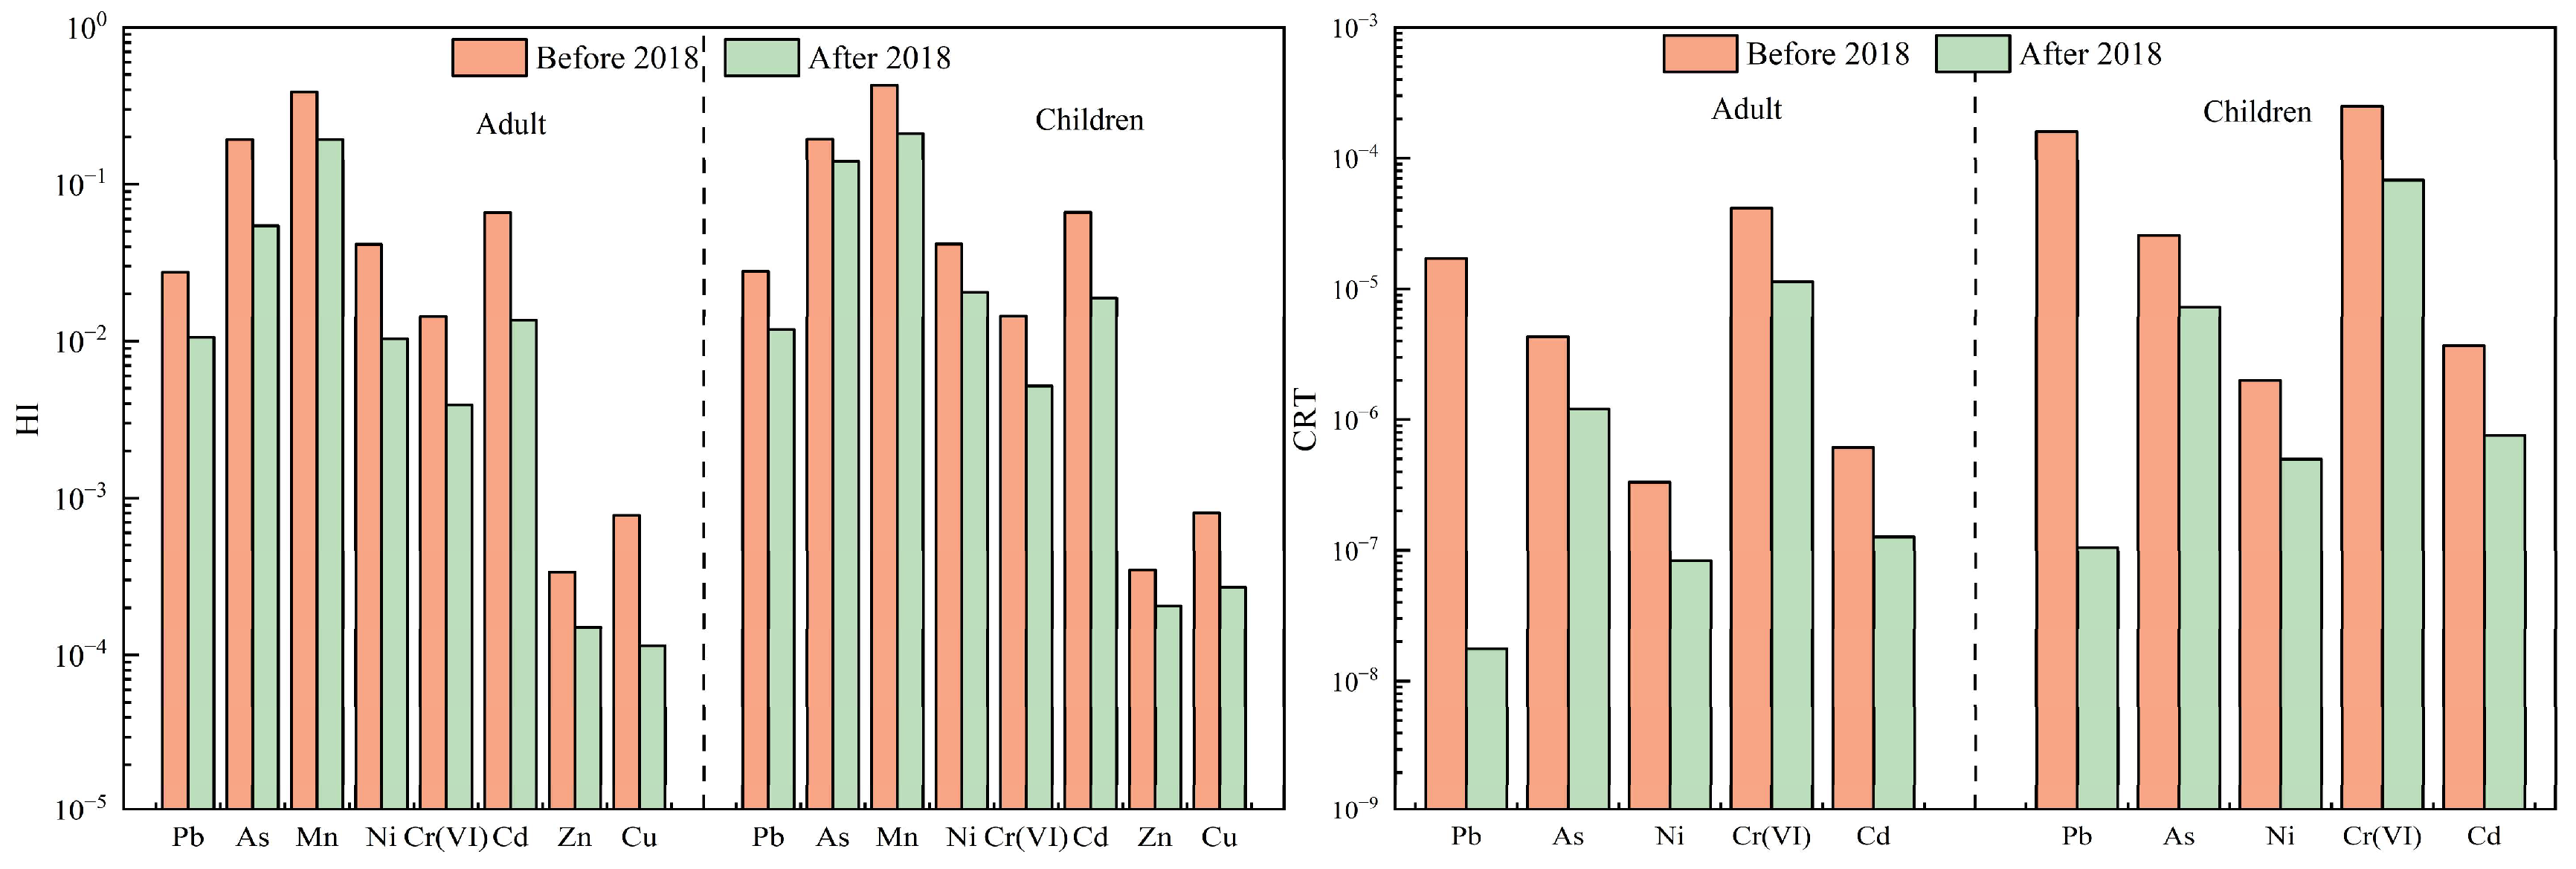
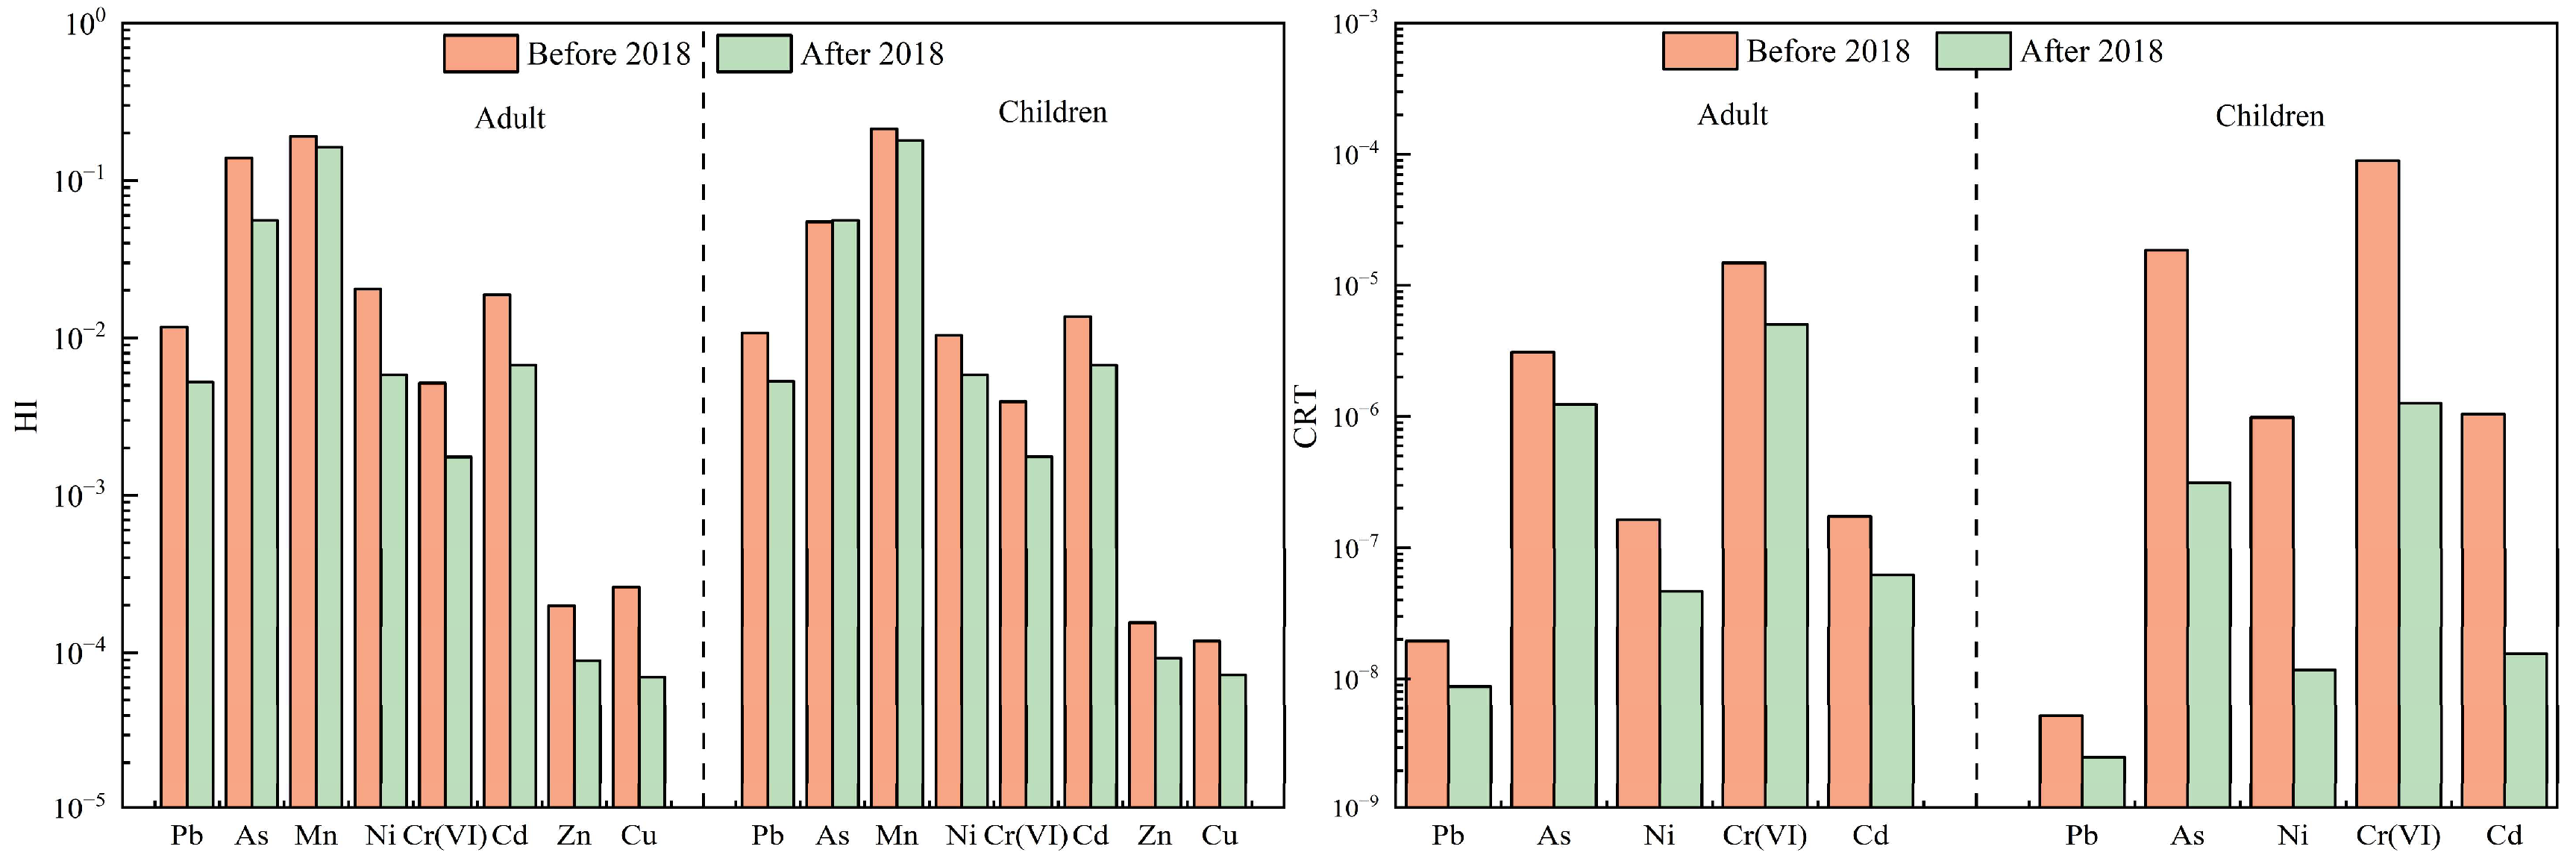
3.3. Comparison of Variation in Human Health Risk Assessments for Heavy Metals
4. Conclusions
Author Contributions
Funding
Institutional Review Board Statement
Informed Consent Statement
Data Availability Statement
Conflicts of Interest
Appendix A

| Year Range | City | Type of City | PM2.5 | Pb | As | Mn | Ni | Cr | Cd | Zn | Cu | Fe | Data Source |
|---|---|---|---|---|---|---|---|---|---|---|---|---|---|
| 2014–2018 | Hengyang | RICs | 111,180 | 456.9 | 8.4 | 109.9 | 55.4 | 104.7 | 11.7 | 898.8 | 488.7 | - | [46] |
| Baotou | 53,400 | 143.8 | 8.5 | 211.4 | 16.6 | 19.5 | 2.5 | 280.9 | - | - | [47] | ||
| Handan | 91,180 | 115 | 13.5 | 28.3 | 18.1 | 12.6 | 4.9 | 187.8 | - | - | [48] | ||
| Suzhou | 66,200 | 76.2 | 4.1 | - | - | 6.9 | 1.5 | - | - | - | [49] | ||
| Ningbo | 84,000 | 61.9 | 4.9 | 36.8 | 4.1 | 3.4 | 1.5 | - | - | - | [34] | ||
| Foshan | 47,000 | 277 | 91.6 | - | 28 | 36 | 4.4 | 1283 | - | - | [47] | ||
| Zhaoqing | 39,375 | 93.9 | 17.6 | - | 8.8 | 10.2 | 10.2 | 408.9 | - | - | [47] | ||
| Baodinng | 180,000 | 235 | 30 | 55 | 27.5 | 32.5 | 5 | 622.5 | 194 | 1340 | [50] | ||
| Taiyuan | 97,300 | 241.3 | 1.8 | 171.9 | 25.3 | 63.6 | 2.8 | 338.2 | 83.1 | - | [51] | ||
| Xining | 49,688 | 626.8 | 18 | 97.7 | 9.3 | 252.1 | 70.9 | 958.9 | - | [47] | |||
| Shijiazhuang | 99,475 | 84.3 | 35.9 | 71.4 | - | 31.4 | 1.9 | 634.7 | 60.5 | 1019.2 | [52] | ||
| Yinchuan | 75,000 | 124.1 | 9.2 | 96.1 | 1.2 | 2.9 | 3.3 | - | - | - | [53] | ||
| Langfang | 133,000 | 140 | 12.5 | 75 | 25 | 40 | - | 337.5 | 72.5 | 1480 | [54] | ||
| Luoyang | GCs | 72,236 | 9.8 | 3.1 | 6.2 | 0.3 | 1.3 | 0.1 | - | 11 | - | [55] | |
| Xingyang | 78,310 | 60 | 4.5 | - | - | 10 | - | 510 | - | - | [56] | ||
| Jinzhou | 41,250 | 225.5 | - | - | - | 49 | 0.7 | 679.8 | 158.5 | - | [57] | ||
| Guangzhou | 37,000 | 40 | 8.6 | 25 | 3.2 | - | 1.4 | 190 | 22 | 230 | [7] | ||
| Zhuhai | 45,000 | 59 | - | 28 | 7 | 6 | - | 149 | 20 | 212 | [58] | ||
| Shenzhen | 39,100 | 25.6 | 4.9 | 19.5 | 4.2 | 2.3 | 0.8 | 163.3 | 29.4 | - | [59] | ||
| Hangzhou | 92,000 | 78.8 | 8.1 | 34 | 2.5 | 3.1 | 1.9 | - | - | - | [34] | ||
| Guilin | 66,000 | 102 | 11.2 | 173 | - | - | 4.9 | - | - | - | [60] | ||
| Xi’an | 50,600 | 159 | 125.4 | 61.5 | 21.5 | 100.9 | 3.3 | 1264.8 | 43.4 | - | [61] | ||
| Nanchang | 29,740 | 468.7 | - | 226.1 | 51.2 | 32 | 21.5 | 1141.1 | 343.4 | - | [62] | ||
| Beijing | 126,000 | 120 | 10 | 55 | 25 | 32.5 | - | 247.5 | 107.5 | 1650 | [34] | ||
| Tianjin | 133,000 | 190 | 13.3 | 60 | 23.3 | 36.7 | 3.3 | 680 | 100 | - | [34] | ||
| Shanghai | 94,600 | 69.7 | - | - | 14.9 | 16.9 | - | 215 | 24.2 | 1340 | [63] | ||
| Chongqing | 60,695 | 50.4 | - | 37.7 | 4.2 | 11.1 | - | 113 | 11.3 | 586 | [1] | ||
| Shenyang | 76,225 | 62.3 | 10.5 | 28.3 | - | 8.2 | 1.3 | - | - | - | [64] | ||
| Harbin | 93,250 | 57.3 | 14.7 | 25.4 | 2.8 | 3.8 | 0.9 | - | - | - | [65] | ||
| Nanjing | 39,250 | 23.5 | 2 | 20.8 | 4.9 | 6.7 | 1 | 99 | 50.9 | 455.2 | [66] | ||
| Zhengzhou | 165,200 | 57.7 | 8.2 | 40.9 | - | - | 2.2 | 72.7 | - | - | [67] | ||
| Changsha | 46,900 | 55.8 | 3.8 | 18.8 | 7.6 | 5.5 | 0.5 | 33.5 | - | - | [46] | ||
| Chengdu | 64,184 | 55.4 | 10.8 | 33.8 | 2.1 | 5.6 | - | 238 | 18.7 | 456 | [1] | ||
| Nantong | 58,400 | 28.3 | 6.7 | 40.6 | 4.7 | 2.5 | 1 | - | - | - | [68] | ||
| Hefei | 81,000 | 12.6 | - | 5.2 | - | 10 | - | 273.5 | 11.3 | 44.9 | [26] | ||
| Lanzhou | 50,699 | 43.4 | 8.4 | 40.5 | 6.6 | - | 2.3 | - | - | - | [69] | ||
| Wuhan | 57,027 | 90.9 | 8.2 | 25.9 | 3.73 | - | 3 | 67.7 | 15.5 | 51.9 | [45] | ||
| Avg. ± std | RICs | 86,676.8 ± 39,372.6 | 205.9 ± 167.2 | 19.7 ± 23.8 | 95.3 ± 57.8 | 19.9 ± 15.1 | 47.4 ± 67.7 | 10.1 ± 19.5 | 595.1 ± 354.6 | 179.8 ± 180.8 | 1279.7 ± 236.2 | ||
| GCs | 71,155.2 ± 33,133.5 | 87.6 ± 93.3 | 14.2 ± 27.1 | 46.9 ± 50.9 | 9.8 ± 12.2 | 17.0 ± 23.3 | 2.9 ± 4.8 | 350.2 ± 353.5 | 60.5 ± 83.7 | 594.4 ± 544.2 | |||
| All Cities | 76,329.1 ± 35,591.3 | 127.0 ± 133.2 | 16.4 ± 25.0 | 61.6 ± 56.8 | 13.4 ± 14.0 | 28.6 ± 47.1 | 5.7 ± 13.0 | 434.7 ± 367.1 | 87.6 ± 119.1 | 741.2 ± 567.0 | |||
| 2019–2021 | Tangshan | RICs | 97,500 | 110 | 4.1 | 60 | 5.3 | 8.6 | 1.9 | 450 | 17.7 | 880 | [70] |
| Zaozhuang | 91,000 | 46.4 | 9.4 | 45.2 | 6.8 | 6.5 | 7.6 | 215 | 51.7 | - | [71] | ||
| Panzhihua | 33,000 | 82.4 | 7.2 | 34.8 | 13.5 | 5.1 | 1.2 | 130.6 | 18 | 1259.8 | [72] | ||
| Zunyi | 47,600 | 78.5 | 2.1 | 64.4 | 2.9 | 38.3 | 1.2 | 213.3 | 49.5 | - | [73] | ||
| Taiyuan | 87,130 | 57.6 | 5.4 | 51.7 | 3.1 | 6.9 | 1 | - | - | - | [74] | ||
| Xining | 34,331 | 36 | 2.1 | 12.9 | 1 | 1.6 | 0.7 | - | - | - | [75] | ||
| Caofeidian | 89,680 | 230.4 | 9.3 | 107.8 | 7.1 | 32.7 | 2.8 | 495.4 | 14.7 | 762.3 | [76] | ||
| Changzhi | 56,100 | 30.8 | 4.9 | 21.5 | 4.2 | 14.3 | 0.7 | 82.3 | 7.8 | 864.5 | [22] | ||
| Shijiazhuang | 98,130 | 41.3 | 5.4 | 28.8 | 1.1 | 2.5 | 1.6 | - | - | - | [77] | ||
| Maanshan | GCs | 51,750 | 50.1 | 6.2 | 35.3 | 1.8 | 1.7 | 1.4 | - | - | - | [78] | |
| Baoji | 51,500 | 27.5 | - | 73.2 | 2.5 | 13.4 | - | 234.8 | - | - | [79] | ||
| Dongguan | 35,800 | 17.9 | 4.7 | 19 | 1.9 | 4.6 | 0.7 | 109.8 | 11.7 | 290.1 | [80] | ||
| Guangzhou | 40,300 | 37 | 3.1 | 20 | 5.8 | 9 | 1.1 | 161 | 32 | 276 | [81] | ||
| Suzhou | 46,760 | 21.9 | 3.5 | 30.5 | 3.2 | 4.6 | 0.7 | - | - | - | [82] | ||
| Beijing | 48,000 | 21.7 | 2.8 | 21.1 | 0.9 | 0.6 | 0.5 | - | - | - | [83] | ||
| Tianjin | 59,000 | 27.1 | 6.9 | 34.3 | 1.5 | 3.3 | 0.6 | 169.1 | 18.2 | [83] | |||
| Shanghai | 40,610 | 32.7 | 3.3 | 22.3 | 5 | 5.2 | - | - | - | - | [84] | ||
| Shenyang | 85,100 | 58.4 | 11.2 | 36.1 | 2.1 | 6.6 | 1 | 206.4 | 9.4 | [85] | |||
| Zhengzhou | 52,000 | 100 | 17.7 | 157 | 7.6 | 11.7 | - | 209.8 | 29.2 | - | [86] | ||
| Chengdu | 115,300 | 73.7 | - | 60 | 3.8 | 11.1 | - | 254.8 | 11 | 980.5 | [39] | ||
| Kunming | 26,670 | 48.9 | 1.8 | 13.4 | 0.8 | 1.9 | 1.1 | - | - | [87] | |||
| Guiyang | 26,750 | 37.8 | 2.1 | 19.1 | 0.8 | 1.8 | 1.1 | 51.1 | 25.1 | - | [88] | ||
| Qingdao | 85,500 | 52 | 10.8 | 42 | 3 | 8 | 1.8 | 211.1 | 14.6 | - | [44] | ||
| Nanning | 34,000 | 19.8 | 3.2 | - | 1.3 | 3.7 | 1 | 64.2 | 3.6 | - | [89] | ||
| Lanzhou | 34,514 | 27.9 | 5.5 | 41.7 | 2 | - | 2 | - | - | - | [68] | ||
| Xiamen | 21,620 | 10.8 | 2.3 | 14.5 | 3.6 | 5.1 | 0.4 | 53.4 | 7.3 | 280.2 | [40] | ||
| Avg. ± std | RICs | 70,496.8 ± 27,393.7 | 79.3 ± 62.3 | 5.5 ± 2.7 | 47.5 ± 28.5 | 5.0 ± 3.9 | 12.9 ± 13.4 | 2.1 ± 2.2 | 264.4 ± 169.7 | 26.6 ± 19 | 941.7 ± 218.4 | ||
| decline range | 18.7% | 61.5% | 72.1% | 50.2% | 74.9% | 72.8% | 79.2% | 55.6% | 85.2% | 26.4% | |||
| Avg. ± std | GCs | 50,304.4 ± 24,532.6 | 39.1 ± 22.8 | 5.7 ± 4.4 | 39.9 ± 35.3 | 2.8 ± 1.0 | 5.8 ± 3.9 | 1.0 ± 0.5 | 156.9 ± 75.3 | 16.2 ± 9.6 | 456.7 ± 349.3 | ||
| decline range | 29.4% | 55.4% | 59.9% | 14.9% | 71.4% | 65.9% | 65.5% | 55.2% | 73.2% | 23.2% | |||
| Avg. ± std | All Cities | 57,294 ± 26,856.8 | 53 ± 44.2 | 5.6 ± 3.8 | 42.7 ± 32.6 | 3.6 ± 2.9 | 8.4 ± 9.0 | 1.5 ± 1.5 | 194.8 ± 123.9 | 20.1 ± 14.2 | 699.2 ± 374.1 | ||
| decline range | 24.9% | 58.3% | 65.9% | 30.7% | 73.1% | 70.6% | 73.7% | 55.2% | 77.1% | 5.7% | |||
References
- Wang, H.; Qiao, B.; Zhang, L.; Yang, F.; Jiang, X. Characteristics and sources of trace elements in PM2.5 in two megacities in Sichuan Basin of southwest China. Environ. Pollut. 2018, 242, 1577–1586. [Google Scholar] [CrossRef] [PubMed]
- Wu, L.; Luo, X.; Li, H.; Long, C.; Tang, M. Seasonal Levels, Sources, and Health Risks of Heavy Metals in Atmospheric PM2.5 from Four Functional Areas of Nanjing City, Eastern China. Atmosphere 2019, 10, 419. [Google Scholar] [CrossRef]
- Wang, P.; Huang, W.; Ren, F. Pollution evaluation and source identification of heavy metals in soil around steel factories located in Lanshan District, Rizhao City, eastern China. Environ. Monit. Assess. 2023, 195, 657. [Google Scholar] [CrossRef] [PubMed]
- World Health Organization (WHO). Health Effects of Particulate Matter: Policy Implications for Countries in Eastern Europe, Caucasus and Central Asia; WHO Regional Office for Europe: Copenhagen, Denmark, 2013; p. 20. Available online: https://iris.who.int/handle/10665/344854 (accessed on 3 June 2024).
- Zhou, X.; Strezov, V.; Jiang, Y.; Yang, X.; He, Y.; Evans, T. Life Cycle Impact Assessment of Airborne Metal Pollution near Selected Iron and Steelmaking Industrial Areas in China. Aerosol Air Qual. Res. 2019, 20, 1582–1590. [Google Scholar] [CrossRef]
- Lyu, T.; Tang, Y.; Cao, H.; Gao, Y.; Zhou, Y.; Zhang, W.; Zhang, R.; Jiang, Y. Estimating the geographical patterns and health risks associated with PM2.5-bound heavy metals to guide PM2.5 control targets in China based on machine-learning algorithms. Environ. Pollut. 2023, 337, 122558. [Google Scholar] [CrossRef]
- Guo, L.; Lv, Z.; Ma, W. Contribution of heavy metals in PM2.5 to cardiovascular disease mortality risk, a case study in Guangzhou, China. Chemosphere 2020, 297, 134102. [Google Scholar] [CrossRef]
- Yuan, Y.; Wu, Y.; Ge, X.; Nie, D.; Wang, M.; Zhou, H.; Chen, M. In vitro toxicity evaluation of heavy metals in urban air particulate matter on human lung epithelial cells. Sci. Total Environ. 2019, 678, 301–308. [Google Scholar] [CrossRef]
- Hsieh, C.; Jung, C.; Lin, C.; Hwang, B. Combined exposure to heavy metals in PM2.5 and pediatric asthma. J. Allergy Clin. Immun. 2020, 147, 2171–2180. [Google Scholar] [CrossRef]
- Cogliano, V.; Baan, R.; Straif, B.; Grosse, B. Preventable exposures associated with human cancers. J. Natl. Cancer I. 2011, 103, 1827–1839. [Google Scholar] [CrossRef]
- Tang, Y.; Han, G. Characteristics of major elements and heavy metals in atmospheric dust in Beijing, China. J. Geochem. Explora. 2017, 176, 114–119. [Google Scholar] [CrossRef]
- Xu, J.; Jia, C.; Yu, H.; Xu, H.; Ji, D.; Wang, C.; Xiao, H.; He, J. Characteristics, sources, and health risks of PM2.5-bound trace elements in representative areas of Northern Zhejiang Province. China Chemosphere 2021, 272, 129632–129643. [Google Scholar] [CrossRef] [PubMed]
- Liu, T.; Zhao, C.; Chen, Q.; Li, L.; Si, G.; Li, L.; Guo, B. Characteristics and health risk assessment of heavy metal pollution in atmospheric particulate matter in different regions of the Yellow River Delta in China. Environ. Geochem. Health 2022, 45, 2013–2030. [Google Scholar] [CrossRef] [PubMed]
- Aldabe, J.; Elustondo, D.; Santamaría, C.; Lasheras, E.; Pandolfi, M.; Alastuey, A.; Querol, X.; Santamaría, J. Chemical characterisation and source apportionment of PM2.5 and PM10 at rural, urban and traffic sites in Navarra (North of Spain). Atmos. Res. 2011, 102, 191–205. [Google Scholar] [CrossRef]
- Patrick, A.; Pierre, S.; Alessandra, M. Long-term exposure to ambient PM2.5 and impacts on health in Rome, Italy. Clin. Epidemiol. Glob. 2020, 8, 531–553. [Google Scholar]
- Qu, J.; Zheng, L.; Tang, Q.; Liu, M.; Zhang, S. Source analysis of heavy metals in atmospheric particulate matter in a mining city. Environ. Geochem. Health 2022, 44, 979–991. [Google Scholar]
- Liu, Z.; Zhou, J.; Zhang, J.; Mao, Y.; Huang, X.; Qian, G. Evaluation for the heavy metal risk in fine particulate matter from the perspective of urban energy and industrial structure in China: A meta analysis. J. Clean. Prod. 2020, 244, 118597. [Google Scholar] [CrossRef]
- Duan, J.; Tan, J. Atmospheric heavy metals and Arsenic in China: Situation, sources and control policies. Atmos. Environ. 2013, 74, 93–101. [Google Scholar] [CrossRef]
- Li, F.; Yan, J.; Wei, Y.; Lv, G. PM2.5-bound heavy metals from the major cities in China:Spatiotemporal distribution, fuzzy exposure assessment and health risk management. J. Clean. Prod. 2021, 286, 124967. [Google Scholar] [CrossRef]
- Yu, P.; Han, Y.; Wang, M.; Zhu, Z.; Tong, Z.; Shao, X.; Peng, J.; Hamid, Y.; Yang, X.; Deng, Y.; et al. Heavy metal content and health risk assessment of atmospheric particles in China: A meta-analysis. Sci. Total Environ. 2023, 867, 161556. [Google Scholar] [CrossRef]
- Csavina, J.; Field, J.; Taylor, M.; Gao, S.; Landa’zuri, A.; Eric, A.; Eduardo, A. A review on the importance of metals and metalloids in atmospheric dust and aerosol from mining operations. Sci. Total Environ. 2012, 433, 58–73. [Google Scholar] [CrossRef]
- Duan, X.; Yan, Y.; Li, R.; Deng, M.; Peng, L. Seasonal variations, source apportionment, and health risk assessment of trace metals in PM2.5 in the typical industrial city of changzhi, China. Atmos. Pollut. Res. 2020, 12, 365–374. [Google Scholar] [CrossRef]
- Behrooz, R.; Kaskaoutis, D.; Grivas, G.; Mihalopoulos, N. Human health risk assessment for toxic elements in the extreme ambient dust conditions observed in Sistan, Iran. Chemosphere 2021, 262, 127835. [Google Scholar] [CrossRef] [PubMed]
- Zhang, X.; Yuko, E.; Masahide, A. Risk assessment and management of PM2.5-bound heavy metals in the urban area of Kitakyushu, Japan. Sci. Total Environ. 2021, 795, 148748. [Google Scholar] [CrossRef]
- US EPA. Guidelines for the Health Risk Assessment of Chemical Mixtures; US EPA: Cincinnati, OH, USA, 1986; Volume 51, pp. 34014–34025. Available online: https://www.epa.gov/risk/guidelines-health-risk-assessment-chemical-mixtures (accessed on 3 June 2024).
- Xue, H.; Liu, G.; Zhang, H.; Hu, R.; Wang, X. Similarities and differences in PM10 and PM2.5 concentrations, chemical compositions and sources in Hefei City, China. Chemosphere 2019, 220, 760–765. [Google Scholar] [CrossRef] [PubMed]
- Zhao, M.; Ren, L.; Li, G.; Liu, Y.; Zhao, G.; Gao, Y.; Yang, X. Pollution Characteristics and Health Risk Assessment of PM2.5 Heavy Metals in Tianjin and Qingdao in Winter of 2018–2019. Environ Chem. 2020, 43, 12. (In Chinese) [Google Scholar]
- Ministry of Ecology and Environment of the People’s Republic of China. Bulletin of the State of China’s Ecological Environment in 2021. 2022. Available online: https://www.mee.gov.cn/hjzl/sthjzk/zghjzkgb/202205/P020220608338202870777.pdf (accessed on 3 June 2024).
- National Bureau of Statistics of China. Available online: https://www.stats.gov.cn/sj/ (accessed on 3 June 2024).
- World Health Organization (WHO). Health Risks of Heavy Metals from Long-Range Transboundary Air Pollution; WHO Regional Office for Europ: Copenhagen, Denmark, 2007; p. 144. [Google Scholar]
- Kabir, E.; Ray, S.; Kim, K.; Yoon, H.; Jeon, E.; Kim, Y.; Chao, Y.; Yun, S.; Brown, R. Current status of trace metal pollution in soils affected by industrial activities. Sci. World J. 2012, 2012, 916705. [Google Scholar] [CrossRef]
- Li, Y.; Zhou, S.; Jia, Z.; Wang, G. Temporal and spatial distributions and sources of heavy metals in atmospheric deposition in western Taihu Lake, China. Environ. Pollut. 2021, 284, 117465. [Google Scholar] [CrossRef]
- Hao, Y.; Luo, B.; Simayi, M.; Zhang, W.; Xie, S. Spatiotemporal patterns of PM2.5 elemental composition over China and associated health risks. Environ. Pollut. 2020, 265, 114910. [Google Scholar] [CrossRef]
- Wang, X.; He, S.; Chen, S.; Zhang, Y.; Wang, A.; Luo, J.; Ye, X.; Mo, Z.; Wu, L.; Xu, P. Spatiotemporal Characteristics and Health Risk Assessment of Heavy Metals in PM2.5 in Zhejiang Province. Environ. Res. Public Health 2018, 15, 583. [Google Scholar] [CrossRef]
- Lv, W.; Wang, Y.; Querol, X.; Zhuang, X.; Alastuey, A.; López, A.; Viana, M. Geochemical and statistical analysis of trace metals in atmospheric particulates in Wuhan, central China. Environ. Geo. 2006, 51, 121–132. [Google Scholar] [CrossRef]
- Deng, L.; Bi, C.; Jia, J.; Zeng, Y.; Chen, Z. Effects of heating activities in winter on characteristics of PM2.5-bound Pb, Cd and lead isotopes in cities of China. J. Clean. Prod. 2020, 265, 121826. [Google Scholar] [CrossRef]
- Casimiro, P.; Mirante, F.; Oliveira, C.; Matos, M.; Caseiro, A.; Oliveira, C.; Querol, X.; Alves, C.; Martins, N.; Cerqueira, M. Size-segregated chemical composition of aerosol emissions in an urban road tunnel in Portugal. Atmos. Environ. 2013, 71, 15–25. [Google Scholar]
- Chang, S.; Wang, K.; Chang, H.; Ni, W.; Wu, B.; Wong, R.; Lee, H. Comparison of Source Identification of Metals in Road-Dust and Soil. Soil. Sediment. Contam. 2009, 18, 669–683. [Google Scholar] [CrossRef]
- Unal, Y.; Toros, H.; Deniz, A.; Incecik, S. Influence of meteorological factors and emission sources on spatial and temporal variations of PM10 concentrations in Istanbul metropolitan area. Atmos. Environ. 2011, 45, 5504–5513. [Google Scholar] [CrossRef]
- Guo, J.; Li, Y.; Liu, H.; Li, M.; Liu, M. Elemental composition and source analysis of atmospheric PM2.5 in winter in Chengdu. Environ. Dvpt. 2020, 32, 143–146+148. (In Chinese) [Google Scholar]
- Xiao, S.; Cai, M.; Li, X.; Huang, W.; Wang, J.; Zhu, Q.; Wu, S. Characteristics and health risk assessment of heavy metal pollution in atmospheric PM2.5 in Xiamen Port. Environ. Sci. 2022, 43, 3403–3415. (In Chinese) [Google Scholar]
- Brehmer, C.; Norris, C.; Karoline, K.; Bergin, M.; Schauer, J. The impact of household air cleaners on the chemical composition and children’s exposure to PM2.5 metal sources in suburban Shanghai. Environ. Pollut. 2019, 253, 190–198. [Google Scholar] [CrossRef]
- Zhang, W.; Lv, T.; Liu, J.; Gao, Y.; Zhou, X.; Cao, H. Characteristics, sources and health risks of heavy metal pollution in PM2.5 carrier belts in Beijing and assessment of policy effects. Environ. Sci. 2024, 45, 6229–6237. (In Chinese) [Google Scholar]
- Wang, Y.; Li, F.; Liu, Y.; Deng, X.; Yu, H.; Li, J.; Xue, T. Risk Assessment and Source Analysis of Atmospheric Heavy Metals Exposure in Spring of Tianjin, China. Aerosol Sci. Enginee 2022, 7, 87–95. [Google Scholar] [CrossRef]
- Department of Environmental Protection. GB 3095-2012; Ambient Air Quality Standard. China National Environmental Science Press: Beijing, China, 2012. Available online: https://www.mee.gov.cn/ywgz/fgbz/bz/bzwb/dqhjbh/dqhjzlbz/201203/t20120302_224165.shtml (accessed on 9 February 2025).
- Tian, R.; Liu, Y.; Chen, P.; Zhang, H.; Jiang, Y. Heavy metal pollution levels and health risks in PM2.5 in Hengyang city. Environ. Eng. 2017, 35, 127–130. (In Chinese) [Google Scholar]
- Wang, L.; Yang, H.; Li, X. Analysis of heavy metal levels and influencing factors in PM2.5 in some provincial capitals of China. Environ. Chem. 2017, 36, 72–83. (In Chinese) [Google Scholar]
- Cai, A.; Zhang, H.; Wang, L. Source Apportionment and Health Risk Assessment of Heavy Metals in PM2.5 in Handan: A Typical Heavily Polluted City in North China. Atmosphere 2021, 12, 1232. [Google Scholar] [CrossRef]
- Zou, H.; Zhang, B.; Wang, Z.; Li, X.; Dai, M.; Chen, H. Characteristics and health risk assessment of heavy metal pollution in atmospheric PM2.5 in Suzhou Industrial Park. Adm. Techn Environ. Monit. 2017, 29, 37–41. (In Chinese) [Google Scholar]
- Gao, J.; Tian, H.; Cheng, K.; Zheng, M.; Wang, S.; Hao, J.; Wang, K.; Hua, S.; Zhu, C. The variation of chemical characteristics of PM2.5 and PM10 and formation causes during two haze pollution events in urban Beijing, China. Atmos. Environ. 2015, 107, 1–8. [Google Scholar] [CrossRef]
- Liu, K.; Shang, Q.; Wan, C. Sources and Health Risks of Heavy Metals in PM2.5 in a Campus in a Typical Suburb Area of Taiyuan, North China. Atmosphere 2018, 9, 46. [Google Scholar] [CrossRef]
- Yan, L.; Zuo, H.; Zhang, J.; Li, Z.; Li, S. Comparative study on distribution characteristics and sources of heavy metal elements in atmospheric PM1, PM2.5 and PM10 in Shijiazhuang. Earth Sci. Front. 2019, 26, 263–270. (In Chinese) [Google Scholar]
- Qi, A.; Zhang, Y.; Ding, Y.; Yang, H. Characteristics and sources of metal element pollution in atmospheric PM2.5 in Yinchuan City. J. Environ. Health 2017, 34, 591–594. (In Chinese) [Google Scholar]
- Gao, J.; Wang, K.; Wang, Y.; Liu, S.; Hao, J.; Liu, H.; Hua, S.; Tian, H. Temporal-spatial characteristics and source apportionment of PM2.5 as well as its associated chemical species in the Beijing-Tianjin-Hebei region of China. Environ. Pollut. 2017, 233, 714–724. [Google Scholar] [CrossRef]
- Jin, Z. Characteristic sources and potential ecological risk assessment of heavy metal elements in atmospheric PM2.5 in Luoyang City. Environ. Prot. Technol. 2020, 26, 11–15. (In Chinese) [Google Scholar]
- Liu, Y.; Wang, H.; Guo, E.; Zhang, H.; He, M.; He, X.; Wang, M. Health risk assessment of heavy metals in particulate matter during spring and autumn observation in Xingyang City. Environ. Chem. 2019, 38, 1012–1918. (In Chinese) [Google Scholar]
- Gu, J.; Liu, L.; Liu, Z.; Cong, Q.; Zhao, G. Morphological analysis and bioavailability evaluation of heavy metals in atmospheric particulate matter in Jinzhou City. Chem. Res. Appl. 2016, 28, 1136–1140. (In Chinese) [Google Scholar]
- Tao, J.; Zhang, L.; Cao, J.; Zhong, l.; Chen, D.; Yang, Y.; Chen, D.; Chen, L.; Zhang, Z.; Wu, Y. 2017. Source apportionment of PM2.5 at urban and suburban areas of the Pearl River Delta region, south China-With emphasis on ship emissions. Sci Total Environ. 2017, 574, 1559–1570. [Google Scholar] [CrossRef] [PubMed]
- Jiang, J.; Li, R.; Qiu, H.; Wang, C.; Ruan, S.; Liu, G.; Peng, C.; Zhang, H. Characteristics and health risk assessment of heavy metal pollution in atmospheric PM2.5 in Shenzhen. Pract. Prev. Med. 2019, 26, 781–785. (In Chinese) [Google Scholar]
- Mo, Z.; Du, J.; Liu, H.; Chen, Z.; Liang, G.; Huang, J.; Li, H.; Lin, H.; Zhu, K. Health risk assessment of heavy metal pollutants in atmospheric PM2.5 in winter in Guilin City. Adm. Tech. Environ. Monit. 2019, 31, 23–27. (In Chinese) [Google Scholar]
- Liu, P.; Ren, H.; Xu, H. Assessment of heavy metal characteristics and health risks associated with PM2.5 in Xi’an, the largest city in northwestern China. Air Qual. Atmos. Health 2018, 11, 1037–1047. [Google Scholar] [CrossRef]
- Zheng, Q.; Hu, G.; Yu, R.; Zhao, Y.; Zhang, Z. Source analysis and health risk assessment of heavy metal elements in atmospheric PM2.5 in winter in Nanchang City. Earth Environ. 2018, 46, 6–312. (In Chinese) [Google Scholar]
- Ming, L.; Li, X.; Jin, L.; Fu, P.; Jun, L. PM2.5 in the Yangtze River Delta, China: Chemical compositions, seasonal variations, and regional pollution events. Environ. Pollut. 2017, 223, 200–212. [Google Scholar] [CrossRef]
- Nie, L.; Li, Y.; Hua, Z.; Cui, Z. Characteristics and health risk assessment of heavy metal pollution in atmospheric PM2.5 in Shenyang, Liaoning Province. Chin. J. Public Health 2018, 34, 574–576. (In Chinese) [Google Scholar]
- Kang, Z.; Bai, Y.; Yang, G.; Wang, Y.; Yu, T.; Hong, Q.; Liu, X. Characteristics and health risk assessment of heavy metal pollution in atmospheric PM2.5 in Harbin City. J. Environ. Health 2018, 35, 504–507. (In Chinese) [Google Scholar]
- Li, H.; Qian, X.; Leng, X.; Dai, Q. Characteristics and health risks of metal element pollution in PM2.5 in Nanjing. Environ. Monit. Forewarning 2021, 13, 7–13. (In Chinese) [Google Scholar]
- Yan, G.; Zhang, P.; Wang, C.; Song, X.; Gao, Y.; Zhang, J.; Jiang, J.; Cao, Z.; Zhu, G.; Wang, Y. Sources and potential health risks of heavy metals in PM2.5 during heating and non-heating periods in Zhengzhou City. Acta Sci. Circumstantiae 2019, 39, 2811–2820. (In Chinese) [Google Scholar]
- He, Z.; Chen, F. Characteristics and health risk assessment of heavy metal pollution in atmospheric PM2.5 in Nantong City. Mod. Prev. Med. 2020, 47, 233–236. (In Chinese) [Google Scholar]
- Du, M.; Yin, X.; Li, Y.; Ke, T.; Zhu, H.; Wu, J.; Zheng, G. Time Trends and Forecasts of Atmospheric Heavy Metals in Lanzhou, China, 2015–2019. Water Air Soil Pollut. 2022, 233, 233–305. [Google Scholar] [CrossRef]
- Yang, T.; Yu, H.; He, Y.; Miao, Y.; Gao, Y.; Li, N.; Wang, W. Element composition and source analysis of PM2.5 in Tangshan City in autumn and winter of 2017–2018. Res. Environ. Sci. 2020, 33, 2030–2039. (In Chinese) [Google Scholar]
- Wei, Q.; Chen, W.Y.; Jin, L.X. Health risk assessment and pollution source analysis of atmospheric PM2.5 heavy metal elements in Zaozhuang City. China Powder Sci. Technol. 2020, 26, 69–78. (In Chinese) [Google Scholar]
- Xu, X.; Feng, X.; Chen, J.; Yin, H.; Qian, J. Metal element pollution characteristics and health risk assessment of PM2.5 in Panzhihua City. Environ. Chem. 2021, 40, 2780–2788. (In Chinese) [Google Scholar]
- Zhang, Y.; Chen, R.; Bao, Y.; Chen, Z. Characteristics and health risk assessment of heavy metal pollution in PM2.5 in Zunyi City. Environ. Prot. Sci. 2020, 46, 179–184. (In Chinese) [Google Scholar]
- Li, C.; Lv, Q.; Wang, L. Analysis of heavy metal element pollution in PM2.5 in Taiyuan City from 2018 to 2020. Prev. Med. Trib. 2021, 27, 842–844. (In Chinese) [Google Scholar]
- Ji, X.; Yang, J.; Xie, X.; Guo, X. Characteristics and health risk assessment of heavy metal pollution in urban PM2.5 in Xining City in 2019. Mod. Prev. Med. 2021, 47, 4256–4259. (In Chinese) [Google Scholar]
- Fang, B.; Zeng, H.; Zhang, L.; Wang, H.; Liu, J.; Hao, K.; Zheng, G.; Wang, M.; Wang, Q.; Yang, W. Toxic metals in outdoor/indoor airborne PM2.5 in port city of Northern, China: Characteristics, sources, and personal exposure risk assessment. Environ. Pollut. 2021, 279, 116937. [Google Scholar] [CrossRef]
- Tang, D.; Chang, H.; Zhang, Y.; Sun, C.; Chen, F.; Guan, M.; Zhao, C. Heavy metal pollution and health risk assessment of PM2.5 in Shijiazhuang City from 2017 to 2019. Mod. Prev. Med. 2021, 48, 1177–1180+1197. (In Chinese) [Google Scholar]
- Fan, Z.; Wang, Y.; Zhang, R.; Qiu, G. Characteristics and health risk assessment of heavy metal pollution in atmospheric PM2.5 in Maanshan City. J. Environ. Health Sci. 2019, 36, 1064–1068. (In Chinese) [Google Scholar]
- Zhou, B.; Wang, J.; Cao, X.; Xu, D.; Feng, Q.; Liu, W.; Yang, Z.; Wang, Y.; Li, J. Pollution characteristics and sources of metal elements in PM2.5 in spring in Baoji City. Environ. Sci. Technol. 2021, 44, 198–206. (In Chinese) [Google Scholar]
- Xu, J.W.; Lin, M.; Yue, D.L.; Zhou, Z.; Huang, J. The pollution characteristic and ecological risk of atmospheric fine-particle-bound metals in Dongguan. Environ. Sci. Technol. 2021, 44, 155–160. (In Chinese) [Google Scholar]
- Zhou, X.; Xie, M.; Zhao, M.; Wang, Y.; Luo, J.; Lu, S.; Li, J.; Liu, Q. Pollution characteristics and human health risks of PM2.5-bound heavy metals: A 3 year observation in Suzhou, China. Environ. Geochem. Health 2023, 45, 5145–5162. [Google Scholar] [CrossRef]
- Li, W.; Zhang, M.; Wang, B.; Sun, L. Risk assessment of health effects of heavy metals in atmospheric PM2.5 on residents in Chaoyang District, Beijing. Mod. Prev. Med. 2021, 48, 416–419. (In Chinese) [Google Scholar]
- Li, L.; Deng, X.; Xiao, Z.; Yuan, J.; Yang, N.; Guo, X.; Bai, Y. The characteristics and health risks of heavy metal pollution in PM2.5 from different air masses in Tianjin during heating season. Environ. Sci. 2023, 44, 30–37. (In Chinese) [Google Scholar]
- Luo, R.; Dai, H.; Zhang, Y.; Qiao, L.; Ma, Y.; Zhou, M.; Xia, B.; Zhu, Q.; Zhao, Y.; Huang, C. Exposure levels, sources and health risks of heavy metal components of PM2.5 among domestic women in suburban Shanghai. Environ. Sci. 2019, 40, 5224–5233. (In Chinese) [Google Scholar]
- Ren, W.; Li, Y.; Su, C.; Wang, G.; Yu, X.; Kang, N. Characteristics, source analysis and health risk assessment of heavy metal pollution in atmospheric PM2.5 in Shenyang. Environ. Chem. 2021, 40, 1029–1037. [Google Scholar]
- He, R.; Zhang, T.; Chen, Y.; Jin, Z.; Han, S.; Zhao, J.; Zhang, R.; Yan, Q. Characteristics and ecological and health risk assessment of atmospheric PM2.5 heavy metal pollution in a living area of Zhengzhou City. Environ. Sci. 2019, 40, 4774–4782. (In Chinese) [Google Scholar]
- Su, X.; Li, X.; Han, R.; Dong, L.; Sun, H.; Chen, H. Distribution characteristics and sources of heavy metals in fine particulate matter in two urban areas of Kunming from 2017 to 2019. Occup. Health 2023, 39, 239–242+246. (In Chinese) [Google Scholar]
- Wang, X.; Fei, X.; Yang, Y.; Li, Y.; Gui, J.; Yang, A.; Xu, P. Pollution characteristics, sources and health risk assessment of heavy metal elements in PM2.5 in Huaxi district, Guiyang City. Acta Sci. Circumstantiae 2023, 43, 110–118. (In Chinese) [Google Scholar]
- Qin, J.; Zhang, X.; Huang, J.; Mo, Z.; Chen, Z.; Zhang, D.; Liu, H.; Li, H. Characteristics and health risk assessment of heavy metal pollution in atmospheric PM2.5 in Nanning City. Environ. Sci. Technol. 2020, 43, 35–44. [Google Scholar]

| Argument | Definition | Unit | Numerical Value | |
|---|---|---|---|---|
| Children | Adult | |||
| ABS | Skin absorption factor | 0.03 (As), 0.1 (Pb), 0.001 (Cd), 0.01 (else) | ||
| AF | Skin adhesion factor | mg·cm−2 | 0.2 | 0.07 |
| AT | Mean life | d | ED 70 | ED 70 |
| ATn | Mean life | h | ED 70 | ED 70 |
| BW | Per capita weight | kg | 15 | 70 |
| CF | Conversion factor | kg·mg−1 | 1.0 × 10⁻⁶ | 1.0 × 10⁻⁶ |
| ED | Exposure period | a | 6 | 24 |
| EF | Exposure frequency | d·a−1 | 180 | 180 |
| ET | Exposure time | h·d−1 | 24 | 24 |
| IngR | Hand–mouth intake | mg·d−1 | 200 | 100 |
| SA | Skin surface area | cm2 | 2800 | 5700 |
| Types of Heavy Metals | RfD0 | RfCi | GIABS | SF0 | IUR |
|---|---|---|---|---|---|
| Pb | 3.50 × 10⁻³ | 3.52 × 10⁻³ | 1 | 0.0085 | 0.000012 |
| As | 3.00 × 10⁻⁴ | 1.50 × 10⁻⁵ | 1 | 1.5 | 0.0043 |
| Mn | 1.43 × 10⁻⁵ | 0.50 × 10⁻⁴ | 1 | — | — |
| Ni | 2.00 × 10⁻² | 9.00 × 10⁻⁵ | 0.04 | — | 0.00026 |
| Cr | 3.00 × 10⁻³ | 1.00 × 10⁻⁴ | 0.025 | 0.5 | 0.084 |
| Cd | 1.00 × 10⁻³ | 1.50 × 10⁻⁵ | 0.025 | — | 0.0018 |
| Zn | 3.00 × 10⁻¹ | 3.01 × 10⁻¹ | 1 | — | — |
| Cu | 4.00 × 10⁻² | 4.02 × 10⁻² | 1 | — | — |
| Item | Pb | As | Mn | Ni | Cr | Cd | Zn | Cu | Fe |
|---|---|---|---|---|---|---|---|---|---|
| Pb | 1 | ||||||||
| As | 0.532 ** | 1 | |||||||
| Mn | 0.812 ** | 0.372 | 1 | ||||||
| Ni | 0.742 ** | 0.359 | 0.625 ** | 1 | |||||
| Cr | 0.804 ** | 0.487 * | 0.652 ** | 0.842 ** | 1 | ||||
| Cd | 0.783 ** | 0.602 ** | 0.767 ** | 0.678 ** | 0.633 ** | 1 | |||
| Zn | 0.767 ** | 0.663 ** | 0.749 ** | 0.728 ** | 0.761 ** | 0.597 ** | 1 | ||
| Cu | 0.835 ** | 0.262 | 0.758 ** | 0.917 ** | 0.729 ** | 0.633 * | 0.701 ** | 1 | |
| Fe | 0.669 * | 0.595 | 0.866 ** | 0.689 * | 0.845 ** | 0.300 | 0.508 | 0.761 ** | 1 |
| Item | Pb | As | Mn | Ni | Cr | Cd | Zn | Cu | Fe |
|---|---|---|---|---|---|---|---|---|---|
| Pb | 1 | ||||||||
| As | 0.412 * | 1 | |||||||
| Mn | 0.630 ** | 0.636 ** | 1 | ||||||
| Ni | 0.446 * | 0.482 * | 0.498 * | 1 | |||||
| Cr | 0.476 * | 0.351 | 0.700 ** | 0.706 ** | 1 | ||||
| Cd | 0.678 ** | 0.421 | 0.676 ** | 0.347 | 0.396 | 1 | |||
| Zn | 0.657 ** | 0.450 | 0.852 ** | 0.414 | 0.627 ** | 0.739 ** | 1 | ||
| Cu | 0.379 | −0.011 | 0.340 | 0.315 | 0.168 | 0.543 * | 0.338 | 1 | |
| Fe | 0.524 | 0.607 | 0.611 | 0.333 | 0.167 | 0.468 | 0.286 | 0.071 | 1 |
| Type of City | Time | Age | HI | CRT |
|---|---|---|---|---|
| All Cities | Pre-2018 | Adults | 0.5 | 2.9 × 10⁻⁵ |
| Children | 0.5 | 1.8 × 10⁻⁴ | ||
| Post-2018 | Adults | 0.3 | 9.0 × 10⁻⁶ | |
| Children | 0.3 | 5.2 × 10⁻⁵ | ||
| RICs | Pre-2018 | Adults | 0.7 | 6.4 × 10⁻⁵ |
| Children | 0.8 | 4.4 × 10⁻⁴ | ||
| Post-2018 | Adults | 0.3 | 1.3 × 10⁻⁵ | |
| Children | 0.3 | 7.6 × 10⁻⁵ | ||
| GCs | Pre-2018 | Adults | 0.4 | 1.8 × 10⁻⁵ |
| Children | 0.4 | 1.1 × 10⁻⁴ | ||
| Post-2018 | Adults | 0.2 | 1.6 × 10⁻⁶ | |
| Children | 0.2 | 6.4 × 10⁻⁶ |
Disclaimer/Publisher’s Note: The statements, opinions and data contained in all publications are solely those of the individual author(s) and contributor(s) and not of MDPI and/or the editor(s). MDPI and/or the editor(s) disclaim responsibility for any injury to people or property resulting from any ideas, methods, instructions or products referred to in the content. |
© 2025 by the authors. Licensee MDPI, Basel, Switzerland. This article is an open access article distributed under the terms and conditions of the Creative Commons Attribution (CC BY) license (https://creativecommons.org/licenses/by/4.0/).
Share and Cite
Cha, Z.; Zhang, X.; Zhang, K.; Zhou, G.; Gao, J.; Sun, S.; Gao, Y.; Liu, H. Atmospheric Heavy Metal Pollution Characteristics and Health Risk Assessment Across Various Type of Cities in China. Toxics 2025, 13, 220. https://doi.org/10.3390/toxics13030220
Cha Z, Zhang X, Zhang K, Zhou G, Gao J, Sun S, Gao Y, Liu H. Atmospheric Heavy Metal Pollution Characteristics and Health Risk Assessment Across Various Type of Cities in China. Toxics. 2025; 13(3):220. https://doi.org/10.3390/toxics13030220
Chicago/Turabian StyleCha, Zhichun, Xi Zhang, Kai Zhang, Guanhua Zhou, Jian Gao, Sichu Sun, Yuanguan Gao, and Haiyan Liu. 2025. "Atmospheric Heavy Metal Pollution Characteristics and Health Risk Assessment Across Various Type of Cities in China" Toxics 13, no. 3: 220. https://doi.org/10.3390/toxics13030220
APA StyleCha, Z., Zhang, X., Zhang, K., Zhou, G., Gao, J., Sun, S., Gao, Y., & Liu, H. (2025). Atmospheric Heavy Metal Pollution Characteristics and Health Risk Assessment Across Various Type of Cities in China. Toxics, 13(3), 220. https://doi.org/10.3390/toxics13030220