

Associations of Environmental Pollutant Mixtures and Red Blood Cell Folate Concentrations: A Mixture Analysis of the U.S. Adult Population Based on NHANES Data, 2007–2016

 , , , and
Abstract
1. Introduction
2. Methods
2.1. Population and Data Collection
2.2. RBC Folate Measurement
2.3. Assessment of Environmental Exposure Biomarkers
2.4. Phthalates (ng/mL)
2.5. Heavy Metals
2.6. PFAS (ng/mL)
2.7. Phenols and Parabens (ng/mL)
2.8. PAH (ng/L)
2.9. Cotinine (ng/mL)
3. Covariates
4. Statistical Methods
5. Results
5.1. ExWAS Analysis
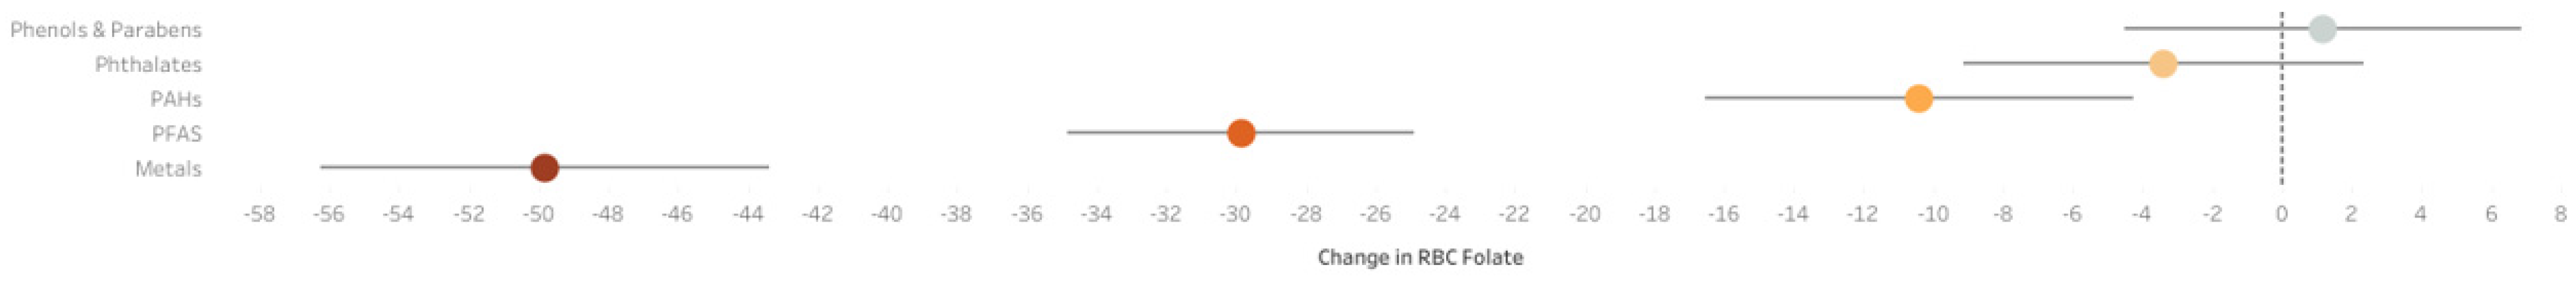
5.2. Q-Gcomp Analysis
6. Discussion
7. Conclusions
Author Contributions
Funding
Institutional Review Board Statement
Informed Consent Statement
Data Availability Statement
Conflicts of Interest
References
- Ducker, G.S.; Rabinowitz, J.D. One-Carbon Metabolism in Health and Disease. Cell Metab. 2017, 25, 27–42. [Google Scholar] [CrossRef] [PubMed]
- Fowler, B. The folate cycle and disease in humans. Kidney Int. 2001, 59, 221–229. [Google Scholar] [CrossRef]
- Son, P.; Lewis, L. Hyperhomocysteinemia. [Updated 2020 May 21]. In StatPearls [Internet]; StatPearls Publishing: Treasure Island, FL, USA, 2022. Available online: https://www.ncbi.nlm.nih.gov/books/NBK554408/ (accessed on 24 November 2024).
- Keil, K.P.; Lein, P.J. DNA methylation: A mechanism linking environmental chemical exposures to risk of autism spectrum disorders? Environ. Epigenetics 2016, 2, dvv012. [Google Scholar] [CrossRef]
- Kim, Y. Folate and carcinogenesis: Evidence, mechanisms, and implications. J. Nutr. Biochem. 1999, 10, 66–88. [Google Scholar] [CrossRef] [PubMed]
- Kim, Y. Nutritional Epigenetics: Impact of Folate Deficiency on DNA Methylation and Colon Cancer Susceptibility. J. Nutr. 2005, 135, 2703–2709. [Google Scholar] [CrossRef]
- Pfeiffer, C.M.; Sternberg, M.R.; Zhang, M.; Fazili, Z.; Storandt, R.J.; Crider, K.S.; Lavoie, D.J. Folate status in the US population 20 y after the introduction of folic acid fortification. Am. J. Clin. Nutr. 2019, 110, 1088–1097. [Google Scholar] [CrossRef]
- Greenberg, J.A.; Bell, S.J.; Guan, Y.; Yu, Y.-H. Folic Acid Supplementation and Pregnancy: More Than Just Neural Tube Defect Prevention. Rev. Obstet. Gynecol. 2011, 4, 52–59. [Google Scholar] [PubMed] [PubMed Central]
- Botto, L.D.; Moore, C.A.; Khoury, M.J.; Erickson, J.D. Neural-Tube Defects. N. Engl. J. Med. 1999, 341, 1509–1519. [Google Scholar] [CrossRef]
- Czeizel, A.; Dudás, I.; Vereczkey, A.; Bánhidy, F. Folate Deficiency and Folic Acid Supplementation: The Prevention of Neural-Tube Defects and Congenital Heart Defects. Nutrients 2013, 5, 4760–4775. [Google Scholar] [CrossRef]
- George, L.; Mills, J.L.; Johannson, A.L.V.; Nordmark, A.; Olander, B.; Granath, F.; Cnattingius, S. Plasma Folate Levels and Risk of Spontaneous Abortion. JAMA 2002, 288, 1867. [Google Scholar] [CrossRef]
- Liu, X.; Lv, L.; Zhang, H.; Zhao, N.; Qiu, J.; He, X.; Zhang, Y. Folic acid supplementation, dietary folate intake and risk of preterm birth in China. Eur. J. Nutr. 2015, 55, 1411–1422. [Google Scholar] [CrossRef] [PubMed]
- Naninck EF, G.; Stijger, P.C.; Brouwer-Brolsma, E.M. The Importance of Maternal Folate Status for Brain Development and Function of Offspring. Adv. Nutr. 2019, 10, 502–519. [Google Scholar] [CrossRef] [PubMed]
- Watanabe, H.; Fukuoka, H.; Sμgiyama, T.; Nagai, Y.; Ogasawara, K.; Yoshiike, N. Dietary folate intake during pregnancy and birth weight in Japan. Eur. J. Nutr. 2008, 47, 341–347. [Google Scholar] [CrossRef] [PubMed]
- Zhu, X.; Wei, L.; Cao, D.; Liu, C.; Tian, J.; Long, Y.; Mo, Z. Low serum folate status in the second trimester increase the risk of low birthweight in Chinese women. J. Obstet. Gynaecol. Res. 2018, 44, 2037–2044. [Google Scholar] [CrossRef]
- Oulhote, Y.; Lanphear, B.; Braun, J.M.; Webster, G.M.; Arbuckle, T.E.; Etzel, T.; Forget-Dubois, N.; Seguin, J.R.; Bouchard, M.F.; MacFarlane, A.; et al. Gestational exposures to phthalates and folic acid, and autistic traits in Canadian children. Environ. Health Perspect. 2020, 128, 027004. [Google Scholar] [CrossRef]
- Weggemans, R.M.; Groot, L.C.D.; Haller, J. Factors Related to Plasma Folate and Vitamin B12. The Seneca Study. Int. J. Food Sci. Nutr. 1997, 48, 141–150. [Google Scholar] [CrossRef]
- Sanvisens, A.; Zuluaga, P.; Pineda, M.; Fuster, D.; Bolao, F.; Juncà, J.; Mμga, R. Folate deficiency in patients seeking treatment of alcohol use disorder. Drug Alcohol Depend. 2017, 180, 417–422. [Google Scholar] [CrossRef]
- Zhou, Z.; Li, J.; Yu, Y.; Li, Y.; Zhang, Y.; Liu, L.; Huo, Y. Effect of Smoking and Folate Levels on the Efficacy of Folic Acid Therapy in Prevention of Stroke in Hypertensive Men. Stroke 2018, 49, 114–120. [Google Scholar] [CrossRef]
- Stamm, R.; Hoμghton, L. Nutrient Intake Values for Folate during Pregnancy and Lactation Vary Widely around the World. Nutrients 2013, 5, 3920–3947. [Google Scholar] [CrossRef]
- Zhao, R.; Aluri, S.; Goldman, I.D. The proton-coupled folate transporter (PCFT-SLC46A1) and the syndrome of systemic and cerebral folate deficiency of infancy: Hereditary folate malabsorption. Mol. Asp. Med. 2017, 53, 57–72. [Google Scholar] [CrossRef]
- Kishi, R.; Grandjean, P. Health Impacts of Developmental Exposure to Environmental Chemicals. In Health Impacts of Developmental Exposure to Environmental Chemicals; Springer: Berlin/Heidelberg, Germany, 2020. [Google Scholar]
- Centers for Disease Control and Prevention (CDC); National Center for Health Statistics (NCHS). National Health and Nutrition Examination Survey Data [2007–2016]; U.S. Department of Health and Human Services, Centers for Disease Control and Prevention: Hyattsville, MD, USA. Available online: https://www.cdc.gov/nchs/nhanes/index.html (accessed on 24 November 2024).
- Centers for Disease Control and Prevention (CDC); National Center for Health Statistics (NCHS). National Health and Nutrition Examination Survey Protocol 4000.04 [2015–2016]; U.S. Department of Health and Human Services, Centers for Disease Control and Prevention: Hyattsville, MD, USA. Available online: https://wwwn.cdc.gov/nchs/data/nhanes/2015-2016/labmethods/FOLATE-I-MET-508.pdf (accessed on 24 November 2024).
- Li, M.X.; Yeung, J.M.; Cherny, S.S.; Sham, P.C. Evaluating the effective numbers of independent tests and significant p-value thresholds in commercial genotyping arrays and public imputation reference datasets. Hum. Genet. 2012, 131, 747–756. [Google Scholar] [CrossRef] [PubMed]
- Warembourg, C.; Maitre, L.; Tamayo-Uria, I.; Fossati, S.; Roumeliotaki, T.; Aasvang, G.M.; Basagaña, X. Early-Life Environmental Exposures and Blood Pressure in Children. J. Am. Coll. Cardiol. 2019, 74, 1317–1328. [Google Scholar] [CrossRef]
- Keil, A.P.; Buckley, J.P.; O’Brien, K.M.; Ferguson, K.K.; Zhao, S.; White, A.J. A Quantile-Based g-Computation Approach to Addressing the Effects of Exposure Mixtures. Environ. Health Perspect. 2020, 128, 047004. [Google Scholar] [CrossRef] [PubMed]
- Zhu, X. Comparison of four methods for handing missing data in longitudinal data analysis throμgh a simulation study. Open J. Stat. 2014, 4, 933–944. [Google Scholar] [CrossRef]
- Rubin, D.B. Multiple Imputation for Nonresponse in Surveys; John Wiley and Son: New York, NY, USA, 2004. [Google Scholar]
- Duncan, K.; Erickson, A.C.; Egeland, G.M.; Weiler, H.; Arbour, L.T. Red blood cell folate levels in Canadian Inuit women of childbearing years: Influence of food security, body mass index, smoking, education, and vitamin use. Can. J. Public Health 2018, 109, 684–691. [Google Scholar] [CrossRef]
- Bal, C.; Hocaoglu, A.; Büyükşekerci, M.; Alagüney, M.E.; Yılmaz, O.H.; Tutkun, E. Evaluation of folate and vitamin B12 status in lead exposed workers. Toxicol. Lett. 2015, 42, 294–298. [Google Scholar] [CrossRef]
- Tian, Y.; Luan, M.; Zhang, J.; Yang, H.; Wang, Y.; Chen, H. Associations of single and multiple perfluoroalkyl substances exposure with folate among adolescents in Nhanes 2007–2010. Chemosphere 2022, 307, 135995. [Google Scholar] [CrossRef]
- Lee, J.E.; Choi, K. Perfluoroalkyl substances exposure and thyroid hormones in humans: Epidemiological observations and implications. Ann. Pediatr. Endocrinol. Metab. 2017, 22, 6–14. [Google Scholar] [CrossRef]
- Catargi, B.; Parrot-Roulaud, F.; Cochet, C.; Ducassou, D.; Roger, P.; Tabarin, A. Homocysteine, hypothyroidism, and effect of thyroid hormone replacement. Thyroid. Off. J. Am. Thyroid. Assoc. 1999, 9, 1163–1166. [Google Scholar] [CrossRef]
- Barjaktarovic, M.; Steegers, E.A.P.; Jaddoe, V.W.V.; de Rijke, Y.B.; Visser, T.J.; Korevaar, T.I.M.; Peeters, R.P. The Association of Thyroid Function with Maternal and Neonatal Homocysteine Concentrations. J. Clin. Endocrinol. Metab. 2017, 102, 4548–4556. [Google Scholar] [CrossRef]
- Tandon, S.K.; Flora, S.J.; Behari, J.R.; Ashquin, M. Vitamin B complex in treatment of cadmium intoxication. Ann. Clin. Lab. Sci. 1984, 14, 487–492. [Google Scholar] [PubMed]
- Sobrino-Plata, J.; Meyssen, D.; Cuypers, A.; Escobar, C.; Hernández, L. Glutathione is a key antioxidant metabolite to cope with mercury and cadmium stress. Plant Soil 2014, 377, 369–381. Available online: https://doi-org.silk.library.umass.edu/10.1007/s11104-013-2006-4 (accessed on 24 November 2024). [CrossRef]
- Branco, V.; Matos, B.; Mourato, C.; Diniz, M.; Carvalho, C.; Martins, M. Synthesis of glutathione as a central aspect of PAH toxicity in liver cells: A comparison between phenanthrene, benzo[b]fluoranthene and their mixtures. Ecotoxicol. Environ. Saf. 2021, 208, 111637. [Google Scholar] [CrossRef] [PubMed]
- Richie, J.J.P.; Das, A.; Calcagnotto, A.M.; Aliaga, C.A.; El-Bayoumy, K. Age related changes in selenium and glutathione levels in different lobes of the rat prostate. Exp. Gerontol. 2012, 47, 223–228. Available online: https://doi-org.silk.library.umass.edu/10.1016/j.exger.2011.11.015 (accessed on 24 November 2024). [CrossRef]
- Mallah, M.A.; Mallah, M.A.; Liu, Y.; Xi, H.; Wang, W.; Feng, F.; Zhang, Q. Relationship Between Polycyclic Aromatic Hydrocarbons and Cardiovascular Diseases: A Systematic Review. Front. Public Health 2021, 9, 763706. [Google Scholar] [CrossRef]
- Min, J.-Y.; Lee, K.-J.; Park, J.-B.; Min, K.-B. Perfluorooctanoic acid exposure is associated with elevated homocysteine and hypertension in US adults. Occup. Environ. Med. 2012, 69, 658–662. Available online: http://www.jstor.org/stable/23567816 (accessed on 24 November 2024). [CrossRef]
- Ledda, C.; Cannizzaro, E.; Lovreglio, P.; Vitale, E.; Stufano, A.; Montana, A.; Li Volti, G.; Rapisarda, V. Exposure to Toxic Heavy Metals Can Influence Homocysteine Metabolism? Antioxidants 2019, 9, 30. [Google Scholar] [CrossRef]
- Blom, H.J.; Smulders, Y. Overview of homocysteine and folate metabolism. With special references to cardiovascular disease and neural tube defects. J. Inherit. Metab. Dis. 2011, 34, 75–81. [Google Scholar] [CrossRef]
- Zhang, Y.; Mustieles, V.; Wang, Y.-X.; Sun, Y.; Agudelo, J.; Bibi, Z.; Torres, N.; Oulhote, Y.; Slitt, A.; Messerlian, C. Folate concentrations and serum perfluoroalkyl and polyfluoroalkyl substance concentrations in adolescents and adults in the USA (National Health and Nutrition Examination Study 2003–2016): An observational study. Lancet Planet. Health 2023, 7, e449–e458. [Google Scholar] [CrossRef]

| N | Mean | SD | p-Value | |
|---|---|---|---|---|
| Overall RBC Folate | 27,938 | 515.7 | 243.7 | N/A |
| Sex | <0.001 | |||
| Male | 13,599 | 500.1 | 232.5 | - |
| Female | 14,339 | 530.6 | 252.9 | <0.001 |
| Age | <0.001 | |||
| 18 to 34 | 8022 | 439.1 | 172.1 | - |
| 35 to 64 | 13,650 | 506.3 | 220.4 | <0.001 |
| 65 and Older | 6266 | 634.4 | 315.0 | <0.001 |
| Race | <0.001 | |||
| Mexican American | 4441 | 478.4 | 199.2 | - |
| Other Hispanic | 3012 | 483.1 | 200.7 | 0.918 |
| Non-Hispanic White | 11,605 | 584.4 | 273.4 | <0.001 |
| Non-Hispanic Black | 5768 | 440.6 | 210.3 | <0.001 |
| Other | 3112 | 483.9 | 211.4 | 0.861 |
| Education | <0.001 | |||
| Less than 9th Grade | 3107 | 489.8 | 236.0 | - |
| 9th to 11th Grade | 4094 | 495.5 | 242.6 | 0.921 |
| High School Graduate/GED | 6309 | 514.4 | 255.4 | <0.001 |
| Some College or AA | 8074 | 519.6 | 246.0 | <0.001 |
| College Graduate or Above | 6254 | 539.0 | 229.1 | <0.001 |
| Missing | 100 | 473.0 | 301.1 | 0.984 |
| Smoking Status | <0.001 | |||
| Has not Smoked in Last 30 Days | 22,200 | 533.6 | 250.6 | - |
| Smoked in Last 30 Days | 5729 | 446.7 | 200.6 | 0.540 |
| Missing | 9 | 448.5 | 134.0 | 0.999 |
| FPR | <0.001 | |||
| Lowest Quartile | 6335 | 475.5 | 223.7 | - |
| 2nd Quartile | 6349 | 516.3 | 251.2 | <0.001 |
| 3rd Quartile | 6365 | 528.9 | 242.9 | <0.001 |
| Highest Quartile | 6401 | 547.5 | 244.1 | <0.001 |
| Missing | 2488 | 501.3 | 258.4 | <0.001 |
| Urinary Creatinine | <0.001 | |||
| Lowest Quartile | 6376 | 548.9 | 258.1 | - |
| 2nd Quartile | 6372 | 531.8 | 253.3 | <0.001 |
| 3rd Quartile | 6473 | 500.0 | 225.0 | <0.001 |
| Highest Quartile | 6469 | 471.4 | 210.1 | <0.001 |
| Missing | 2248 | 549.4 | 288.3 | 0.999 |
| Cycle | 0.251 | |||
| 2007–2008 | 5600 | 538.0 | 265.0 | - |
| 2009–2010 | 6019 | 496.2 | 232.8 | <0.001 |
| 2011–2012 | 5269 | 486.0 | 224.5 | <0.001 |
| 2013–2014 | 5636 | 533.7 | 247.4 | 0.88 |
| 2015–2016 | 5414 | 524.7 | 242.1 | 0.03 |
| HEI | <0.001 | |||
| Lowest Quartile | 6534 | 474.7 | 229.2 | - |
| 2nd Quartile | 6533 | 498.7 | 237.6 | <0.001 |
| 3rd Quartile | 6534 | 528.8 | 251.1 | <0.001 |
| Highest Quartile | 6534 | 565.4 | 249.5 | <0.001 |
| Missing | 1803 | 499.0 | 232.5 | <0.001 |
| Exposure | N | % < LOD | GM | GSD | IQR |
|---|---|---|---|---|---|
| Phthalates (ng/mL) | |||||
| Mono(carboxyisoctyl) phthalate (MCOP) | 9012 | 1.22% | 11.34 | 4.17 | 23.98 |
| Mono-2-ethyl-5-carboxypentyl phthalate (MECPP) | 9012 | 0.23% | 15.19 | 3.25 | 22.90 |
| Mono-n-butyl phthalate (MBP) | 9012 | 2.24% | 11.83 | 3.44 | 19.94 |
| Mono-(3-carboxypropyl) phthalate (MCPP) | 9012 | 9.55% | 2.10 | 3.67 | 3.70 |
| Mono-ethyl phthalate (MEP) (ng/mL) | 9012 | 0.13% | 61.78 | 4.94 | 153.48 |
| Mono-(2-ethyl-5-hydroxyhexyl) phthalate (MEHHP) | 9012 | 0.67% | 9.68 | 3.51 | 15.90 |
| Mono-(2-ethyl)-hexyl phthalate (MEHP) | 9012 | 33.60% | 1.61 | 3.10 | 2.63 |
| Mono-isobutyl phthalate (MiBP) | 9012 | 2.00% | 7.49 | 3.12 | 12.00 |
| Mono-isononyl phthalate (MNP) | 9012 | 67.63% | 1.05 | 2.74 | 0.61 |
| Mono-(2-ethyl-5-oxohexyl) phthalate (MEOHP) | 9012 | 0.95% | 5.96 | 3.40 | 9.45 |
| Mono-benzyl phthalate (MBzP) | 9012 | 2.66% | 4.88 | 3.72 | 9.80 |
| Metals (µg/L) | |||||
| Cadmium (µg/L) | 22,401 | 15.71% | 0.36 | 2.24 | 0.38 |
| Lead | 22,401 | 0.29% | 12.0 | 20.1 | 11.4 |
| Manganese | 10,787 | 0.00% | 9.38 | 1.43 | 4.31 |
| Mercury | 22,401 | 9.85% | 0.90 | 2.69 | 1.22 |
| Selenium | 10,787 | 0.00% | 192.83 | 1.14 | 29.97 |
| Total arsenic | 9170 | 0.87% | 8.35 | 3.17 | 12.40 |
| PFAS (ng/mL) | |||||
| Perfluorodecanoic acid (PFDeA) | 8963 | 16.82% | 0.23 | 2.25 | 0.26 |
| Perfluorohexane sulfonic acid (PFHxS) | 8963 | 1.91% | 1.39 | 2.61 | 1.79 |
| 2-(N-methylperfluoroctanesulfonamido)acetic acid (Me-PFOSA-AcOH) | 8963 | 53.33% | 0.16 | 2.52 | 0.23 |
| Perfluorononanoic acid (PFNA) | 8963 | 1.53% | 0.91 | 2.11 | 0.88 |
| Perfluoroundecanoic acid (PFUA) | 8963 | 59.88% | 0.15 | 2.27 | 0.13 |
| Perfluorooctanoic acid (PFOA) | 8961 | 0.22% | 2.34 | 2.14 | 2.40 |
| Perfluorooctane sulfonic acid (PFOS) | 8961 | 0.39% | 7.49 | 2.61 | 9.59 |
| Phenols and parabens (ng/mL) | |||||
| Bisphenol A (BPA) | 9013 | 0.65% | 1.53 | 3.03 | 2.40 |
| Triclosan | 9013 | 7.51% | 10.93 | 7.05 | 37.47 |
| Butyl paraben | 9013 | 0.18% | 0.25 | 5.14 | 0.33 |
| Methyl paraben | 9013 | 2.49% | 59.09 | 6.03 | 213.80 |
| Propyl paraben (ng/mL) | 9013 | 0.18% | 7.33 | 9.78 | 43.70 |
| PAHs (ng/L) | |||||
| One hydroxynaphthalene | 7194 | 0.06% | 2235.54 | 4.68 | 5480.00 |
| Two hydroxynaphthalene | 7221 | 0.00% | 4474.30 | 3.20 | 8318.10 |
| Three hydroxyfluorene | 7256 | 1.86% | 104.31 | 3.97 | 208.15 |
| Two hydroxyfluorene | 7267 | 0.00% | 261.61 | 3.43 | 470.50 |
| Three hydroxyphenanthrene | 5439 | 1.84% | 79.04 | 2.80 | 118.80 |
| One hydroxyphenanthrene | 7280 | 0.38% | 123.95 | 2.56 | 164.73 |
| Two hydroxyphenanthrene | 5417 | 1.14% | 68.29 | 2.55 | 90.00 |
| One hydroxypyrene | 7253 | 7.33% | 118.89 | 2.84 | 176.30 |
| Nine hydroxyfluorene | 5448 | 0.00% | 304.70 | 3.00 | 490.23 |
| Cotinine (ng/mL) | 27,646 | 27.41% | 0.31 | 47.50 | 8.72 |
Disclaimer/Publisher’s Note: The statements, opinions and data contained in all publications are solely those of the individual author(s) and contributor(s) and not of MDPI and/or the editor(s). MDPI and/or the editor(s) disclaim responsibility for any injury to people or property resulting from any ideas, methods, instructions or products referred to in the content. |
© 2025 by the authors. Licensee MDPI, Basel, Switzerland. This article is an open access article distributed under the terms and conditions of the Creative Commons Attribution (CC BY) license (https://creativecommons.org/licenses/by/4.0/).
Share and Cite
Mascari, M.; Reeves, K.; Balasubramanian, R.; Liu, Z.; Laouali, N.; Oulhote, Y. Associations of Environmental Pollutant Mixtures and Red Blood Cell Folate Concentrations: A Mixture Analysis of the U.S. Adult Population Based on NHANES Data, 2007–2016. Toxics 2025, 13, 200. https://doi.org/10.3390/toxics13030200
Mascari M, Reeves K, Balasubramanian R, Liu Z, Laouali N, Oulhote Y. Associations of Environmental Pollutant Mixtures and Red Blood Cell Folate Concentrations: A Mixture Analysis of the U.S. Adult Population Based on NHANES Data, 2007–2016. Toxics. 2025; 13(3):200. https://doi.org/10.3390/toxics13030200
Chicago/Turabian StyleMascari, Michael, Katherine Reeves, Raji Balasubramanian, Zhenhua Liu, Nasser Laouali, and Youssef Oulhote. 2025. "Associations of Environmental Pollutant Mixtures and Red Blood Cell Folate Concentrations: A Mixture Analysis of the U.S. Adult Population Based on NHANES Data, 2007–2016" Toxics 13, no. 3: 200. https://doi.org/10.3390/toxics13030200
APA StyleMascari, M., Reeves, K., Balasubramanian, R., Liu, Z., Laouali, N., & Oulhote, Y. (2025). Associations of Environmental Pollutant Mixtures and Red Blood Cell Folate Concentrations: A Mixture Analysis of the U.S. Adult Population Based on NHANES Data, 2007–2016. Toxics, 13(3), 200. https://doi.org/10.3390/toxics13030200