Article

A Fenton Oxidation-Based Integrated Strategy for the Treatment of Raw Gasoline Alkali Residue in Kashi

1
Xinjiang Key Laboratory of Novel Functional Materials Chemistry, College of Chemistry and Environmental Sciences, Kashi University, Kashi 844000, China
2
Kezilsu Ecological Environment Monitoring Station, Atushi 845350, China
3
State Key Laboratory of Regional and Urban Ecology, Institute of Urban Environment, Chinese Academy of Sciences, Xiamen 361021, China
*
Authors to whom correspondence should be addressed.
Toxics 2025, 13(10), 871; https://doi.org/10.3390/toxics13100871
Submission received: 4 September 2025 / Revised: 1 October 2025 / Accepted: 13 October 2025 / Published: 13 October 2025
(This article belongs to the Special Issue Technology and Principle of Removing Pollutants in Water)

Abstract

Gasoline alkali residue raw liquid, a kind of highly toxicity containing organic waste generated during petroleum refining, is characterized by its complex composition, high pollutant levels, and significant emission volume. The effective treatment of this wastewater remains a considerable challenge in environmental engineering. This study systematically investigates the degradation efficiency and mechanism of Fenton oxidation in reducing the chemical oxygen demand (COD) of raw gasoline alkali residue sourced from Kashi. The effects of H2O2 concentration and the H2O2/Fe2+ molar ratio on COD and TOC removal were examined. Results demonstrated that the COD and TOC removal efficiency exhibited an initial decrease followed by an increase with rising concentrations of Fe2+ and H2O2. Comparative assessment of different combined Fenton processes revealed distinct mechanistic differences among the composite oxidation systems. The integration of pretreatment with UV-Fenton oxidation was identified as the optimal strategy. Under optimal conditions (pH = 3.0, H2O2 concentration = 1.0 mol/L, H2O2/Fe2+ molar ratio = 5:0.10), the COD was reduced from 25,041 mg/L to 543 mg/L, achieving a COD removal rate of 97.8%. This study elucidates the reaction mechanism of the Fenton system in treating alkali residue and provides a theoretical foundation for the advanced treatment of high-concentration organic wastewater.

1. Introduction

1.1. Sources and Properties of the Gasoline Alkali Residue Stock Solution

Environmental protection has received great attention since China’s sustainable development strategy has been implemented, and the harmless treatment of waste generated during industrial production is particularly important [1,2]. Additionally, the treatment of several alkali residue stock solutions generated in petroleum refining is imminent [3]. Refinery alkali residue crude liquid primarily comes from the petrochemical industry refinery catalytic cracking gasoline alkaline wash, total hydrocarbon alkaline wash crude liquid, and alkali residue crude liquid produced by the atmospheric decompression device [4]. These raw alkali residues contain several sulfides, mercaptans, phenols, thiophenols, thioethers, naphthenic acids, and other toxic and hazardous pollutants. Moreover, these raw alkali residues have pH values between 10 and 14, are usually black–brown in color with phenols featuring a high amount of volatile phenols and a strong, irritating odor [5,6].

1.2. Treatment Mode of Gasoline Alkali Residue Crude Fluid

Due to the strong alkalinity, high toxicity, and difficult biochemical degradation characteristics of gasoline alkali residue crude fluid, its efficient treatment is a critical problem in petroleum refining. Usually, the recovery of naphthenic acid, extraction, low-temperature wet oxidation, and other technologies are used to treat the crude liquid in petroleum refineries [7]. However, the final treatment indicators often do not meet the relevant technical and economic requirements. Common treatment methods include incineration [8], membrane separation [9,10], and biochemical methods (anaerobic and aerobic) [11]. Although these methods can effectively treat waste liquids, they require large investments, expensive operating costs, and are susceptible to external conditions. Consequently, the investigation of novel alkali residue raw liquid deep treatment technology is a key study field in industrial raw liquid purification and treatment technology [12]. Using redox treatment technology, the organic matter in the raw liquid is decomposed using an oxidizer and a catalyst at high temperatures and pressures [13]. Subsequently, this method has the advantages of high degradation efficiency and less secondary pollution. The common redox methods are categorized into wet oxidation (WAO), supercritical wet oxidation (SWAO), and others [14,15].
In the Fenton system [16], Fe2+ and H2O2 primarily act as the homogeneous catalyst and the oxidizing agent, respectively [17]. Fenton reagent is the primary choice for the deep oxidation of industrial stock solutions (AOP) due to its unique advantages in the oxidative degradation of POPs [18,19,20]. In the ordinary Fenton reagent treatment of stock solutions, H2O2 decomposed under the catalytic effect of Fe2+ to produce hydroxyl radicals (·OH), oxidizing the organic matter into small molecules through electron transfer. Simultaneously, O2 finally oxidized the catalyst Fe2+ to Fe3+, and the resulting Fe(OH)3 colloid has a good flocculation effect under certain conditions, removing several suspended particles in the waste liquid [21,22]. Ordinary Fenton reagents can oxidize organic molecules under dark conditions, offering the advantages of low investment and easy operation. However, the intermediate products of the reaction transformation or the formation of complexes with Fe3+ that compete with ·OH generation may cause more harm to the environment [13].
The traditional wet oxidation method uses an oxidizing agent to oxidize the organic matter in the raw liquid to CO2 and H2O under high temperatures and pressures to remove pollutants. The photocatalytic oxidation method is a typical deep oxidation technology and is the degradation treatment of organic stock solutions using a specific light source and catalyst compound [23]. Additionally, its mechanism is that the light energy absorbed by the photosensitized semiconductor (catalyst) is higher than the energy of its forbidden bandwidth, producing free electrons and holes. The reaction between holes and water and between electrons and dissolved oxygen produces ·OH and O2−, respectively. Additionally, ·OH and O2− have strong oxidation properties to promote the degradation of organic matter that is difficult to adsorb. The raw liquid has an effectively reduced COD value after adsorption treatment when the Fenton reagent catalytic oxidation is added. Compared with conventional treatment technology, deep oxidation technology has the advantages of a wide range of use, high treatment efficiency, fast oxidation speed, and less secondary pollution [24].

1.3. Fenton Reagent Treatment of Gasoline Alkali Residue Stock Solution from Kashi Refinery

Kashi petroleum refinery produces about 50,000 tons of alkali residue stock solution per year during the refining years, which are primarily concentrated in stock solution pools around Kashi. The treatment of the raw slag generated by the Kashi petrochemical plant is extremely urgent since its high alkalinity and long-term accumulation subject the protective layer at the bottom of the pool to the dangers of leakage and infiltration. Based on the traditional wet oxidation method, the organic matter in the raw solution generally has a high COD value (above 20,000 mg/L), and the degradation requires 250–350 °C high temperature and 30–80 MPa pressure, which increases the cost of treatment. Although the Fenton oxidation system has been widely used to treat gasoline alkali residue, it has shortcomings, like low treatment efficiency, slow oxidation rate, limited scope of use, and high costs [25]. To overcome these limitations, the low-cost and sustainable operation of the composite Fenton oxidation must be developed.
After a series of orthogonal tests and one-way tests, optimal process parameters were preferred due to the complexity of the raw alkali slag produced by Kashi petroleum refinery. The process, consisting of pretreatment and Fenton oxidizer, could significantly reduce the COD and TOC removal of the effluent of the raw alkali slag. After several organic substances in the raw slag were adsorbed and treated, the organic substances in the raw slag were further degraded using visible light-Fenton oxidation, ozone-Fenton oxidation, UV-Fenton oxidation. The composite Fenton oxidation technology could significantly reduce the requirements of the treatment equipment while reducing the oxidizer consumption. Consequently, using this process, the raw lye residue of the petrochemical plant reached the sewage discharge standard in Kashi (COD < 1000 mg/L “Petroleum Refining Industry Pollutant Discharge Standard”), and the treated raw liquid could be recycled or discharged into the plant. This waste liquid degradation treatment program has a wide range of applications and is a reference for treating high-concentration organic raw liquids generated by most petrochemical enterprises.

2. Experimental Section

2.1. Pretreatment of the Alkali Residue Liquid

Alkali residue liquid (500 mL) from Kashi petrochemical refinery was taken, and 0.1% polyacrylamide flocculant for sewage was added to the filtrate A (COD = 25,041 mg/L) after filtration with 30 min of stirring. Heavy snowflake precipitation appeared, with an obvious effect of flocculation. After flocculation of the liquid B (COD = 11,500 mg/L), after filtration by adding 5% of activated carbon sewage adsorbent, it was stirred for 30 min and filtered to obtain filtrate C (COD = 7898 mg/L). Prior to the addition of Fenton reagents (FeSO4·7H2O and H2O2), the alkaline wastewater was actively acidified to the optimal pH of 3.0 using a suitable acid (H2SO4) and NaHCO3 solution. A COD meter (GDYS-101SQ3) was used to determine the COD values (the average of three replicate tests) of the three filtrates, and the results are shown in Figure 1. Compared to the effluent from the filtrate after flocculation and adsorption, the alkali residue in the original solution of the effluent had a significantly higher COD value, indicating that it contained more organic pollutants. The effluents from the filtrate after flocculation and adsorption had significantly reduced COD values, implying that a part of the organic components had been processed, but proper purification was needed to meet the discharge standard.

2.2. Orthogonal Test to Optimize the Fenton Oxidation Conditions

(i) Optimization of the H2O2 concentration: As seen in Figure 1, the COD value of the effluent of the original liquid after pretreatment could be reduced to about 8000 mg/L. The amount of H2O2 was changed according to the proportion shown in Table 1 to investigate the effect of the H2O2 concentration on the removal of the organic substances in the stock solution in Fenton oxidation. After this treatment, the nine samples were placed at room temperature and atmospheric pressure for 4 h, followed by measuring the COD value of the effluent of each test solution using a COD meter for comparison.
(ii) Optimization of the H2O2 and Fe2+ (FeSO4·7H2O) ratios: The pH value of the test solution was adjusted to 3 using a calibrated pH meter (PHG-21C), and the H2O2 and Fe2+ contents were determined by inductively coupled plasma mass spectrometry (ICP-MS) proportionally according to Table 2. The 25 samples with different H2O2 to Fe2+ mass ratios (m(H2O2):m(Fe2+)) were placed at room temperature and atmospheric pressure for 4 h. The COD values of the test liquids were determined using a COD meter for comparison.

2.3. Comparison of the Composite Fenton Oxidizing Treatment Methods

First, 500 mL of raw alkali slag was taken from Kashi Petrochemical Plant, followed by the addition of 0.1% composite flocculant special for sewage into the filtrate after filtration, stirring for 30 min on a heating jacket magnetic stirrer (SH05-3T), and drawing the filtrate. Then, 5% of the special adsorbent for sewage was added, followed by 30 min of stirring and filtration to pre-treat the test solution. Then, 90 mL of the test solution was placed in three 150 mL beakers, which were treated and compared using the following three composite methods.
(1)
Visible light–Fenton method
H2O2 and Fe2+ were added to the test solution according to the H2O2 and Fe2+ injection ratio of 2:0.10. The test solution turned dark black in color, and tiny bubbles were released. Then, the test solution was kept in the sunlight for 4 h. Consequently, the solution was clarified, and it turned light yellow in color. The test solution was labeled as I, and the COD value of its effluent was measured using a COD meter.
(2)
UV–Fenton method
H2O2 and Fe2+ were added to the test solution according to the H2O2 to Fe2+ ratio of 2:0.10. The test solution turned dark black in color, and tiny bubbles (CO2) were released. Then, the test solution was placed under a GPH single-ended four-pin quartz ultraviolet germicidal lamp irradiation with stirring for 4 h. Consequently, the test solution was clarified, but its light yellow color was slightly darker compared to that of test solution I. The test solution was labeled as II, and its COD value was measured using a COD meter.
(3)
Ozone–Fenton method
H2O2 and Fe2+ were added to the test solution according to the H2O2 and Fe2+ injection ratio of 2:0.10. The test solution turned black, and was accompanied by the release of small bubbles (CO2). When O3 was passed through the solution for 1 h, its color changed to brown. The test solution was labeled as III, and its COD value was measured using a COD meter. Furthermore, test solution III was kept under the sunlight for 4 h, and its color was light yellow and clarified. This test solution was labeled as IV, and its COD value was measured using a COD meter.

3. Results and Discussion

3.1. Optimization of the Fenton Oxidation Conditions

During Fenton oxidation, the rate of ·OH generation was positively correlated with the concentration of the added H2O2. As shown in Figure 2, the COD value of the test solution first decreased and then increased as the H2O2 concentration increased. The COD value fell to the lowest value when the H2O2 concentration was 1.4 mol/L. The COD value started to increase gradually when the H2O2 concentration exceeded 1.4 mol/L. This was because the rate of ·OH generation was higher at higher H2O2 concentrations, and the COD value of the test solution decreased significantly under the action of ·OH. When the H2O2 concentration was too high, the excess H2O2 could not decompose to produce more ·OH, and Fe2+ was oxidized to Fe3+ at the beginning of the rapid oxidation, which decreased the COD value of the test solution to the lowest. Instead, Fe2+ was rapidly oxidized to Fe3+ at the beginning of oxidation, and Fe3+ catalyzed the oxidation process to consume H2O2 and reduce the ·OH production. Therefore, the optimized H2O2 concentration in this process was 1.4 mol/L.
As seen in Figure 3, the COD of the test solution gradually increased as the mass ratio of the added H2O2 increased. The 810 mg/L COD value of the test solution at H2O2 and Fe2+ mass ratios of 5 g/100 mL and 0.10 g/100 mL, respectively, was the best COD and TOC removal efficiency in this case. Considering the production cost, using H2O2 at a mass ratio exceeding 5 g/100 mL was not economically viable.
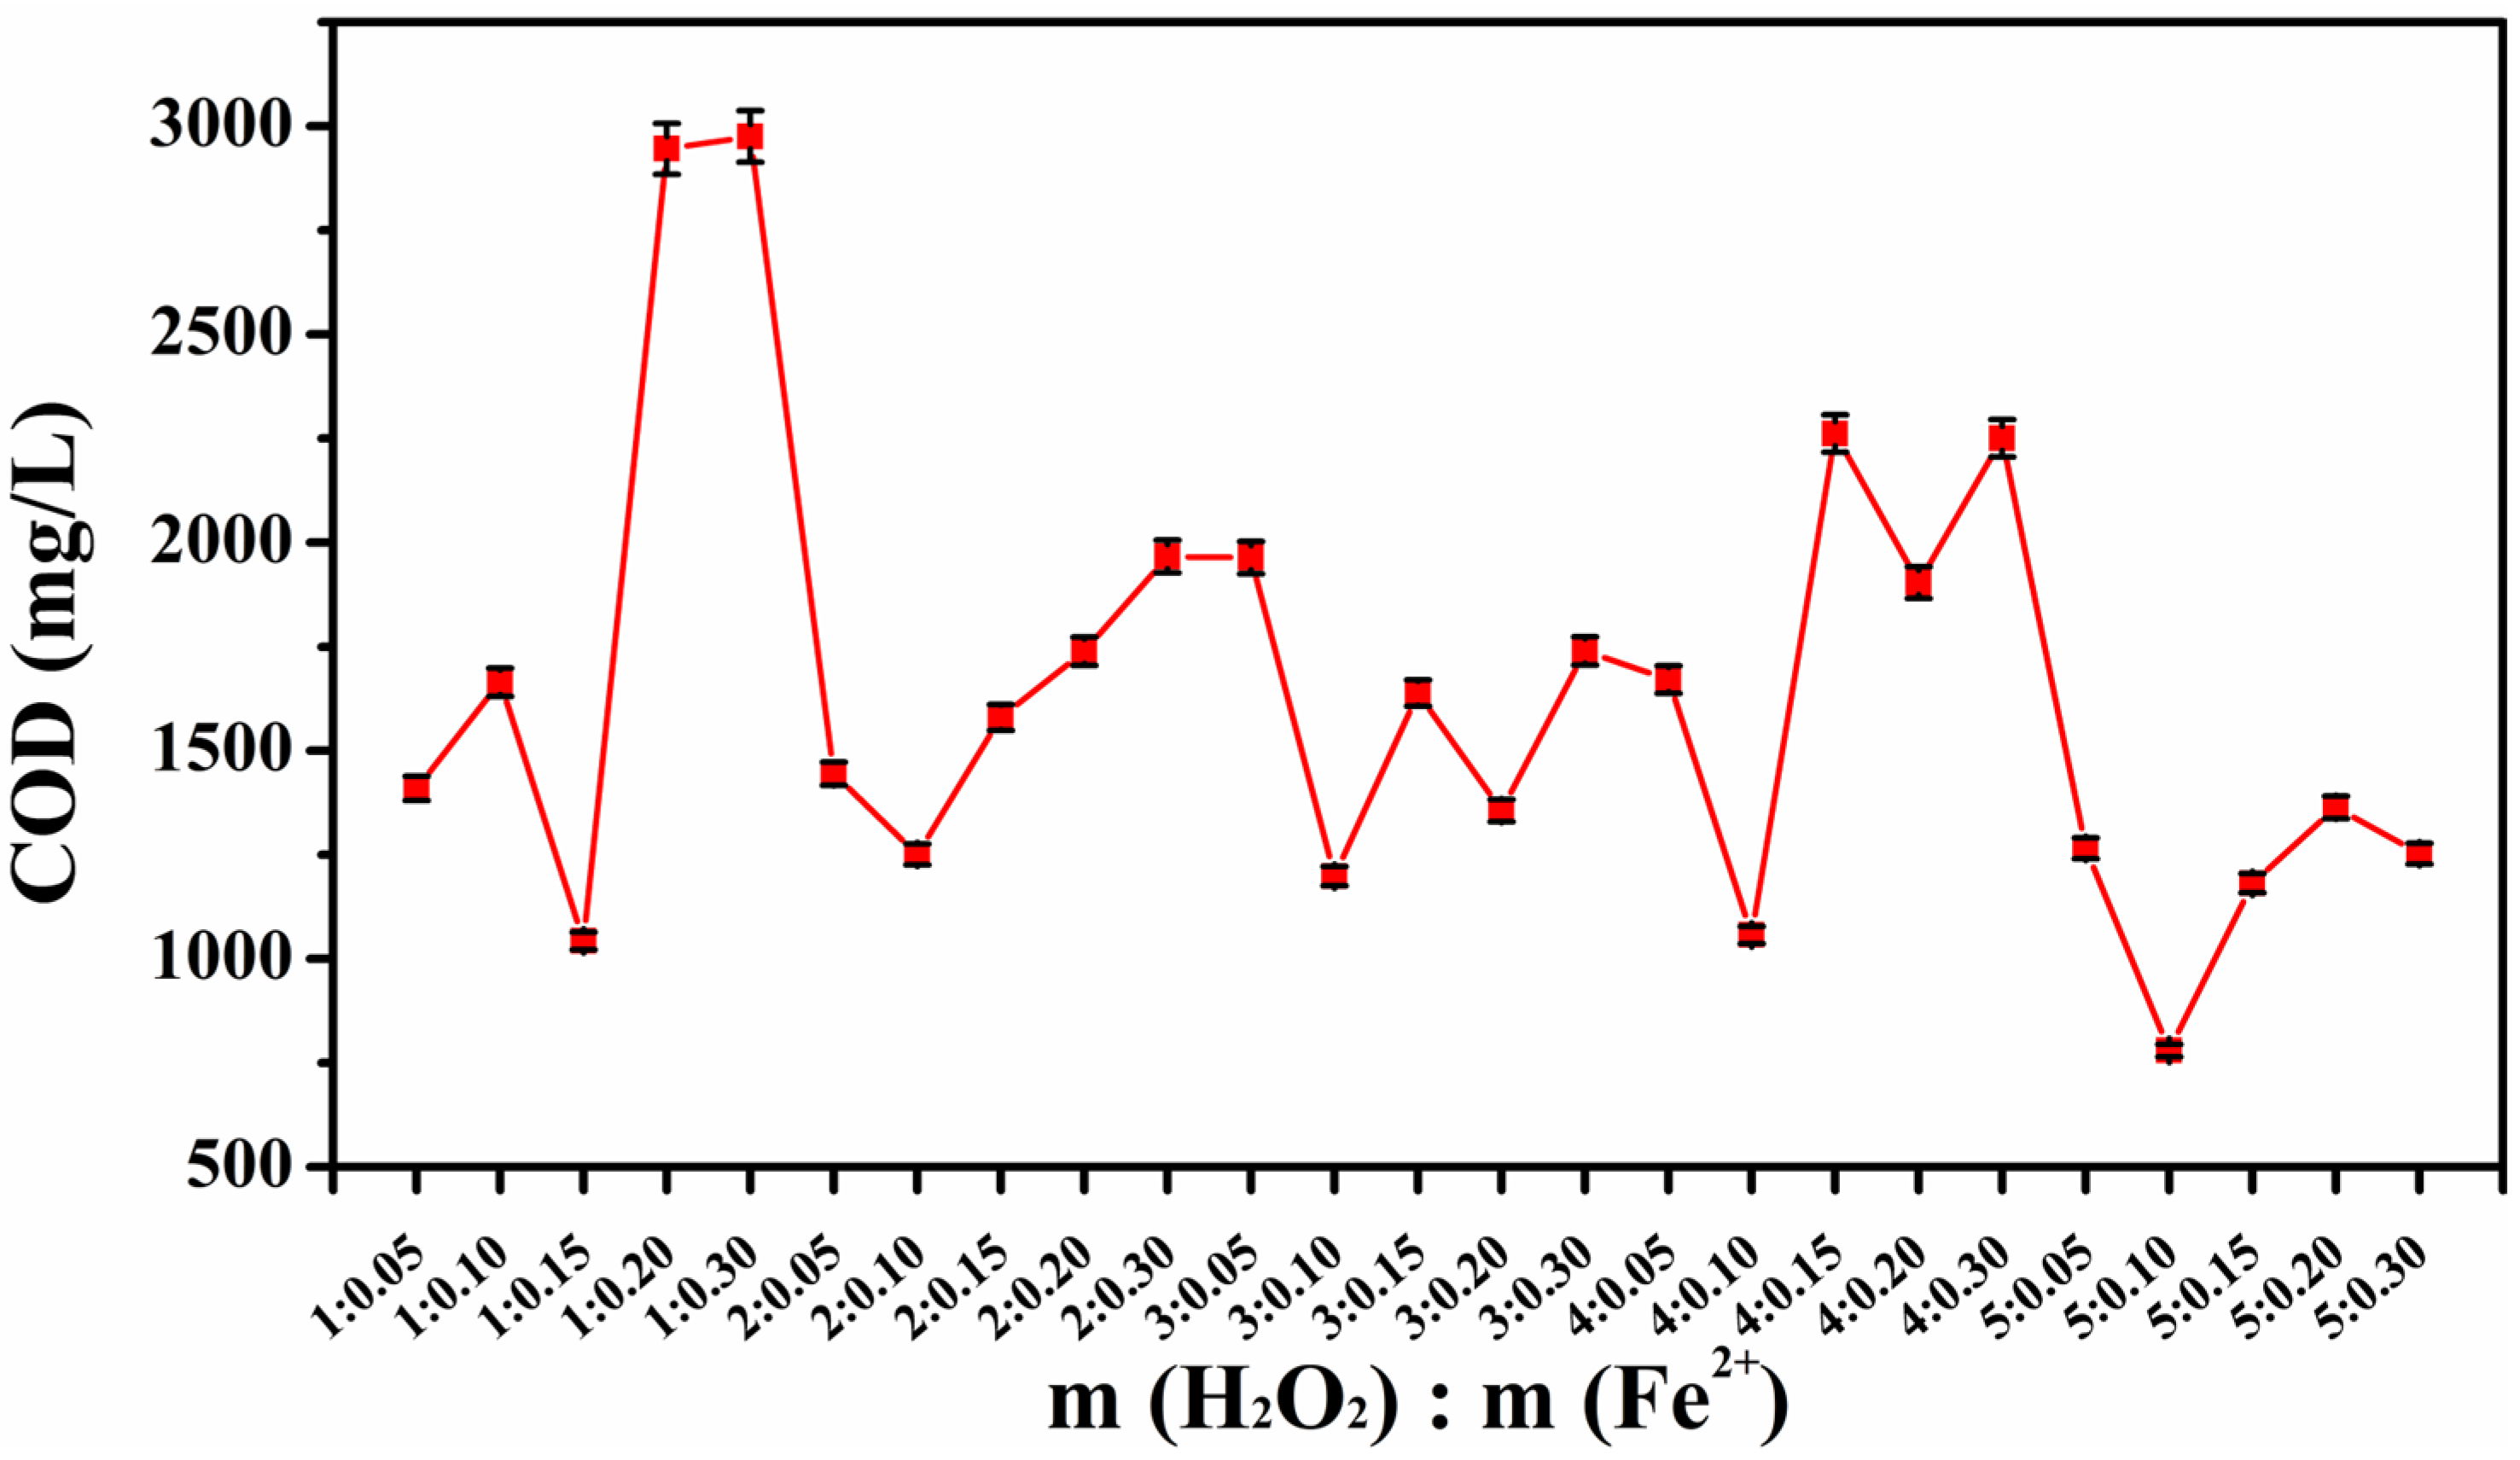
As shown in Figure 4, the COD values had a regular trend for the test solutions with different values of m(H2O2):m(Fe2+). According to the synergistic oxidation characteristics of organic matter using H2O2 and Fe2+ in the Fenton reaction, the COD value was high for low H2O2 ratios for the excess of Fe2+ led to the rapid consumption of H2O2, and the generated ·OH was insufficient for the organic matter degradation. In contrast, the excess H2O2 for excessive H2O2 ratios may have a side reaction with ·OH (H2O2 + ·OH → H2O + HO2·) to reduce the oxidizing efficiency and slow the decrease in the trend of COD. When the H2O2 and Fe2+ ratios were close to the optimal conditions and the ·OH generation rate matched the demands of the organic matter degradation, the reduced COD could be close to the lowest value. The reduction in COD was the most obvious when m(H2O2):m(Fe2+) was 5:0.10. Therefore, to achieve a better removal of organic matter in the stock solution, the optimal m(H2O2):m(Fe2+) determined was 5:0.10.
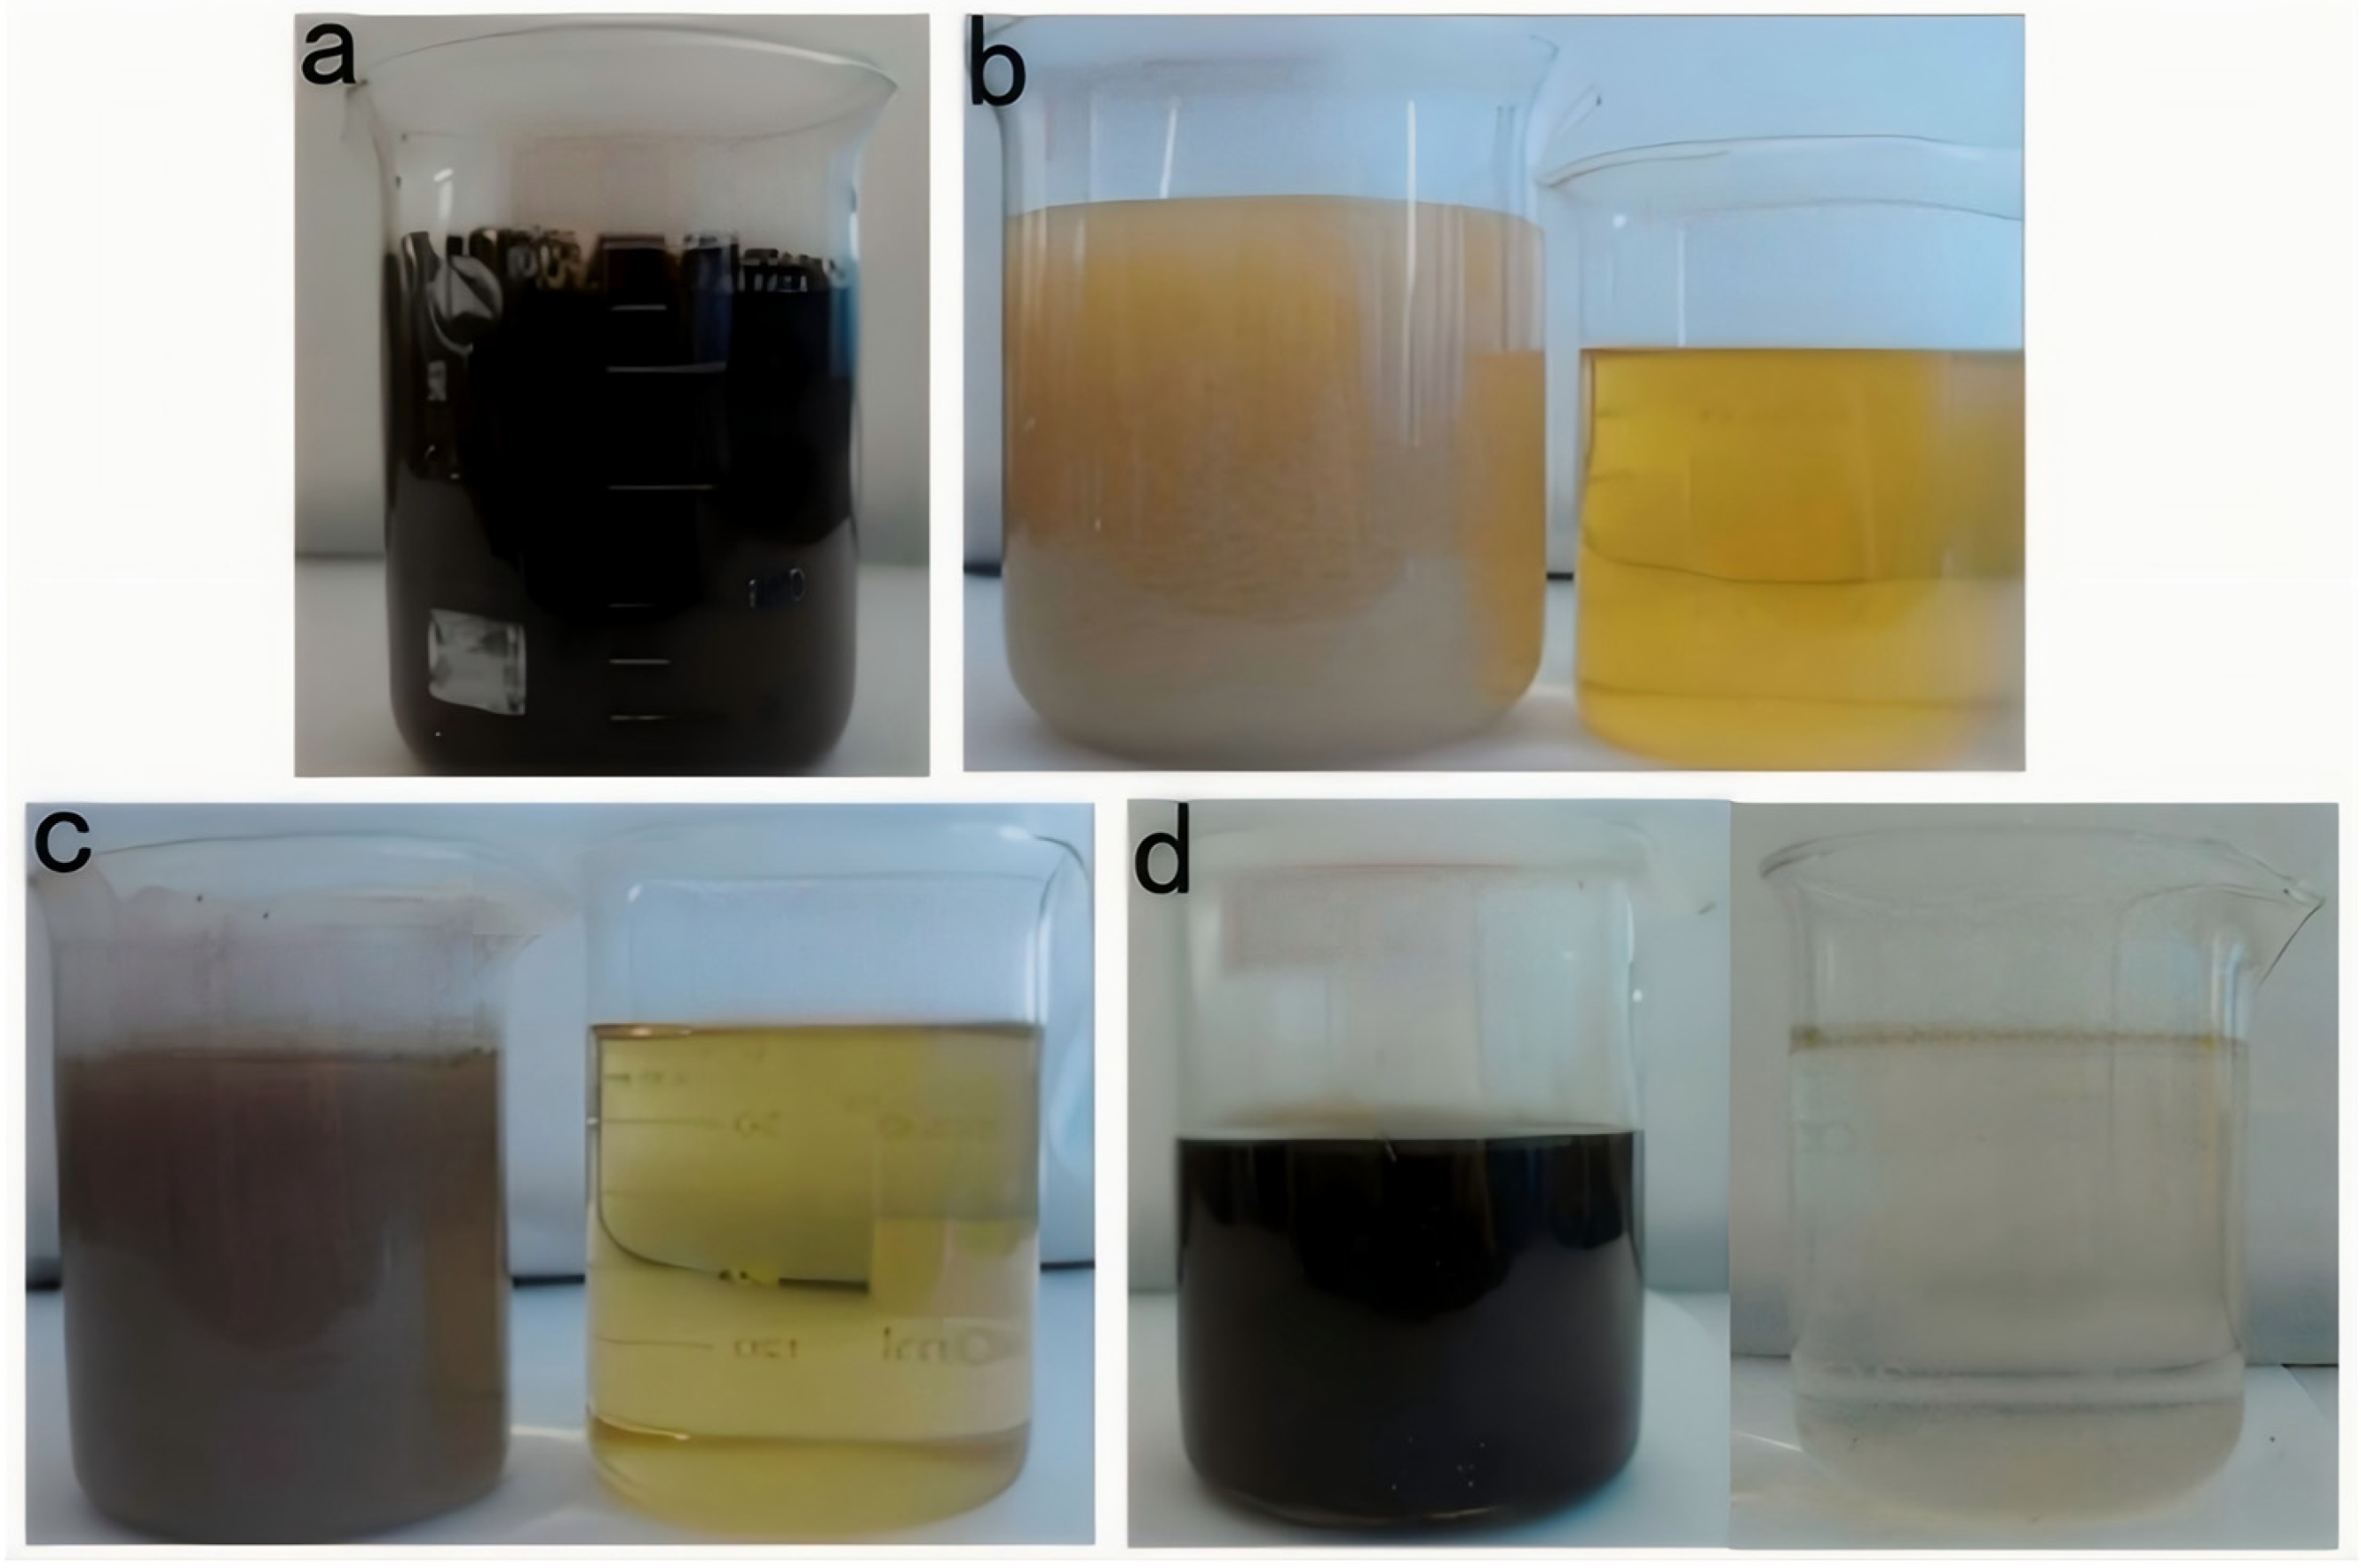
As seen in Figure 5, the raw alkali residue was a black-brown colored turbid liquid, with numerous suspended particles. Additionally, the stratification phenomenon could be seen when it was static. A thick gray–black solid slag was deposited at the bottom, and the low transparency of the liquid in the upper layer indicated a high concentration of organic pollutants and inorganic suspended solids in the original liquid. The high alkalinity of the alkali slag (pH > 13) could be the primary reason for its dark color. After adding the polyacrylamide flocculant, the test solution showed obvious flocculation. At the initial stage, the stock solution changed its color from dark to light brown, and the suspended particles rapidly aggregated to form white or off-white flocs, accompanied by volume expansion (Figure 5b). As the stirring speed was gradually reduced, the flocs gradually sank and the upper layer of the liquid had a significantly improved transparency. Additionally, the charge neutralization effect aggregated the colloidal particles at this stage to ultimately form flocs that could settle down. After treatment with the diatomaceous earth adsorbent, the color of the test solution further lightened to pale yellow (Figure 5c). Numerous dark-colored pollutants attached to the adsorbent surface to form a black granular precipitate, and the suspended matter in the liquid almost completely disappeared. The adsorption process selectively removed the pigments, heavy metal ions, and small organic molecules from the stock solution using physical adsorption and chemical bonding. For the initial phase of the reaction (within the first 10 min), despite a high phenol removal efficiency exceeding 80%, the acute toxicity of the effluent, as assessed by the inhibition of luminescent bacteria, increases significantly. This initial rise in toxicity is attributed to the generation of transient, yet highly toxic, aromatic intermediates. GC-MS analysis confirmed the presence of key compounds such as p-benzoquinone and catechol (o-dihydroxybenzene), which are known to be more toxic than phenol itself. These intermediates exert their toxic effects through mechanisms like oxidative stress and the formation of protein adducts [26]. Only upon prolonged reaction time (120 min) are these hazardous intermediates effectively mineralized into low-molecular-weight organic acids and ultimately CO2 and H2O, leading to a subsequent significant decrease in the overall toxicity of the treated effluent. After adding Fenton’s reagent (Fe2+/H2O2), the test solution initially turned orange–red (the color of hydrated Fe3+), followed by the color gradually fading with oxidation and finally turning light yellow or colorless. The reaction process was accompanied by the generation of bubbles (O2 release), and reddish-brown flocculent (Fe(OH)3) precipitates appeared at the bottom. The Fe(OH)3 sludge was acidified with H2SO4, which effectively re-dissolved the iron, producing a Fe2(SO4)3 solution. At this stage, the strong oxidizing effect of ·OH decomposed the hard-to-degrade organic matter into CO2 and H2O, while Fe2+ was oxidized to Fe3+, and Fe(OH)3 precipitate could be converted into Fe2(SO4)3. As seen in Figure 6, flocculation, adsorption, and Fenton oxidation significantly reduced the COD value of raw alkali residue liquid, indicating that the process could effectively remove the organic substances in the raw liquid.

3.2. Oxidation Mechanism of the Fenton Reaction

3.2.1. Analysis of the Fenton Oxidation Mechanism

The Fenton reagent had a strong oxidizing ability because the system contained Fe2+ and H2O2, Fe2+ catalyzed H2O2 to generate ·OH, and ·OH had a stronger redox potential compared with other oxidants [27]. As seen in Table 3, the pH value significantly influenced the Fenton system, and a pH value that was too high or too low was not conducive to generating ·OH. An excessively high pH value would inhibit the content of ·OH generated. The reduction of Fe3+ to Fe2+ was difficult when the pH value was too low, and the insufficient supply of Fe2+ was not conducive to generating ·OH. The H2O2 and Fe2+ contents significantly affected the generation of ·OH. When the H2O2 and Fe2+ contents were low, the generated ·OH content was relatively small. At the same time, H2O2 was the capture agent of ·OH, and a too high H2O2 dosage could cause the initial generation of ·OH to be lost. Additionally, too high Fe2+ dosage could generate a large content of reactive ·OH in H2O2 at the beginning of the reaction under high catalyst concentration. Additionally, the restricted reaction between ·OH and the substrate led to the accumulation of the unconsumed free ·OH and reaction of ·OH with each other to generate water, resulting in the partial consumption of the initially generated ·OH [28]. Therefore, a too high Fe2+ dosage was not conducive to generating ·OH, and the Fe2+ to H2O2 dosage ratio was to be strictly controlled in practical applications.

3.2.2. The Composite Fenton Oxidation System Mechanism

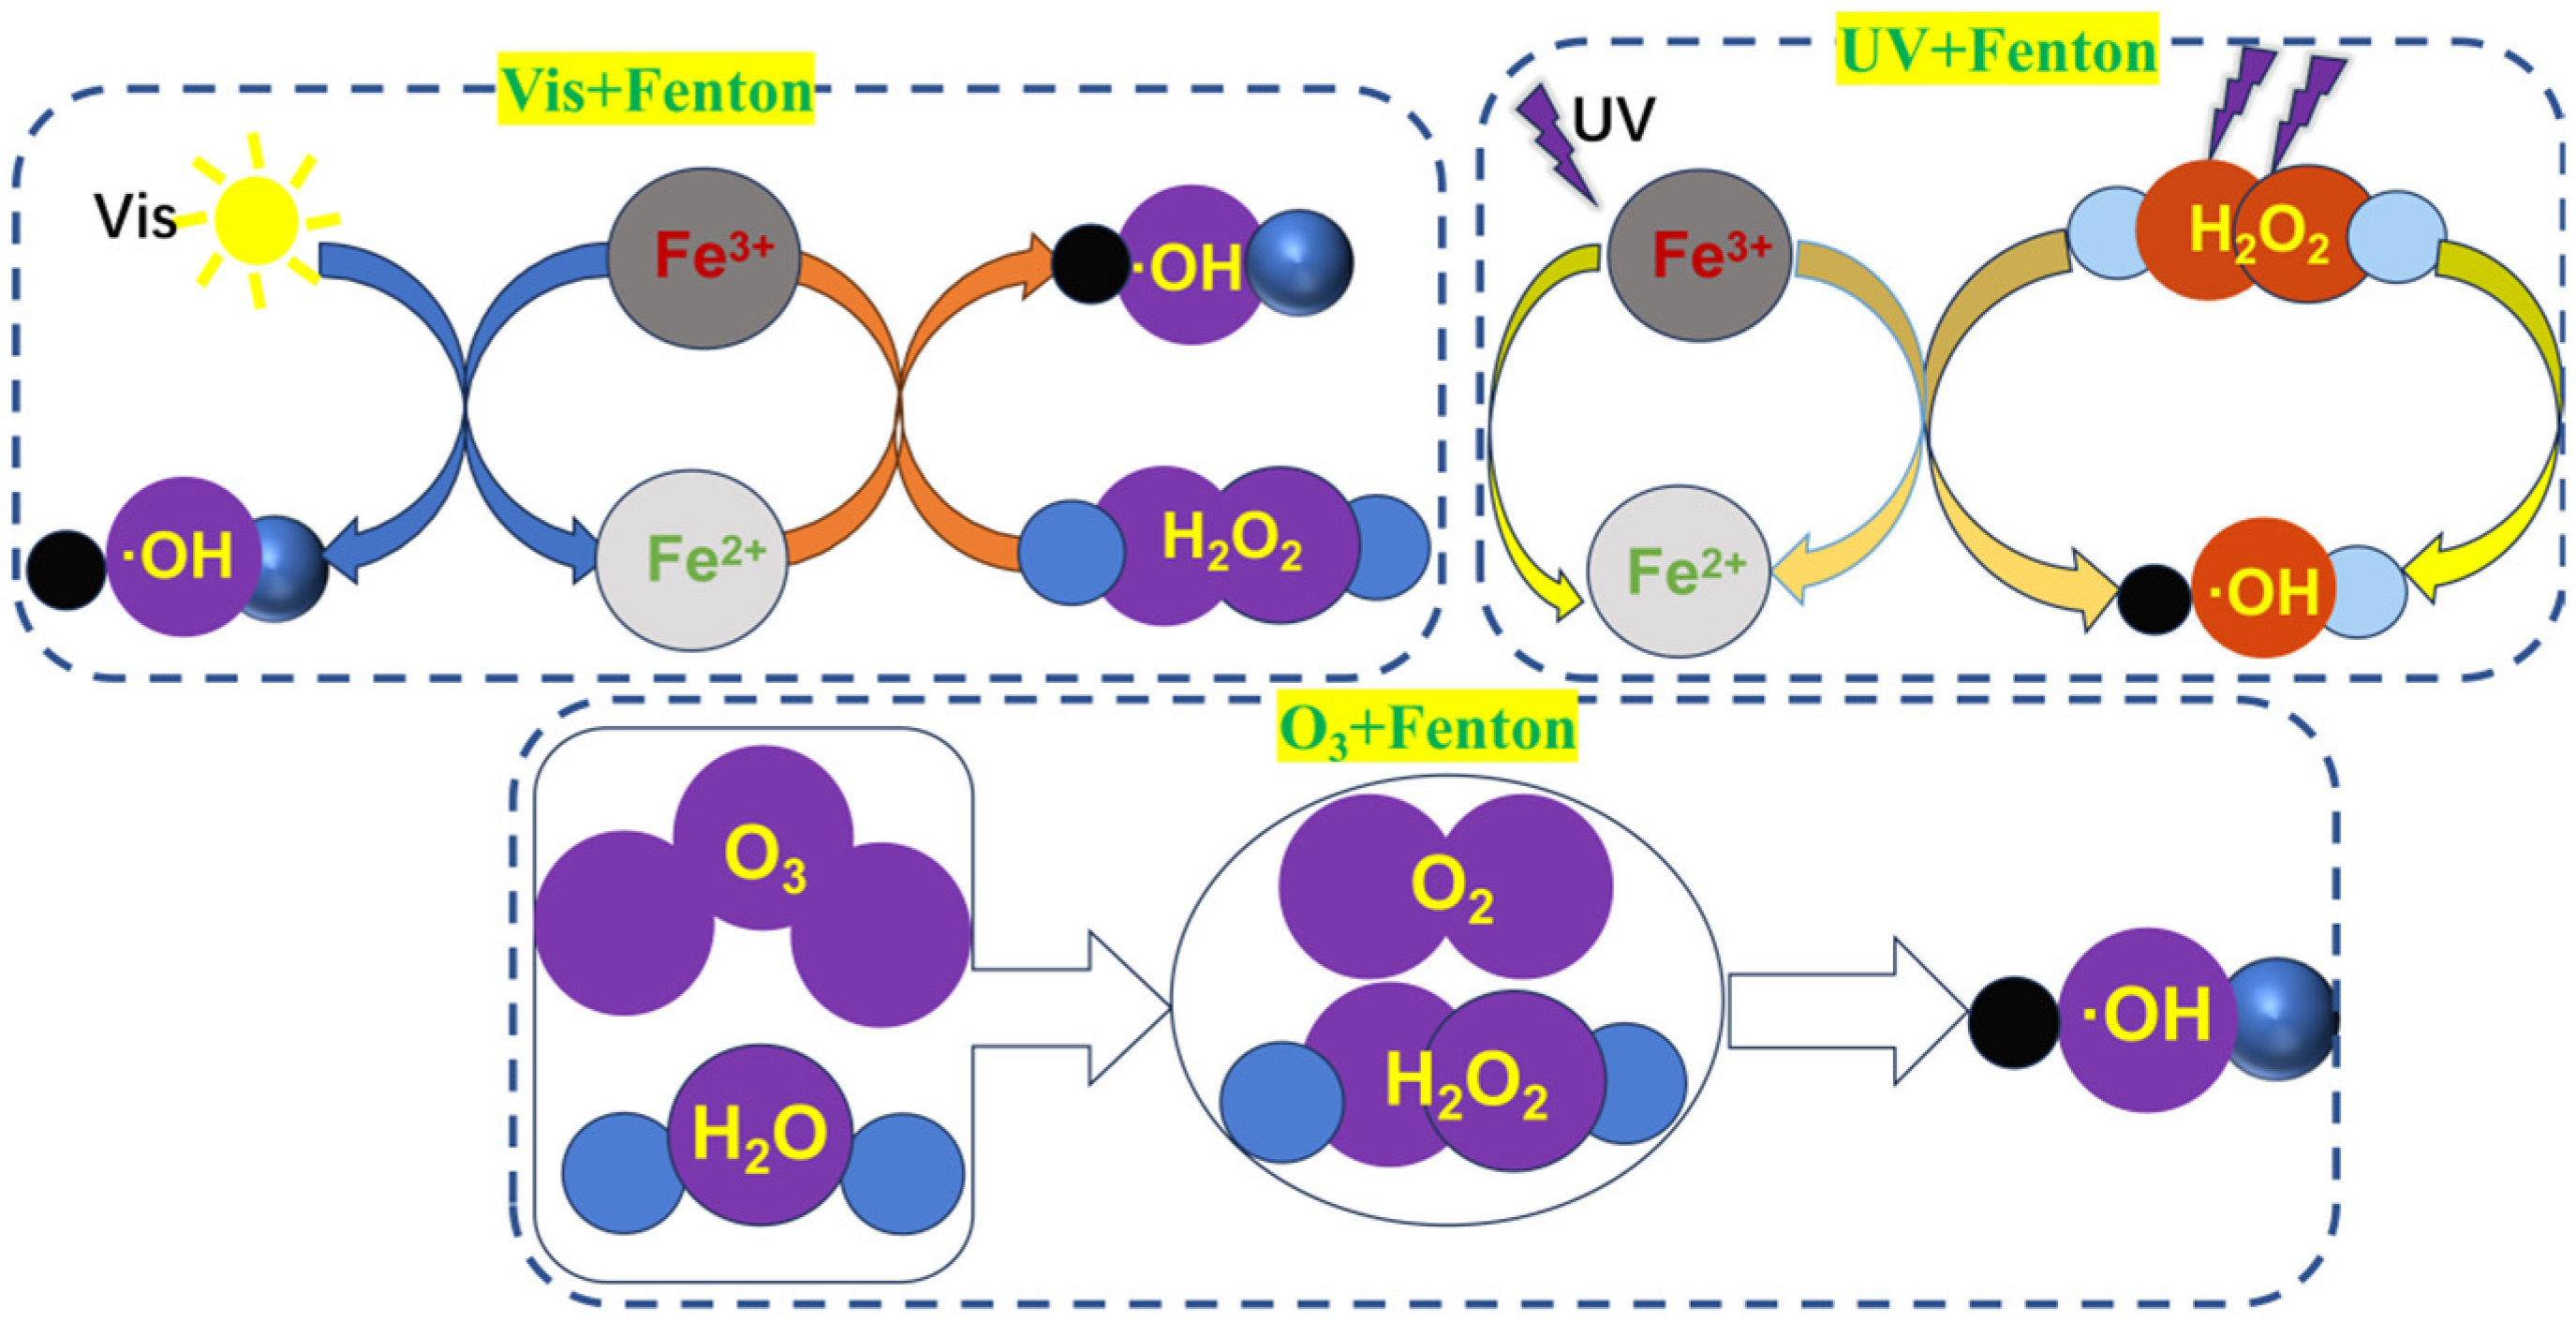
Numerous studies are exploring the use of inexpensive materials to improve the Fenton oxidation system to reduce its processing cost (Figure 7). The common composite Fenton oxidation systems are categorized into the following:
(1)
Visible light–Fenton method
Light could significantly improve the degradation efficiency in the oxidation process of Fenton reagents. The visible light-assisted Fenton oxidation system is known as the visible light–Fenton method (Vis–Fenton method). The results of the oxidative degradation of the phenol stock solution using the Vis–Fenton method showed that the suitable pH value for the reaction was between 3 and 4. Additionally, the participation of moderate Fe2+ contents in the Vis–Fenton method could help phenol degradation, but an excessive Fe2+ content was not conducive to phenol degradation [29]. The visible light–Fenton oxidation could increase the COD/TOC ratio from 0.10 to 0.32 and improve the biochemical degree.
(2)
Ultraviolet–Fenton (UV–Fenton)
Compared to the Vis–Fenton method, the UV–Fenton oxidation method had a stronger ability to treat the stock solution due to the synergistic effect of UV light and the catalytic effect of Fe2+ on H2O2. Additionally, the method could reduce the Fe2+ dosage and increase the H2O2 utilization rate. The results showed that oxalate and citrate introduced into the UV–Fenton system could effectively improve the utilization of UV light resulting in the UV/ferric oxalate complex-H2O2 method, where the ferric oxalate complex strongly absorbed UV light, and the quantum yield under visible light irradiation could reach 1.0–1.2, so that the Fenton reagent can continue to be provided [30]. The UV/iron oxalate complex-H2O2 method was an extension of the UV–Fenton method, which improved the energy utilization and saved the use of H2O2.
(3)
Ozone-Fenton (O3-Fenton)
Compared to the ordinary Fenton method, the Vis–Fenton method could effectively improve the mineralization of organic matter. However, it had the disadvantages of low photoefficiency and an imperfect automatic H2O2 generation mechanism. The essence of the O3–Fenton method was to combine the Fenton oxidation treatment and O3 oxidation. It could degrade more types of organic matter, in addition to processes, including ·OH oxidation and O3-enhanced oxidation [31]. Presently, there are not many reports on adding O3 in the oxidation process of the Fenton reagent, and the O3–Fenton method can become a major research hotspot for the Fenton oxidation technology, considering the development history of the Fenton reagent.

3.3. Treatment Results of the Composite Fenton Oxidation System

As seen in Figure 8, the raw alkali slag treated with different composite Fenton oxidation systems had different COD values. Compared with the original liquid, the Vis-Fenton method could reduce the COD value to 1330.4 mg/L. As H2O2/Fe2+ or the reaction time increased, the oxidation efficiency gradually increased since visible light could only stimulate the reduction of Fe3+ to Fe2+ to maintain the catalytic cycle of the Fenton reaction, but the utilization of its light energy was limited, which decreased the ·OH generation rate. The O3–Fenton+Vis method could reduce the COD value of the raw alkali slag solution to 894.9 mg/L, which was better than the degradation effect of the Vis–Fenton or O3–Fenton method. This was due to the strong oxidizing property of O3 and the synergistic effect of the Fenton reaction to increase the ·OH yield. Visible light promoted the reduction of Fe3+ to reduce the generation of the iron sludge [32]. The UV–Fenton method was the most obvious method for reducing the COD value of the original solution since UV light could efficiently stimulate the reduction of Fe3+ to Fe2+ to accelerate Fenton oxidation. Additionally, the significantly increased ·OH could have resulted in the direct photolysis of the organic matter, which further enhanced the COD removal effect.
After pretreatment, the alkali residue gradually changed its color from dark brown to colorless, and the suspended matter and sediment underwent the dynamic change in “aggregation-adsorption-oxidative degradation”. Primarily, the flocculation and adsorption stages physically separated the pollutants, while the Fenton oxidation completely degraded the organic matter through chemical reactions. As seen in Figure 9a, the original alkali residue solution showed the characteristic Fe3+ color after flocculation. Fe3+ was photo-reduced to Fe2+ with the introduction of visible light, and the solution gradually changed its color to light yellow. In the middle of the reaction, the solution changed its color from light green to turbid brown–yellow since a large ·OH content was generated and the organic matter was effectively degraded. At the end of the reaction, the organic pollutants were effectively degraded, the solution had increased transparency, and the color turned light yellow or nearly colorless. With the oxidation of Fe2+ to Fe3+, a part of Fe3+ hydrolyzed to produce a reddish-brown flocculent precipitate (Fe(OH)3), which was seen in a small amount at the bottom. Visible light effectively promoted the reduction of Fe3+ (Fe3+ + H2O + hν → Fe2+ + ·OH + H+), maintained Fe2+ recycling, and continuously generated ·OH to accelerate the oxidation of organic matter.
As seen in Figure 9b, the initial solution was light-yellow colored after flocculation and adsorption of the alkali slag stock solution. Under the O3 irradiation, the test solution turned reddish-brown within 10 min (Fe2+ concentration increased). As the reaction continued, the organic matter broke the bond to generate small molecule intermediates (such as carboxylic acid), and the color of the solution gradually turned from dark green to light yellow to ultimately become colorless and transparent. The Fe3+ cycling rate was accelerated under the high energy provided by O3, which generated a small amount of Fe(OH)3 precipitation and fine particles to obtain a dispersed yellowish suspension, accompanied by tiny bubbles (O2 generated by the O3 decomposition) during the reaction. At the end of the reaction, the precipitates were partially dissolved, and the solution had a higher clarity than during the Vis–Fenton method. O3 directly oxidized the organic matter (O3 + organic matter → intermediate product), and simultaneously reacted with Fe2+ (O3 + Fe2+ → Fe3+ + O3), which strengthened the free radical chain reaction and enhanced the reaction of O3 with Fe3+ to intensify the free radical chain reaction. When the alkali slag stock solution was passed through the UV light, it quickly turned dark brown as the reaction proceeded (UV and Fe2+ reacted to generate Fe3+ and ·OH) due to the accumulation of organic oxidation, and ultimately turned lighter in color to finally turn colorless (Figure 9c). The strong oxidizing properties of the UV light rapidly generated Fe3+, resulting in numerous black-brown precipitates (FeO(OH) or Fe2O3). At the end of the reaction, the precipitates were collected at the bottom, and the upper layer of the solution was clarified. The UV light directly cracked H2O2 (H2O2 → 2 ·OH) and stimulated the organic matter to produce the reactive intermediate, which synergistically worked with the Fenton reagent and remarkably enhanced the degradation effect.
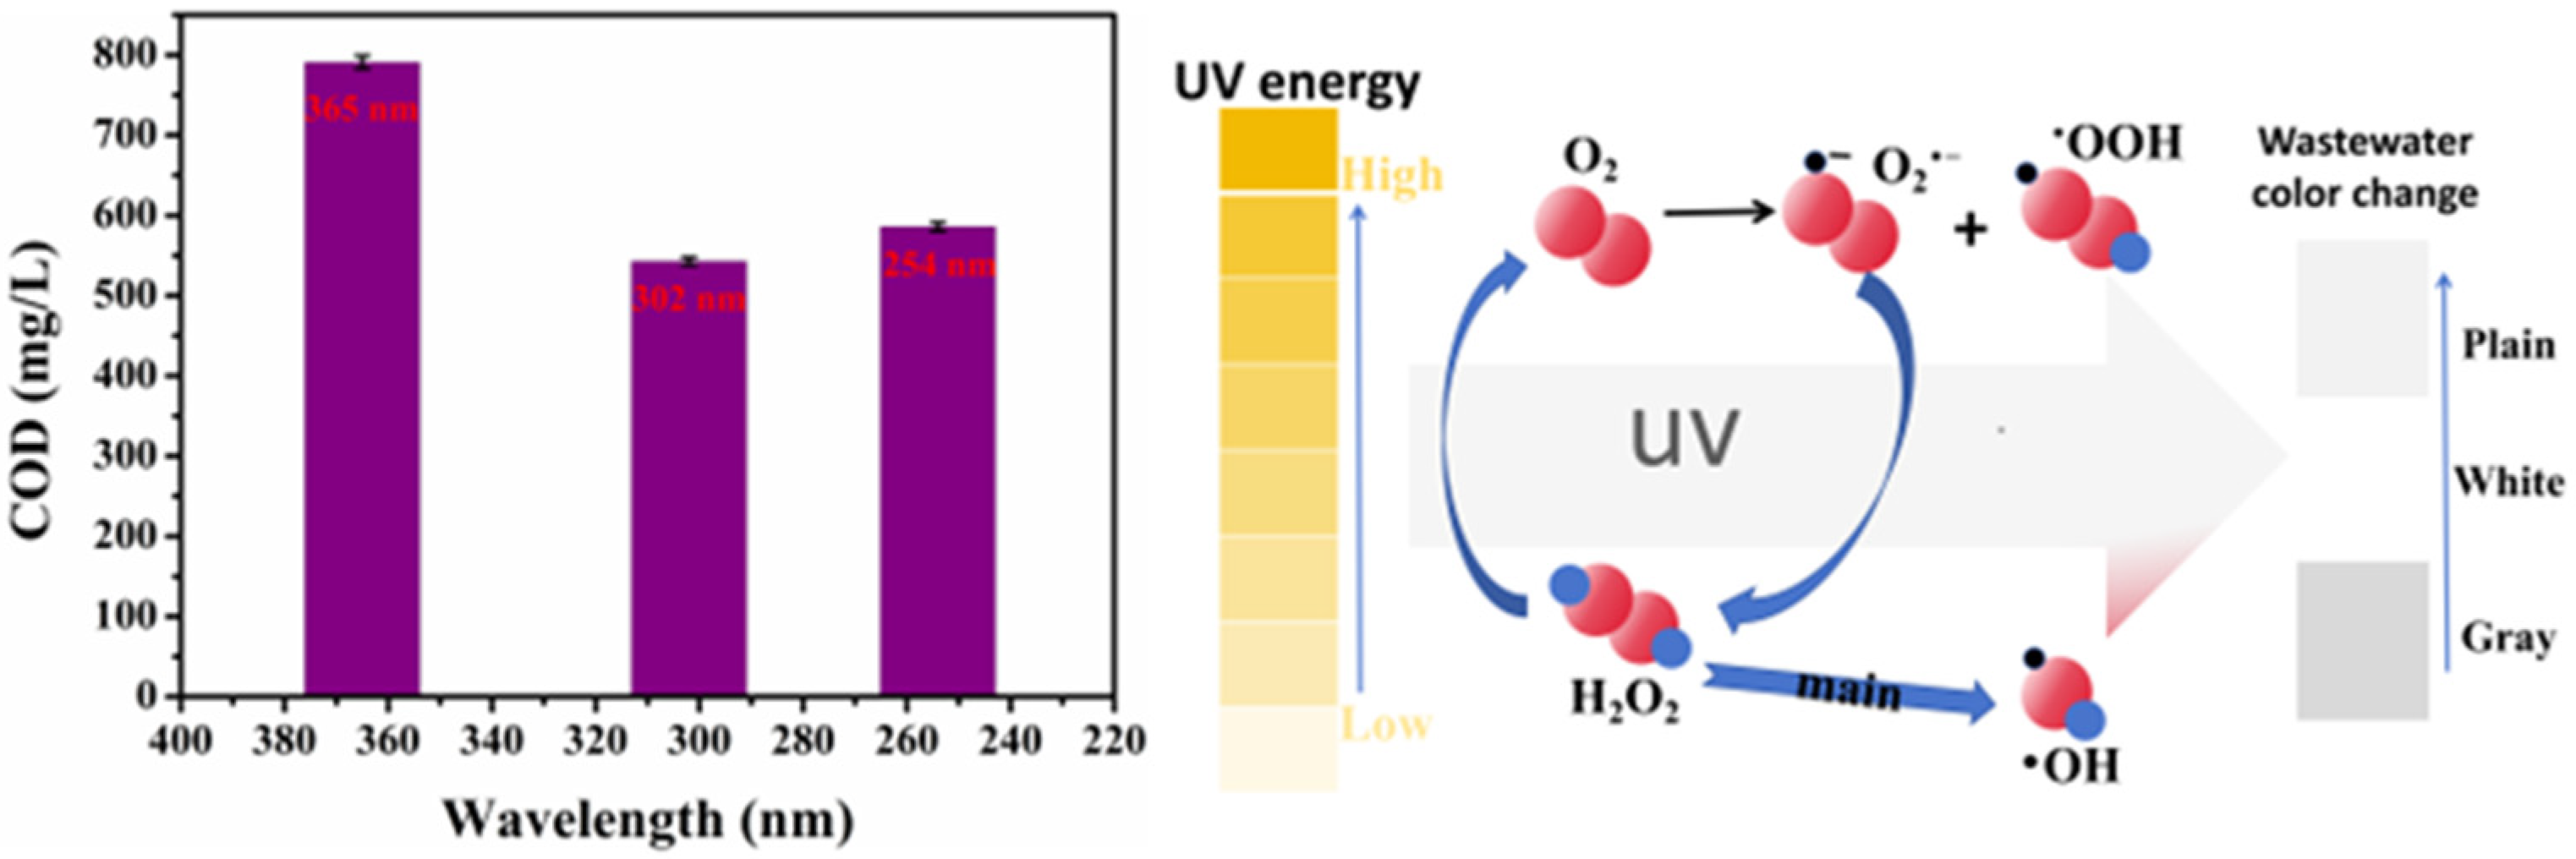
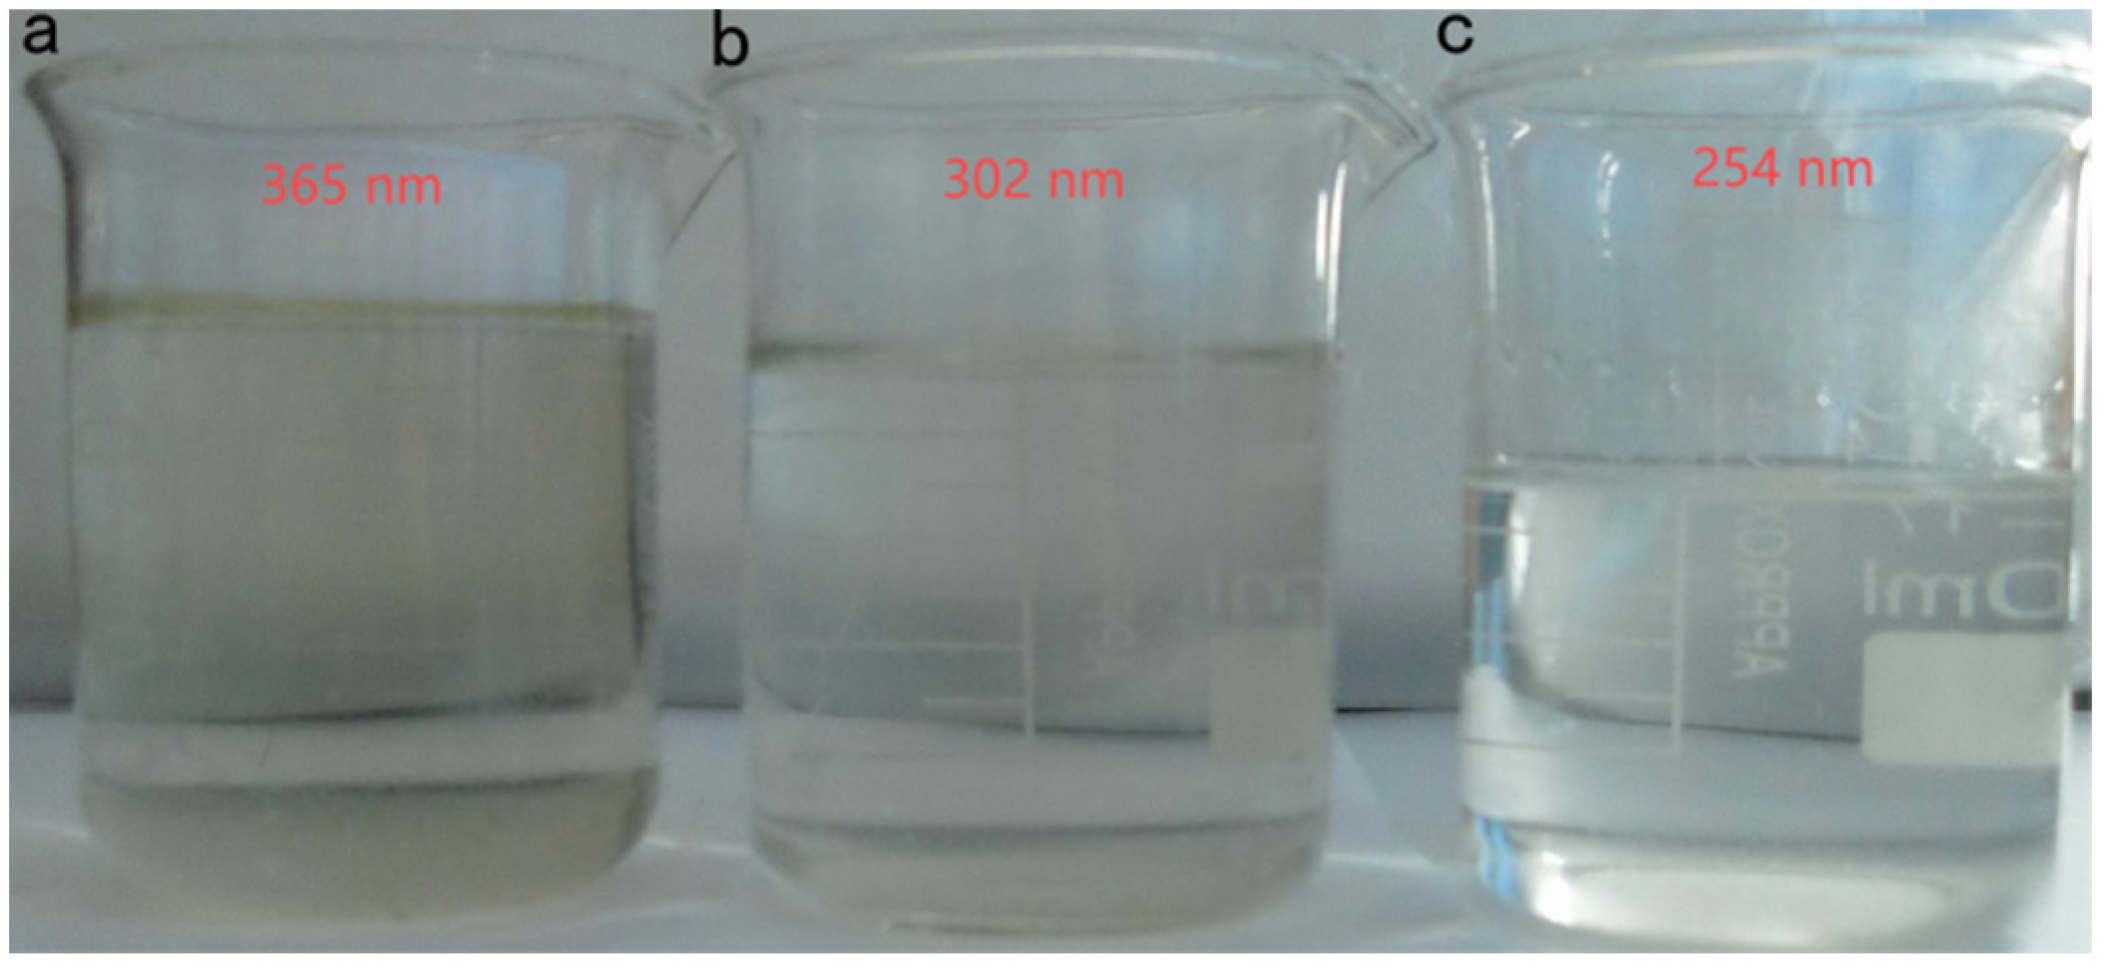
Due to the different UV energies, the degradation effect on the original liquid had some differences (Figure 10). The treatment effect of different wavelengths of the UV-Fenton method on the stock solution was not directly proportional to the UV energy [33]. The COD reduction rate was slow after the UV intensity was increased to a certain degree. The 365 nm UV light was not enough to efficiently degrade the stock solution and could only oxidize part of it, which increased the COD value. The degradation ability of the stock solution increased as the UV energy increased. The COD value of the stock solution reached 543 mg/L when a 302 nm UV light was used for degradation. The degradation ability (TOC removal was 96.9%) of the stock solution was not enhanced as the UV energy continued to increase because the UV absorption capacity of the stock solution had reached its peak, and most of the UV light was not absorbed to produce more ·OH. As seen in Figure 11, the stock solution degraded by a 302 nm UV–Fenton wavelength no longer contained flocculent precipitation, indicating that the UV–Fenton method at this wavelength could sufficiently degrade the stock solution. The high-energy UV light was efficient in degrading small organic molecules and could inhibit the generation of colored intermediates.

4. Conclusions

This study explored the use of Fenton oxidation for treating gasoline alkali residue stock liquids. Additionally, the influence of various factors on the degradation effect of stock liquids was analyzed. The gasoline alkali residue stock liquids during the production of Kashi refinery were experimentally studied to realize the optimal reaction conditions for treating this kind of stock liquid, and the primary conclusions are as follows:
(1)
In the experiment for optimizing the H2O2/COD ratio, the H2O2 concentration was optimized. The ·OH generation rate was found to be positively correlated with the H2O2 concentration. The COD and TOC removal first increased and then decreased with the increased H2O2 concentration. The ·OH generation rate was higher for a higher H2O2 concentration. Excessive H2O2 could quickly oxidize Fe2+ to Fe3+ at the beginning of the reaction, and result in Fe3+-catalyzed oxidation, which consumed H2O2 and inhibited ·OH generation to gradually increase the COD value. The COD value was reduced to the lowest when the H2O2 concentration was 1.4 mol/L.
(2)
The orthogonal test to optimize the mass ratios of H2O2/Fe2+ found that the COD removal first increased and then decreased as the Fe2+ concentration increased. COD had the most obvious reduced value when m(H2O2):m(Fe2+) was 5:0.10.
(3)
Effective pretreatment made the degradation effect of the Fenton oxidation treatment of the gasoline alkali residue more obvious. The UV–Fenton method had a more obvious degradation effect compared to the Vis–Fenton and O3–Fenton methods. Considering the production cost of this process, the highest H2O2 concentration was 1.0 mol/L and m(H2O2):m(Fe2+) was 5:0.10. A 302 nm UV–Fenton oxidation wavelength could be used to degrade the raw liquid to remove hazardous substances, and to treat gasoline alkali drugs in a low-investment, environment-friendly, and efficient way.

Author Contributions

Conceptualization, Y.Z. and X.Z.; methodology, Y.Z., X.Z. and Z.L.; validation, Z.Z. and Y.G.; formal analysis, Y.Z. and S.Y.; investigation, H.Q.; data curation, Y.Z. and S.Y.; writing—original draft preparation, Y.Z. and X.Z.; writing—review and editing, Z.Z. and Z.L.; project administration, Z.Z. and Z.L.; funding acquisition, Y.Z., Z.Z. and Z.L. All authors have read and agreed to the published version of the manuscript.

Funding

This work is supported by the Kashi University On-campus Project (2024-2881), Kezilsu Science and Technology Plan Project (KST2024-8), the Social Development Leading Key Projects of Fujian Province (2023Y01010024, 2022Y0080), STS Plan Supporting Project of the Chinese Academy of Sciences in Fujian Province (2023T3073, 2023T3032), Universities Basic Operating Expenses for Scientific Research of Xinjiang Uygur Autonomous Region (XJEDU2025P078), Research Start-up Fee for High-level Talents of Kashi University (GCC2025ZK-006), Tianshan Innovation Team Plan of Xinjiang Uygur Autonomous Region (2023D14002), Kashi Science and Technology Plan Project (KS2022095).

Institutional Review Board Statement

Not applicable.

Informed Consent Statement

Not applicable.

Data Availability Statement

Data are contained within the article.

Conflicts of Interest

The authors declare no conflicts of interest.

References

  1. Yadav, B.; Chavan, S.; Atmakuri, A.; Tyagi, R.D.; Drogui, P. A review on recovery of proteins from industrial wastewaters with special emphasis on PHA production process: Sustainable circular bioeconomy process development. Bioresour. Technol. 2020, 317, 124006. [Google Scholar] [CrossRef] [PubMed]
  2. Shokri, A.; Nasernejad, B. Treatment of spent caustic wastewater by electro-Fenton process: Kinetics and cost analysis. Process Saf. Environ. Prot. 2023, 172, 836–845. [Google Scholar] [CrossRef]
  3. Almomani, F.; Bhosale, R.; Kumar, A.; Khraisheh, M. Potential use of solar photocatalytic oxidation in removing emerging pharmaceuticals from wastewater: A pilot plant study. Sol. Energy 2018, 172, 128–140. [Google Scholar] [CrossRef]
  4. Duan, Y.W.; Wang, S.Z.; Liu, K.; Huang, X.Y.; Mi, Z.X.; Lui, H.; Li, Y.H.; Wang, Y.L. Experimental study on the treatment of printing and dyeing wastewater by supercritical water oxidation based on response surface methodology. Environ. Prog. Sustain. Energy 2025, 44, 14617. [Google Scholar] [CrossRef]
  5. Apul, O.G.; Arrowsmith, S.; Hall, C.A.; Miranda, E.M.; Alam, F.; Dahlen, P.; Sra, K.; Kamath, R.; Mcmillen, S.J.; Sihota, N. Biodegradation of petroleum hydrocarbons in a weathered, unsaturated soil is inhibited by peroxide Oxidants. J. Hazard. Mater. 2022, 433, 128770. [Google Scholar] [CrossRef]
  6. Li, C.; Di, H.; Yang, T.; Huang, T.; Deng, W.; Du, F.; Luo, H. Fe/N/S Co-doped porous carbon from the Co-processing residue of coal and heavy oil for an efficient oxygen reduction reaction. Ind. Eng. Chem. Res. 2023, 62, 2536–2547. [Google Scholar] [CrossRef]
  7. Wang, Y.X.; Zhang, T.A.; Lyu, G.Z.; Guo, F.F.; Zhang, W.G.; Zhang, Y.H. Recovery of alkali and alumina from bauxite residue (red mud) and complete reuse of the treated residue. J. Clean. Prod. 2018, 188, 456–465. [Google Scholar] [CrossRef]
  8. Zhang, Y.H.; Jia, X.; Wang, M.R.; Zhang, H.; Song, X.F.; Wang, C.; Han, Z.N.; Xu, G.W. Fundamentals of NO reduction by liquid wastes: The first application in hazardous waste incineration. J. Clean. Prod. 2024, 449, 141714. [Google Scholar] [CrossRef]
  9. Siddique, M.N.I.; Munaim, M.S.A.; Wahid, Z.B.A. The combined effect of ultrasonic and microwave pre-treatment on bio-methane generation from co-digestion of petrochemical wastewater. J. Clean. Prod. 2017, 145, 303–309. [Google Scholar] [CrossRef]
  10. Tian, X.M.; Song, Y.D.; Shen, Z.Q.; Zhou, Y.X.; Wang, K.J.; Jin, X.G.; Han, Z.F.; Liu, T. A comprehensive review on toxic petrochemical wastewater retreatment and advanced treatment. J. Clean. Prod. 2020, 245, 118692. [Google Scholar] [CrossRef]
  11. Maroudas, A.; Pandis, P.K.; Chatzopoulou, A.; Davellas, L.R.; Sourkouni, G.; Argirusis, C. Synergetic decolorization of azo dyes using ultrasounds, photocatalysis and photo-fenton reaction. Ultrason. Sonochem. 2021, 71, 105367. [Google Scholar] [CrossRef]
  12. Tiburtius, E.R.L.; Zamora, P.P.; Emmel, A. Treatment of gasoline-contaminated waters by advanced oxidation processes. J. Hazard. Mater. 2005, 126, 86–90. [Google Scholar] [CrossRef]
  13. Jiménez, S.; Andreozzi, M.; Micó, M.M.; Álvarez, M.G.; Contreras, S. Produced water treatment by advanced oxidation processes. Sci. Total Environ. 2019, 666, 12–21. [Google Scholar] [CrossRef]
  14. Grbić, J.; Mladenović, D.; Pavlović, S.; Lazović, S.; Mojović, L.; Vuković, A.D. Advanced oxidation processes in the treatment of corn stalks. Sustain. Chem. Pharm. 2023, 32, 100962. [Google Scholar] [CrossRef]
  15. Dang, T.T.; Do, V.M.; Trinh, V.T. Nano-catalysts in ozone-based advanced oxidation processes for wastewater treatment. Curr. Pollut. Rep. 2020, 6, 217–229. [Google Scholar] [CrossRef]
  16. Fenton, H.J.H. Oxidation of tartaric acid in presence of iron. J. Chem. Soc. Trans. 1894, 65, 899–910. [Google Scholar] [CrossRef]
  17. Polli, F.; Zingaretti, D.; Crognale, S.; Pesciaroli, L.; Annibale, A.D.; Petruccioli, M.; Baciocchi, R. Impact of the Fenton-like treatment on the microbial community of a diesel-contaminated soil. Chemosphere 2018, 191, 580–588. [Google Scholar] [CrossRef]
  18. Xu, J.L.; Du, J.; Li, L.; Zhang, Q.J.; Chen, Z.W. Fast-stimulating bioremediation of macro crude oil in soils using matching Fenton pre-oxidation. Chemosphere 2020, 252, 126622. [Google Scholar] [CrossRef] [PubMed]
  19. Li, L.; Zhang, Z.N.; Wang, Y.H.; Xu, J.L. Efficient removal of heavily oil-contaminated soil using a combination of fenton pre-oxidation with biostimulated iron and bioremediation. J. Environ. Manag. 2022, 308, 114590. [Google Scholar] [CrossRef]
  20. Rivas, F.J.; Gimeno, O.; Portela, J.R.; Ossa, E.M.D.; Beltrán, F.J. Supercritical water oxidation of olive oil mill wastewater. Ind. Eng. Chem. Res. 2001, 40, 3670–3674. [Google Scholar] [CrossRef]
  21. Wongfaed, N.; Kongjan, P.; Prasertsan, P.; Thong, S.O. Effect of oil and derivative in palm oil mill effluent on the process imbalance of biogas production. J. Clean. Prod. 2020, 247, 119110. [Google Scholar] [CrossRef]
  22. Nasrin, A.B.; Raman, A.A.A.; Bukhari, N.A.; Sukiran, M.A.; Buthiyappan, A.; Subramaniam, V.; Aziz, A.A.; Loh, S.K. A critical analysis on biogas production and utilisation potential from palm oil mill effluent. J. Clean. Prod. 2022, 361, 132040. [Google Scholar] [CrossRef]
  23. Ayare, S.D.; Gogate, P.R. Sonophotocatalytic oxidation based treatment of phthalocyanine pigment containing industrial wastewater intensified using oxidising agents. Sep. Purif. Technol. 2020, 233, 115979. [Google Scholar] [CrossRef]
  24. Ding, R.; Zhang, D.D.; Gao, Y.X.; Chen, X.; Yang, M. Characteristics of refractory organics in industrial wastewater treated using a Fenton-coagulation process. Environ. Technol. 2021, 42, 3432–3440. [Google Scholar] [CrossRef]
  25. Nidheesh, P.V.; Ganiyu, S.O.; Huitle, C.A.M.; Mousset, E.; Vargas, H.O.; Trellu, C.; Zhou, M.H.; Oturan, M.A. Recent advances in electro-Fenton process and its emerging applications. Crit. Rev. Environ. Sci. Technol. 2023, 53, 887–913. [Google Scholar] [CrossRef]
  26. Marta, V.M.; Fresnedo, S.R.; Inmaculada, O.; Angel, I. Overview of the PCDD/Fs degradation potential and formation risk in the application of advanced oxidation processes (AOPs) to wastewater treatment. Chemosphere 2015, 118, 44–56. [Google Scholar] [CrossRef] [PubMed]
  27. Fernandez, A.C.; Santos, A.; Romero, A.; Dominguez, C.M. Application of chelating agents to enhance Fenton process in soil remediation: A review. Catalysts 2021, 11, 722. [Google Scholar] [CrossRef]
  28. Hara, J. Oxidative degradation of benzene rings using iron sulfide activated by hydrogen peroxide/ozone. Chemosphere 2017, 189, 382–389. [Google Scholar] [CrossRef]
  29. Tang, T.T.; Jin, B.; Zhao, P. Preparation of the photo-Fenton agent MIL-100 (Fe) with high performance in the degradation of nitro explosives. New J. Chem. 2023, 47, 8566–8577. [Google Scholar] [CrossRef]
  30. Hou, C.C.; Lu, G.; Zhao, L.; Yin, P.H.; Zhu, L.F. Estrogenicity assessment of membrane concentrates from landfill leachate treated by the UV-Fenton process using a human breast carcinoma cell line. Chemosphere 2017, 180, 192–200. [Google Scholar] [CrossRef]
  31. Ikhlaq, A.; Munir, H.M.S.; Khan, A.; Javed, F.; Joya, K.S. Comparative study of catalytic ozonation and Fenton-like processes using iron-loaded rice husk ash as catalyst for the removal of methylene blue in wastewater. Ozone Sci. Eng. 2019, 3, 41. [Google Scholar] [CrossRef]
  32. Huguenot, D.; Mousset, E.; Hullebusch, E.D.; Oturan, M.A. Combination of surfactant enhanced soil washing and electro-Fenton process for the treatment of soils contaminated by petroleum hydrocarbons. J. Environ. Manag. 2015, 153, 40–47. [Google Scholar] [CrossRef] [PubMed]
  33. Zhong, Y.H.; Yu, L.; Chen, Z.F.; He, H.P.; Ye, F.; Cheng, G.; Zhang, Q.X. Microwave-assisted synthesis of Fe3O4 nano-crystals with predominantly exposed facets and their heterogeneous UVA/Fenton catalytic activity. ACS Appl. Mater. Interfaces 2017, 9, 29203–29212. [Google Scholar]
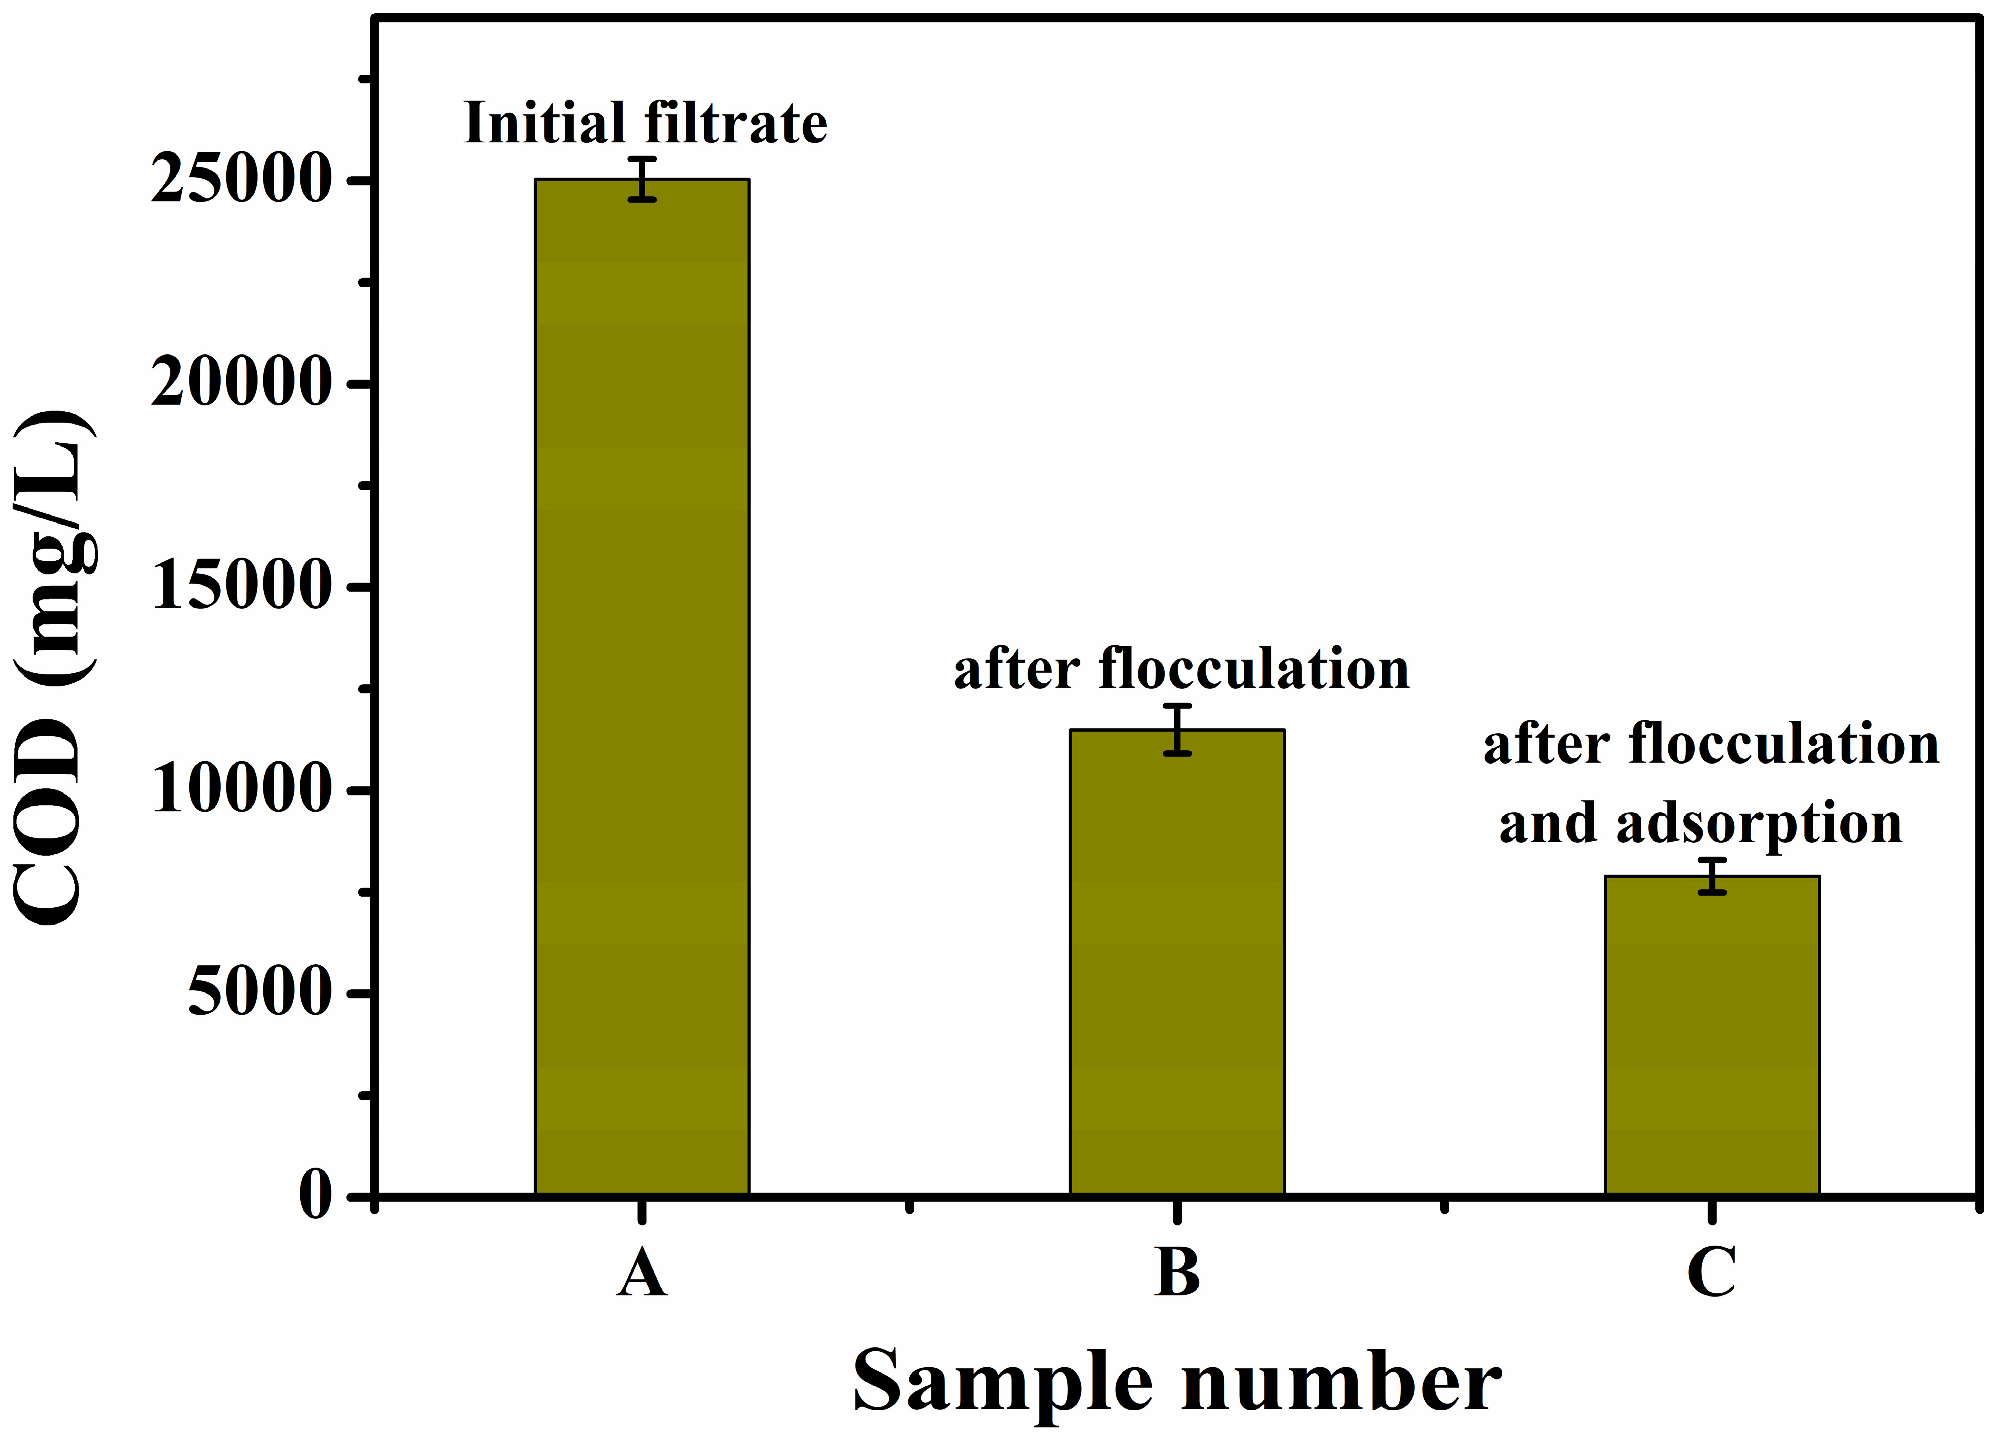
Figure 1. COD values of the effluents of different filtrates of the alkali slag after pretreatment.
Toxics 13 00871 g001
Figure 2. COD variation curves of the test solutions with different H2O2 contents.
Toxics 13 00871 g002
Figure 3. Effect of the H2O2 to Fe2+ ratio on the COD value.
Toxics 13 00871 g003
Figure 4. COD values of the test solutions with different preferred H2O2 and Fe2+ mass ratio dosages in the orthogonal test.
Toxics 13 00871 g004
Figure 5. Photographs of raw alkali slag after different treatment stages. (a) Raw alkali slag, (b) test solution after flocculation, (c) test solution after adsorption, and (d) test solution after oxidation by adding Fenton’s reagent.
Toxics 13 00871 g005
Figure 6. Changes in the COD values of the alkali slag after different treatment stages.
Toxics 13 00871 g006
Figure 7. Schematic diagram of the mechanism of different composite Fenton oxidation treatments.
Toxics 13 00871 g007
Figure 8. COD values of different composite Fenton oxidation systems after treating the alkali slag stock solution.
Toxics 13 00871 g008
Figure 9. Photographs of three different composite Fenton oxidation treatments. (a) The Vis–Fenton method, (b) the O3–Fenton method, and (c) the UV–Fenton method.
Toxics 13 00871 g009
Figure 10. COD values after the stock solution was treated using the UV–Fenton method at different wavelengths.
Toxics 13 00871 g010
Figure 11. Photographs of the UV–Fenton-degraded test solution at different wavelengths. (a) 365 nm, (b) 302 nm, and (c) 254 nm.
Toxics 13 00871 g011
Table 1. Optimization of the H2O2 concentration.
Sample NumberH2O2 Concentration (mol/L)COD Values (mg/L)
10.2 mol/L3816.5
20.4 mol/L3252.1
30.6 mol/L2702.4
40.8 mol/L1975.3
51.0 mol/L1639.7
61.2 mol/L1489.2
71.4 mol/L1321.6
81.6 mol/L2943.2
91.8 mol/L3424.9
Table 2. Optimization of the H2O2 and Fe2+ ratio in orthogonal test.
Sample Numberm(H2O2):m(Fe2+)COD Values (mg/L)Sample Numberm(H2O2):m(Fe2+)COD Values (mg/L)
11:0.051454.7163:0.201511.3
21:0.101360.2173:0.251601.2
31:0.151815.4183:0.301703.2
41:0.202042.3194:0.051733.7
51:0.252404.2204:0.101081.3
61:0.302529.8214:0.151748.1
72:0.051505.4224:0.201966.2
82:0.101334.9234:0.252184.5
92:0.151646.3244:0.302394.5
102:0.201797.1255:0.051302.5
112:0.251914.1265:0.10810.7
122:0.302056.4275:0.151215.1
133:0.052038.1285:0.201425.1
143:0.101233.4295:0.251499.4
153:0.151423.5305:0.301582.8
Table 3. Standard electrode potentials for different oxidizing agents.
Oxidizing AgentChemical Reaction EquationRedox Potential/V
·OH·OH + H+ + e = H2O28.10
O3O3 + 2H+ + 2e = H2O + O222.07
H2O2H2O2 + 2H+ + 2e = 2H2O1.77
MnO4MnO4 + 8H+ + 5e = Mn2+ + 4H2O1.52
ClO2ClO2 + 4H+ + 5e = Cl + 2H2O1.51
Cl2Cl2 + 2e = 2Cl1.36
Disclaimer/Publisher’s Note: The statements, opinions and data contained in all publications are solely those of the individual author(s) and contributor(s) and not of MDPI and/or the editor(s). MDPI and/or the editor(s) disclaim responsibility for any injury to people or property resulting from any ideas, methods, instructions or products referred to in the content.