Review

Mapping the Rise in Machine Learning in Environmental Chemical Research: A Bibliometric Analysis

by
Bojana Stanic
and
Nebojsa Andric
*
Department of Biology and Ecology, Faculty of Sciences, University of Novi Sad, Trg Dositeja Obradovica 2, 21000 Novi Sad, Serbia
*
Author to whom correspondence should be addressed.
Toxics 2025, 13(10), 817; https://doi.org/10.3390/toxics13100817
Submission received: 31 July 2025 / Revised: 19 September 2025 / Accepted: 23 September 2025 / Published: 26 September 2025
(This article belongs to the Section Novel Methods in Toxicology Research)

Abstract

Machine learning (ML) is reshaping how environmental chemicals are monitored and how their hazards are evaluated for human health. Here, we mapped this landscape by analyzing 3150 peer-reviewed articles (1985–2025) from the Web of Science Core Collection. Co-citation, co-occurrence, and temporal trend analyses in VOSviewer and R reveal an exponential publication surge from 2015, dominated by environmental science journals, with China and the United States leading in output. Eight thematic clusters emerged, centered on ML model development, water quality prediction, quantitative structure–activity applications, and per-/polyfluoroalkyl substances, with XGBoost and random forests as the most cited algorithms. A distinct risk assessment cluster indicates migration of these tools toward dose–response and regulatory applications, yet keyword frequencies show a 4:1 bias toward environmental endpoints over human health endpoints. Emerging topics include climate change, microplastics, and digital soil mapping, while lignin, arsenic, and phthalates appear as fast-growing but understudied chemicals. Our findings expose gaps in chemical coverage and health integration. We recommend expanding the substance portfolio, systematically coupling ML outputs with human health data, adopting explainable artificial intelligence workflows, and fostering international collaboration to translate ML advances into actionable chemical risk assessments.

1. Introduction

The assessment of environmental chemicals and their effects on ecosystems and human health has undergone a profound transformation in recent years. Traditional toxicological approaches are increasingly being supplemented or replaced by innovative methodologies aimed at improving efficiency, reducing costs, minimizing animal testing, and enhancing predictive accuracy. Among these advances, the integration of artificial intelligence (AI) has emerged as a particularly powerful development, enabling the analysis of complex, high-dimensional datasets that characterize modern chemical and toxicological research. This evolution reflects a broader shift within toxicology, transitioning from an empirical science focused primarily on apical outcomes to a data-rich discipline ripe for AI integration [1]. AI’s capacity to handle big data facilitates probabilistic predictions and pattern recognition, which are increasingly being applied in chemical risk assessment frameworks [2]. Various AI methodologies have demonstrated significant potential in predicting toxicological endpoints, including effects of chemicals on human receptors [3,4,5,6,7] as well as on critical physiological systems such as steroidogenesis [8], reproduction [9], cardiovascular health [10], or metabolic disorders like diabetes mellitus [11]. Applications of AI are also evolving in environmental monitoring and ecological impact studies [12,13,14,15].
As the use of AI, particularly machine learning (ML), in environmental chemical research accelerates, there is a growing need to systematically characterize how the field is evolving. The literature spans diverse domains, from toxicology and human health to environmental monitoring and fate modeling. At the molecular and cellular level, studies deploy interpretable ML together with classical learners (random forests, support vector machines [SVMs], gradient boosting, k-nearest neighbors [k-NN], and Bayesian models such as Bernoulli naïve Bayes) and deep/multitask neural networks to classify receptor binding, agonism, and antagonism, with large-scale consensus efforts improving robustness and external predictivity [3,4,5,6]. Extending beyond the estrogen receptor, classification models such as k-NN, random forests, and Bernoulli naïve Bayes for the androgen receptor [16] and convolutional neural networks for the progesterone receptor [7] underscore the portability of these approaches to other endocrine targets. At broader environmental scales, ML is widely applied to forecasting water, air, and land quality to support monitoring, early warning systems, and assessments of agricultural and human health impacts. Recent work on graph neural networks (GNNs) that encode river network topology, frameworks for long-term calibration/validation in data-scarce regions, and models such as SVMs, Kolmogorov–Arnold Networks, multilayer perceptrons, and extreme gradient boosting (XGBoost) for drinking water quality index prediction collectively demonstrate breadth and feasibility across spatial scales and data regimes [17,18,19]. For air quality, hybrid directed GNNs with spatiotemporal meteorological fusion, ML-guided integration of fixed and mobile sensors for high-resolution PM2.5 mapping and data-driven modeling of long-range wildfire transport illustrate how modern ML frameworks enhance forecasting and exposure assessment [20,21,22]. For land quality, supervised learners including extremely randomized trees, gradient boosting, XGBoost, SVMs, and tuned random forests augmented with spatial regionalization indices to encode spatial dependence are being used to map heavy-metal contamination from field to global scales, strengthening surveillance and decision-making [23,24]. A bibliometric synthesis is therefore essential to chart how methods and ideas diffuse across these areas, revealing research fronts and cross-disciplinary bridges. By mapping topics, keywords, and collaboration networks, such analyses clarify where evidence is consolidating, where gaps persist, and which datasets and benchmarks anchor the field. This evidence base enables researchers and regulatory agencies to prioritize resources, harmonize standards, and accelerate the translation of ML methods into risk assessment and policy.
Recently, Yarmohammadi et al. employed a bibliometric approach to document the growth of computational toxicology, highlighting a notable increase in publications using the keyword “machine learning” from 2010 onward, with an especially pronounced surge between 2020 and 2024 [25]. In addition to this study, several others have explored computational and AI-based approaches for predicting the toxicity of environmental chemicals. However, these studies are not bibliometric in nature; rather, they offer a more regulatory, conceptual, or future-oriented perspectives on how AI technologies can reshape toxicity prediction. For example, some emphasize the need for integrating AI within regulatory science, calling for standardized datasets, enhanced transparency, and collaborative development of predictive frameworks. Others point to persistent barriers to regulatory acceptance and call for a pragmatic approach in applying quantitative structure–activity relationship (QSAR) models and other computational tools in real-world contexts [26,27].
While our study may appear similar to the above-mentioned works, it differs significantly in scope and methodology. Some studies lack quantitative mapping of AI or ML applications [26,27], while others take a broader perspective that includes a variety of computational tools beyond ML [25]. In contrast, our study offers the first focused bibliometric analysis dedicated specifically to the application of ML in environmental chemical research. By analyzing 3150 publications from the Web of Science Core Collection, we provide a detailed analysis of temporal trends, geographic contributions, research clusters, and emerging thematic areas. Our study introduces several distinct analytical layers that set it apart from previous studies, such as granular thematic mapping of research domains, systematic extraction and co-occurrence analysis of chemical terms, and comparative quantification of environmental versus human health focus. This approach enables a more nuanced understanding of how ML is being employed in environmental and health applications, and it provides evidence-based recommendations for future research and interdisciplinary collaboration. Our analysis complements the studies performed so far in the field of AI and environmental chemicals and may serve as a useful resource in supporting strategic decision-making by funding agencies, research organizations, and policymakers. In the context of rapidly evolving fields, such as the intersection of ML and environmental chemical research, bibliometric studies not only clarify the intellectual landscape but also illuminate pathways for future innovation and collaboration.

2. Methods

2.1. Dataset Collection

This study employed the Web of Science Core Collection (https://www.webofscience.com/wos/woscc/basic-search, accessed on 16 June 2025) as the primary data source. The search query used was “machine learning” AND “environmental chemicals”. This was applied across all searchable fields. The search was restricted to publications published between 1985 and 2025, limited to article-type documents written in English. The search resulted in a dataset comprising 3150 relevant publications, which served as the basis for all subsequent analyses.

2.2. Dataset Analysis

Basic descriptive statistics, such as the annual distribution of publications, author contributions, and institutional affiliations, were generated using the Web of Science built-in data analysis tool. For in-depth bibliometric mapping and network visualization, VOSviewer version 1.6.20 was used. The full records and cited references from the 3150 retrieved articles were imported into VOSviewer to perform several types of analyses, including: (i) co-citation analysis of cited authors, cited sources, and cited references; (ii) co-occurrence analysis of author keywords; and (iii) cluster analysis to identify major thematic structures within the literature. In addition, the R programming environment version 4.2.2 was used for complementary visualizations and statistical analyses. Specifically, R was used to construct temporal keyword evolution maps and identify and visualize the most frequently mentioned and emerging chemicals, based on terms extracted from abstracts, author keywords, and Keywords Plus. This combined approach allowed for both quantitative and network-based insights into the development and structure of the ML domain within environmental chemical research.

3. Results and Discussion

3.1. Distribution by Year of Publication

Since 1996, a total of 3150 publications have been recorded in the field of ML and environmental chemical research (Figure 1). Until 2015, annual publication output remained modest, with fewer than 25 papers published per year, indicating limited engagement from research institutions and scientists in this domain. A notable shift occurred in 2020, when the number of publications rose sharply to 179. This upward trend continued, with output nearly doubling in 2021 to 301 publications. Research activity has maintained strong and consistent growth since then, culminating in over 719 publications in 2024. The current output in 2025 (545 publications as of mid-year) suggests that the 2024 record will likely be surpassed, highlighting the field’s accelerating momentum and growing global interest. This publication trend in ML and environmental chemical research domain closely mirrors the trajectory observed in the broader field of computational toxicology characterized by a relatively slow start that has been followed by a marked surge in publication activity over the past two decades [25].

3.2. Distribution by Affiliation and Country

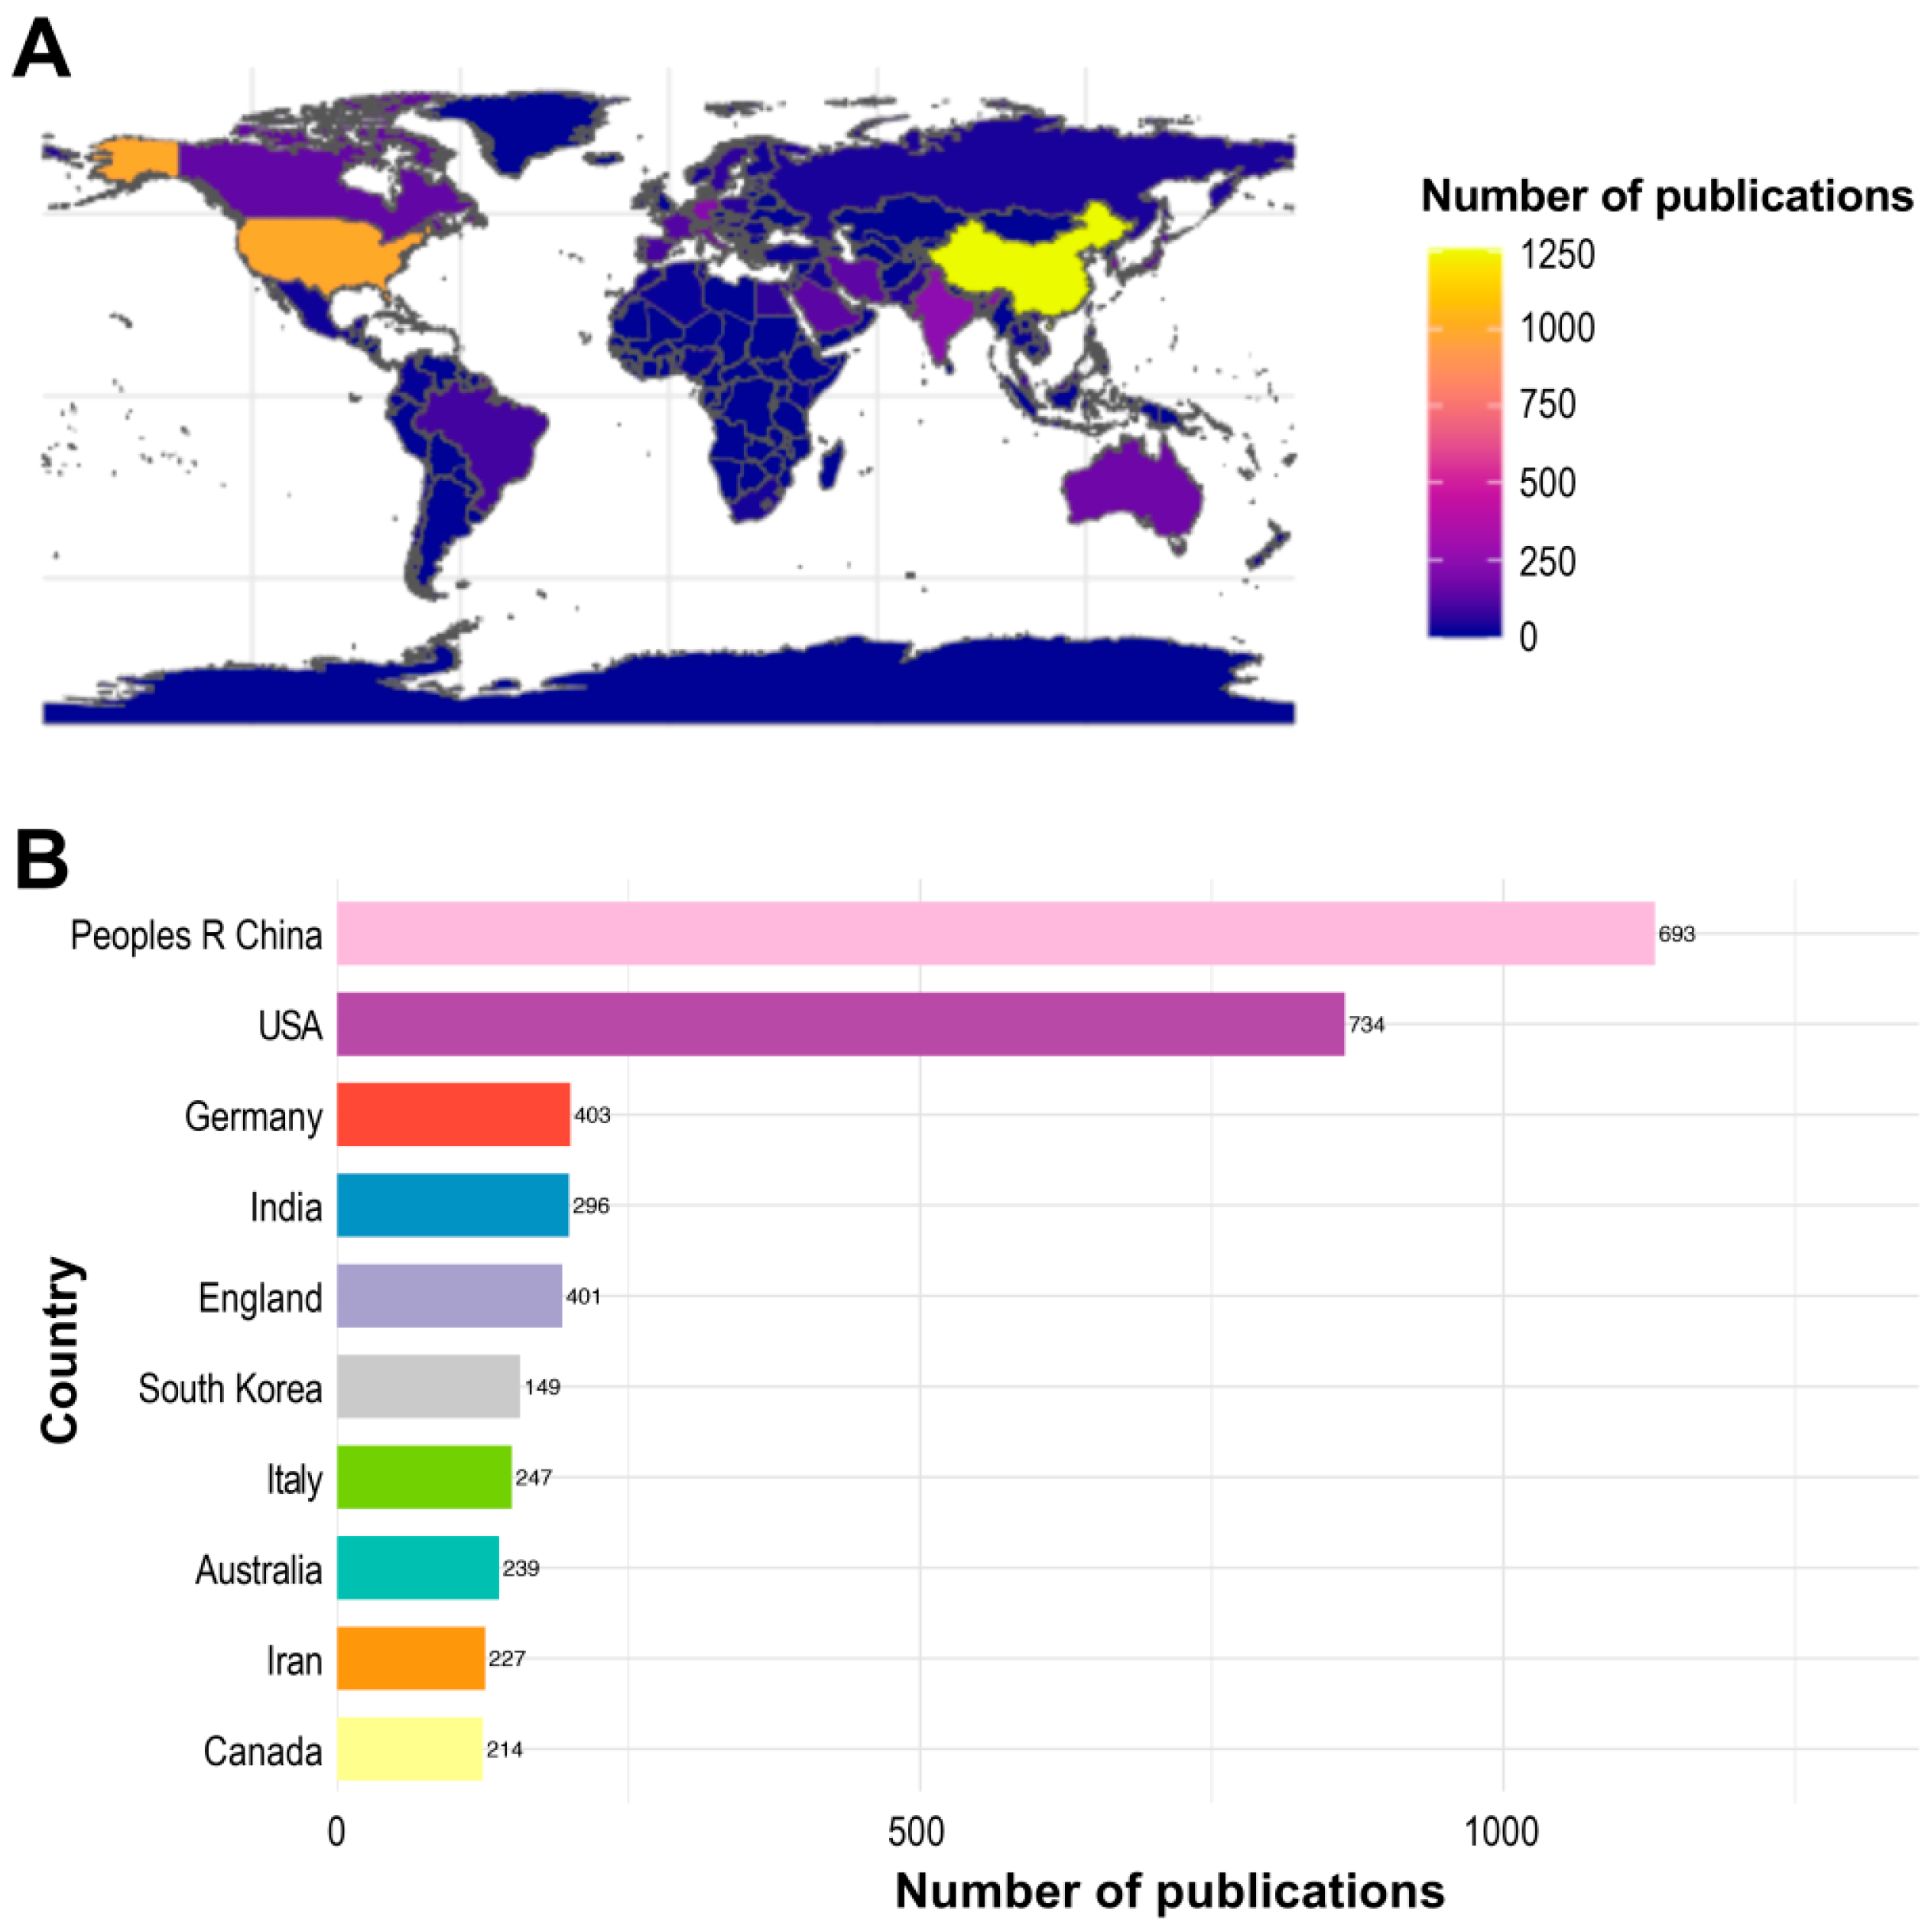
From 1996 to present, a total of 4254 institutions across 94 countries have contributed to the advancement of ML applications in environmental chemical research. Figure 2 illustrates both the number of publications and total link strength (TLS) for the top 10 contributing countries. Of the 3150 publications identified in this field, the People’s Republic of China leads with 1130 publications and a TLS of 693, indicating its dominant role in shaping this research area. The United States ranks second, with 863 publications and a higher TLS of 734, suggesting a stronger collaborative network. Other prominent contributors include India (255 publications), Germany (232 publications), and England (229 publications) (Figure 2A,B). The remaining countries presented in Figure 2B each account for a smaller proportion of the total research output yet collectively underscore the field’s growing global engagement.
Table 1 presents the top 10 affiliations ranked by publication output in the field of ML applications in environmental chemical research. The Chinese Academy of Sciences leads with 174 publications over the past decade, followed by the United States Department of Energy with 113 publications. Major contributions have also come from other prominent institutions in the United States and China, Switzerland, and France, including the University of California System (106 publications), the University of Chinese Academy of Sciences (75 publications), the Swiss Federal Institutes of Technology Domain and Tsinghua University (64 publications), and the French Centre National de la Recherche Scientifique with 57 publications.
Table 2 shows the top 10 authors by the number of publications in the field of ML and environmental chemical research. All identified authors are affiliated with institutions in China or the United States, with six authors based in China (Dalian University of Technology; East China University of Science and Technology—three authors; Nankai University; Yangzhou University) and four in the United States (Tulane University; Emory University; Case Western Reserve University; United States Food and Drug Administration). A cohesive China-centered node is evident at East China University of Science and Technology (Weihua Li, Guixia Liu, Yun Tang; each with 13 publications), while the United States node spans academic and regulatory affiliations, suggesting a translational pipeline from method development to regulatory application. This geography mirrors the institutional concentration reported in Table 1 and likely reflects access to curated datasets, AI infrastructure, and sustained funding in these two countries. In terms of productivity, Jingwen Chen (Dalian University of Technology) leads with 15 papers. When network centrality is considered (TLS), the field is anchored by a China–United States axis: Hao Zhu from Tulane University and Weihua Li, Guixia Liu, and Yun Tang from East China University of Science and Technology are highly connected. On citation impact, Huixiao Hong (United States Food and Drug Administration) ranks highest (771 citations) despite fewer publications and a modest TLS (499), indicating influential outputs that are less embedded in the co-authorship network. Yun Tang (676 citations) likewise stands out for impact relative to his TLS, whereas Huichun Zhang exhibits a bridge profile (10 papers, high TLS = 1531), suggesting cross-cluster connectivity.

3.3. Cooperation Network Relationship Analysis

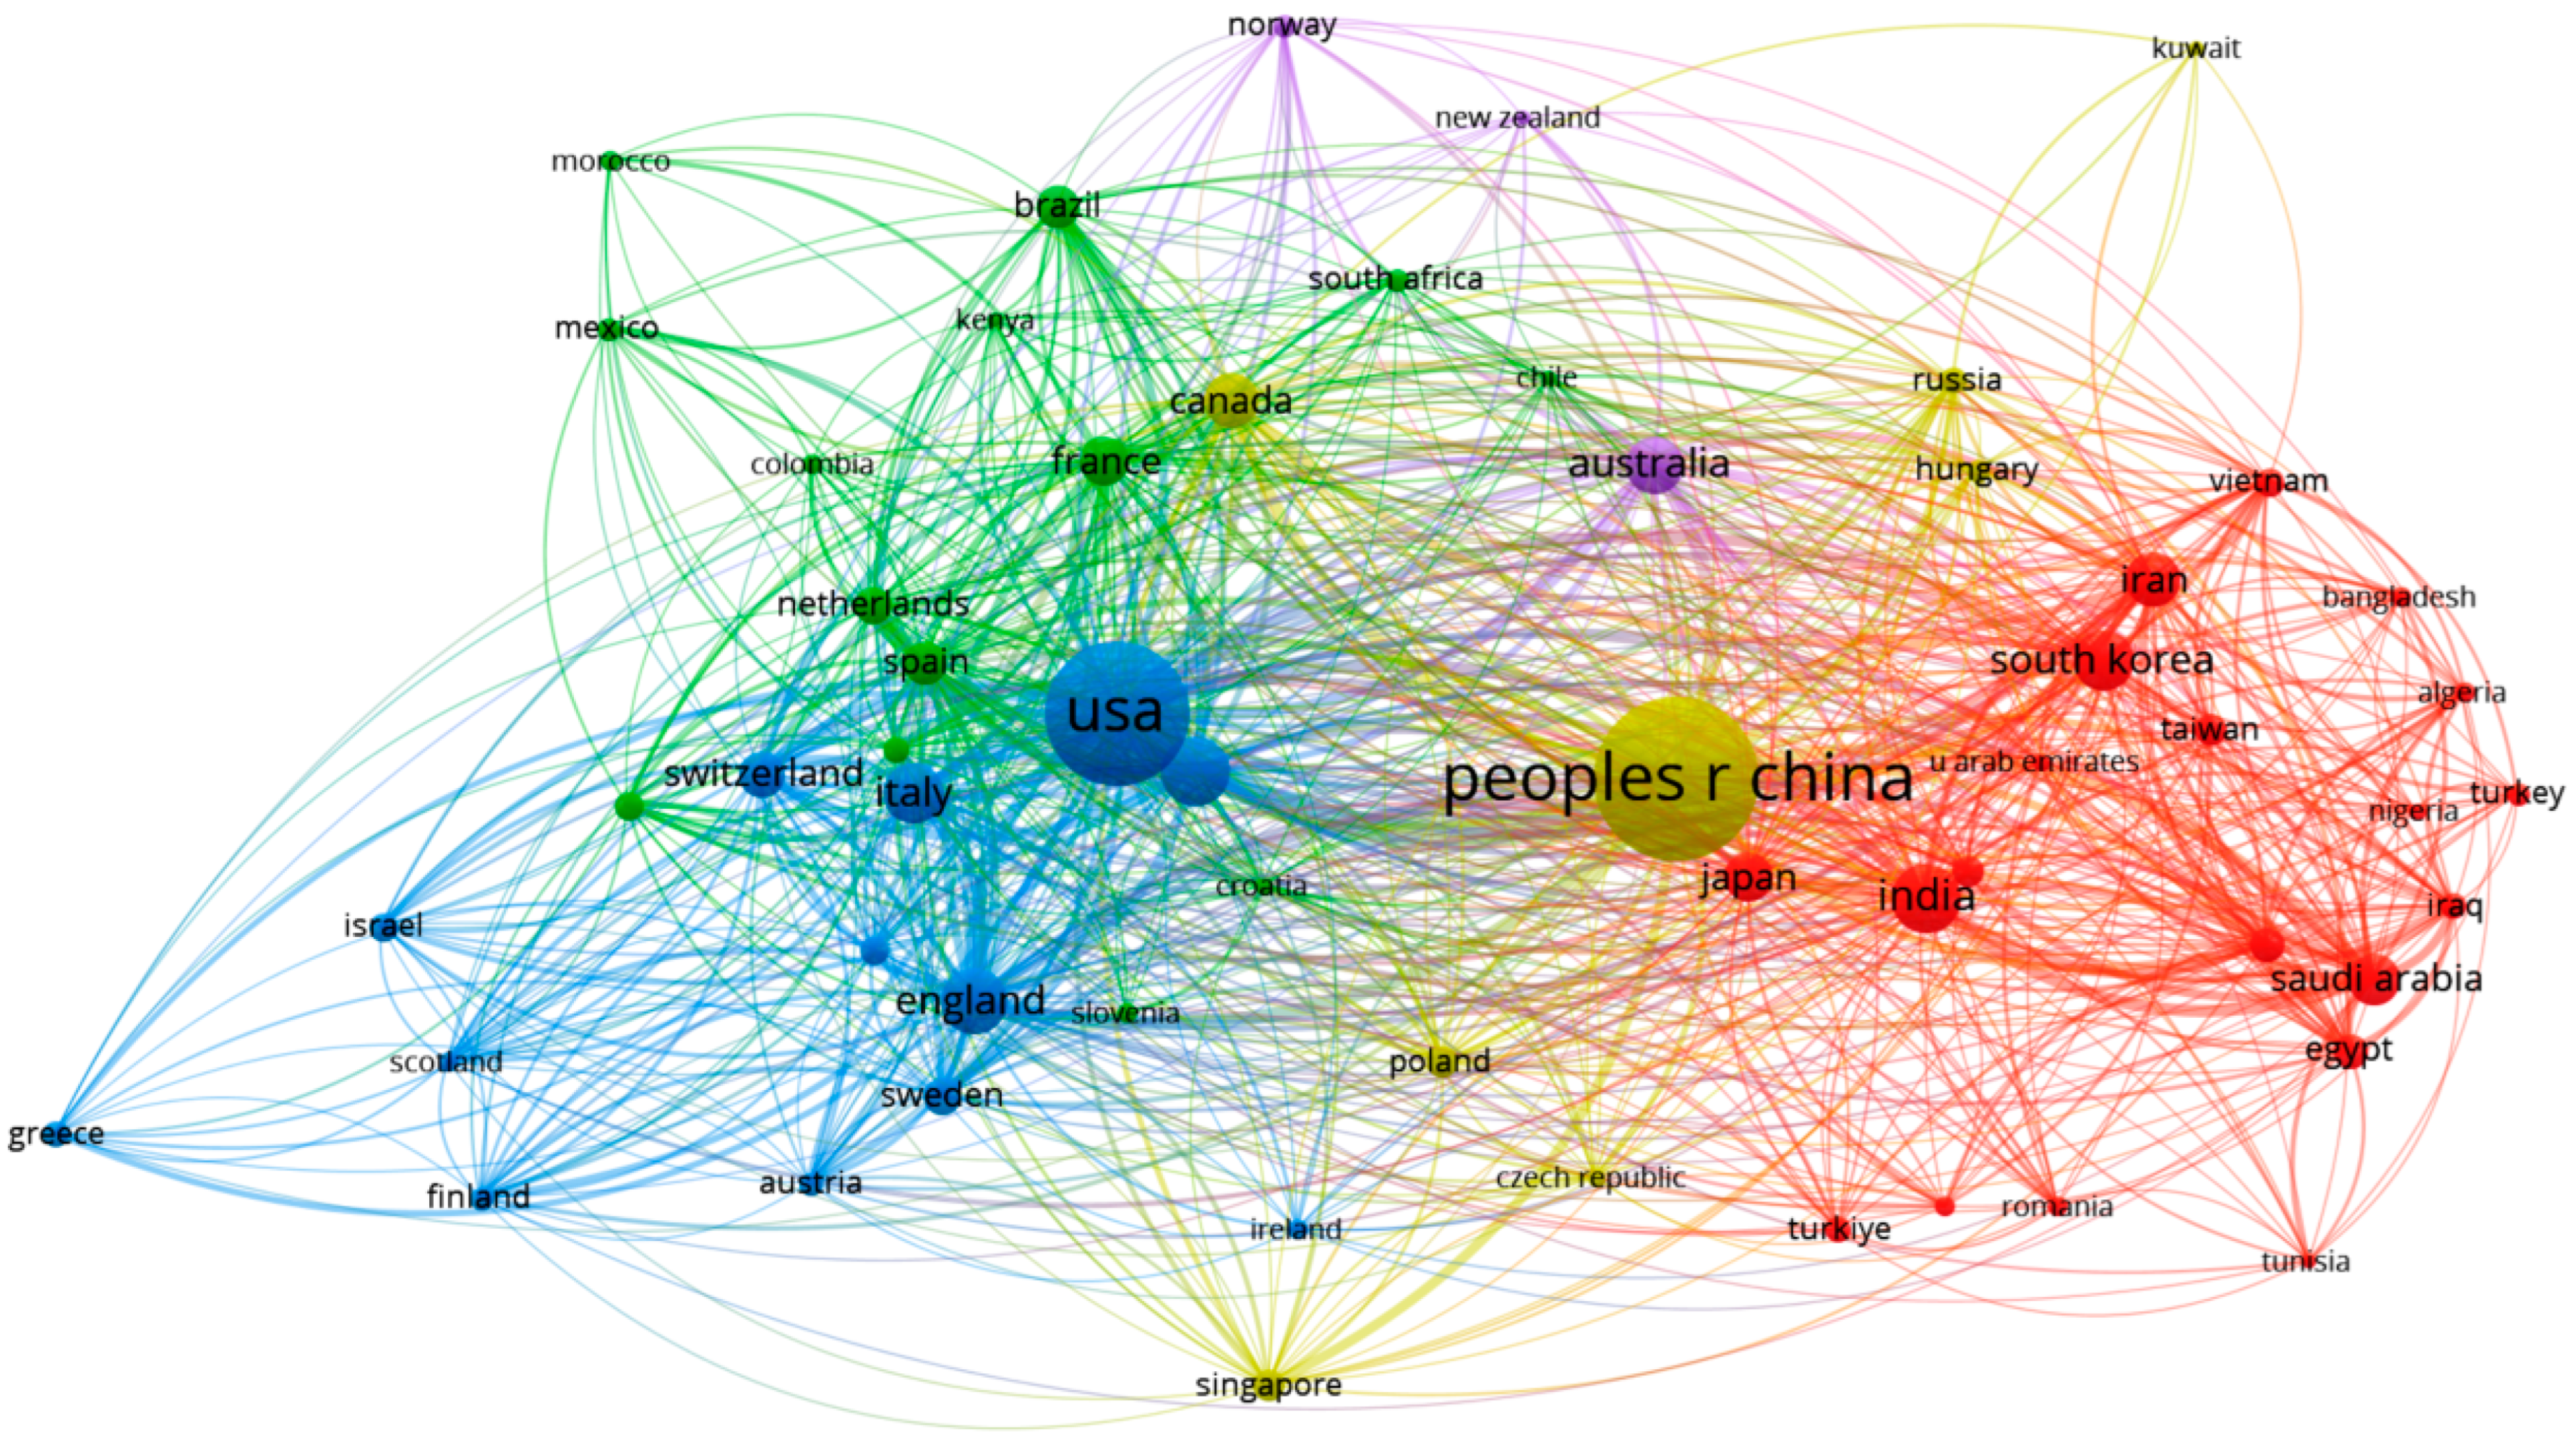
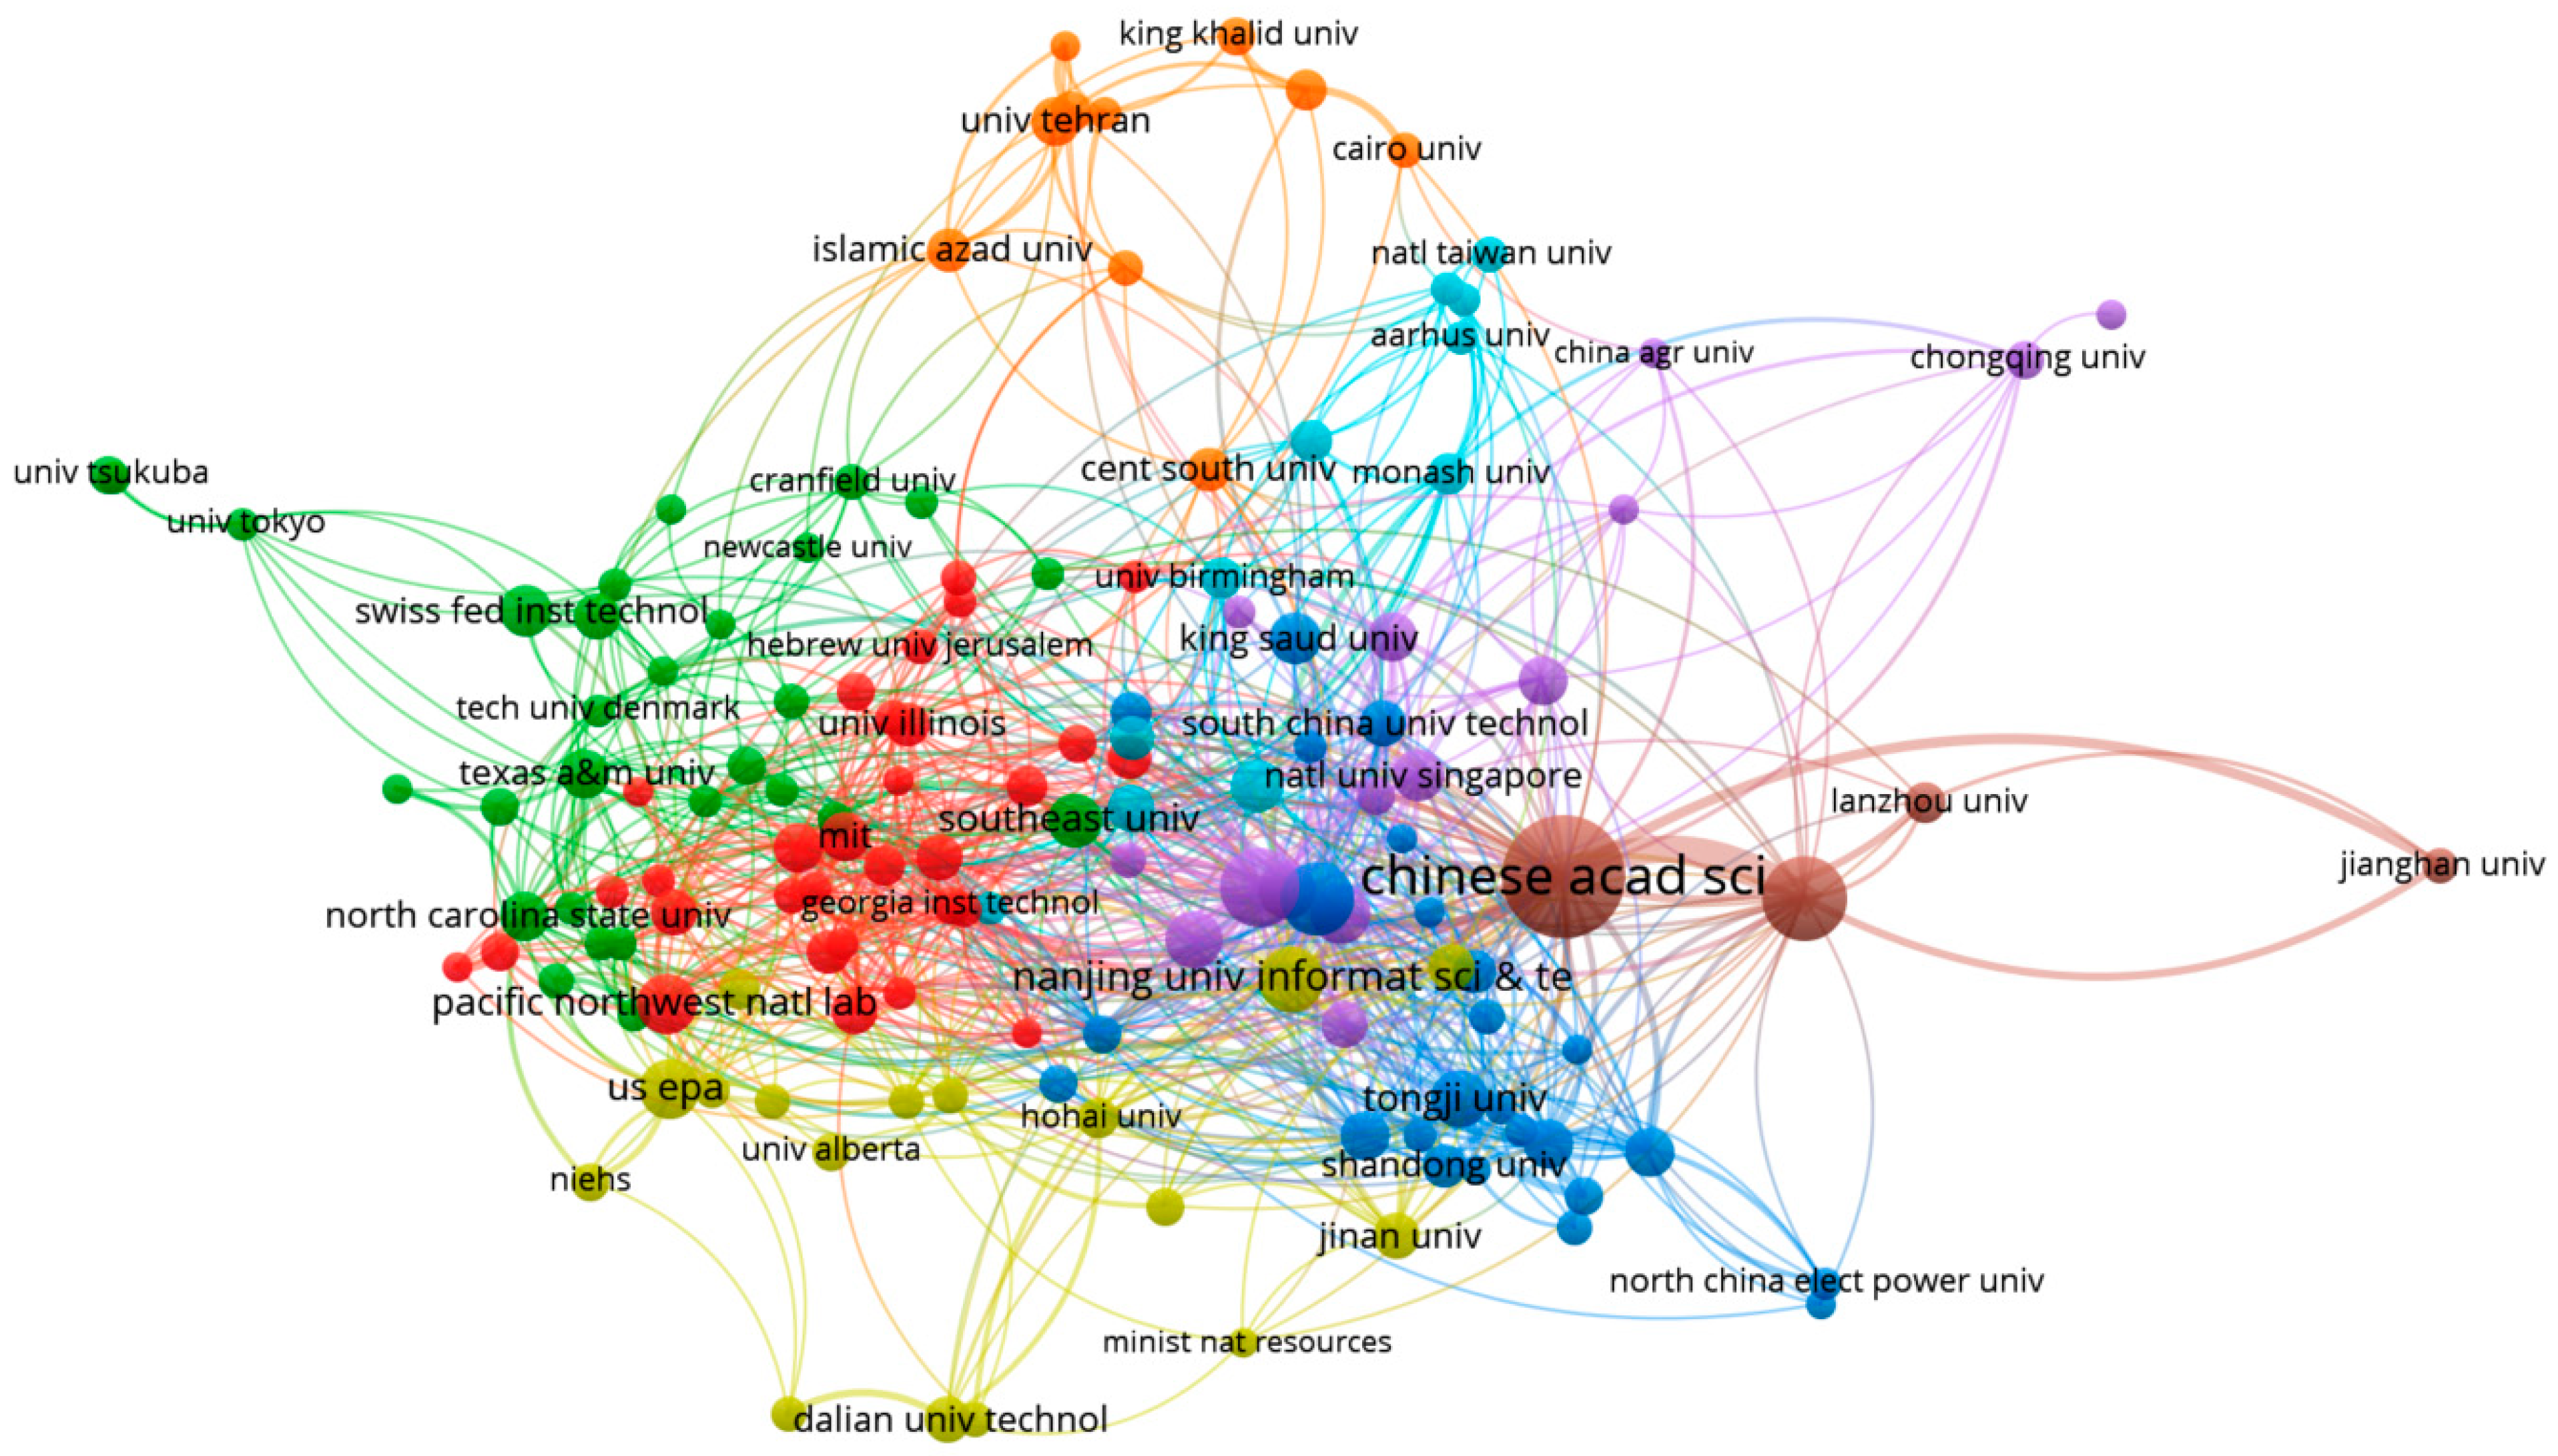
To elucidate the collaborative dynamics among countries and institutions, a co-authorship analysis was conducted using VOSviewer, resulting in superimposed visual network maps presented in Figure 3 and Figure 4. In these networks, nodes (depicted as circles) represent countries (Figure 3) or affiliations (Figure 4), while clusters are distinguished by different colors. The size of each circle reflects the publication output of a country or institution, and the connecting lines represent collaborative links.
Figure 3 illustrates the co-authorship network among countries/regions, based on a minimum threshold of 10 documents per country. A total of 58 countries met this criterion, forming 872 collaborative links with a combined TLS of 3637. Of note, countries such as the People’s Republic of China, the United States, India, Germany, and England exhibit strong international collaboration within this research domain. The network reveals that while ML-related research on environmental chemicals is globally distributed, certain countries demonstrate more frequent and cohesive collaborations, forming distinct clusters. For example, China, a leading contributor, frequently collaborates with Canada, the Czech Republic, Hungary, and Singapore. Together, these countries form Cluster 4. In contrast, the United States tends to collaborate more closely with Germany, England, Italy, and others, forming Cluster 3. Comparative analysis of these clusters shows that Cluster 4 (led by China) comprises 1130 publications and a TLS of 693, while Cluster 3 (led by the United States) has a slightly higher TLS of 734 but a lower number of documents—864. These differences highlight not only the productivity but also the varying collaborative strategies among leading nations in this field. For better cluster differentiation, see Supplementary Figure S1.
In the co-authorship analysis of institutional collaboration, a threshold of at least 10 publications per organization was applied, resulting in 142 organizations meeting this criterion. The Chinese Academy of Sciences emerged as the most prolific contributor, with 64 collaborative links. Further analysis of the network structure reveals the presence of distinct clusters based on collaboration strength. One prominent cluster revolves around the Chinese Academy of Sciences and includes other Chinese institutions such as Jianghan University, the University of Chinese Academy of Sciences, and Lanzhou University, reflecting strong intra-national collaboration. Additionally, another predominantly Chinese cluster comprises several other universities and research organizations within China. While these clusters exhibit strong internal collaboration, their connections with institutions from Europe and the United States appear comparatively weaker. In contrast, two other major clusters are primarily composed of institutions from the United States and Europe, including MIT, the University of Illinois, Georgia Tech, the United States Environmental Protection Agency (US EPA), Hebrew University, and the Swiss Federal Institute of Technology. These institutions not only maintain strong regional ties but also demonstrate active collaboration with organizations from other regions globally (Figure 4). For better cluster differentiation, see Supplementary Figure S2.

3.4. Cited Sources Co-Citation Analysis

Figure 5 presents a co-citation analysis map of cited sources, generated using VOSviewer. For this analysis, sources that were cited more than 100 times were selected, resulting in a total of 276 sources out of 28,769 meeting this threshold. In the visualization, each node represents a cited source, while the links between nodes indicate co-citation relationships, i.e., instances where two sources were cited together in the same document. This mapping highlights the intellectual structure of the field by identifying influential sources and the strength of their interconnectedness. For better cluster differentiation, see Supplementary Figure S3.
Table 3 highlights the most influential journals, distributed across five distinct clusters as shown in Figure 5, based on co-citation analysis. Only journals with more than 100 citations were included. These journals generally possess high impact factors, with most classified in Q1 Category Quartile, underscoring their prominence in the field. Environmental Science and Technology ranks first in terms of TLS, followed by Science of the Total Environment, Atmospheric Chemistry and Physics, and others. All top 10 journals, ranked by TLS, have relatively high impact factors, with Chemical Engineering Journal reporting the highest (13.2), while Atmospheric Environment has the lowest impact factor among them (3.7). Geographically, the majority of these leading journals are based in Europe, particularly in the Netherlands, which hosts several of them.
Thematically, the journals shown in Table 3 primarily focus on the environmental sciences, with many also intersecting with engineering and public health disciplines. This finding aligns with the Web of Science category rankings (Figure 6), in which Environmental Sciences holds the top position, followed by Engineering, Environmental and Engineering, Chemical. Additionally, Multidisciplinary Sciences is also represented among the top 10 categories contributing to the ML and environmental chemicals research domain. These results are consistent with the scope of the Environmental Sciences category, which emphasizes research on complex environmental challenges, including those related to human health. Many of the top-ranked journals in this field publish innovative studies using novel approaches and cutting-edge technologies for assessing chemical toxicity more effectively and efficiently.

3.5. Cited References Co-Citation Analysis

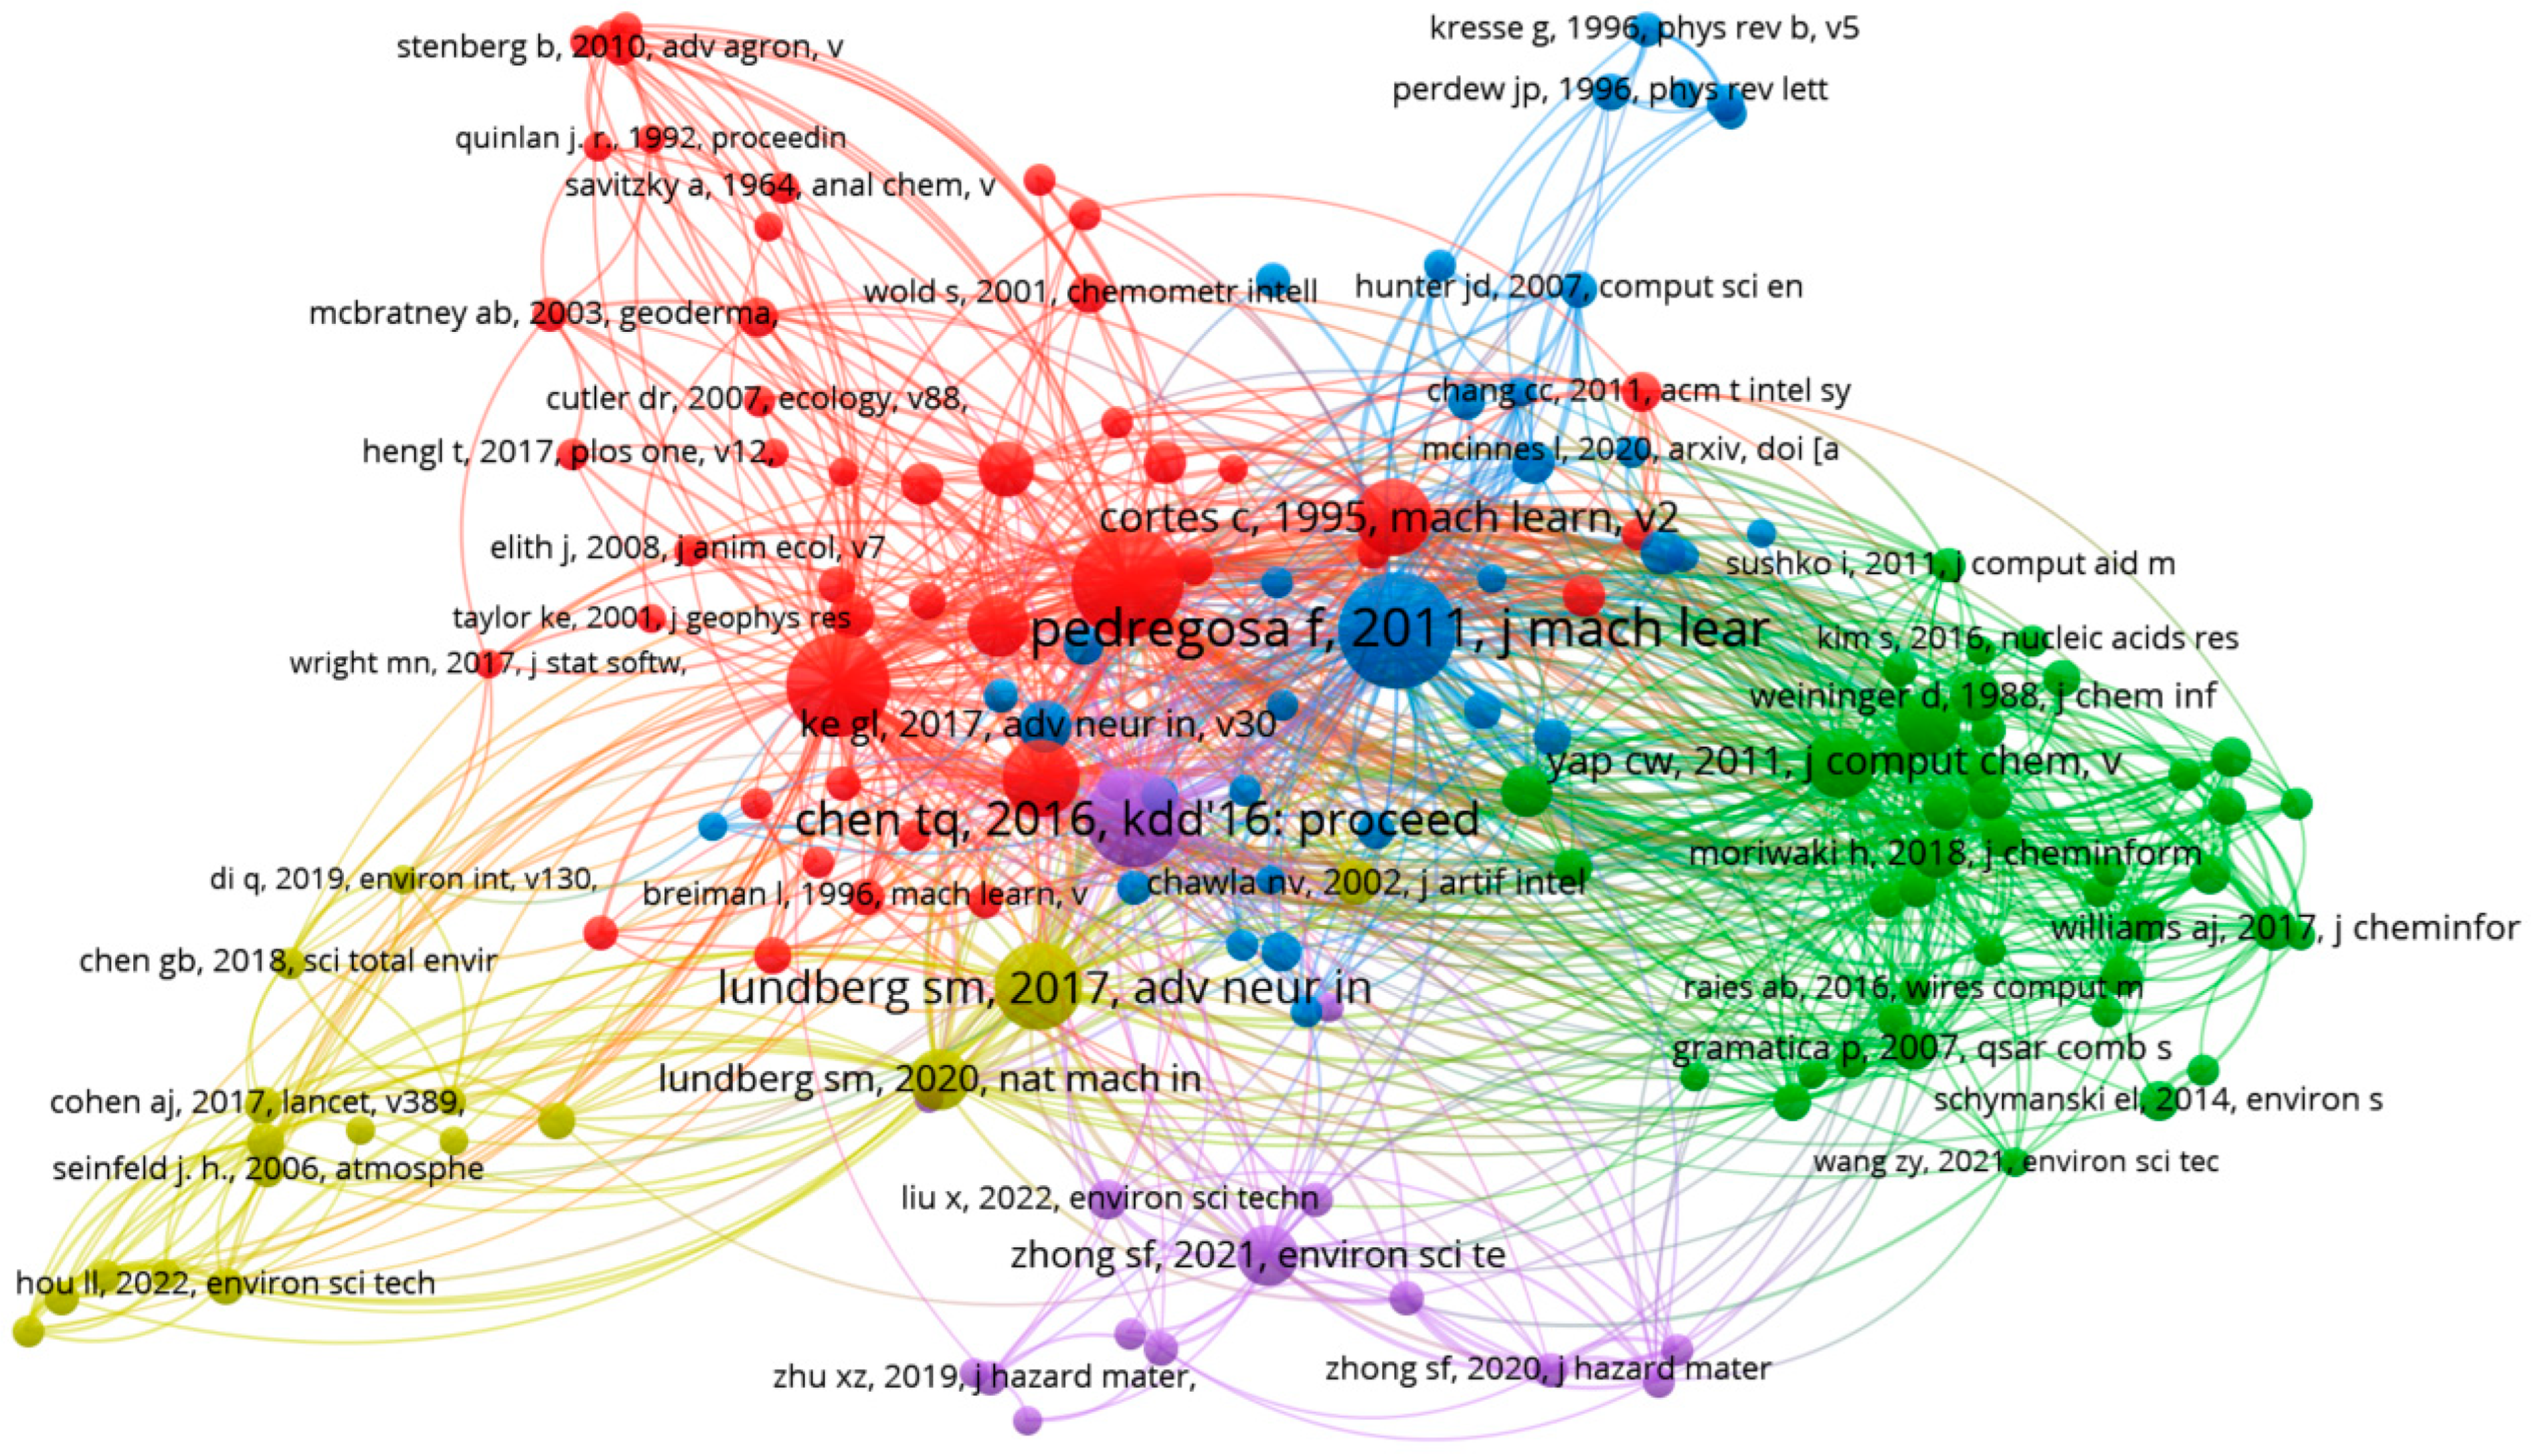
Figure 7 presents the co-citation analysis of cited references, conducted using VOSviewer software. This analysis explores the relationships among specific references frequently cited together in the literature. In the resulting network map, each node represents a cited reference, and the links between nodes indicate co-citation relationships. Nodes sharing the same color belong to the same cluster, signifying closely related references. For this study, references cited more than 20 times were included in the analysis. Out of 153,738 references in the dataset, 154 met the selection criteria. The cluster map provides a visual representation of the spatial distribution and grouping of these references (Figure 7). For better cluster differentiation, see Supplementary Figure S4.
Table 4 lists the top 10 most highly cited references during the study period, ranked by TLS. These references form the conceptual foundation for the development and application of ML, spanning from fundamental algorithms and tools to domain-specific applications in chemistry, ecology, and medicine. Several highly cited papers introduce foundational ML algorithms and methodologies, such as random forest [28], support SVMs [29], and explainable AI for tree-based models [30]. In addition, significant attention is devoted to software tools and libraries, such as Python, caret, PaDEL-descriptor, and molecular fingerprints, which facilitate the implementation of ML approaches in chemical and biological research. Of note, some of the most influential works address domain-specific applications, including methods for molecular structure encoding [31], the use of kernel tricks in SVMs for high-dimensional data classification [29], and toolkits for computing molecular descriptors widely used in QSAR modeling [32]. These core methodologies and software frameworks have been instrumental in advancing the application of ML in assessing the effects of chemicals on human and environmental health, thus forming a critical backbone of the field.

3.6. Research Direction Analysis

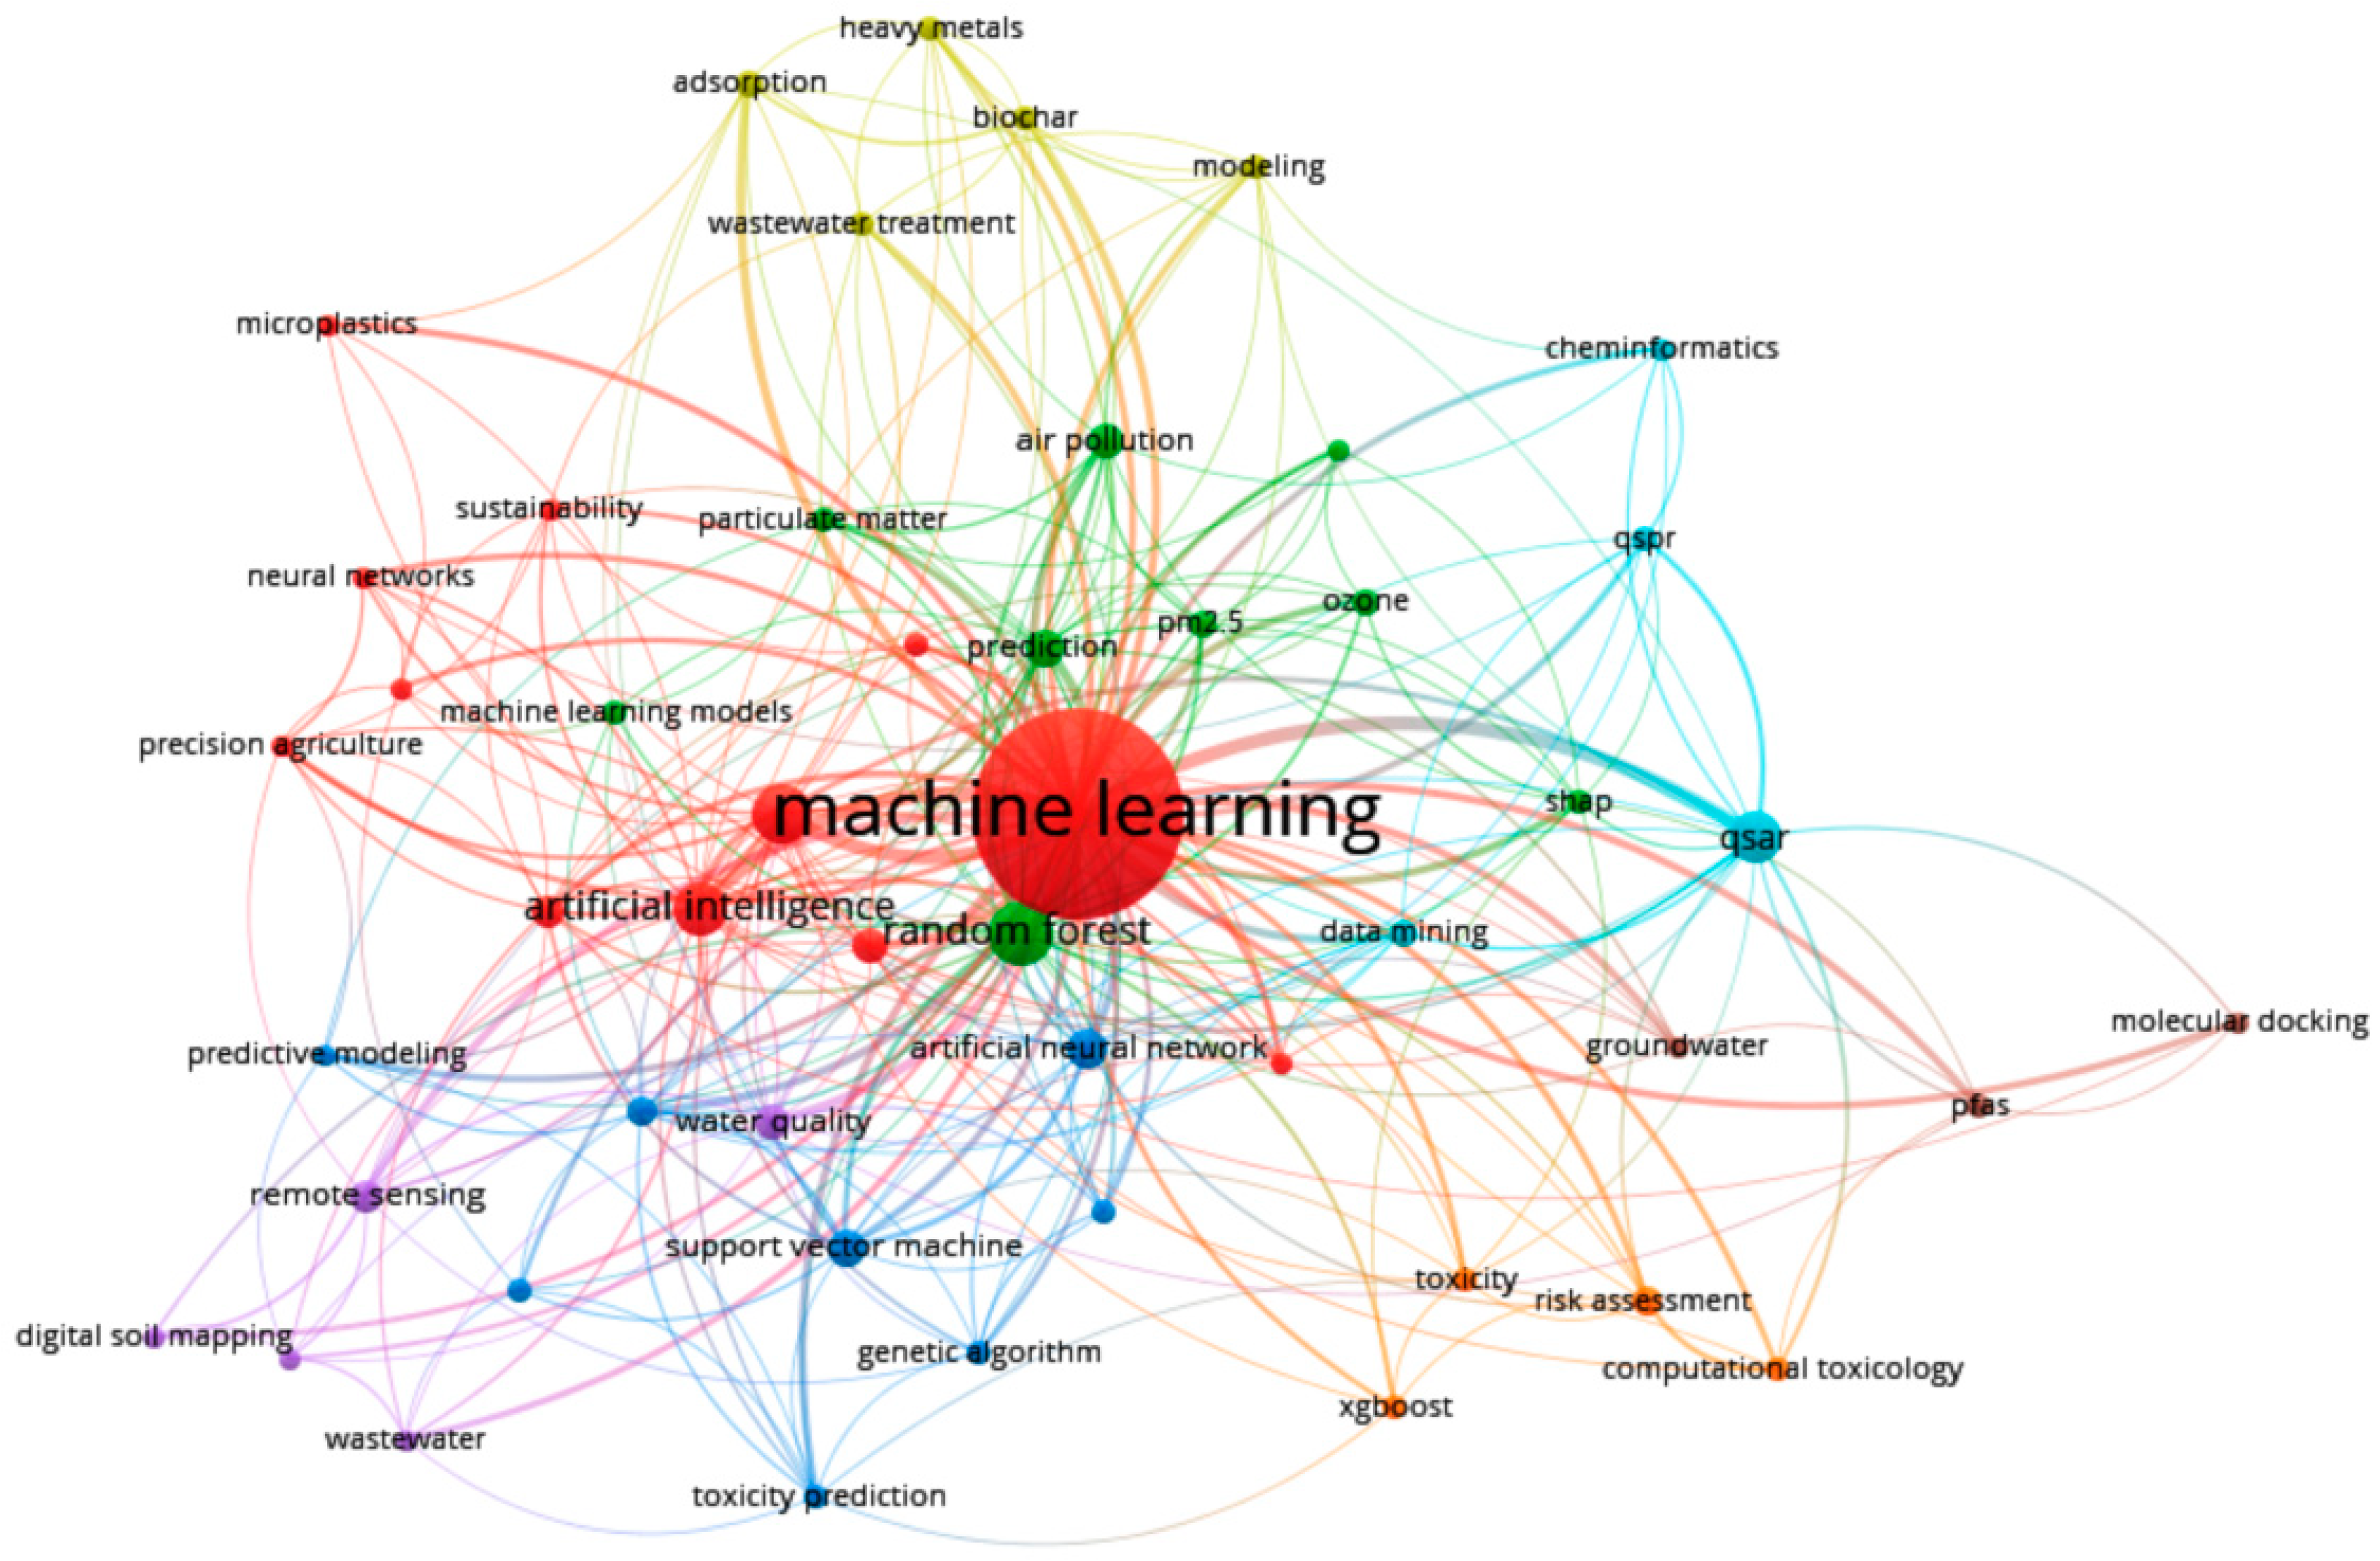
A co-occurrence analysis of keywords related to ML applications in environmental chemicals research was performed in VOSviewer. The analysis parameters were set to select 50 keywords that met the inclusion criteria. Clustering was conducted by VOSviewer, resulting in the co-occurrence network graph shown in Figure 8. The analysis revealed that the selected keywords were grouped into eight distinct clusters.
Based on the clustering results presented in Figure 8, the thematic research directions and corresponding keyword groups are summarized in Table 5. The VOSviewer algorithm identified eight keyword clusters. Leading keywords within each cluster were determined using Term Frequency-Inverse Document Frequency (TF-IDF) values calculated in R. In the first three clusters (Clusters 1, 2, and 3), the leading keywords—machine learning, deep learning, and random forest, respectively—reflect core AI tools. In contrast, the remaining five smaller clusters (Clusters 4–8) are centered around domain-specific applications, with leading keywords being adsorption, water quality, QSAR, risk assessment, and PFAS. This distribution suggests that these clusters primarily represent the practical implementation of AI methodologies within specific environmental contexts. However, the presence of domain-specific keywords as cluster leaders does not imply the absence of AI tools within those clusters. For instance, in Cluster 8, although PFAS emerged as the leading keyword, AI methods played a central role in the research. Multiple ML models were employed to assess the predictive value of key PFAS compounds, namely perfluorooctane sulfonate and perfluorooctanoic acid, in relation to metabolic syndrome [33]. Similarly, risk assessment, the leading term in Cluster 7, is examined in the context of AI-driven methodologies [34], further emphasizing the integrative role of ML across these thematic domains.
To further explore the coherence of the identified clusters, we conducted a Silhouette analysis to assess how well each keyword aligns with its assigned cluster compared to others. The results demonstrated that the average distance of each keyword to its own cluster was substantially lower than its distance to other clusters, indicating strong within-cluster similarity. This suggests that the research directions represented by the eight clusters are well-defined and largely distinct, with minimal thematic overlap between them.

3.7. Evolution of Research Directions

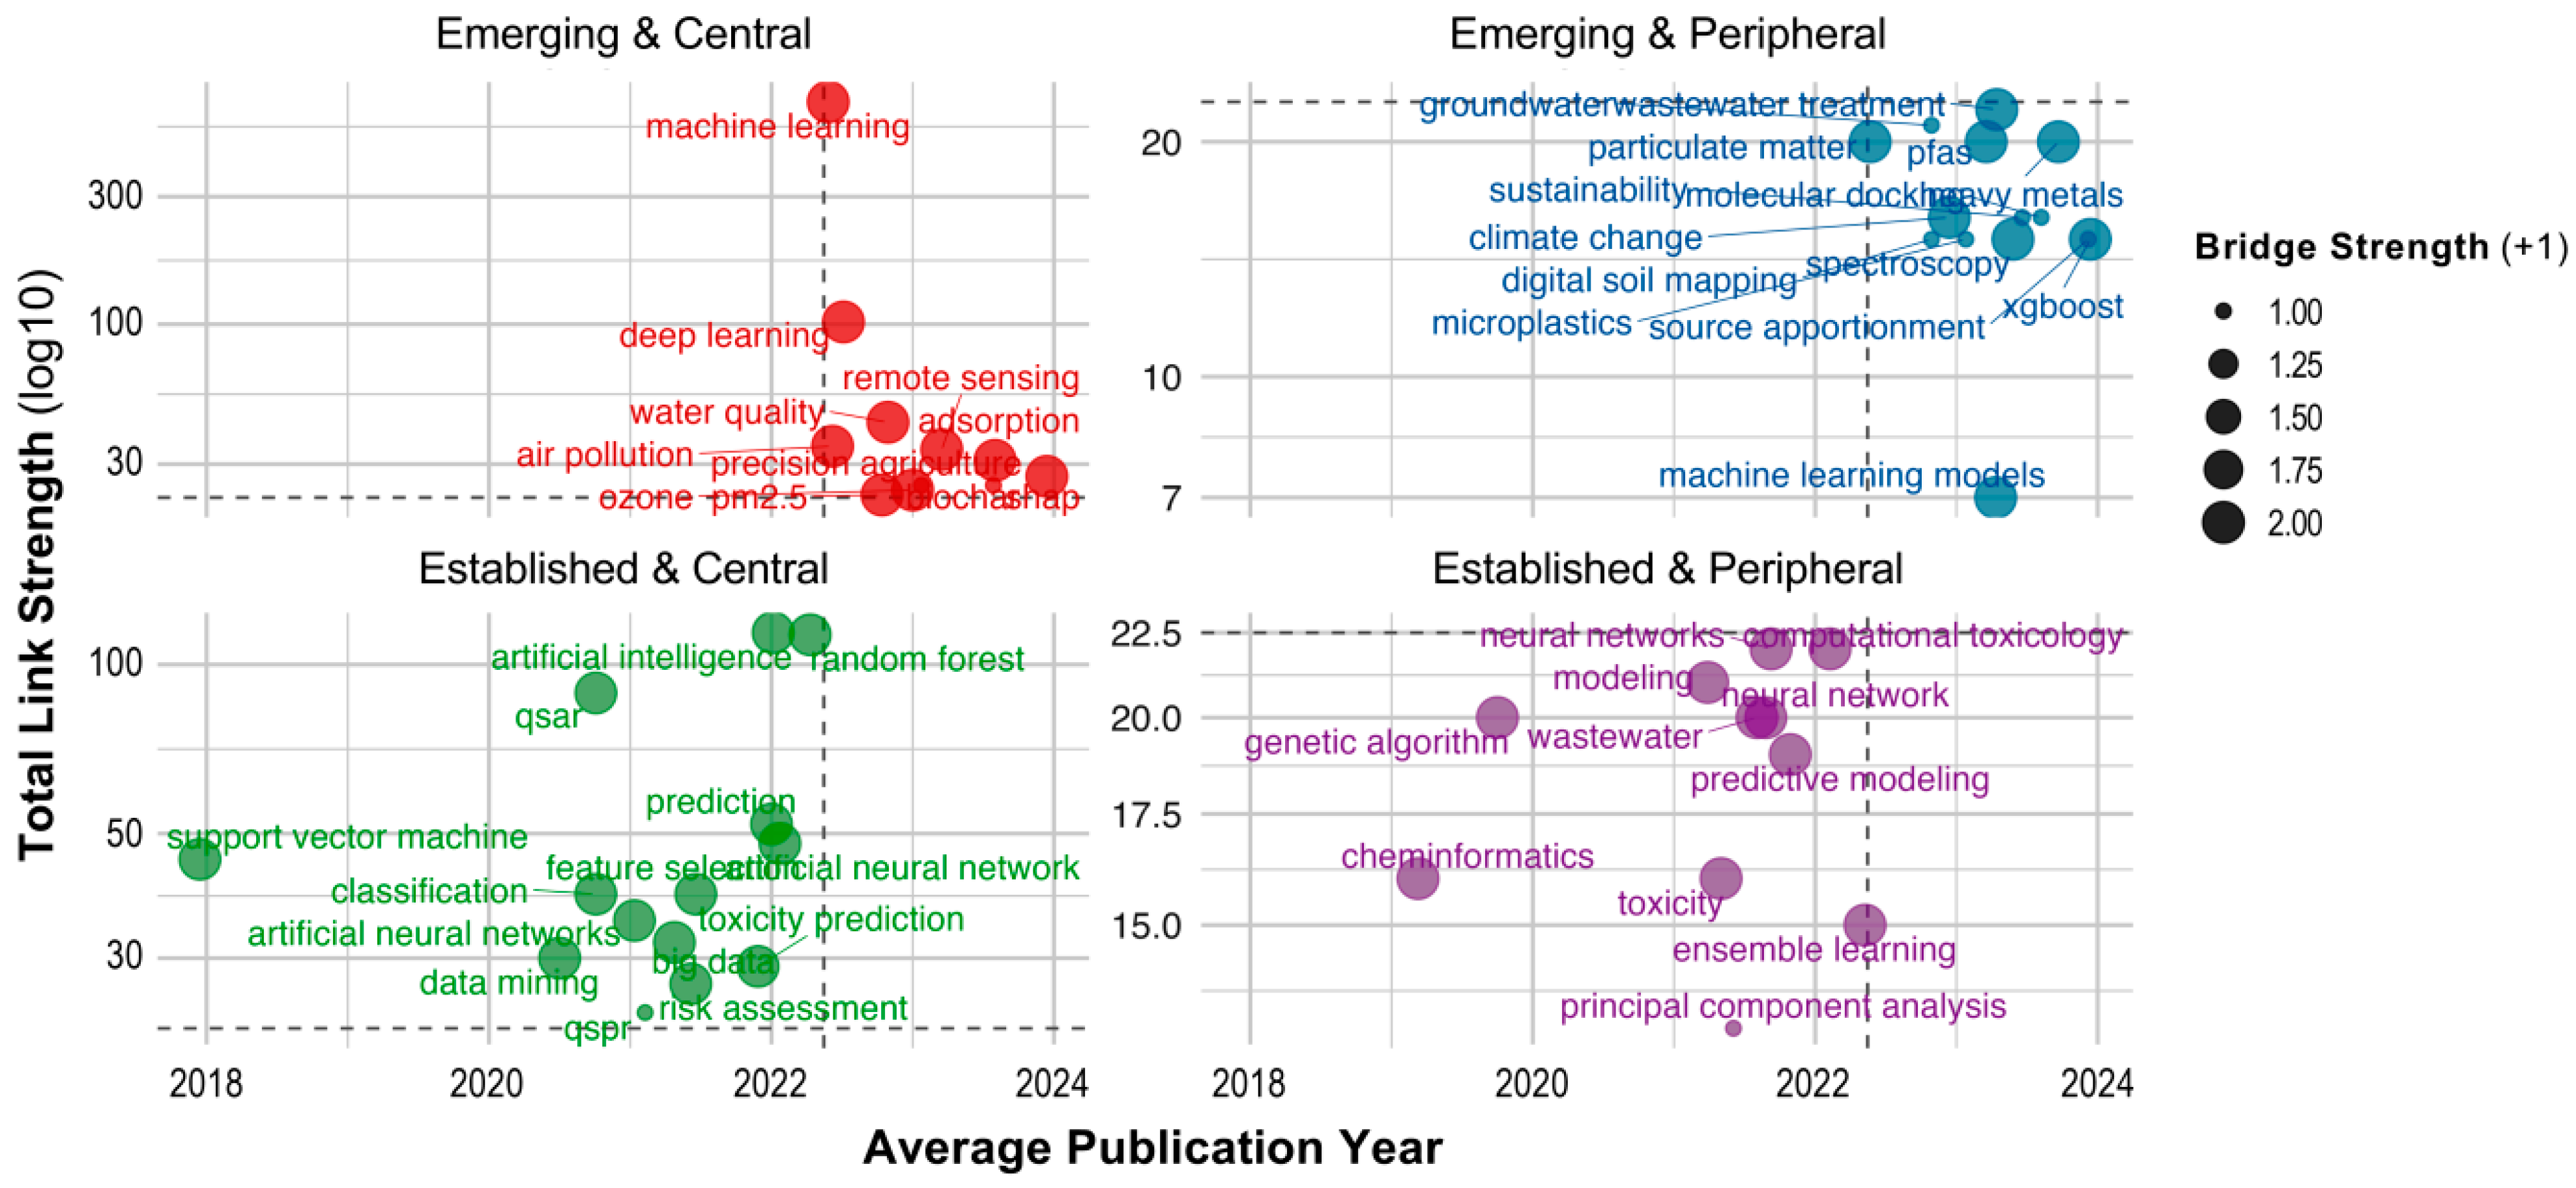
To better understand the thematic structure and dynamics of research in the intersection of ML and environmental chemical research, we analyzed the positions of the top 50 keywords within the co-occurrence network (Figure 9). The visualization is organized into four quadrants based on two criteria: term novelty (before or after 2022) and TLS, which is a measure of a keyword’s centrality in the network. The quadrants are defined as follows: (i) Emerging and Central (upper right)—recently introduced keywords (>2022) that already hold strong connectivity within the network (TLS > 20); (ii) Emerging and Peripheral (lower right)—new keywords (>2022) that are still developing their position (TLS < 20); (iii) Established and Central (upper left)—older terms (<2022) that remain core elements of the field (TLS > 20); and (iv) Established and Peripheral (lower left)—older keywords (<2022) that used to be in focus earlier but are becoming less prominent now (TLS < 20). The analysis reveals several Emerging and Central keywords such as machine learning, deep learning, remote sensing, air pollution, and water quality, indicating that these “hot topics” are currently at the forefront of research. Keywords like climate change, particulate matter, groundwater, digital soil mapping, wastewater, and PFAS fall into the Emerging and Peripheral category. These are novel but still peripheral topics, showing potential for future growth and integration into the core of the research field. In contrast, established terms such as artificial intelligence, random forest, QSAR, predictive modeling, and support vector machine remain central and foundational to the domain. Meanwhile, keywords like genetic algorithm, toxicity, principal component analysis, and predictive modeling appear in the Established and Peripheral quadrant, suggesting a gradual decline in their prevalence. This quadrant-based analysis indicates a shift in research focus within the ML-environmental chemicals domain. While ML models and AI methodologies remain crucial, the application domains are changing; there is growing interest in areas such as water analysis, climate change, soil contamination, and microplastics. In particular, water analysis appears in both emerging quadrants, highlighting its continued relevance and expanding application. Keywords like climate change, digital soil mapping, and microplastics are present exclusively in the Emerging and Peripheral quadrant, indicating new but promising directions in the field. Since 2022, the term climate change has appeared in 24 publications, including studies that explore its linkage with environmental ML modeling [35,36]. The keyword microplastics has been used in 3 publications to date. Given the rising environmental and human health concerns due to microplastic pollution and exposure [37], ML-based models are increasingly applied to predict and assess risks posed by microplastics [38,39]. Similarly, digital soil mapping, which has appeared in 13 publications to date, is becoming more prominent as ML techniques are increasingly applied to assess the content and distribution of potentially toxic elements in soil impacted by anthropogenic activities [40,41,42]. In summary, this quadrant analysis provides a strategic perspective on the emerging and shifting research priorities, highlighting how ML applications in environmental science are evolving over time.
To further explore how ML is applied in the context of environmental versus human health research, we analyzed the content of 3150 documents by screening their abstracts, author keywords, and Keywords Plus using a predefined set of terms (the full list is shown along the y-axis of Figure 10). These terms were selected to represent key thematic elements of environmental and human health research. The analysis yielded a total of 6313 hits for environmental terms and 1597 hits for human health terms, indicating a greater emphasis on environmental applications of ML within the literature. Within each thematic group, the frequency of individual terms varied markedly. In the environmental domain, soil was by far the most frequently mentioned term, with 2068 hits, followed by water quality (780 hits). In contrast, terms such as greenhouse gases, hazardous waste, and biodiversity were mentioned in fewer than 100 documents. Similarly, within the human health domain, diseases had the highest frequency (423 hits), followed by receptor (249 hits). However, terms like morbidity, occupational health, and biomonitoring appeared much less frequently, each with fewer than 20 mentions (Figure 10). These findings highlight that the use of ML methodologies in environmental chemical research is more frequently focused on environmental endpoints than on human health outcomes. Moreover, the dominance of terms like soil and water quality aligns with the thematic trends identified in Figure 9. It is important to note that this analysis is limited by the predefined list of search terms. While commonly used keywords such as soil, water quality, diseases, and receptors were included, the omission of additional relevant terms may have led to an underrepresentation of certain aspects, which may have affected the relationship between environmental and human health themes. Therefore, while the findings suggest a stronger orientation toward environmental applications of ML, they should be interpreted with caution, bearing in mind this methodological limitation.

3.8. Translational Implications for Human Health Risk Assessment

Although our term frequency analysis has shown a striking 4:1 imbalance between environmental and human health research focus (6313 environment-related keyword hits versus 1597 human health hits), the keyword co-occurrence map nonetheless reveals a discrete Risk Assessment cluster (Cluster 7) built around terms such as risk assessment, computational toxicology, toxicity, and XGBoost (Table 5). The presence of this cluster indicates that tools originally developed for environmental monitoring are now migrating toward endpoints directly relevant to human health risk assessment. The literature already offers proof-of-concept models that predict receptor binding and pathway level toxicity (e.g., estrogen and progesterone receptors, steroidogenesis, cardiotoxicity, diabetes risk) with encouraging accuracy and mechanistic insight [3,4,5,6,7,8,9,10,11].
Building on these advances, several studies have illustrated how environmental ML innovations actively accelerate human health risk assessment. Mixture-learning models link multi-chemical exposures to metabolic syndrome outcomes in adults [33], while a pathophysiology-based New Approach Method provides dose–response points of departure for complex contaminant mixtures [43]. High-throughput classifiers accurately predict hematotoxicity [44] and receptor-mediated endocrine disruption, such as PFAS binding to peroxisome proliferator-activated receptor alpha [45]. The routine use of SHAP and other explainable AI techniques [30] further enhances transparency, allowing model outputs to be interrogated by regulators. Collectively, these advances outline an end-to-end pipeline in which: (i) large chemical inventories are screened in silico for hazard; (ii) pathway-anchored models translate those hazards into dose–response metrics; and (iii) explainable AI frameworks communicate model uncertainty, thereby accelerating human health risk assessment.

3.9. Emerging Environmental Chemicals

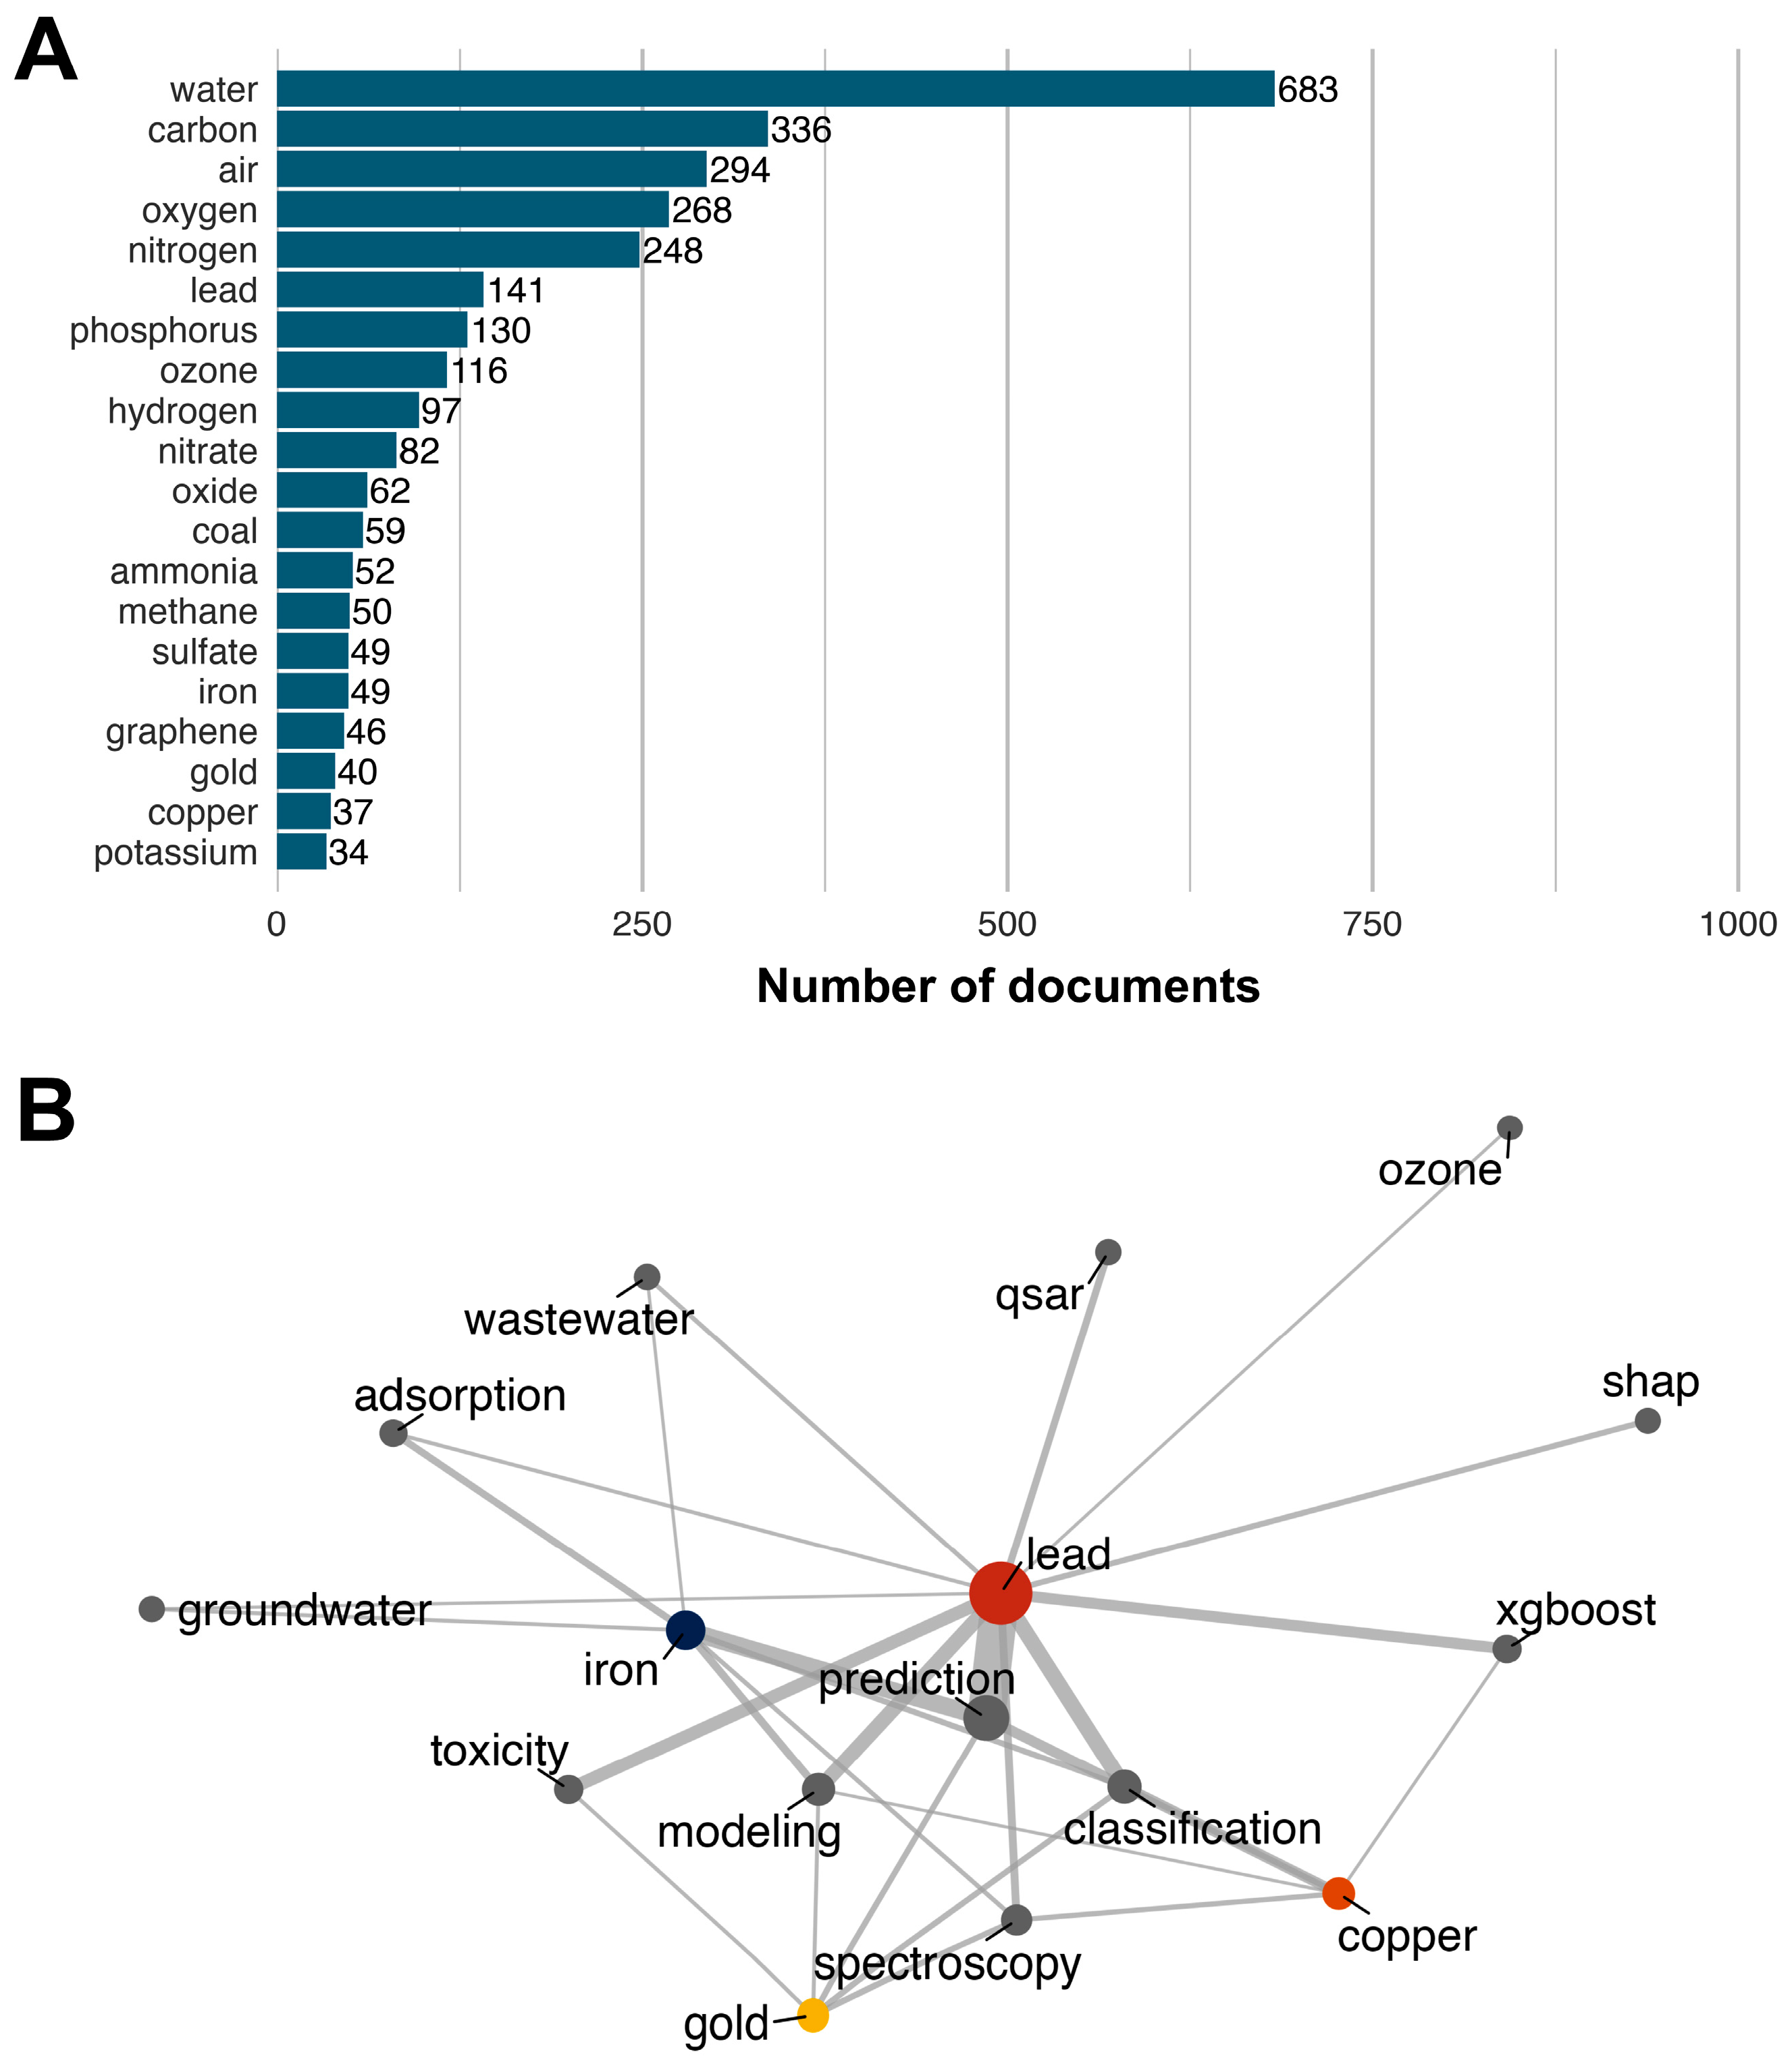
To identify the most frequently studied chemical terms within the domain of ML and environmental chemical research, we utilized the DSSTox_Synonyms dataset from the EPA-ORD-CCTE Clowder repository (https://clowder.edap-cluster.com, accessed on 30 June 2025), a comprehensive and scalable resource containing over one million chemical names and synonyms. This chemical list was used to screen the abstracts, author keywords, and Keywords Plus of the 3150 documents retrieved from the Web of Science using a document frequency approach. From this process, 551 unique chemical terms were identified. Of these, 315 terms appeared in only a single document, 194 terms appeared between 2 and 20 times, and 42 terms were found in more than 20 documents. This distribution suggests that ML applications in environmental chemical research are focused on a relatively small subset of chemicals. The top 20 most frequently mentioned chemical terms are presented in Figure 11A. Water ranked highest with 683 mentions, followed by carbon (336 mentions) and air (294 mentions). While water and air are environmental terms rather than discrete chemicals, and carbon may appear as part of molecular structures rather than as an independent chemical of study [45], the list also includes some of the prominent heavy metals such as lead, iron, and copper. This is in line with the previously observed focus on environmental themes and topics such as water and air quality in recent ML-driven research.
To further examine the relationship between frequently mentioned chemicals and thematic topics, we constructed a co-occurrence network (Figure 11B) linking four selected heavy metals from the top 20 list, namely lead, iron, copper, and gold, with the top 50 keywords identified in the co-occurrence network presented in Figure 9. Other top-ranked terms such as carbon or phosphorus were excluded from this analysis due to their ambiguous contextual usage (e.g., structural references rather than chemical investigation). The results show differences in connectivity among the four selected heavy metals. Lead and iron exhibited multiple strong associations (link strength > 5) with the thematic keywords, whereas copper and gold showed more limited linkages. For example, iron was prominently linked with groundwater, and lead showed strong connections with themes such as ozone and prediction, indicating its use in predictive modeling studies. Of note, lead was associated with both environmental and toxicological/health-related research, including studies on wastewater pollution [46], prediction of chemical mixture toxicity and carcinogenicity [43], mitochondrial activity [47], and QSAR modeling [48]. In contrast, copper exhibited fewer and more focused associations, predominantly within environmental research themes. Examples include soil analysis within the classification theme [49], ecotoxicological effects of copper oxide nanomaterials within the modeling theme [50], and soil heavy metal concentration in the spectroscopy theme [51]. This analysis illustrates that while some terms, such as lead and iron, are broadly integrated across multiple research themes, others like copper and gold are more narrowly applied, particularly in environmental monitoring and modeling. We would like to emphasize that this analysis was limited to co-occurrences between selected chemical terms from the top 20 list and the top 50 thematic keywords. Interactions with other potentially relevant terms in the abstracts or keyword sets were not considered. Additionally, the co-occurrence results are sensitive to the thresholds used for filtering, such as the minimum number of documents in which a co-occurrence must appear. Adjusting these thresholds could yield different patterns of association and deserves exploration in future analyses.

3.10. Evolution of Keywords

To identify emerging chemical terms in the domain of ML and environmental chemical research, we analyzed term frequencies across years using document frequency from abstracts, author keywords, and keywords plus. Terms occurring fewer than five times in at least three separate years were excluded from the analysis. From the remaining terms, we selected the top 20 emerging chemicals based on the slope and p-value obtained from simple linear regression analysis of yearly frequency trends. Figure 12A shows a rise in research activity for these ten terms starting in 2018, with a sharp increase after 2020. Interestingly, nine out of the ten emerging terms were also among the top 20 most frequently mentioned chemical terms, indicating not only their cumulative frequency but also their accelerating presence in recent years. One exception is lignin, which does not appear among the top 20 frequent terms but demonstrates a consistent increase in occurrence beginning in 2022. This term is often associated with biomass and bio-oil analysis, suggesting that biomass research is emerging as a relevant theme [52,53].
To uncover additional emerging chemical terms beyond those dominating the top 20, we repeated the same linear regression approach excluding the top 20 chemicals. This allowed us to detect chemicals with more recent and potentially specialized emergence. As shown in Figure 12B, arsenic displayed a marked increase in 2023 and 2024, corresponding to its well-known status as a widespread water contaminant (https://www.who.int/news-room/fact-sheets/detail/arsenic, accessed on 3 July 2025) and the ongoing application of ML in water quality assessment [12,54]. Its 2025 frequency appears lower than in 2024; however, because our corpus extends only to mid-2025, it remains unclear whether interest will continue to rise over the remainder of the year or will it plateau. In contrast, phthalates show a steady increase from 2021 onward, and their mid-2025 frequency already exceeds the total for 2024, indicating growing prominence in both environmental and human health research. While some documents explore phthalate exposure in environmental contexts [55,56,57], the majority of studies apply ML techniques to investigate health-related outcomes, including risks of hyperuricemia [58], attention deficit hyperactivity disorder [59], neurodevelopment [60], and chronic kidney disease [61]. Furthermore, phthalates were studied in the context of chemical mixtures affecting diabetes [62] and metabolic syndrome [63].
While the identification of emerging chemical terms provides valuable insights into shifting research priorities, this analysis is subject to important limitations. Specifically, chemical names that are not explicitly mentioned in abstracts, author keywords, or Keywords Plus were not captured by our frequency-based extraction method. For instance, several studies analyzing the effect of environmental chemicals on estrogen receptor [3,4,5] and progesterone receptor [7] without naming specific compounds. Consequently, these relevant chemicals are inadvertently excluded, which may lead to underrepresentation of their roles in ML-based research. This reflects a common limitation of bibliometric analyses, which rely on the visibility of terms in metadata and abstracts. In conclusion, our analysis reveals both well-established and emerging chemicals in the ML and environmental chemical research domain. However, the use of broader data extraction strategies, such as full-text mining, could enhance the depth and accuracy of such assessments in future studies.

4. Conclusions

This bibliometric map of 3150 Web of Science records documents the accelerating use of ML across environmental chemical research and its early migration toward human health risk assessment. Our findings reveal a rapid increase in research output since 2020, with China and the United States leading in both the number of publications and international collaboration. The majority of publications are concentrated in high-impact environmental science journals. Eight thematic clusters dominate the field, including ML model development, water quality prediction, QSAR applications and PFAS, while a newly formed risk assessment cluster points to emerging dose–response and regulatory applications. Keyword frequencies, however, reveal a 4:1 bias toward environmental endpoints versus human health endpoints, and several high-concern contaminants, such as lignin, arsenic, and phthalates, remain underexplored. When considering these insights, two limitations should be taken into account. First, the reliance on title-abstract keywords may undercount studies that employ ML but do not label methods explicitly. Second, health-related terms are less standardized than ecological descriptors, potentially masking additional studies pertaining to human health. Addressing these gaps will require large-scale, interdisciplinary collaboration that can harmonize chemical and toxicological ontologies, integrate exposure and biomonitoring datasets with ML-ready health outcomes, and embed explainable AI workflows to satisfy regulatory transparency. Expanding chemical coverage, particularly to mixture scenarios and non-ubiquitous yet high-risk compounds, will further align ML innovation with public health protection. Such efforts will ensure more comprehensive and impactful applications of ML in environmental chemical research.
To strengthen feasibility, we anchor our recommendations in concrete EU regulatory use cases. Under the Registration, Evaluation, Authorisation and Restriction of Chemicals (REACH), the European Chemicals Agency’s Guidance on Information Requirements and Chemical Safety Assessment, Chapter R.6 (QSARs and grouping of chemicals) already defines acceptance criteria—defined endpoint, transparent algorithm, applicability domain, performance, and mechanistic interpretation, where possible—so validated ML-based QSARs can be piloted within existing acceptance rules [64,65,66]. Under the Drinking Water Directive (EU) 2020/2184, Member States must set and monitor group parameters for PFAS by 12 January 2026. ML can combine liquid chromatography–high-resolution mass spectrometry non-target data with historical series to prioritize monitoring sites and forecast exceedance risk for targeted sampling and treatment upgrades [67]. The recast Urban Wastewater Treatment Directive (EU) 2024/3019 tightens requirements for monitoring and advanced treatment and introduces new obligations relevant to micropollutants [68]. Here, ML supports optimization of advanced/“fourth-stage” treatment (e.g., ozonation, granular activated carbon) and anomaly detection in plant operations. The microplastics restriction (Commission Regulation (EU) 2023/2055) enables ML-assisted product classification, hotspot detection in influent/effluent, and compliance tracking across supply chains [69]. Finally, the EU AI Act (Regulation (EU) 2024/1689) provides a governance layer for high-impact ML tools (data management, transparency, risk management [70].
Beyond the EU, analogous regulatory pathways exist that make our recommendations feasible internationally. In the United States, EPA’s final PFAS National Primary Drinking Water Regulation sets enforceable maximum contaminant levels for several PFASs and their mixtures. ML can prioritize monitoring, forecast exceedances, and optimize treatment responses using data streams from the fifth Unregulated Contaminant Monitoring Rule (2023–2025) [71,72,73]. In parallel, EPA’s New Approach Methods (NAMs) Work Plan provides a policy pathway for integrating QSAR/read-across and other non-animal methods into chemical decisions, aligning with the Organisation for Economic Co-operation and Development’s validation principles [74]. In the United Kingdom, UK REACH explicitly permits Annex 11 adaptations (e.g., read-across, QSAR) and Health and Safety Executive guidance encourages minimizing vertebrate testing, thereby providing a clear acceptance route for validated ML-based predictions [75,76]. Under Canada’s Canadian Environmental Protection Act/Chemicals Management Plan, Health Canada and Environment and Climate Change Canada formally employ analog/read-across approaches in substance assessments, which can be supported by ML-assisted similarity and endpoint prediction [77,78]. Australia’s Australian Industrial Chemicals Introduction Scheme similarly recognizes read-across/grouping to fill data gaps for hazard characterization, which is another integration point for ML-based QSAR and category inference [79,80]. Finally, under Japan’s Chemical Substance Control Law, the regulators (Ministry of Economy, Trade and Industry; Ministry of Health, Labor and Welfare; Ministry of the Environment) maintain QSAR resources and guidance for bioconcentration/biodegradation, enabling ML-supported predictions to complement testing of new/existing chemicals [81,82]. These examples show that the regulatory “hooks” for ML are already present across multiple jurisdictions. Concrete entry points (screening, read-across support, exceedance forecasting, treatment optimization, and anomaly detection) are therefore immediately actionable with appropriate validation and documentation.
In conclusion, ML has already transformed how scientists characterize environmental chemicals. The next step is to couple those advances with robust human health datasets and transparent algorithms. Doing so will create an end-to-end pipeline that screens large chemical inventories in silico, converts hazards into dose-response metrics, and communicates uncertainty clearly to regulators, thereby accelerating ML uptake where it matters most to public health.

Supplementary Materials

The following supporting information can be downloaded at: https://www.mdpi.com/article/10.3390/toxics13100817/s1, Figure S1. International country co-authorship density map for research on ML applications in environmental chemical research. Nodes represent countries meeting the inclusion threshold of ≥10 publications, node size scales with publication output, and color intensity reflects local co-authorship density (total link strength). Layout and clusters were generated in VOSviewer using association-strength normalization. Figure S2. Institutional co-authorship density map for research on ML applications in environmental chemical research. Nodes denote institutions meeting the inclusion threshold of ≥10 publications, node size scales with publication output, and color intensity reflects local co-authorship density (total link strength). Layout and clusters were generated in VOSviewer using association-strength normalization. Figure S3. Source (journal) co-citation density map for research on ML applications in environmental chemical research. Nodes denote journals meeting the inclusion threshold of ≥100 citations, node size scales with citation frequency, and color intensity reflects local co-citation density (total link strength). Layout and clusters were generated in VOSviewer using association-strength normalization. Figure S4. Cited reference co-citation density map for research on ML applications in environmental chemical research. Nodes denote references meeting the inclusion threshold of ≥20 citations (shown as first author, year, source), node size scales with citation frequency, and color intensity reflects local co-citation density (total link strength). Layout and clustering were generated in VOSviewer using association-strength normalization.

Author Contributions

Conceptualization, N.A.; formal analysis, B.S. and N.A.; funding acquisition, N.A.; investigation, B.S.; methodology, B.S.; supervision, N.A.; visualization, B.S. and N.A.; writing—original draft, B.S. and N.A.; writing—review and editing, B.S. and N.A. All authors have read and agreed to the published version of the manuscript.

Funding

This work was supported by the Provincial Secretariat for Higher Education and Scientific Research of the Autonomous Province of Vojvodina (Contract number 003088437 2024 09418 003 000 000 001/1).

Institutional Review Board Statement

Not applicable.

Informed Consent Statement

Not applicable.

Data Availability Statement

Data will be made available on request.

Conflicts of Interest

The authors declare no conflicts of interest.

References

  1. Kleinstreuer, N.; Hartung, T. Artificial intelligence (AI)-it’s the end of the tox as we know it (and I feel fine). Arch. Toxicol. 2024, 98, 735–754. [Google Scholar] [CrossRef] [PubMed]
  2. Hartung, T. Artificial intelligence as the new frontier in chemical risk assessment. Front. Artif. Intell. 2023, 6, 1269932. [Google Scholar] [CrossRef]
  3. Piir, G.; Sild, S.; Maran, U. Interpretable machine learning for the identification of estrogen receptor agonists, antagonists, and binders. Chemosphere 2024, 347, 140671. [Google Scholar] [CrossRef]
  4. Zorn, K.M.; Foil, D.H.; Lane, T.R.; Russo, D.P.; Hillwalker, W.; Feifarek, D.J.; Jones, F.; Klaren, W.D.; Brinkman, A.M.; Ekins, S. Machine Learning Models for Estrogen Receptor Bioactivity and Endocrine Disruption Prediction. Environ. Sci. Technol. 2020, 54, 12202–12213. [Google Scholar] [CrossRef]
  5. Mansouri, K.; Abdelaziz, A.; Rybacka, A.; Roncaglioni, A.; Tropsha, A.; Varnek, A.; Zakharov, A.; Worth, A.; Richard, A.M.; Grulke, C.M.; et al. CERAPP: Collaborative Estrogen Receptor Activity Prediction Project. Environ. Health Perspect. 2016, 124, 1023–1033. [Google Scholar] [CrossRef]
  6. Ciallella, H.L.; Russo, D.P.; Aleksunes, L.M.; Grimm, F.A.; Zhu, H. Predictive modeling of estrogen receptor agonism, antagonism, and binding activities using machine- and deep-learning approaches. Lab. Investig. 2021, 101, 490–502. [Google Scholar] [CrossRef]
  7. Milosevic, N.; Milosevic, N.S.; Nedeljkovic, S.F.; Stanic, B.; Andric, N. Prediction of progesterone receptor binding potency, agonism and antagonism using machine learning models. Comput. Toxicol. 2025, 34, 100351. [Google Scholar] [CrossRef]
  8. Lane, T.R.; Vignaux, P.A.; Harris, J.S.; Snyder, S.H.; Urbina, F.; Ekins, S. Machine Learning and Large Language Models for Modeling Complex Toxicity Pathways and Predicting Steroidogenesis. Environ. Sci. Technol. 2025, 59, 13844–13856. [Google Scholar] [CrossRef]
  9. Sukur, N.; Milošević, N.; Pogrmic-Majkic, K.; Stanic, B.; Andric, N. Predicting chemicals’ toxicity pathway of female reproductive disorders using AOP7 and deep neural networks. Food Chem. Toxicol. 2023, 180, 114013. [Google Scholar] [CrossRef]
  10. Viganò, E.L.; Ballabio, D.; Roncaglioni, A. Artificial Intelligence and Machine Learning Methods to Evaluate Cardiotoxicity following the Adverse Outcome Pathway Frameworks. Toxics 2024, 12, 87. [Google Scholar] [CrossRef] [PubMed]
  11. Wei, H.; Sun, J.; Shan, W.; Xiao, W.; Wang, B.; Ma, X.; Hu, W.; Wang, X.; Xia, Y. Environmental chemical exposure dynamics and machine learning-based prediction of diabetes mellitus. Sci. Total Environ. 2022, 806, 150674. [Google Scholar] [CrossRef]
  12. Hu, X.C.; Dai, M.; Sun, J.M.; Sunderland, E.M. The Utility of Machine Learning Models for Predicting Chemical Contaminants in Drinking Water: Promise, Challenges, and Opportunities. Curr. Environ. Health Rep. 2023, 10, 45–60. [Google Scholar] [CrossRef]
  13. Sun, Y.; Wang, X.; Ren, N.; Liu, Y.; You, S. Improved Machine Learning Models by Data Processing for Predicting Life-Cycle Environmental Impacts of Chemicals. Environ. Sci. Technol. 2023, 57, 3434–3444. [Google Scholar] [CrossRef] [PubMed]
  14. Cojbasic, S.; Dmitrasinovic, S.; Kostic, M.; Turk Sekulic, M.; Radonic, J.; Dodig, A.; Stojkovic, M. Application of machine learning in river water quality management: A review. Water Sci. Technol. 2023, 88, 2297–2308. [Google Scholar] [CrossRef]
  15. Cui, S.; Gao, Y.; Huang, Y.; Shen, L.; Zhao, Q.; Pan, Y.; Zhuang, S. Advances and applications of machine learning and deep learning in environmental ecology and health. Environ. Pollut. 2023, 335, 122358. [Google Scholar] [CrossRef] [PubMed]
  16. Grisoni, F.; Consonni, V.; Ballabio, D. Machine Learning Consensus To Predict the Binding to the Androgen Receptor within the CoMPARA Project. J. Chem. Inf. Model. 2019, 59, 1839–1848. [Google Scholar] [CrossRef]
  17. Wan, H.; Xiang, L.; Cai, Y.; Xie, Y.; Xu, R. Temporal and spatial feature extraction using graph neural networks for multi-point water quality prediction in river network areas. Water Res. 2025, 281, 123561. [Google Scholar] [CrossRef] [PubMed]
  18. Valladares-Castellanos, M.; de Jesús Crespo, R.; Douthat, T. Using machine learning for long-term calibration and validation of water quality ecosystem service models in data-scarce regions. Sci. Total Environ. 2025, 1000, 180388. [Google Scholar] [CrossRef] [PubMed]
  19. Boroujerd, L.M.; Shakerdonyavi, A.; Asadgol, Z.; Donyavi, T.; Tavakoli, A.; Asl, Y.A.; Jabali, S.M.T.; Bahari, N.; Shahouri, M.; Safarpour, E. Machine learning-based prediction of drinking water quality index in Western Tehran using KAN, MLP, and traditional models. Environ. Monit. Assess. 2025, 197, 1065. [Google Scholar] [CrossRef]
  20. Chen, Y.; Wu, Y.; Zhang, S.; Yuan, K.; Huang, J.; Shi, D.; Hu, S. Regional PM2.5 prediction with hybrid directed graph neural networks and Spatio-temporal fusion of meteorological factors. Environ. Pollut. 2025, 366, 125404. [Google Scholar] [CrossRef]
  21. Li, T.; Huang, X.; Zhang, Q.; Wang, X.; Wang, X.; Zhu, A.; Wei, Z.; Wang, X.; Wang, H.; Chen, J.; et al. Machine learning-guided integration of fixed and mobile sensors for high resolution urban PM2.5 mapping. npj Clim. Atmos. Sci. 2025, 8, 95. [Google Scholar] [CrossRef]
  22. Zhang, Q.; Wang, Y.; Xiao, Q.; Geng, G.; Davis, S.J.; Liu, X.; Yang, J.; Liu, J.; Huang, W.; He, C.; et al. Long-range PM2.5 pollution and health impacts from the 2023 Canadian wildfires. Nature 2025, 645, 672–678. [Google Scholar] [CrossRef]
  23. Hou, D.; Jia, X.; Wang, L.; McGrath, S.P.; Zhu, Y.G.; Hu, Q.; Zhao, F.J.; Bank, M.S.; O’Connor, D.; Nriagu, J. Global soil pollution by toxic metals threatens agriculture and human health. Science 2025, 388, 316–321. [Google Scholar] [CrossRef]
  24. Ma, X.; Guan, D.X.; Zhang, C.; Yu, T.; Li, C.; Wu, Z.; Li, B.; Geng, W.; Wu, T.; Yang, Z. Improved mapping of heavy metals in agricultural soils using machine learning augmented with spatial regionalization indices. J. Hazard. Mater. 2024, 478, 135407. [Google Scholar] [CrossRef]
  25. Yarmohammadi, F.; Hayes, A.W.; Karimi, G. Research trends of computational toxicology: A bibliometric analysis. Toxicol. Res. 2024, 13, tfae147. [Google Scholar] [CrossRef]
  26. Jeong, J.; Choi, J. Artificial Intelligence-Based Toxicity Prediction of Environmental Chemicals: Future Directions for Chemical Management Applications. Environ. Sci. Technol. 2022, 56, 7532–7543. [Google Scholar] [CrossRef]
  27. Ajisafe, O.M.; Adekunle, Y.A.; Egbon, E.; Ogbonna, C.E.; Olawade, D.B. The role of machine learning in predictive toxicology: A review of current trends and future perspectives. Life Sci. 2025, 378, 123821. [Google Scholar] [CrossRef] [PubMed]
  28. Breiman, L. Random Forests. Mach. Learn. 2001, 45, 5–32. [Google Scholar] [CrossRef]
  29. Cortes, C.; Vapnik, V. Support-vector networks. Mach. Learn. 1995, 20, 273–297. [Google Scholar] [CrossRef]
  30. Lundberg, S.M.; Erion, G.; Chen, H.; DeGrave, A.; Prutkin, J.M.; Nair, B.; Katz, R.; Himmelfarb, J.; Bansal, N.; Lee, S.I. From Local Explanations to Global Understanding with Explainable AI for Trees. Nat. Mach. Intell. 2020, 2, 56–67. [Google Scholar] [CrossRef]
  31. Rogers, D.; Hahn, M. Extended-connectivity fingerprints. J. Chem. Inf. Model. 2010, 50, 742–754. [Google Scholar] [CrossRef]
  32. Yap, C.W. PaDEL-descriptor: An open source software to calculate molecular descriptors and fingerprints. J. Comput. Chem. 2011, 32, 1466–1474. [Google Scholar] [CrossRef]
  33. Jo, Y.; Shin, M.Y.; Kim, S. Assessing the association of multi-environmental chemical exposures on metabolic syndrome: A machine learning approach. Environ. Int. 2025, 199, 109481. [Google Scholar] [CrossRef]
  34. Hua, Y.; Shi, Y.; Cui, X.; Li, X. In silico prediction of chemical-induced hematotoxicity with machine learning and deep learning methods. Mol. Divers. 2021, 25, 1585–1596. [Google Scholar] [CrossRef]
  35. Pant, P.; Rajawat, A.S.; Goyal, S.B.; Chakrabarti, P.; Bedi, P.; Salau, A.O. Machine learning-based approach to predict ice meltdown in glaciers due to climate change and solutions. Environ. Sci. Pollut. Res. Int. 2023, 30, 125176–125187. [Google Scholar] [CrossRef]
  36. Liu, Z.; Dong, M.; Xue, W.; Ni, X.; Qi, Z.; Shao, J.; Guo, Y.; Ma, M.; Zhang, Q.; Wang, J. Interaction Patterns between Climate Action and Air Cleaning in China: A Two-Way Evaluation Based on an Ensemble Learning Approach. Environ. Sci. Technol. 2022, 56, 9291–9301. [Google Scholar] [CrossRef]
  37. Karak, P.; Parveen, A.; Modak, A.; Adhikari, A.; Chakrabortty, S. Microplastic Pollution: A Global Environmental Crisis Impacting Marine Life, Human Health, and Potential Innovative Sustainable Solutions. Int. J. Environ. Res. Public Health 2025, 22, 889. [Google Scholar] [CrossRef]
  38. Kida, M.; Pochwat, K.; Ziembowicz, S. Assessment of machine learning-based methods predictive suitability for migration pollutants from microplastics degradation. J. Hazard. Mater. 2024, 461, 132565. [Google Scholar] [CrossRef]
  39. Zheng, Y.; Zhou, H.; Peng, Y.; Wang, X.; Yang, Y.; Deng, Y.; Liu, Y.; Pan, H.; Zhao, X.; Yang, X.; et al. Deep learning-enhanced hyperspectral imaging for rapid screening of Co-metabolic microplastic-degrading bacteria in environmental samples. J. Hazard. Mater. 2025, 493, 138370. [Google Scholar] [CrossRef]
  40. Agyeman, P.C.; Ahado, S.K.; Borůvka, L.; Biney, J.K.M.; Sarkodie, V.Y.O.; Kebonye, N.M.; Kingsley, J. Trend analysis of global usage of digital soil mapping models in the prediction of potentially toxic elements in soil/sediments: A bibliometric review. Environ. Geochem. Health 2021, 43, 1715–1739. [Google Scholar] [CrossRef]
  41. Auzzas, A.; Capra, G.F.; Jani, A.D.; Ganga, A. An improved digital soil mapping approach to predict total N by combining machine learning algorithms and open environmental data. Model. Earth Syst. Environ. 2024, 10, 6519–6538. [Google Scholar] [CrossRef]
  42. Dvornikov, Y.; Slukovskaya, M.; Gurinov, A.; Vasenev, V. Soil type and content of macro-elements determine hotspots of Cu and Ni accumulation in soils of subarctic industrial barren: Inference from a cascade machine learning. Environ. Pollut. 2025, 377, 126457. [Google Scholar] [CrossRef]
  43. Limbu, S.; Glasgow, E.; Block, T.; Dakshanamurthy, S. A Machine-Learning-Driven Pathophysiology-Based New Approach Method for the Dose-Dependent Assessment of Hazardous Chemical Mixtures and Experimental Validations. Toxics 2024, 12, 481. [Google Scholar] [CrossRef]
  44. Long, T.Z.; Shi, S.H.; Liu, S.; Lu, A.P.; Liu, Z.Q.; Li, M.; Hou, T.J.; Cao, D.S. Structural Analysis and Prediction of Hematotoxicity Using Deep Learning Approaches. J. Chem. Inf. Model. 2023, 63, 111–125. [Google Scholar] [CrossRef]
  45. Maeda, K.; Hirano, M.; Hayashi, T.; Iida, M.; Kurata, H.; Ishibashi, H. Elucidating Key Characteristics of PFAS Binding to Human Peroxisome Proliferator-Activated Receptor Alpha: An Explainable Machine Learning Approach. Environ. Sci. Technol. 2024, 58, 488–497. [Google Scholar] [CrossRef]
  46. Nguyen, D.V.; Park, J.; Lee, H.; Han, T.; Wu, D. Assessing industrial wastewater effluent toxicity using boosting algorithms in machine learning: A case study on ecotoxicity prediction and control strategy development. Environ. Pollut. 2024, 341, 123017. [Google Scholar] [CrossRef] [PubMed]
  47. Zhao, P.; Peng, Y.; Xu, X.; Wang, Z.; Wu, Z.; Li, W.; Tang, Y.; Liu, G. In silico prediction of mitochondrial toxicity of chemicals using machine learning methods. J. Appl. Toxicol. 2021, 41, 1518–1526. [Google Scholar] [CrossRef]
  48. Zang, Q.; Rotroff, D.M.; Judson, R.S. Binary classification of a large collection of environmental chemicals from estrogen receptor assays by quantitative structure-activity relationship and machine learning methods. J. Chem. Inf. Model. 2013, 53, 3244–3261. [Google Scholar] [CrossRef]
  49. Ahmad, F.; Javed, K.; Tahir, A.; Khan, M.U.G.; Abbas, M.; Rabbani, M.; Shabbir, M.Z. Identifying key soil characteristics for Francisella tularensis classification with optimized Machine learning models. Sci. Rep. 2024, 14, 1743. [Google Scholar] [CrossRef] [PubMed]
  50. Scott-Fordsmand, J.J.; Gomes, S.I.L.; Pokhrel, S.; Mädler, L.; Fasano, M.; Asinari, P.; Tämm, K.; Jänes, J.; Amorim, M.J.B. Machine Learning Allowed Interpreting Toxicity of a Fe-Doped CuO NM Library Large Data Set─An Environmental In Vivo Case Study. ACS Appl. Mater. Interfaces 2024, 16, 42862–42872. [Google Scholar] [CrossRef] [PubMed]
  51. Han, Y.; Zhang, S.; Dai, C.; Peng, J.; Chen, Y.; Ke, H. Estimating soil cadmium concentration using multi-source UAV imagery and machine learning techniques. Environ. Monit. Assess. 2025, 197, 583. [Google Scholar] [CrossRef] [PubMed]
  52. Castro Garcia, A.; Cheng, S.; McGlynn, S.E.; Cross, J.S. Machine Learning Model Insights into Base-Catalyzed Hydrothermal Lignin Depolymerization. ACS Omega 2023, 8, 32078–32089. [Google Scholar] [CrossRef] [PubMed]
  53. Castro Garcia, A.; Shuo, C.; Cross, J.S. Machine learning based analysis of reaction phenomena in catalytic lignin depolymerization. Bioresour. Technol. 2022, 345, 126503. [Google Scholar] [CrossRef]
  54. Wu, R.; Polya, D.A. Objective Cost-Informed Cutoff Criteria Improve the Utility of Machine Learning Models of Environmental Hazards: A Case Study of Groundwater Arsenic Distribution in India. Expo. Health 2024, 16, 619–631. [Google Scholar] [CrossRef]
  55. Cai, S.; Zhang, X.; Sun, T.; Zhou, H.; Zhang, Y.; Yang, P.; Wang, D.; Zhang, J.; Hu, C.; Zhang, W. Integrating machine learning, suspect and nontarget screening reveal the interpretable fates of micropollutants and their transformation products in sludge. J. Hazard. Mater. 2025, 487, 137183. [Google Scholar] [CrossRef]
  56. Kida, M.; Pochwat, K.; Ziembowicz, S.; Pizzo, H. The use of artificial neural networks in modelling migration pollutants from the degradation of microplastics. Sci. Total Environ. 2023, 904, 166856. [Google Scholar] [CrossRef]
  57. Wei, W.; Sivanantham, S.; Malingre, L.; Ramalho, O.; Mandin, C. Predicting the rate constants of semivolatile organic compounds with hydroxyl radicals and ozone in indoor air. Environ. Pollut. 2020, 266, 115050. [Google Scholar] [CrossRef]
  58. Lu, X.; Kou, H.; Li, C.; Zhan, R.; Guo, R.; Liu, S.; Shen, P.; Shen, M.; Du, T.; Lu, J.; et al. Development and validation of an interpretable machine learning model for predicting hyperuricemia risk: Based on environmental chemical exposure. Ecotoxicol. Environ. Saf. 2025, 299, 118392. [Google Scholar] [CrossRef]
  59. Ishido, M. Chemical nature of attention deficit hyperactivity disorder (ADHD)—Related chemical subfamily. Chemosphere 2023, 313, 137495. [Google Scholar] [CrossRef] [PubMed]
  60. England-Mason, G.; MacEachern, S.J.; Amador, K.; Soomro, M.H.; Reardon, A.J.F.; MacDonald, A.M.; Kinniburgh, D.W.; Letourneau, N.; Giesbrecht, G.F.; Martin, J.W.; et al. Using machine learning to investigate the influence of the prenatal chemical exposome on neurodevelopment of young children. Neurotoxicology 2025, 108, 218–230. [Google Scholar] [CrossRef]
  61. Zhang, B.; Chen, L.; Li, T. Unveiling the effect of urinary xenoestrogens on chronic kidney disease in adults: A machine learning model. Ecotoxicol. Environ. Saf. 2025, 292, 117945. [Google Scholar] [CrossRef]
  62. Lind, L.; Salihovic, S.; Lind, P.M. Mixtures of environmental contaminants and diabetes. Sci. Total Environ. 2023, 859, 159993. [Google Scholar] [CrossRef]
  63. Li, R.Q.; Lin, X.Y.; Lu, T.Y.; Wang, J.; Wang, Y.; Xu, L. Associations between exposure to multiple environmental chemicals and metabolic syndrome: A mixture analysis. Hyg. Environ. Health Adv. 2024, 12, 100112. [Google Scholar] [CrossRef]
  64. European Chemicals Agency (ECHA). Guidance on Information Requirements and Chemical Safety Assessment—Chapter R.6: QSARs and Grouping of Chemicals; ECHA: Helsinki, Finland, 2008; Available online: https://echa.europa.eu/guidance-documents/guidance-on-information-requirements-and-chemical-safety-assessment (accessed on 17 September 2025).
  65. OECD. OECD Principles for the Validation, for Regulatory Purposes, of (Q)SAR Models (ENV/JM/MONO(2007)2); OECD: Paris, France, 2007; Available online: https://www.oecd.org/content/dam/oecd/en/topics/policy-sub-issues/assessment-of-chemicals/oecd-principles-for-the-validation-for-regulatory-purposes-of-quantitative-structure-activity-relationship-models.pdf (accessed on 17 September 2025).
  66. OECD. (Q)SAR Assessment Framework (QAF): Guidance for the Regulatory Assessment of (Q)SAR Models and Predictions, 2nd ed.; OECD: Paris, France, 2024; Available online: https://one.oecd.org/document/ENV/CBC/MONO%282023%2932/en/pdf (accessed on 17 September 2025).
  67. European Parliament and Council. Directive (EU) 2020/2184 of 16 December 2020 on the Quality of Water Intended for Human Consumption (Recast). Off. J. 2020, L 435, 1–62. Available online: http://data.europa.eu/eli/dir/2020/2184/oj (accessed on 17 September 2025).
  68. European Parliament and Council. Directive (EU) 2024/3019 of 27 November 2024 Concerning Urban Wastewater Treatment (Recast). Off. J. 2024, L, 3019. Available online: http://data.europa.eu/eli/dir/2024/3019/oj (accessed on 17 September 2025).
  69. European Commission. Commission Regulation (EU) 2023/2055 of 25 September 2023 Amending Annex XVII to REACH as Regards Synthetic Polymer Microparticles (Microplastics). Off. J. 2023, L 238, 67–88. Available online: http://data.europa.eu/eli/reg/2023/2055/oj (accessed on 17 September 2025).
  70. European Parliament and Council. Regulation (EU) 2024/1689 of 13 June 2024 Laying down Harmonised Rules on Artificial Intelligence (Artificial Intelligence Act). Available online: http://data.europa.eu/eli/reg/2024/1689/oj (accessed on 17 September 2025).
  71. U.S. EPA. PFAS National Primary Drinking Water Regulation; Final Rule. Federal Register, 89(82), 2024. ELI/FR Doc No. 2024-07773. Available online: https://www.federalregister.gov/documents/2024/04/26/2024-07773/pfas-national-primary-drinking-water-regulation (accessed on 18 September 2025).
  72. U.S. EPA. Fifth Unregulated Contaminant Monitoring Rule (UCMR 5). Webpage. Available online: https://www.epa.gov/dwucmr/fifth-unregulated-contaminant-monitoring-rule (accessed on 18 September 2025).
  73. U.S. EPA. UCMR 5 Data Summary (Rolling Releases, 2025). PDF. Available online: https://www.epa.gov/system/files/documents/2023-08/ucmr5-data-summary_0.pdf (accessed on 18 September 2025).
  74. U.S. EPA. EPA New Approach Methods (NAMs) Work Plan. Webpage. Available online: https://www.epa.gov/chemical-research/new-approach-methods-work-plan (accessed on 18 September 2025).
  75. HSE. UK REACH Explained. Webpage. Available online: https://www.hse.gov.uk/reach/about.htm (accessed on 18 September 2025).
  76. HSE. Recommendations to Registrants: Minimising Vertebrate Testing Under UK REACH (Annex 11). Webpage. Available online: https://www.hse.gov.uk/reach/reports/recommendations.htm (accessed on 18 September 2025).
  77. Health Canada. Use of Analogues and Read-Across in Risk Assessment. Webpage. Available online: https://www.canada.ca/en/health-canada/services/chemical-substances/fact-sheets/analogues-read-across-risk-assessment.html (accessed on 18 September 2025).
  78. ECCC/Health Canada. Chemicals Management Plan (CMP). Webpage. Available online: https://www.canada.ca/en/environment-climate-change/services/evaluating-existing-substances/chemicals-management-plan.html (accessed on 18 September 2025).
  79. AICIS. Working Out Your Hazards Using Read-Across Information. Webpage. Available online: https://www.industrialchemicals.gov.au/help-and-guides/working-out-your-hazards-using-read-across-information (accessed on 18 September 2025).
  80. AICIS. Read-Across Approach (Glossary). Webpage. Available online: https://www.industrialchemicals.gov.au/glossary/read-across-approach (accessed on 18 September 2025).
  81. NITE. Evaluation of Biodegradation and Bioconcentration (CSCL) & QSAR Resources. Webpage. Available online: https://www.nite.go.jp/en/chem/qsar/evaluation.html (accessed on 18 September 2025).
  82. METI. CSCL—Procedure for New Chemicals (Guidance Excerpt; QSAR/Read-Across for BCF). PDF. Available online: https://www.meti.go.jp/policy/chemical_management/english/cscl/files/about/03CSCLnewchem.pdf (accessed on 18 September 2025).
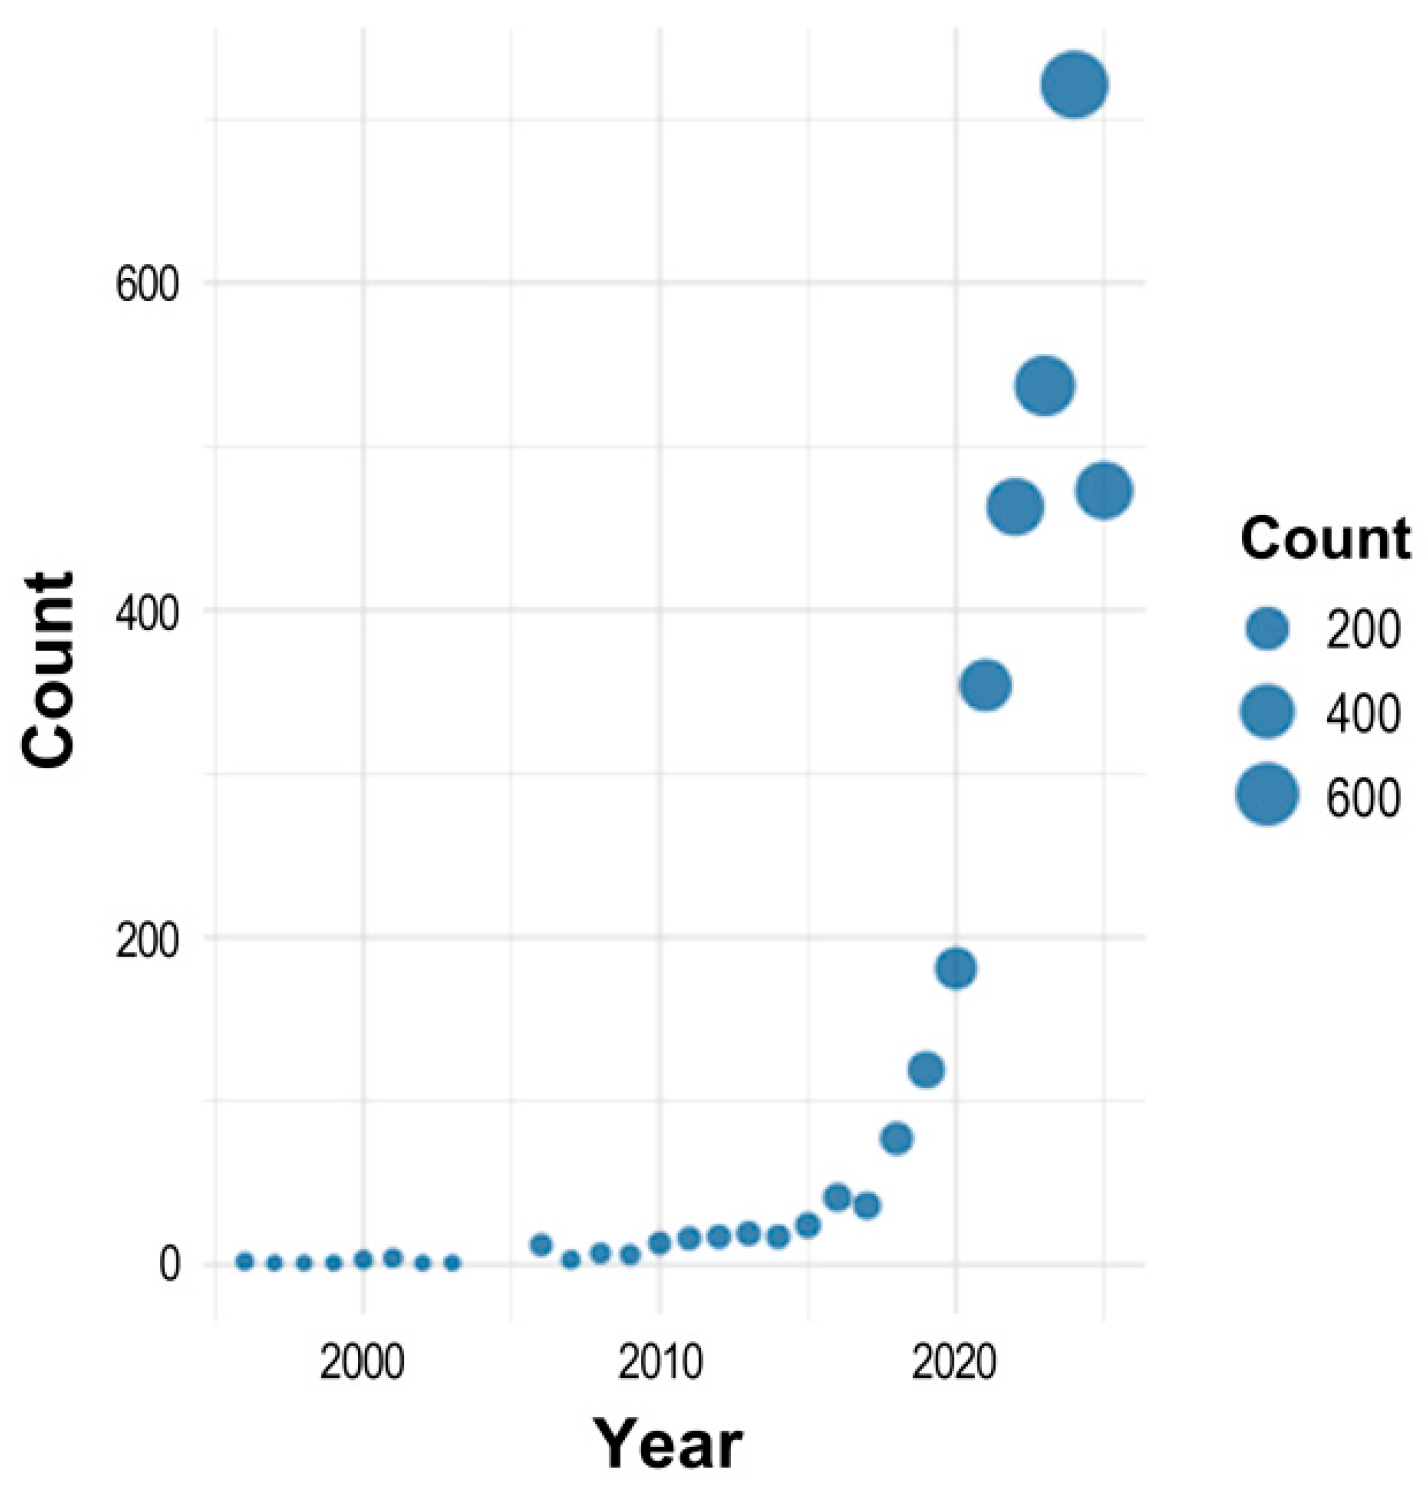
Figure 1. Annual publication trends in ML and environmental chemical research (1996–2025), showing a sharp increase after 2020.
Toxics 13 00817 g001
Figure 2. (A) Top contributing countries in ML and environmental chemical research based on publication counts (1996–2025). (B) TLS values for each country, shown numerically to the right of the corresponding bars.
Toxics 13 00817 g002
Figure 3. Co-authorship network of countries in ML and environmental chemical research, with clusters representing collaborative relationships (minimum 10 publications per country).
Toxics 13 00817 g003
Figure 4. Institutional co-authorship network in ML and environmental chemical research, showing major collaboration clusters (minimum 10 documents per institution).
Toxics 13 00817 g004
Figure 5. Co-citation network of cited sources (journals) with more than 100 citations.
Toxics 13 00817 g005
Figure 6. Top 10 Web of Science categories contributing to ML and environmental chemical research, ranked by number of publications.
Toxics 13 00817 g006
Figure 7. Co-citation network of the 154 most cited references (minimum 20 citations) in ML and environmental chemical research, with clustering based on citation links.
Toxics 13 00817 g007
Figure 8. Keyword co-occurrence network for the top 50 terms in ML and environmental chemical research, with clusters representing distinct thematic domains.
Toxics 13 00817 g008
Figure 9. Quadrant analysis of the top 50 keywords based on total link strength (TLS) and novelty (pre/post 2022), identifying emerging and established research themes.
Toxics 13 00817 g009
Figure 10. Frequencies of environmental and human health-related terms in abstracts, keywords, and keywords plus, illustrating thematic focus in 3150 publications.
Toxics 13 00817 g010
Figure 11. (A) Top 20 most frequently mentioned chemical terms. (B) Co-occurrence network between four selected heavy metals (lead, iron, copper, and gold) and the top 50 thematic keywords.
Toxics 13 00817 g011
Figure 12. Frequencies of emerging chemical terms across years within the domain of ML and environmental chemical research. (A) Yearly trends of the top 10 emerging chemical terms based on regression slope and p-value. (B) Yearly trends of the emerging chemicals beyond the top 20.
Toxics 13 00817 g012
Table 1. Top 10 institutions contributing to ML and environmental chemical research (1996–2025), ranked by number of publications and percentage of total output.
InstitutionNumber of Publications% of Total Output
Chinese Academy of Sciences1745.55
United States Department of Energy 1133.62
University of California System1063.39
University of Chinese Academy of Sciences 752.41
Swiss Federal Institutes of Technology Domain642.03
Tsinghua University642.03
Centre National De La Recherche Scientifique571.81
Zhejiang University551.75
Helmholtz Association501.58
Egyptian Knowledge Bank491.56
Table 2. Top 10 authors contributing to ML and environmental chemical research (1996–2025), ranked by number of publications.
Author NameAffiliationNumber of PublicationsCitationsTLS
Jingwen Chen Dalian University of Technology, Dalian, China152151923
Hao Zhu Tulane University, New Orleans, United States135123441
Weihua Li East China University of Science and Technology, Shanghai, China135123441
Guixia Liu East China University of Science and Technology, Shanghai, China135123441
Yun TangEast China University of Science and Technology, Shanghai, China136761156
Yang LiuEmory University, Atlanta, United States12184221
Yinchang FengNankai University, Tianjin, China11263368
Huichun ZhangCase Western Reserve University, Cleveland, United States102771531
Huixiao Hong US Food and Drug Administration, Jefferson, United States10771499
Tengyi ZhuYangzhou University, Yangzhou, China1052379
Table 3. Top 10 journals based on co-citation analysis, including TLS, citations, impact factors, and category quartile.
JournalCountryClusterLinksTLSCitationsImpact FactorCategory Quartile
Environmental Science and TechnologyUSA3275190,071466511.3Q1
Science of the Total Environment aNetherlands5275177,34239598.0Q1
Atmospheric Chemistry and PhysicsGermany522993,89421565.1Q1
Chemosphere bNetherlands327592,74619318.1 cQ1
Atmospheric EnvironmentUK526472,87717013.7Q1
Environmental PollutionNetherlands527271,49215147.3Q1
Water ResearchNetherlands127370,609179512.4Q1
Journal of Hazardous MaterialsNetherlands427567,983140511.3Q1
Chemical Engineering JournalSwitzerland427367,687124513.2Q1
Journal of Cleaner ProductionNetherlands427360,527123310.0Q1
a—‘On Hold’ status at the point of Journal Citation Report (JCR) release in June 2025. b—Delisted from the Web of Science Master Journal List on 16 December 2024. c—JCR year 2023.
Table 4. Top 10 most highly cited references in the dataset (1996–2025), ranked by TLS, with citation counts and clustering information.
NameClusterLinksTLSCitations
Pedregosa, F., Varoquaux, G., Gramfort, A., Michel, V., Thirion, B. et al. 2011. Scikit-learn: Machine Learning in Python. Journal of Machine Learning Research 12(85), 2825–2830.3141935303
Breiman, L. 2001. Random Forests. Machine Learning 45, 5–32.1142868279
Lundberg, S.M., Lee, S.-I. 2017. A Unified Approach to Interpreting Model Predictions. Advances in Neural Information Processing Systems 30, arXiv:1705.07874.4129593168
Friedman, J.H. 2001. Greedy Function Approximation: A Gradient Boosting Machine. Annals of Statistics 29(5), 1189–1232.1138571129
Cortes, C., Vapnik, V. 1995. Support-Vector Networks. Machine Learning 20, 273–297.1117512133
Yap, C.W. 2011. PaDEL-descriptor: An open source software to calculate molecular descriptors and fingerprints. Journal of Computational Chemistry 32(7), 1466–1474.2103482108
Rogers, D., Hahn, M. 2010. Extended-Connectivity Fingerprints. Journal of Chemical Information and Modeling 50(5), 742–754.210346193
Lundberg, S.M., Erion, G., Chen, H., DeGrave, A., Prutkin, J.M. et al. 2020. From Local Explanations to Global Understanding with Explainable AI for Trees. Nature Machine Intelligence 2(1), 56–67.49835686
Zhong, S., Zhang, K., Bagheri, M., Burken, J.G., Gu, A. et al. 2021. Machine Learning: New Ideas and Tools in Environmental Science and Engineering. Environmental Science and Technology 55(19), 12741–12754.58528681
Moriwaki, H., Tian, Y.-S., Kawashita, N., Takagi, T. 2018. Mordred: a molecular descriptor calculator. Journal of Cheminformatics 10, 4.28927754
Table 5. Keyword clusters in ML and environmental chemical research, based on co-occurrence analysis and leading term identification using TF-IDF.
ClusterKeywordsCountLeading Keyword (TF-IDF)
1Artificial Intelligence; Artificial Neural Networks; Big Data; Classification; Climate Change; Deep Learning; Machine Learning; Microplastics; Neural Networks; Precision Agriculture; Spectroscopy; Sustainability12Machine Learning
2Air Pollution; Machine Learning Models; Ozone; Particulate Matter; PM2.5; Prediction; Random Forest; SHAP; Source Apportionment9Random Forest
3Artificial Neural Network; Feature Selection; Genetic Algorithm; Neural Network; Predictive Modeling; Principal Component Analysis; Support Vector Machine; Toxicity Prediction8Artificial Neural Network
4Adsorption; Biochar; Heavy Metals; Modeling; Wastewater Treatment5Adsorption
5Digital Soil Mapping; Ensemble Learning; Remote Sensing; Wastewater; Water Quality5Water Quality
6Cheminformatics; Data Mining; QSAR; QSPR4QSAR
7Computational Toxicology; Risk Assessment; Toxicity; XGBoost4Risk Assessment
8Groundwater; Molecular Docking; PFAS3PFAS
Disclaimer/Publisher’s Note: The statements, opinions and data contained in all publications are solely those of the individual author(s) and contributor(s) and not of MDPI and/or the editor(s). MDPI and/or the editor(s) disclaim responsibility for any injury to people or property resulting from any ideas, methods, instructions or products referred to in the content.