
Assessing Pollution with Heavy Metals and Its Impact on Population Health


Abstract
1. Introduction
2. Data Series and Methodology
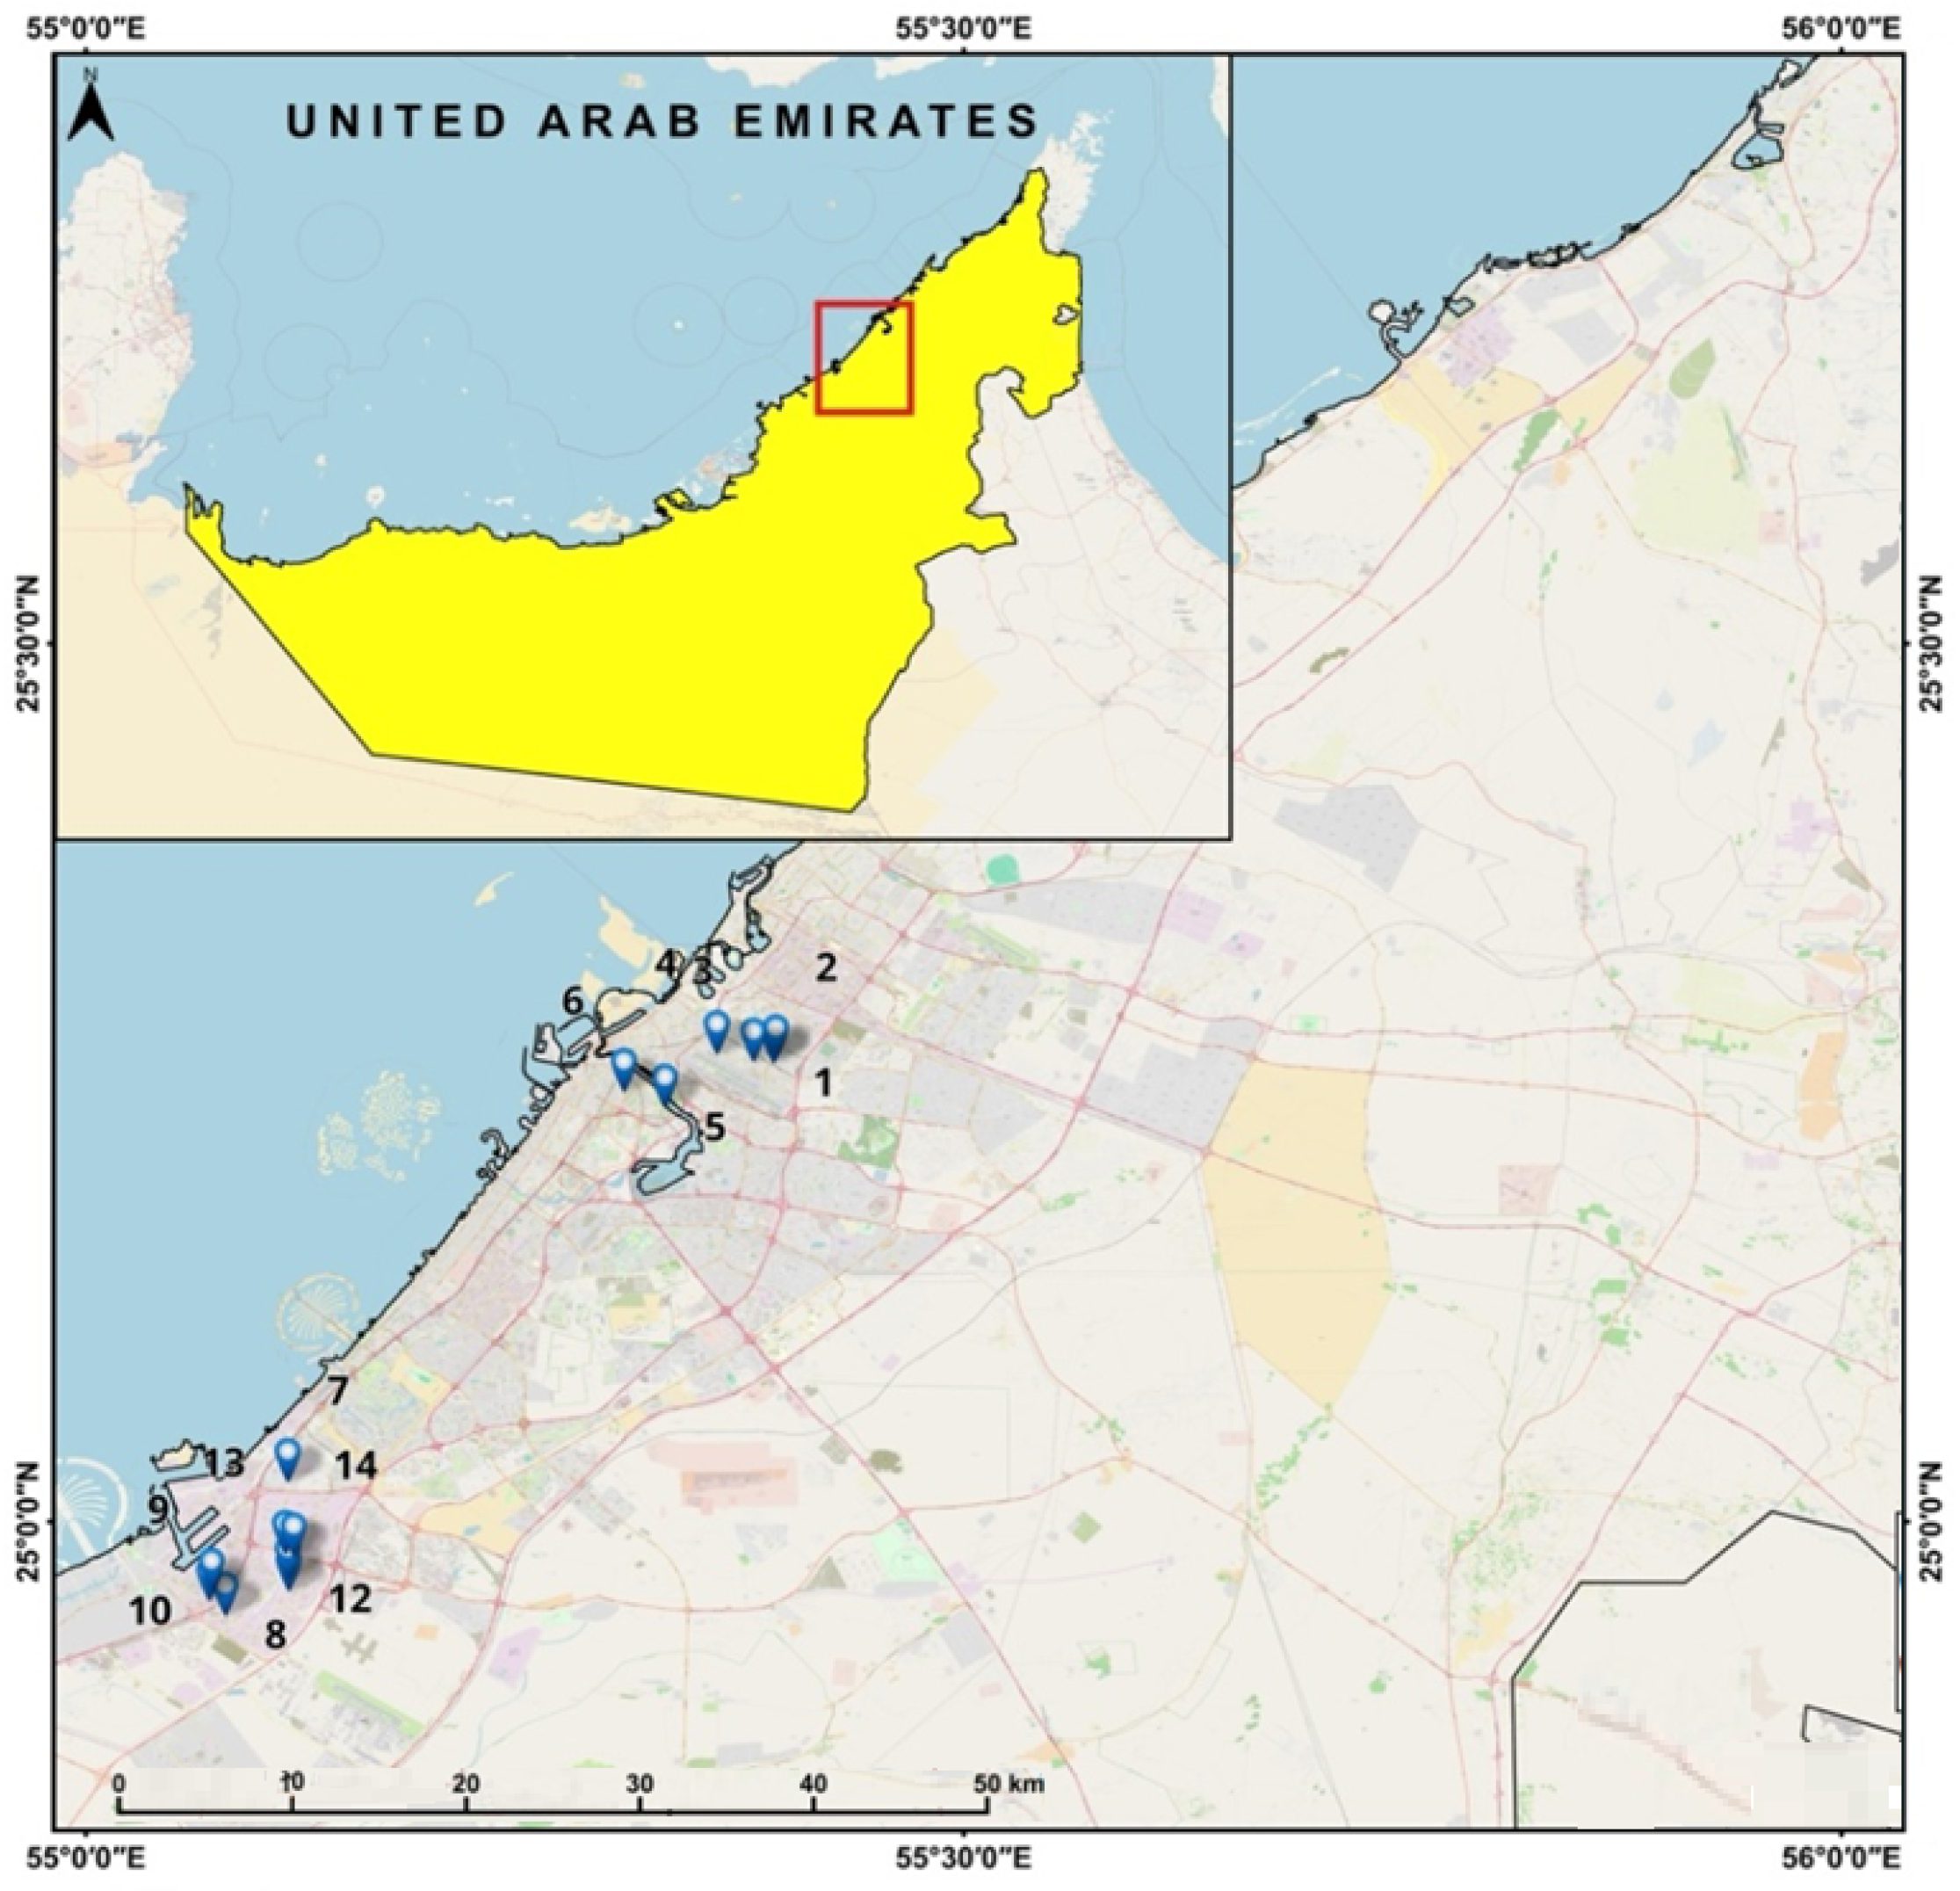
2.1. Study Region and Data Series
2.2. Methodology
2.2.1. Principal Component Analysis
2.2.2. Factor Analysis
2.2.3. t-Distributed Stochastic Neighbor Embedding (t-SNE)
2.3. Health Risk Assessment
3. Results and Discussion
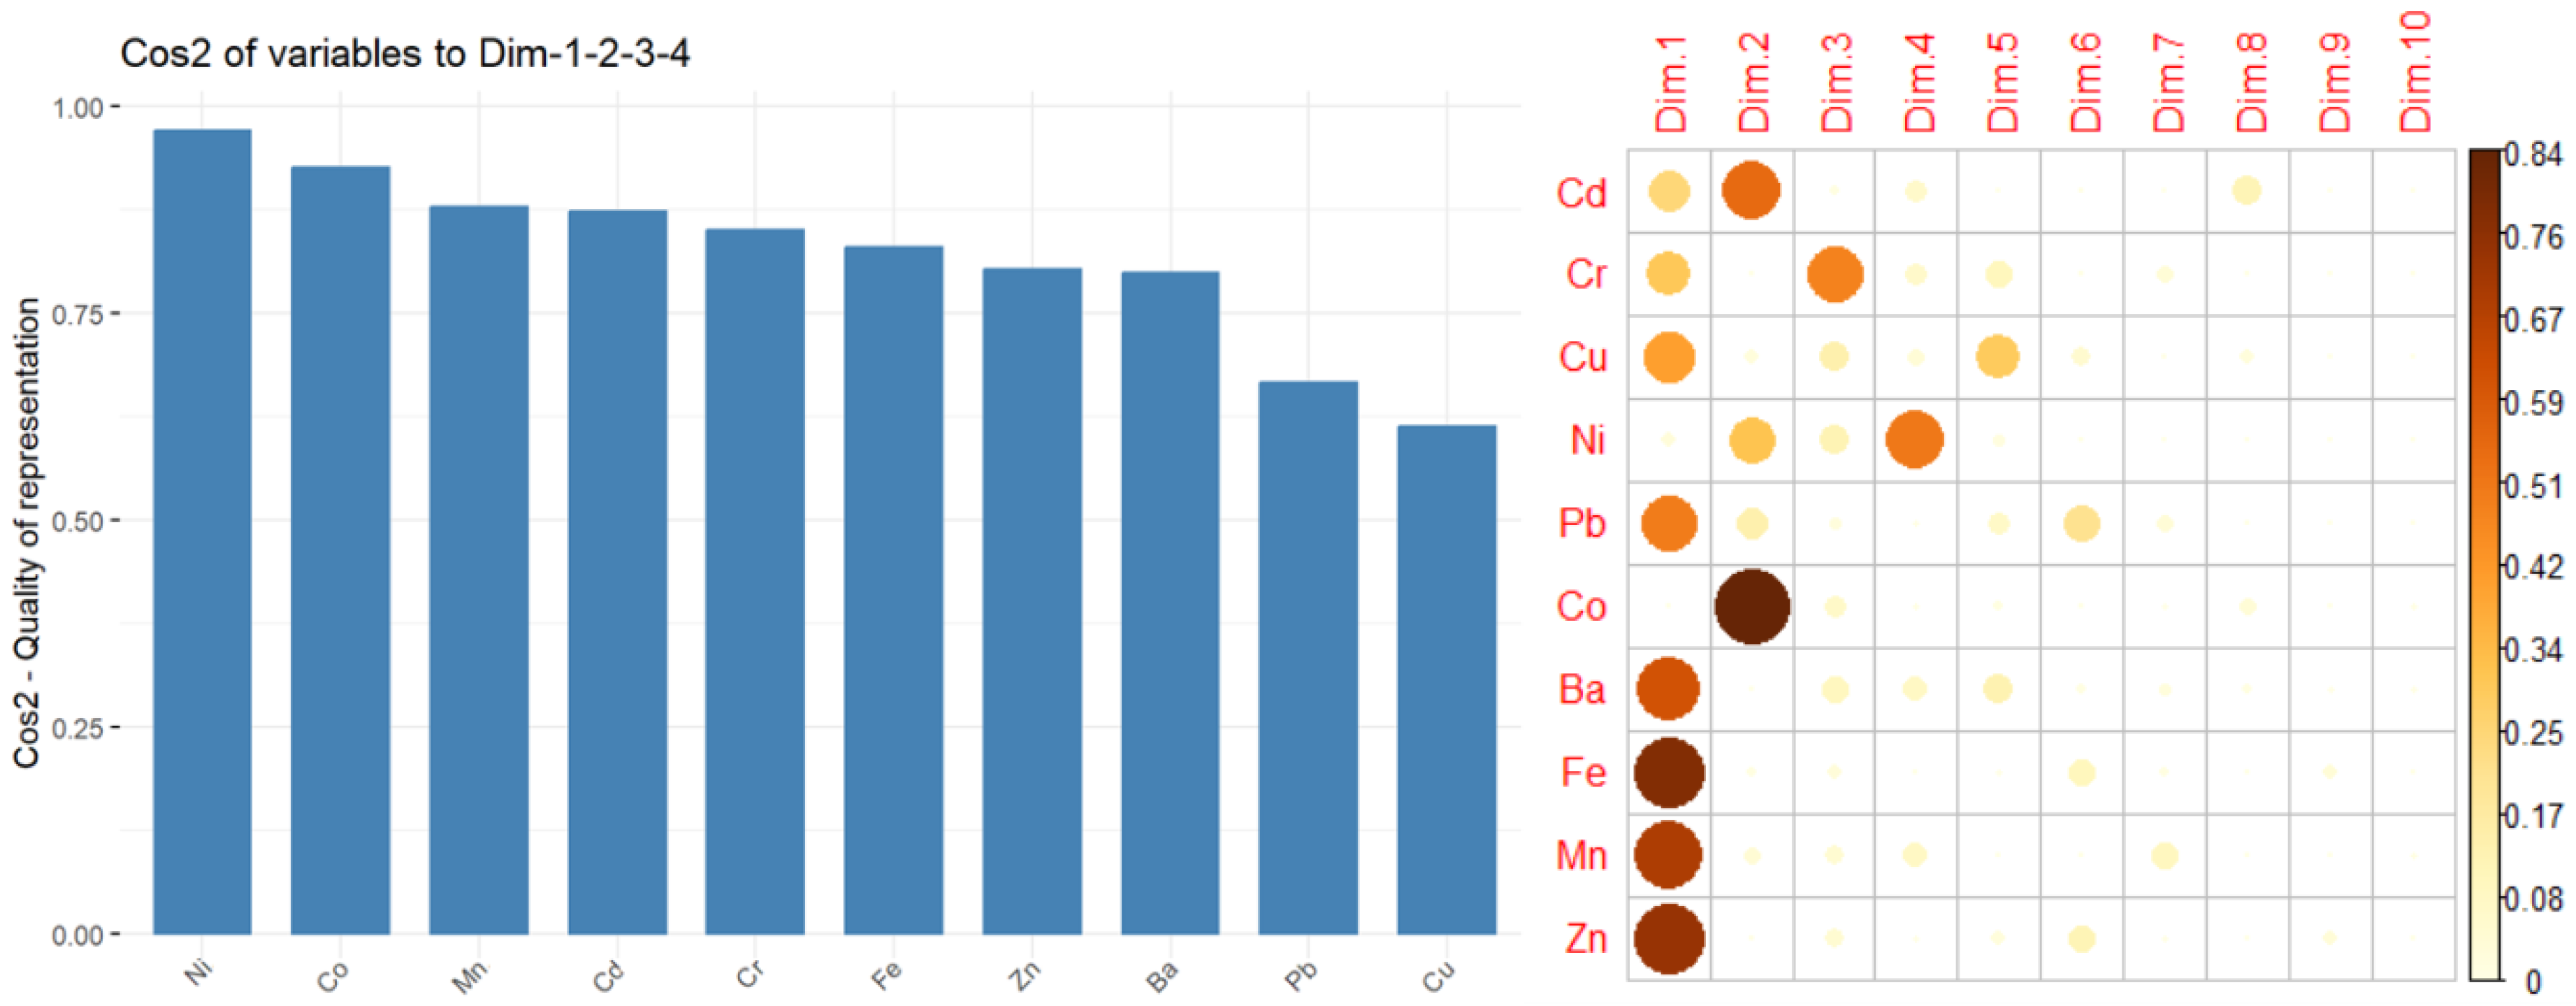
3.1. PCA Results
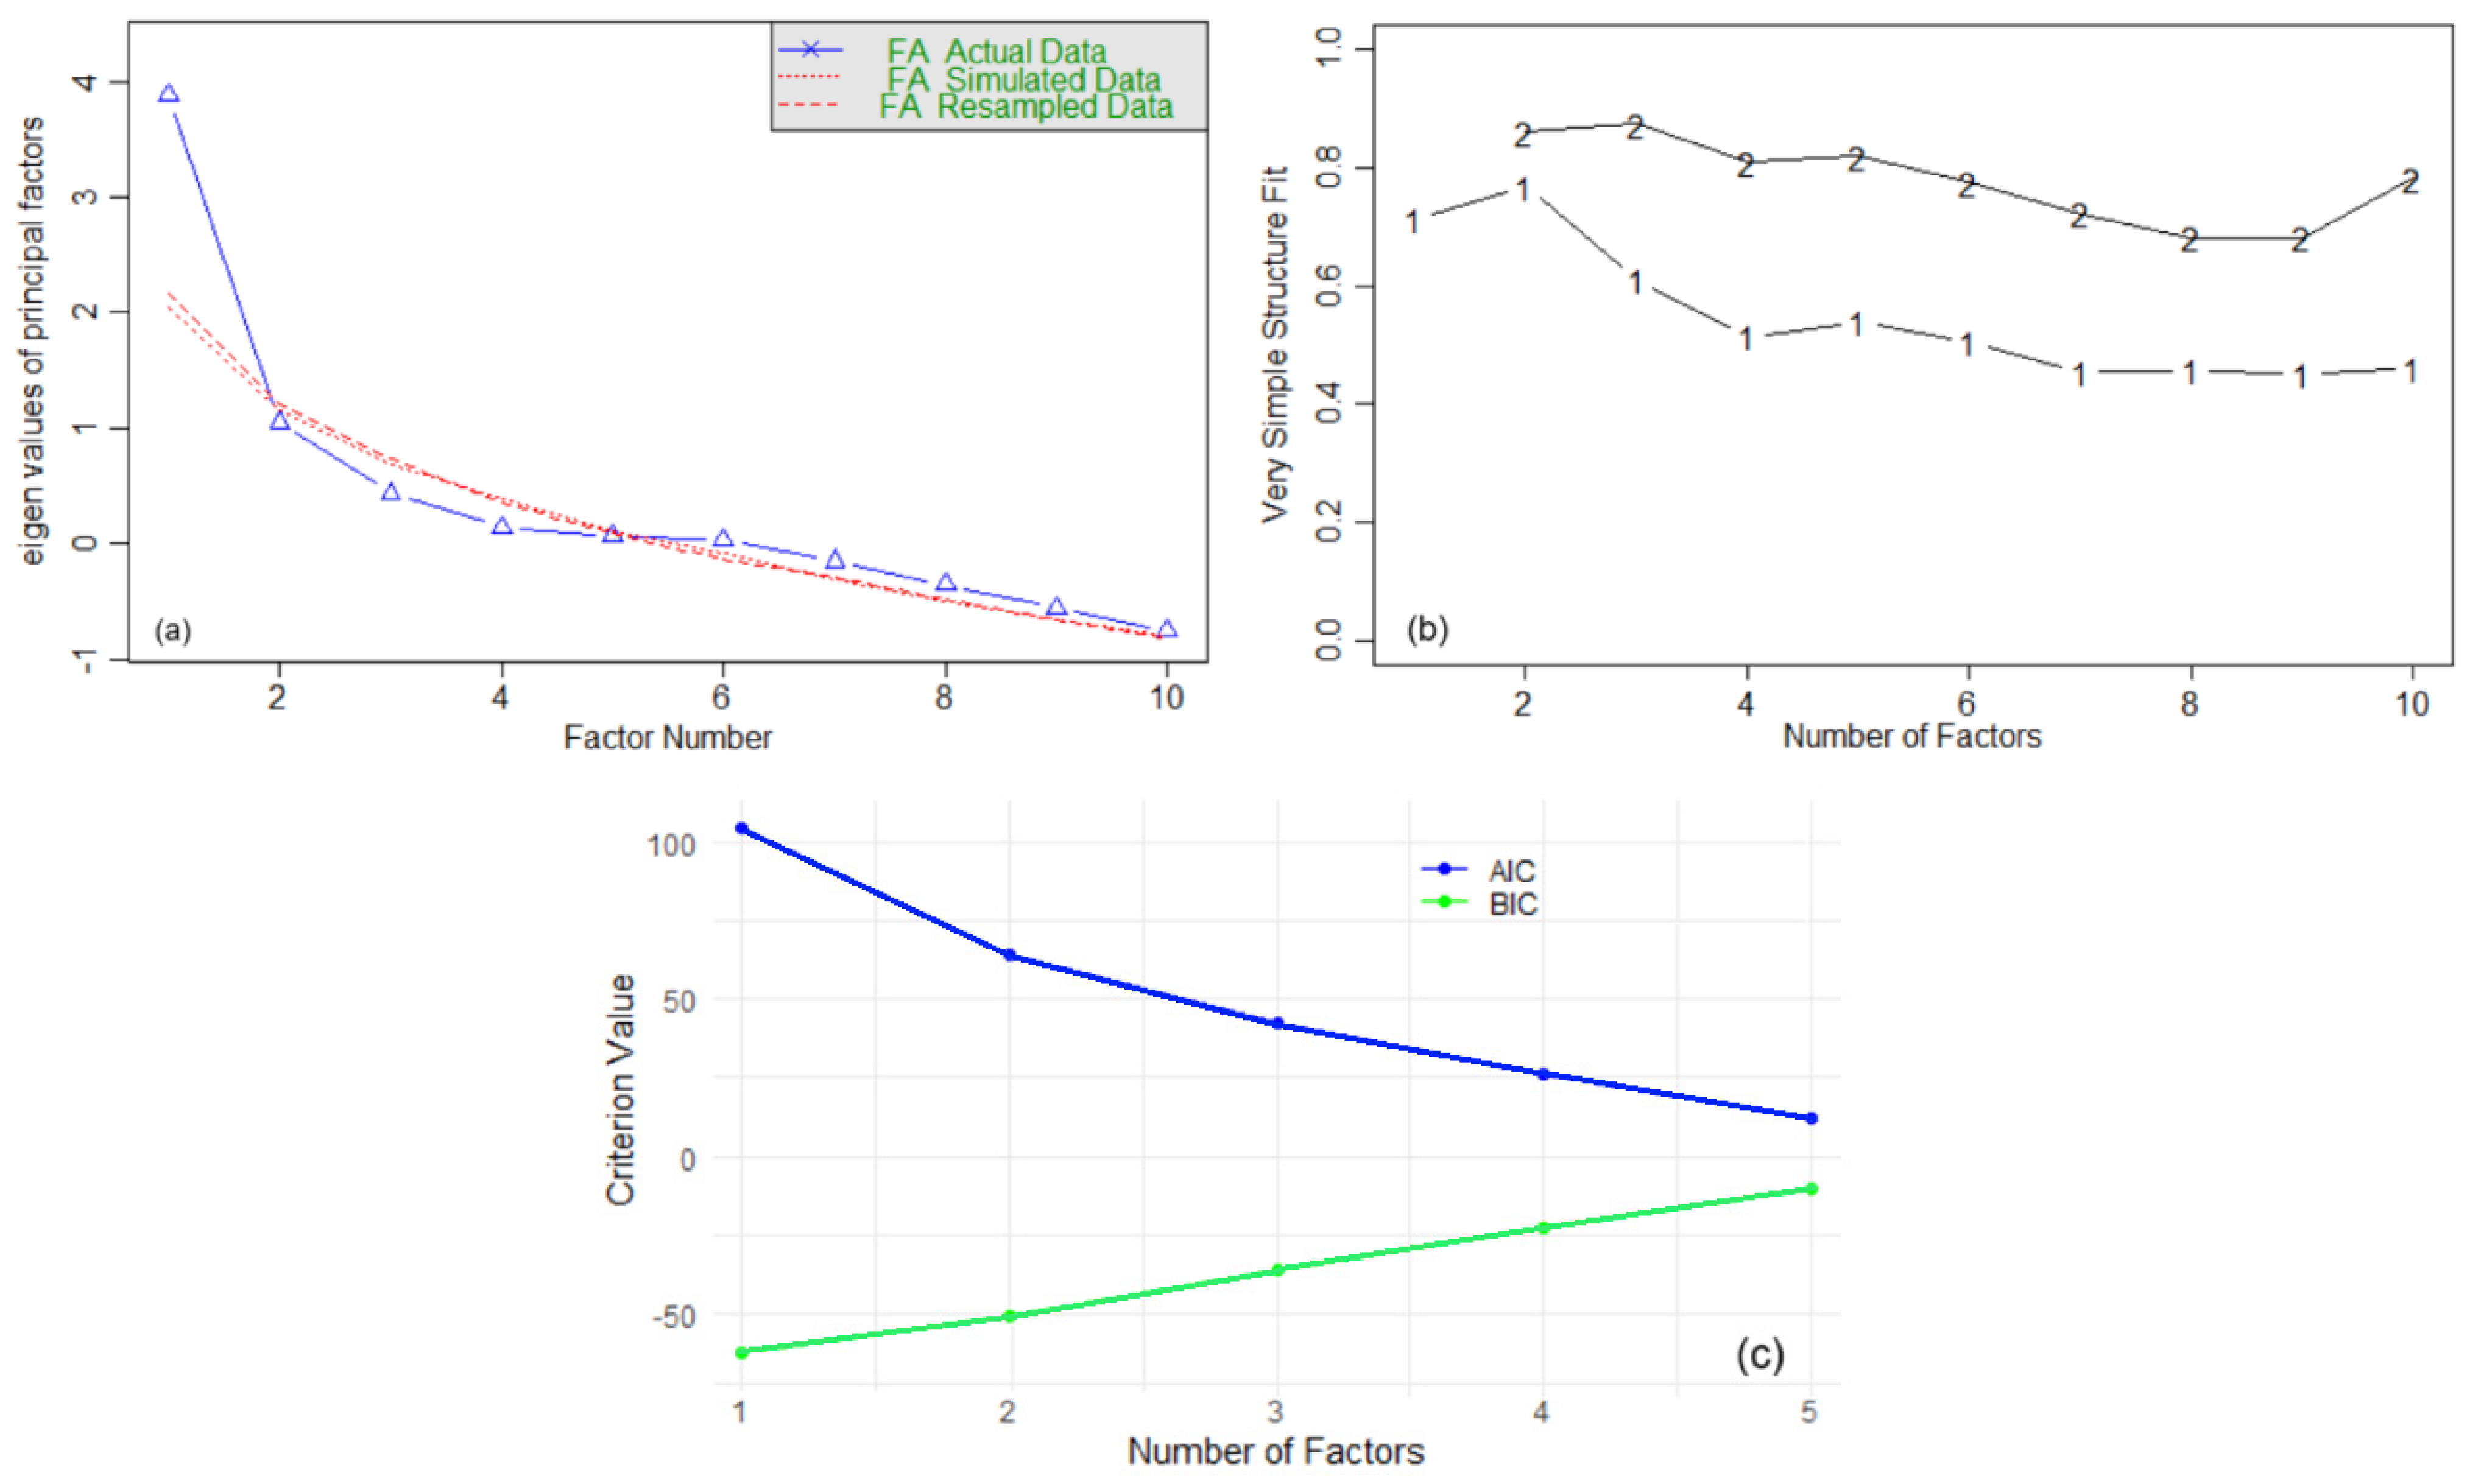
3.2. FA Results
- Factor loadings and variance:
- Sum of squared (SS) loadings: ML2—2.22, ML3—1.77, ML1—1.74;
- Proportion variance: ML2—0.29, ML3—0.18, ML1—0.17;
- Cumulative variance: 64%;
- Loadings: Indicate the strength of association between variables and factors, e.g., Zn (ML2: 0.97), Cr (ML3: 0.83), Co (ML1: 0.99);
- h2 and u2: High communalities indicate variables well-explained by the factors. For example, Zn has h2 = 0.91 and u2 = 0.091, indicating that the factors explain 91% of its variance. The same is true for Mn.
- Factor correlations: ML2-ML3: 0.54, ML2-ML1: 0.03, ML3-ML2: 0.54, ML3-ML1: −0.02.
- Model fit indices:
- Chi-square statistic: 11.23 (p < 0.88);
- Root Mean Square of Residuals (RMSR): 0.07;
- Tucker–Lewis Index (TLI): 4.006;
- BIC: −35.27.
- Factor score adequacy indicates a high reliability of factor scores:
- Correlation of regression scores with factors: ML2 (0.97), ML3 (0.95), ML1 (1.00);
- Multiple R-square of scores with factors: ML3 (0.95), ML1 (0.90), ML2 (0.99);
- Minimum correlation of possible factor scores: ML3 (0.90), ML1 (0.80), ML2 (0.99).
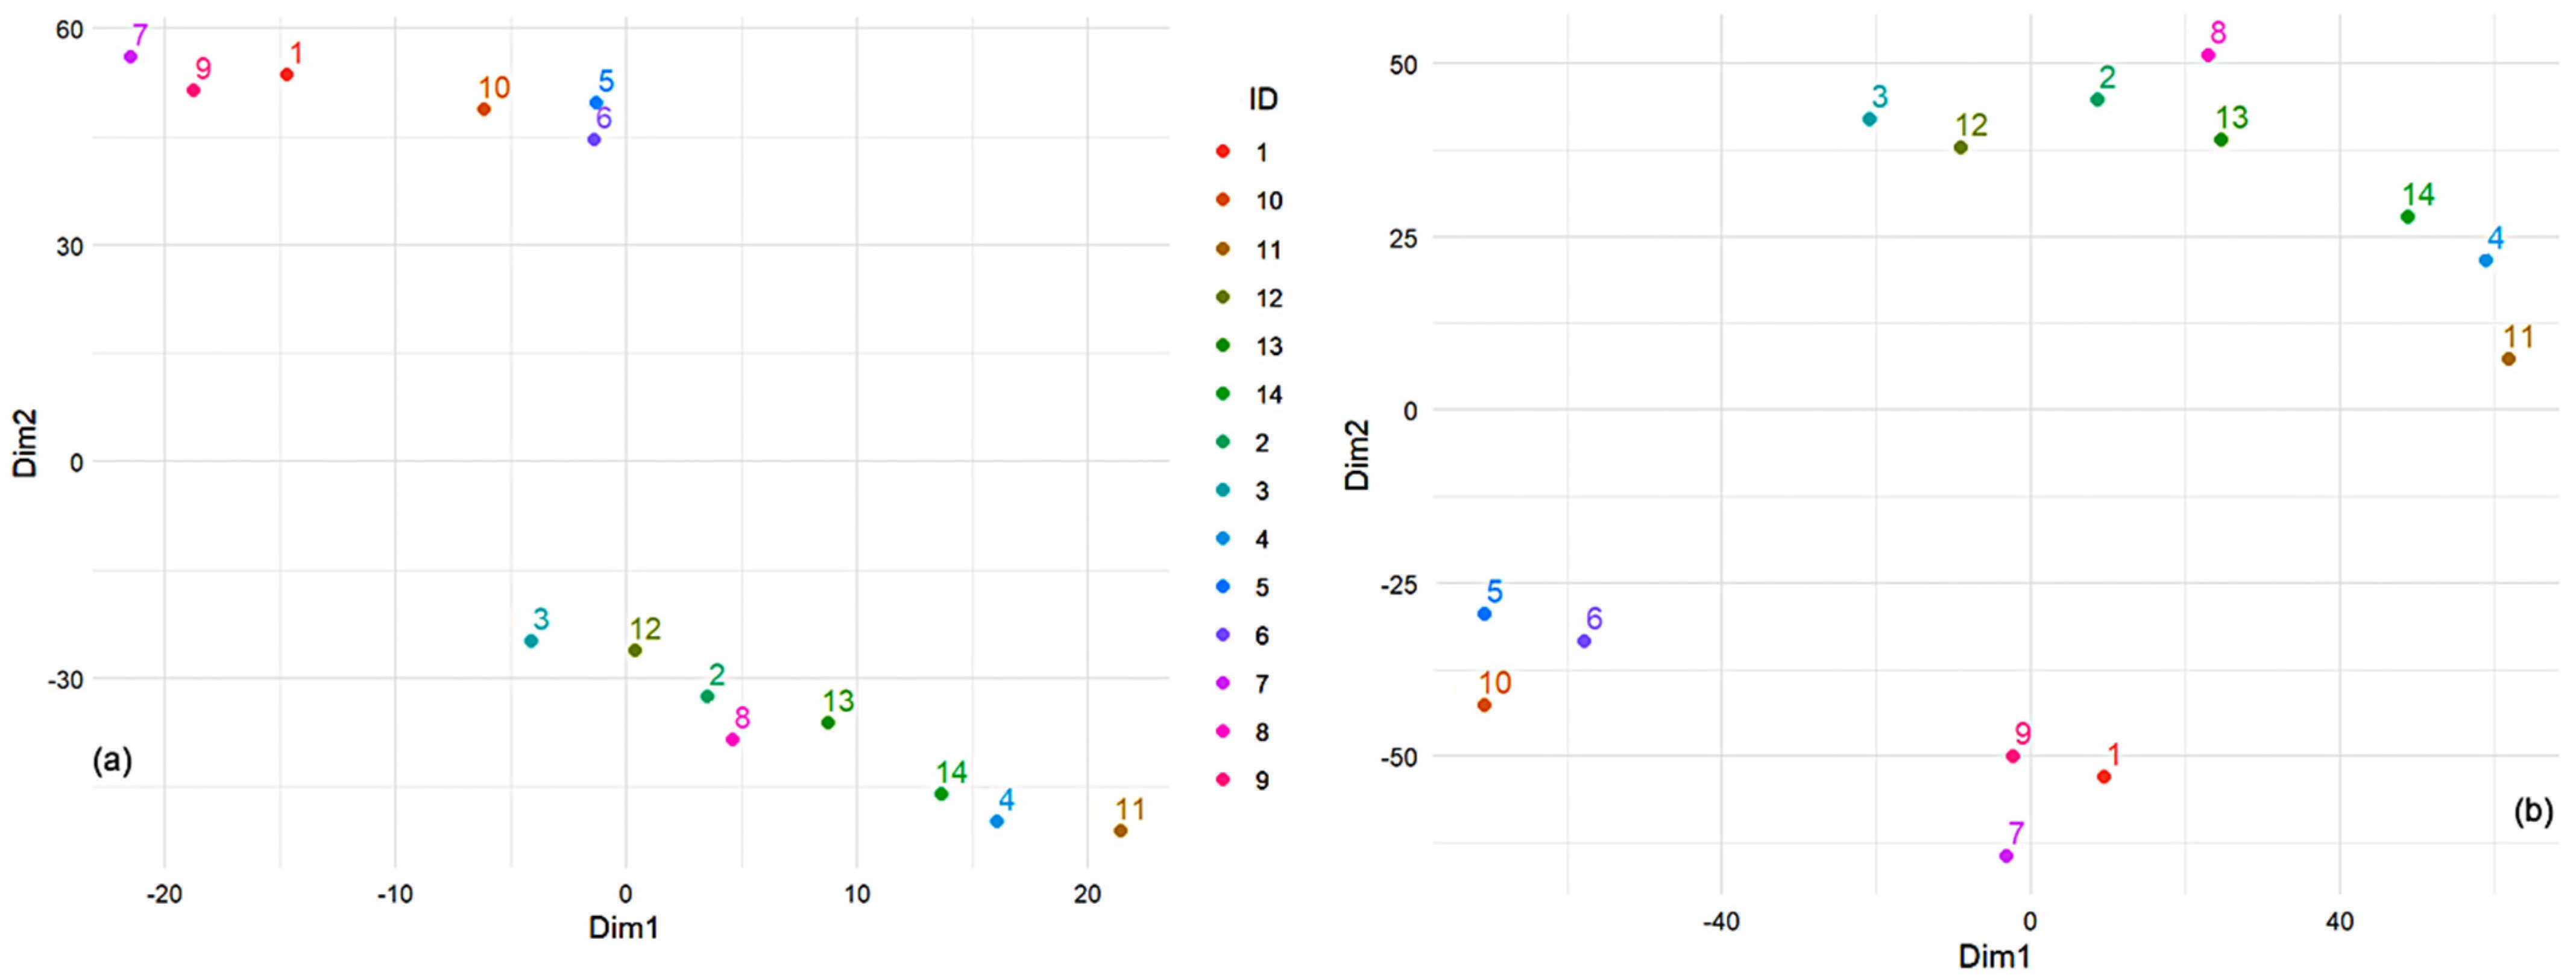
3.3. T-SNE Results
3.4. Results of Health Risk Assessment
4. Conclusions
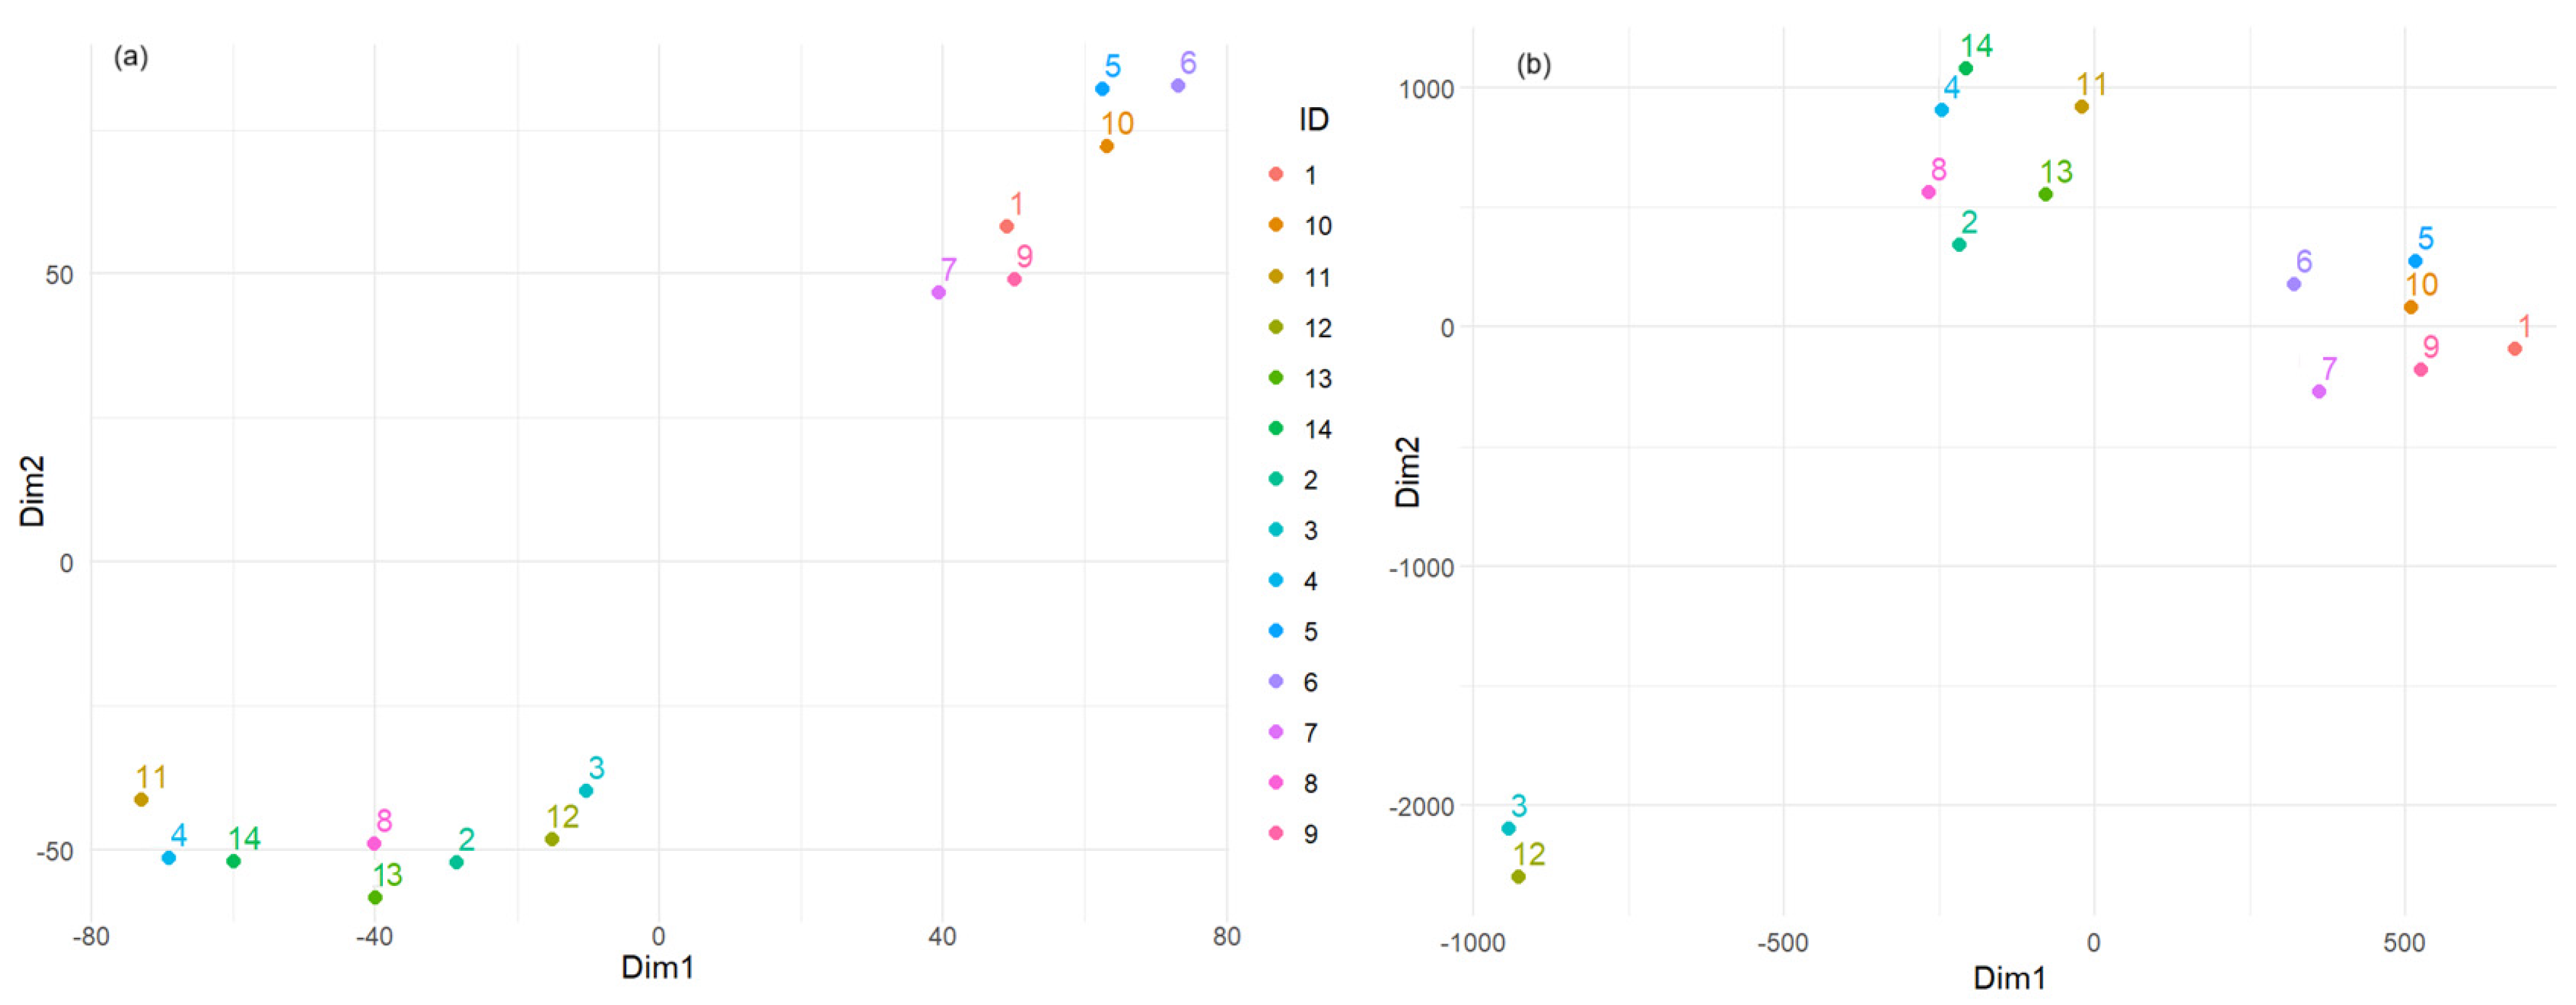
- Extreme ADDs—the minimum for Cr and Cd, and maximum for Ba, Co, and Pb were computed for sites 1, 7, and 9 (belonging to the same cluster in Figure 7b);
- The ADDs for Fe and Pb reached their minimum at sites 3 and 12 (clustered together in Figure 9b);
- The maximum ADD for Fe and Pb were found at sites 5 and 6 (clustered together in Figure 7b);
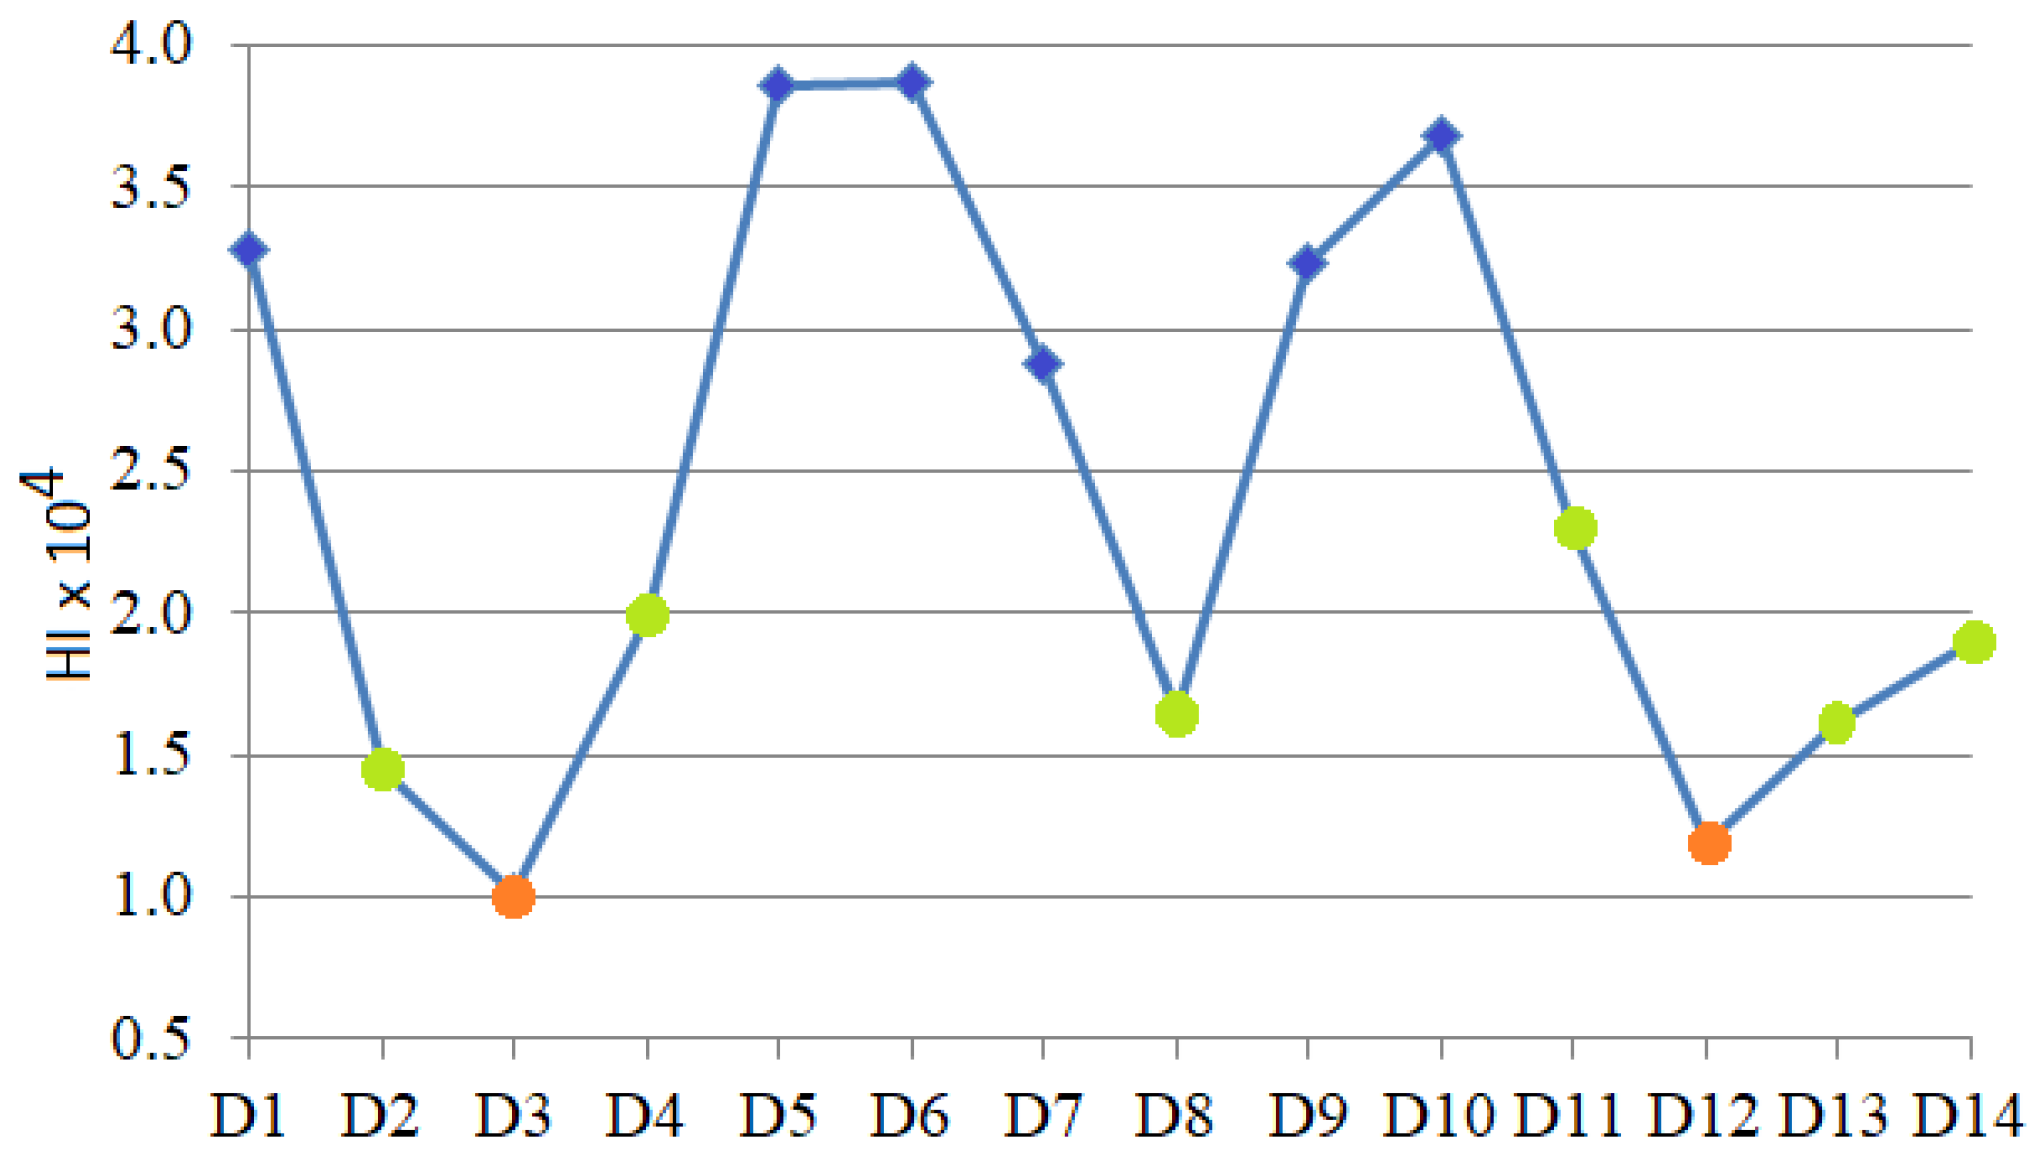
- The HI values indicate a concordance between the clusters provided after t-SNE optimization and the magnitude of the non-carcinogenic risk to the population.
Author Contributions
Funding
Institutional Review Board Statement
Informed Consent Statement
Data Availability Statement
Conflicts of Interest
References
- Kanwar, V.S.; Sharma, A.; Srivastav, A.L.; Rani, L. Phytoremediation of Toxic Metals Present in Soil and Water Environment: A Critical Review. Environ. Sci. Pollut. Res. 2020, 27, 44835–44860. [Google Scholar] [CrossRef]
- Adewumi, A.J.; Ogundele, O.D. Hidden hazards in urban soils: A meta-analysis review of global heavy metal contamination (2010–2022), sources and its Ecological and health consequences. Sustain. Environ. 2024, 10, 2293239. [Google Scholar] [CrossRef]
- Chiritescu, R.-V.; Luca, E.; Iorga, G. Observational study of major air pollutants over urban Romania in 2020 in comparison with 2019. Rom. Rep. Phys. 2024, 76, 702. [Google Scholar]
- Dumitru, A.; Olaru, E.-A.; Dumitru, M.; Iorga, G. Assessment of air pollution by aerosols over a coal open-mine influenced region in southwestern Romania. Rom. J. Phys. 2024, 69, 801. [Google Scholar] [CrossRef]
- Rosianu, A.-M.; Leru, P.M.; Stefan, S.; Iorga, G.; Marmureanu, L. Six-year monitoring of atmospheric pollen and major air pollutant concentrations in relation with meteorological factors in Bucharest, Romania. Rom. Rep. Phys. 2022, 74, 703. [Google Scholar]
- Soltani-Gerdefaramarzi, S.; Ghasemi, M.; Ghanbarian, B.; Da Silva Júnior, F.M.R. Geogenic and anthropo-genic sources identification and ecological risk assessment of heavy metals in the urban soil of Yazd, central Iran. PLoS ONE 2021, 16, e0260418. [Google Scholar] [CrossRef]
- Cui, Y.; Bai, L.; Li, C.; He, Z.; Liu, Z. Assessment of heavy metal contamination levels and health risks in environmental media in the northeast region. Sustain. Cities Soc. 2022, 80, 103796. [Google Scholar] [CrossRef]
- Faiz, Y.; Tufail, M.; Javed, M.T.; Chaudhry, M.M.; Siddique, N. Road dust pollution of Cd, Cu, Ni, Pb and Zn along Islamabad Expressway, Pakistan. Microchem. J. 2009, 92, 186–192. [Google Scholar] [CrossRef]
- Jaishankar, M.; Tseten, T.; Anbalagan, N.; Mathew, B.B.; Beeregowda, K.N. Toxicity, mechanism and health effects of some heavy metals. Interdiscip. Toxicol. 2014, 7, 60–72. [Google Scholar] [CrossRef]
- Morakinyo, O.M.; Mukhola, M.S.; Mokgobu, M.I. Health Risk Analysis of Elemental Components of an Industrially Emitted Respirable Particulate Matter in an Urban Area. Int. J. Environ. Res. Public Health 2021, 18, 3653. [Google Scholar] [CrossRef] [PubMed]
- Sanborn, M.D.; Abelsohn, A.; Campbell, M.; Weir, E. Identifying and managing adverse environmental health effects: 3. Lead exposure. Can. Med. Assoc. J. 2002, 166, 1287–1292. [Google Scholar]
- Turner, A.; Hefzi, B. Levels and bioaccessibilities of metals in dusts from an arid environment. Water Air Soil Poll. 2010, 210, 483–491. [Google Scholar] [CrossRef]
- Nieder, R.; Benbi, D.K.; Reichl, F.X. Soil Components and Human Health; Springer: Dordrech, The Netherlands, 2018. [Google Scholar]
- Aguilera, A.; Cortés, J.L.; Delgado, C.; Aguilar, Y.; Aguilar, D.; Cejudo, R.; Quintana, P.; Goguitchaichvili, A.; Bautista, F. Heavy Metal Contamination (Cu, Pb, Zn, Fe, and Mn) in Urban Dust and its Possible Ecological and Human Health Risk in Mexican Cities. Front. Environ. Sci. 2022, 10, 854460. [Google Scholar] [CrossRef]
- Rouhani, A.; Iqbal, J.; Roman, M.; Hejcman, M. A review of urban dust pollution in Iranian cities with examples from other parts of the world. Int. J. Environ. Sci. Technol. 2024. Available online: https://link.springer.com/content/pdf/10.1007/s13762-024-05973-2.pdf (accessed on 18 November 2024).
- Nazzal, Y.; Orm, N.B.; Barbulescu, A.; Howari, F.; Sharma, M.; Badawi, A.E.; Al-Taani, A.A.; Iqbal, J.; Ktaibi, F.E.; Xavier, C.M.; et al. Study of Atmospheric Pollution and Health Risk Assessment: A Case Study for the Sharjah and Ajman Emirates (UAE). Atmosphere 2021, 12, 1442. [Google Scholar] [CrossRef]
- Huang, B.; Zhou, Y.; Chang, W.; Li, Z.; Zeng, H. Differential characteristics of heavy metal pollution in road dust and its ecological risk in different function areas of Shenzhen city. Ecol. Environ. Sci. 2019, 28, 2398–2408. [Google Scholar]
- Lu, X.; Wang, L.; Lei, K.; Huang, J.; Zhai, Y. Contamination assessment of copper, lead, zinc, manganese and nickel in street dust of Baoji NW China. J. Hazard. Mater. 2009, 161, 1058–1062. [Google Scholar] [CrossRef]
- Atiemo, S.M.; Ofosu, F.G.; Aboh, I.J.K.; Oppon, O.C. Levels and sources of heavy metal contamination in road dust in selected major highways of Accra Ghana. X-Ray Spectrom. 2012, 41, 105–110. [Google Scholar] [CrossRef]
- Bărbulescu, A.; Șerban, C.; Caramihai, S. Assessing the soil pollution using a genetic algorithm. Rom. J. Phys. 2021, 66, 806. [Google Scholar]
- Al-Taani, A.A.; Nazzal, Y.; Howari, F.M. Assessment of heavy metals in roadside dust along the Abu Dhabi–Al Ain National Highway, UAE. Environ. Earth Sci. 2019, 78, 411. [Google Scholar] [CrossRef]
- Priya, A.K.; Muruganandam, M.; Ali, S.S.; Kornaros, M. Clean-Up of Heavy Metals from Contaminated Soil by Phytoremediation: A Multidisciplinary and Eco-Friendly Approach. Toxics 2023, 11, 422. [Google Scholar] [CrossRef] [PubMed]
- Bărbulescu, A.; Dumitriu, C.S.; Popescu-Bodorin, N. Assessing atmospheric pollution and its impact on the human health. Atmosphere 2022, 13, 938. [Google Scholar] [CrossRef]
- Aili, A.; Xu, H.; Kasim, T.; Abulikemu, A. Origin and Transport Pathway of Dust Storm and Its Contribution to Particulate Air Pollution in Northeast Edge of Taklimakan Desert, China. Atmosphere 2021, 12, 113. [Google Scholar] [CrossRef]
- Liu, Q.; Huang, Z.; Hu, Z.; Dong, Q.; Li, S. Long-Range Transport and Evolution of Saharan Dust Over East Asia From 2007 to 2020. JGR Atmos. 2022, 127, e2022JD036974. [Google Scholar] [CrossRef]
- Middleton, N.; Kang, U. Sand and Dust Storms: Impact Mitigation. Sustainability 2017, 9, 1053. [Google Scholar] [CrossRef]
- Nazzal, Y.; Bărbulescu, A.; Howari, F.M.; Yousef, A.; Al-Taani, A.A.; Al Aydaroos, F.; Naseem, M. New insight to dust storm from historical records, UAE. Arab. J. Geosci. 2019, 12, 396. [Google Scholar] [CrossRef]
- Al Senafi, F.; Anis, A. Shamals and climate variability in the northern Arabian/Persian Gulf from 1973 to 2012. Int. J. Climatol. 2015, 35, 4509–4528. [Google Scholar] [CrossRef]
- Bărbulescu, A.; Dumitriu, C.S.; Popescu-Bodorin, N. On the aerosol optical depth series in the Arabian Gulf region. Rom. J. Phys. 2022, 67, 814. [Google Scholar]
- Bărbulescu, A.; Popescu—Bodorin, N. History-based long-term predictability of regional monthly fuzzy data. Stoch. Environ. Res. Risk Assess. 2019, 33, 1435–1441. [Google Scholar] [CrossRef]
- Bhagat, S.K.; Tung, T.M.; Yaseen, Z.M. Heavy metal contamination prediction using ensemble model: Case study of Bay sedimentation, Australia. J. Hazard. Mater. 2021, 403, 123492. [Google Scholar] [CrossRef] [PubMed]
- Ozigis, M.S.; Kaduk, J.D.; Jarvis, C.H. Mapping terrestrial oil spill impact using machine learning random forest and Landsat 8 OLI imagery: A case site within the Niger delta region of Nigeria. Environ. Sci. Pollut. Res. 2019, 26, 3621–3635. [Google Scholar] [CrossRef]
- Breiman, L. Random forests. Mach. Learn. 2001, 45, 5–32. [Google Scholar] [CrossRef]
- Günal, E.; Budak, M.; Kılıç, M.; Cemek, B.; Sırrı, M. Combining spatial autocorrelation with artificial intelligence models to estimate spatial distribution and risks of heavy metal pollution in agricultural soils. Environ. Monit. Assess. 2023, 195, 317. [Google Scholar] [CrossRef] [PubMed]
- Qiu, L.; Wang, K.; Long, W.; Wang, K.; Hu, W.; Amable, G.S. A Comparative Assessment of the Influences of Human Impacts on Soil Cd Concentrations Based on Stepwise Linear Regression, Classification and Regression Tree, and Random Forest Models. PLoS ONE 2016, 11, e0151131. [Google Scholar] [CrossRef]
- MacQueen, J.B. Some Methods for Classification and Analysis of Multivariate Observations. In Proceedings of the 5th Berkeley Symposium on Mathematical Statistics and Probability, Oakland, CA, USA, 21 June–18 July 1965; University of California Press: Oakland, CA, USA, 1967; pp. 281–297. [Google Scholar]
- Ester, M.; Kriegel, H.-P.; Sander, J.; Xu, X. A Density-Based Algorithm for Discovering Clusters in Large Spatial Databases with Noise. Available online: https://cdn.aaai.org/KDD/1996/KDD96-037.pdf (accessed on 21 December 2024).
- Hastie, T.; Tibshirani, R.; Friedman, J. The Elements of Statistical Learning: Data mining, Inference, and Prediction; Springer: New York, NY, USA, 2009; pp. 485–586. [Google Scholar]
- Daghigh, H.; Tannant, D.D.; Daghigh, V.; Lichti, D.D.; Lindenbergh, R. A critical review of discontinuity plane extraction from 3D point cloud data of rock mass surfaces. Comput. Geosci. 2022, 169, 105241. [Google Scholar] [CrossRef]
- Pisner, D.A.; Schnyer, D.M. Chapter 6—Support vector machine. In Machine Learning; Mechelli, A., Vieira, S., Eds.; Academic Press: London, UK, 2020; pp. 101–121. [Google Scholar]
- Domingos, P.; Pazzani, M. Beyond independence: Conditions for the optimality of simple bayesian classifier. Mach. Learn. 1997, 29, 103–130. [Google Scholar] [CrossRef]
- Ankerst, M.; Breunig, M.M.; Kriegel, H.-P.; Sander, J. OPTICS: Ordering points to identify the clustering structure. ACM Sigmod Rec. 1999, 28, 49–60. [Google Scholar] [CrossRef]
- Anifowose, B.; Anifowose, F. Artificial intelligence and machine learning in environmental impact prediction for soil pollution management—Case for EIA process. Environ. Adv. 2024, 17, 100554. [Google Scholar] [CrossRef]
- Kahangwa, C.A. Application of Principal Component Analysis, Cluster Analysis, Pollution Index and Geoaccumulation Index in Pollution Assessment with Heavy Metals from Gold Mining Operations, Tanzania. J. Geosci. Environ. Prot. 2022, 10, 303–317. [Google Scholar] [CrossRef]
- Rao, B.R.M.; Fyzee, M.A.; Sujatha, G.; Wadodkar, M. Soil Resource Appraisal of Emirate of Dubai for Optimum Landuse Planning. Available online: https://www.isprs.org/proceedings/xxxvi/part4/brm_rao.pdf (accessed on 15 September 2024).
- Revelle, V. Package ‘psych’. Procedures for Psychological, Psychometric, and Personality Research. Available online: https://cran.r-project.org/web/packages/psych/psych.pdf (accessed on 10 September 2024).
- Husson, F.; Josse, J.; Le, S.; Mazet, J. Package ‘FactoMineR’. Multivariate Exploratory Data Analysis and Data Mining. Available online: https://cran.r-project.org/web/packages/FactoMineR/FactoMineR.pdf (accessed on 13 October 2024).
- Kassambara, A.; Mundt, F. Package ‘factoextra’. Extract and Visualize the Results of Multivariate Data Analyses. Available online: https://cran.r-project.org/web/packages/factoextra/factoextra.pdf (accessed on 13 October 2024).
- Ripley, B.; Venables, B.; Bates, D.M.; Hornik, K.; Gebhardt, A.; Firth, D. Package ‘MASS’. Support Functions and Datasets for Venables and Ripley’s MASS. Available online: https://cran.r-project.org/web/packages/MASS/MASS.pdf (accessed on 13 October 2024).
- Charrad, M.; Ghazzali, N.; Boiteau, V.; Niknafs, A. Package ‘NbClust’. Determining the Best Number of Clusters in a Data Set. Available online: https://cran.r-project.org/web/packages/NbClust/NbClust.pdf (accessed on 10 October 2024).
- Jolliffe, I.T. Principal Component Analysis, 2nd ed.; Springer: New York, NY, USA, 2002. [Google Scholar]
- Abdi, H.; Williams, L.J. Principal Component Analysis. Wiley Interdiscip. Rev. Comput. Stat. 2010, 2, 433–459. [Google Scholar] [CrossRef]
- Kaiser, H.F. The application of electronic computers to factor analysis. Educ. Psychol. Meas. 1960, 20, 141–151. [Google Scholar] [CrossRef]
- Catell, R.B. The scree test for the number of factors. Multivar. Behav. Res. 1955, 1, 245–276. [Google Scholar] [CrossRef]
- Peres-Neto, P.R.; Jackson, D.A.; Somers, K.M. How many principal components? Stopping rules for determining the number of non-trivial axes revisited. Comput. Stat. Data Anal. 2005, 49, 974–997. [Google Scholar] [CrossRef]
- Cavanaugh, J.E.; Neath, A.A. The Akaike information criterion: Background, derivation, properties, application, interpretation, and refinements. Wires Comput. Stat. 2019, 11, e1460. [Google Scholar] [CrossRef]
- Schwarz, G.E. Estimating the dimension of a model. Ann. Stat. 1978, 6, 461–464. [Google Scholar] [CrossRef]
- Revelle, W.; Rocklin, T. Very Simple Structure: An Alternative Procedure For Estimating The Optimal Number Of Interpretable Factors. Multivar. Behav. Res. 1979, 14, 403–414. [Google Scholar] [CrossRef] [PubMed]
- Chapter 6. Constructs, Components, and Factor Models. Available online: https://www.personality-project.org/r/book/Chapter6.pdf (accessed on 1 September 2024).
- Balamurali, M.; Melkumyan, A. t-SNE Based Visualisation and Clustering of Geological Domain. In Neural Information Processing. ICONIP 2016. Lecture Notes in Computer Science; Hirose, A., Ozawa, S., Doya, K., Ikeda, K., Lee, M., Liu, D., Eds.; Springer: Cham, Switzerland, 2016; Volume 9950, pp. 565–572. [Google Scholar]
- Birjandtalab, J.; Pouyan, M.B.; Nourani, M. Nonlinear dimension reduction for EEG-based epileptic seizure detection. In Proceedings of the 2016 IEEE-EMBS International Conference on Biomedical and Health Informatics, Las Vegas, NV, USA, 24–27 February 2016; pp. 595–598. [Google Scholar]
- Wallach, I.; Liliean, R. The Protein-Small-Molecule Database, A Non-Redundant Structural Resource for the Analysis of Protein-Ligand Binding. Bioinformatics 2009, 25, 615–620. [Google Scholar] [CrossRef] [PubMed]
- Kobak, D.; Berens, P. The art of using t-SNE for single-cell transcriptomics. Nat. Commun. 2019, 10, 5416. [Google Scholar] [CrossRef] [PubMed]
- Jamieson, A.R.; Giger, M.L.; Drukker, K.; Lui, H.; Yuan, Y.; Bhooshan, N. Exploring Nonlinear Feature Space Dimension Reduction and Data Representation in Breast CADx with Laplacian Eigenmaps and t-SNE. Med. Phys. 2010, 37, 339–351. [Google Scholar] [CrossRef] [PubMed]
- Gashi, I.; Stankovic, V.; Leita, C.; Thonnard, O. An Experimental Study of Diversity with Off-the-shelf AntiVirus Engines. In Proceedings of the 2009 Eighth IEEE International Symposium on Network Computing and Applications, Cambridge, MA, USA, 9–11 July 2009; pp. 4–11. [Google Scholar]
- Liu, H.; Yang, J.; Ye, M.; James, S.C.; Tang, Z.; Dong, J.; Xing, T. Using t-distributed Stochastic Neighbor Embedding (t-SNE) for cluster analysis and spatial zone delineation of groundwater geochemistry data. J. Hydrol. 2021, 597, 126146. [Google Scholar] [CrossRef]
- Xiao, C.; Hong, S.; Huang, W. Optimizing graph layout by t-SNE perplexity estimation. Int. J. Data Sci. Anal. 2023, 15, 159–171. [Google Scholar] [CrossRef]
- van der Maaten, L.J.P.; Hinton, G.E. Visualizing Data Using t-SNE. J. Mach. Learn. Res. 2008, 9, 2579–2605. [Google Scholar]
- Wattenberg, M.; Viégas, F.; Johnson, I. How to Use t-SNE Effectively. Distill, 2016. Available online: https://distill.pub/2016/misread-tsne/ (accessed on 10 September 2024).
- MacKay, D.J.C. Information Theory, Inference, and Learning Algorithms; Cambridge University Press: Cambridge, UK, 2003. [Google Scholar]
- Qian, N. On the momentum term in gradient descent learning algorithms. Neural Netw. 1999, 12, 145–151. [Google Scholar] [CrossRef] [PubMed]
- Du, Y.; Gao, B.; Zhou, H.; Ju, X.; Hao, H.; Yin, S. Health risk assessment of heavy metals in road dusts in urban parks of Beijing, China. Procedia Environ. Sci. 2013, 18, 299–309. [Google Scholar] [CrossRef]
- U.S. EPA. Exposure Factors Handbook (1997, Final Report); U.S. Environmental Protection Agency: Washington, DC, USA, 1997; EPA/600/P-95/002F a-c. Available online: https://cfpub.epa.gov/si/si_public_record_report.cfm?Lab=NCEA&dirEntryId=12464 (accessed on 2 October 2020).
- U.S. EPA. Risk Assessment Guidance for Superfund, Vol. 1: Human Health Evaluation Manual. EPA/540/1-89/002. Available online: https://www.epa.gov/sites/default/files/2015-09/documents/rags_a.pdf (accessed on 25 October 2024).
- U.S. EPA. Risk Assessment Guidance for Superfund: Vol. III—Part A, Process for Conducting Probabilistic Risk Assessment. 2001. Available online: https://www.epa.gov/risk/risk-assessment-guidance-superfund-rags-volume-iii-part (accessed on 15 October 2024).
- Taghavi, M.; Darvishiyan, M.; Momeni, M.; Eslami, H.; Fallahzadeh, R.A.; Zarei, A. Ecological risk assessment of trace elements (TEs) pollution and human health risk exposure in agricultural soils used for saffron cultivation. Sci. Rep. 2023, 13, 4556. [Google Scholar] [CrossRef]
- Miletić, A.; Lučić, M.; Onjia, A. Exposure Factors in Health Risk Assessment of Heavy Metal(loid)s in Soil and Sediment. Metals 2023, 13, 1266. [Google Scholar] [CrossRef]
- Toxicity Values for Inhalation Exposure. April 2023. Available online: https://dep.nj.gov/wp-content/uploads/boss/risk-screening/toxall-04-2023.pdf (accessed on 10 December 2024).
- Muhammad, N.; Nafees, M. Geo-chemical investigation and health risk assessment of potential toxic elements in industrial wastewater irrigated soil: A geo-statistical approach. J. Biodivers. Environ. Sci. 2018, 12, 367–380. [Google Scholar]
- Kolo, M.T.; Khandaker, M.U.; Amin, Y.M.; Abdullah, W.H.B.; Bradley, D.A.; Alzimami, K.S. Assessment of health risk due to the exposure of heavy metals in soil around mega coal-fred cement factory in Nigeria. Results Phys. 2018, 11, 755–762. [Google Scholar] [CrossRef]
- Adimalla, N. Heavy metals contamination in urban surface soils of Medak province, India, and its risk assessment and spatial distribution. Environ. Geochem. Health 2020, 42, 59–75. [Google Scholar] [CrossRef]
- Rousseeuw, P.J. Silhouettes: A graphical aid to the interpretation and validation of cluster analysis. J. Comput. Appl. Math. 1987, 20, 53–65. [Google Scholar] [CrossRef]
- Sammon, J.W., Jr. A nonlinear mapping for data structure analysis. IEEE Trans. Comput. 1969, 100, 401–409. [Google Scholar] [CrossRef]
- Henderson, P. Sammon Mapping. Available online: https://homepages.inf.ed.ac.uk/rbf/CVonline/LOCAL_COPIES/AV0910/henderson.pdf (accessed on 10 October 2024).
- Saliba, Y.; Bărbulescu, A. A Downscaling MERRA-2 Reanalysis PM2.5 series over the Arabian Gulf by Inverse Distance Weighting, Bicubic Spline Smoothing, and Spatio-temporal Kriging. Toxics 2024, 12, 177. [Google Scholar] [CrossRef] [PubMed]
- Nazzal, Y.; Bărbulescu, A.; Sharma, M.; Howari, F.; Naseem, M. Evaluating the Contamination by Indoor Dust in Dubai. Toxics 2023, 11, 933. [Google Scholar] [CrossRef]


| Factor | Definition | Value |
|---|---|---|
| c | concentration of the heavy metal in the sample [mg/kg] computed here | |
| Ring | dust ingestion rate [mg/day] | 100 |
| AT | average time [day] | 365 × ED |
| BW | mean weight of body [kg] | 70 |
| EF | frequency of exposure [days/year] | 365 |
| ED | duration of exposure [year] | 24 |
| SA | surface of the skin in contact with the dust [cm2] | 5700 |
| Rinh | rate of inhalation [m3/day] | 20 |
| SL | factor of skin adherence for dust [mg/cm2] | 0.07 |
| ABS | factor of dermal absorption [-] | 0.001 |
| PEF | factor of particle emission [m3/kg] | 1.36 × 10⁹ |
| Metal | Ingestion | Dermal | Inhalation |
|---|---|---|---|
| Ba | 7 × 10⁻² | 14 × 10−3 | 5 × 10⁻⁴ |
| Cd | 5 × 10⁻⁴ | 5 × 10⁻⁶ | 2 × 10⁻⁵ |
| Co | 3 × 10⁻² | 5 × 10⁻⁶ | 6 × 10⁻⁶ |
| Cr | 3 × 10⁻³ | 15 × 10−6 | 1.4 × 10⁻⁴ |
| Cu | 4 × 10⁻² | 12 × 10−3 | 1 × 10⁻⁴ |
| Fe | 0.7 | 2.2 × 10⁻⁴ | 7 × 10⁻³ |
| Mn | 2 × 10⁻² | 8 × 10⁻⁴ | 5 × 10⁻⁵ |
| Ni | 2 × 10⁻² | 54 × 10−4 | 2 × 10⁻⁵ |
| Pb | 14 × 10−4 | 42 × 10−5 | 1 × 10⁻⁴ |
| Zn | 0.300 | 0.0600 | 0.300 |
| Number of PCs | 1 | 2 | 3 | 4 |
|---|---|---|---|---|
| AIC | 102.13 | 86.277 | 74.23 | 62.12 |
| BIC | 102.77 | 87.55 | 76.14 | 64.68 |
| Metal | ML2 | ML3 | ML1 | h2 | u2 | Com |
|---|---|---|---|---|---|---|
| Cd | −0.45 | 0.03 | 0.64 | 0.59 | 0. 413 | 1.8 |
| Cr | −0.15 | 0.83 | −0.15 | 0.62 | 0.383 | 1.1 |
| Cu | 0.53 | 0.04 | −0.08 | 0.31 | 0.688 | 1.1 |
| Ni | −0.11 | −0.08 | 0.37 | 0.17 | 0.832 | 1.3 |
| Pb | 0.47 | 0.23 | 0.31 | 0.49 | 0.510 | 2.2 |
| Co | 0.09 | −0.03 | 0.99 | 1.00 | 0.005 | 1.0 |
| Ba | 0.43 | 0.41 | −0.21 | 0.58 | 0.415 | 2.5 |
| Fe | 0.86 | 0.11 | 0.07 | 0.86 | 0.137 | 1.0 |
| Mn | 0.26 | 0.77 | 0.18 | 0.91 | 0.093 | 1.3 |
| Zn | 0.97 | −0.03 | −0.02 | 0.91 | 0.091 | 1.0 |
| Metal | Min/Site | Max/Site | Mean | Min/Site | Max/Site | Mean | Min/Site | Max/Site | Mean |
|---|---|---|---|---|---|---|---|---|---|
| Ba | 4.430 | 16.900 | 9.470 | 0.931 | 3.540 | 1.990 | 25.300 | 96.100 | 54.000 |
| D2 | D9 | D2 | D9 | D2 | D9 | ||||
| Cd | 0.294 | 0.926 | 0.544 | 7.970 | 25.100 | 14.800 | |||
| D7 | D1, D12 | D7 | D1, D12 | D7 | D1, D12 | ||||
| Co | 0.663 | 2.85 | 1.230 | 8.820 | 37.900 | 16.4 | 0.325 | 1.400 | 0.605 |
| D12 | D1 | D12 | D1 | D12 | D1 | ||||
| Cr | 0.164 | 0.889 | 0.383 | 0.803 | 4.360 | 1.880 | 0.803 | 118.000 | 50.900 |
| D1 | D14 | D1 | D14 | D1 | D14 | ||||
| Cu | 1.540 | 8.810 | 3.590 | 0.576 | 3.240 | 1.320 | 15.400 | 87.900 | 35.800 |
| D12 | D6 | D12 | D6 | D12 | D6 | ||||
| Fe | 427.00 | 1800 | 1090.00 | 243.000 | 1030.00 | 625.00 | 243.00 | 1030.00 | 623.000 |
| D3 | D6 | D3 | D6 | D3 | D6 | ||||
| Mn | 3.980 | 7.820 | 5.640 | 2.930 | 5.750 | 4.150 | 79.500 | 156.000 | 113.000 |
| D8 | D5 | D8 | D5 | D8 | D5 | ||||
| Ni | 3.020 | 15.500 | 5.760 | 2.220 | 11.400 | 4.230 | 60.300 | 310.000 | 115.000 |
| D11 | D8 | D11 | D8 | D11 | D8 | ||||
| Pb | 0.145 | 8.300 | 41.200 | 19.300 | 0.306 | 1.529 | 0.710 | ||
| D12 | D9 | D12 | D9 | D12 | D9 | ||||
| Zn | 518.00 | 2500.00 | 1340.00 | 2.540 | 12.400 | 5.590 | 0.689 | 33.500 | 179.000 |
| D14 | D5 | D14 | D5 | D14 | D5 | ||||
Disclaimer/Publisher’s Note: The statements, opinions and data contained in all publications are solely those of the individual author(s) and contributor(s) and not of MDPI and/or the editor(s). MDPI and/or the editor(s) disclaim responsibility for any injury to people or property resulting from any ideas, methods, instructions or products referred to in the content. |
© 2025 by the authors. Licensee MDPI, Basel, Switzerland. This article is an open access article distributed under the terms and conditions of the Creative Commons Attribution (CC BY) license (https://creativecommons.org/licenses/by/4.0/).
Share and Cite
Saliba, Y.; Bărbulescu, A. Assessing Pollution with Heavy Metals and Its Impact on Population Health. Toxics 2025, 13, 52. https://doi.org/10.3390/toxics13010052
Saliba Y, Bărbulescu A. Assessing Pollution with Heavy Metals and Its Impact on Population Health. Toxics. 2025; 13(1):52. https://doi.org/10.3390/toxics13010052
Chicago/Turabian StyleSaliba, Youssef, and Alina Bărbulescu. 2025. "Assessing Pollution with Heavy Metals and Its Impact on Population Health" Toxics 13, no. 1: 52. https://doi.org/10.3390/toxics13010052
APA StyleSaliba, Y., & Bărbulescu, A. (2025). Assessing Pollution with Heavy Metals and Its Impact on Population Health. Toxics, 13(1), 52. https://doi.org/10.3390/toxics13010052