Article

The Impact of Agroecosystems on Nitrous Acid (HONO) Emissions during Spring and Autumn in the North China Plain

1
State Key Laboratory of Severe Weather, Key Laboratory for Atmospheric Chemistry, Institute of Atmospheric Composition, Chinese Academy of Meteorological Sciences, Beijing 100081, China
2
Institute for Environmental and Climate Research, Jinan University, Guangzhou 511443, China
3
Guangdong-Hongkong-Macau Joint Laboratory of Collaborative Innovation for Environmental Quality, Guangzhou 511443, China
4
State Key Laboratory of Atmospheric Boundary Layer Physics and Atmospheric Chemistry, Institute of Atmospheric Physics, Chinese Academy of Sciences, Beijing 100029, China
5
State Key Laboratory of Severe Weather, Institute of Agricultural Meteorology, Chinese Academy of Meteorological Sciences, Beijing 100081, China
6
Hebei Gucheng Agricultural Meteorology National Observation and Research Station, Baoding 072656, China
*
Author to whom correspondence should be addressed.
Toxics 2024, 12(5), 331; https://doi.org/10.3390/toxics12050331
Submission received: 2 April 2024 / Revised: 20 April 2024 / Accepted: 24 April 2024 / Published: 30 April 2024

Abstract

:
Solar radiation triggers atmospheric nitrous acid (HONO) photolysis, producing OH radicals, thereby accelerating photochemical reactions, leading to severe secondary pollution formation. Missing daytime sources were detected in the extensive HONO budget studies carried out in the past. In the rural North China Plain, some studies attributed those to soil emissions and more recent studies to dew evaporation. To investigate the contributions of these two processes to HONO temporal variations and unknown production rates in rural areas, HONO and related field observations obtained at the Gucheng Agricultural and Ecological Meteorological Station during spring and autumn were thoroughly analyzed. Morning peaks in HONO frequently occurred simultaneously with those of ammonia (NH3) and water vapor both during spring and autumn, which were mostly caused by dew and guttation water evaporation. In spring, the unknown HONO production rate revealed pronounced afternoon peaks exceeding those in the morning. In autumn, however, the afternoon peak was barely detectable compared to the morning peak. The unknown afternoon HONO production rates were attributed to soil emissions due to their good relationship to soil temperatures, while NH3 soil emissions were not as distinctive as dew emissions. Overall, the relative daytime contribution of dew emissions was higher during autumn, while soil emissions dominated during spring. Nevertheless, dew emission remained the most dominant contributor to morning time HONO emissions in both seasons, thus being responsible for the initiation of daytime OH radical formation and activation of photochemical reactions, while soil emissions further maintained HONO and associated OH radial formation rates at a high level, especially during spring. Future studies need to thoroughly investigate the influencing factors of dew and soil emissions and establish their relationship to HONO emission rates, form reasonable parameterizations for regional and global models, and improve current underestimations in modeled atmospheric oxidation capacity.

Graphical Abstract

1. Introduction

Nitrous acid (HONO) plays a crucial role in atmospheric chemistry as it is one of the most important sources of the most essential oxidant in the troposphere, hydroxyl radicals (OH), whose abundance is a measure of the atmospheric oxidation capacity and self-cleansing ability [1,2,3]. Daytime OH formation initiates the oxidation of inorganic and organic trace gases as well as aerosol compositions, leading to the formation of secondary pollutants such as ozone (O3), peroxyacetyl nitrate (PAN), secondary inorganic aerosols (SIAs) and secondary organic aerosols (SOAs), thereby deteriorating regional air quality and threatening human health [4]. HONO has been reported to contribute 30–60% and 60–92% to atmospheric OH levels during summer and winter, respectively [5,6], leading to simultaneously occurring haze and photochemical gaseous air pollution as indicated by high O3 or PAN levels [7,8,9]. Therefore, clarifying the sources of HONO is crucial for the understanding of tropospheric photochemistry and for formulating efficient pollution control strategies. Currently, significant progress has been made in the investigation of direct HONO emissions from various combustion sources, soil and microbial processes, surface photolysis of inorganic and organic nitrates, and both homogeneous and heterogeneous formation processes on different surfaces [10,11,12,13,14,15,16,17]. However, key daytime sources are still missing in the HONO budget, despite all the efforts that have been paid to resolve this issue [18,19,20,21].
The North China Plain (NCP) has been facing severe photochemical and particulate pollution during recent decades, which has received widespread public attention [22,23,24]. Despite significant improvements during the last decade, under stringent emission control measures, the NCP remains one of the most polluted regions in the world, with the ongoing aggravation of ozone pollution and increasing importance of secondary aerosol pollution. The NCP is a traditional agricultural region, with a high coverage of farmlands amidst the heavily populated megacities. Under the increasing demand for food, various natural soils have been transformed into agricultural soils [25] and increasing amounts of chemical nitrogen fertilizers have been extensively applied to cultivated lands, resulting in long-term increases in agricultural nitrogen emissions [26,27]. Thus, cultivated areas might make huge contributions to regional HONO pollution and atmospheric oxidation capacity. Current research in China is mostly focused on the heterogeneous transformation of NOx and associated HONO production on various surfaces such as aerosols, urban grime, architectures, and ground surface [28,29,30,31], and have mainly based their HONO budget and mechanism studies on observations in urban environments [32,33,34,35,36], not paying sufficient attention to agricultural regions that surround the heavily populated urban centers.
Agricultural soil emissions have been proposed to be a major source of HONO in rural NCP, particularly following fertilizing events [16]. Denitrification and anaerobic nitrate reduction within soils are significant sources of HONO and ammonia (NH3) under relatively dry soil conditions. Biological nitrate reduction in oxygen-limited micro zones, on the other hand, has been suggested to contribute to HONO emissions under high soil humidity conditions [37,38]. Additionally, recent studies proposed that the natural formation and evaporation of dew and guttation water plays an important role as a nighttime sink and daytime source of HONO and NH3 [39], influencing their diel cycles in vegetated areas. Although the potential role of dew water as a storage and emission source of HONO has already been proposed many years ago [40,41,42], it still lacks sufficient recognition and awareness [43]. Dew is formed upon water vapor condensation on ground or plant surfaces due to radiative cooling after sunset [44]. Additionally, various types of vegetation undergo guttation processes that allow their roots to absorb soil water and expel them from hydathodes distributed on leaf tips or edges after sunset, which can continue on for several hours after sunrise under favorable soil humidity conditions [45]. In meteorological observations, guttation is often taken as dew fall. In rural areas, the diurnal temperature variation is generally larger than in urban regions and the humidity is typically higher, thus rendering rural regions more prone to dew formation, with an average dew frequency of around 50% throughout the year in rural NCP [46]. Moreover, the amount of dew and guttation water, which was reported to reach 216 and 750 mL m−2 during winter and spring, respectively, is higher than that reported for fog water and exceeds the liquid water content of particulate matter by far [13,47], thus acting as a much more efficient nighttime storage for water-soluble trace gases such as HONO. Aside from that, dew and guttation droplets can also serve as a medium for aqueous phase chemical reactions, providing reaction sites for the conversion of NO2 to HONO [43]. Under high NH3 conditions such as those found in rural NCP, aqueous phase NO2 to HONO conversion might even be further promoted by NH3 [46,48].
Although the impact of dew and guttation on HONO deposition, emissions and subsequent OH production rates have been studied for the late autumn season, when winter wheat is sown, the impact in springtime which is the most vigorous growth season of wheat and when there is the highest dew water content has not been studied before. The contribution of soil and dew to HONO emissions and the corresponding OH radical formation rates under stronger radiative conditions, the highly distinct pollution and meteorological conditions in spring, have not been yet evaluated and compared to those during the cold seasons. Therefore, this study adopts HONO, NH3, and water vapor observational data acquired during late spring and late autumn campaigns in rural NCP to investigate the relative contributions of dew and soil emissions to atmospheric HONO in those two seasons, and their contribution to the atmospheric oxidation capacity and photochemical air pollution formation.

2. Materials and Methods

2.1. Measurements and Data

The data used in this study were obtained in field observations conducted at the Gucheng (GC) Agricultural and Ecological Meteorological Station (39°09′ N, 115°44′ E), Chinese Academy of Meteorological Sciences. The spring and autumn campaigns were carried out from 3 April to 5 May 2019 and from 22 October to 23 November 2021, respectively. The GC station is located between two major cities, namely Beijing Municipality (100 km to the northeast) and Baoding City, Hebei Province (~40 km to the southwest) in the North China Plain and is surrounded by farmlands, where winter wheat and summer maize are cultivated as is typical for the entire NCP. Experimental farmlands within the GC station are on the same crop rotation, representing well the pollution and environmental conditions of rural areas in southern Hebei Province [46,48,49,50]. In the spring campaign, the winter wheat was jointing and booting, with wheat leaf area density at its maximum. In the autumn experiment, maize was harvested by the end of October, and wheat was sown in early November, which was at its seedling to tillering stage during the observation period.
Various instruments were placed inside an air-conditioned container on the side of the experimental farm field, to continuously measure HONO, related trace gases (e.g., NH3, O3, NOx) and atmospheric photolysis rates (including J(HONO), J(O1D), J(NO2), etc.). HONO measurements were performed using the LOPAP-03 analyzer (QUMA Elektronik & Analytik GmbH, Wuppertal, Germany), with zero checks every six hours and liquid phase nitrite standard calibrations every 3–5 days. Calibration liquid standard concentrations of 0.008 and 0.02 mg L−1 were used during spring 2019 and autumn 2021, respectively, corresponding to gas phase concentrations of ~1.5 and ~2.2 ppb (conversion from liquid to gas phase concentration depends on gas and liquid sample flow rates), respectively. The instrument has a measurement precision of 1%, with HONO detection limits varying from 1.0 to 6.6 ppt and from 5.2 to 9.6 ppt during the two campaigns, respectively. NH3 measurements in spring 2019 were obtained with the economic ammonia analyzer Model DLT–100 (Los Gatos Research, San Jose, CA, USA, precision of 0.2 ppb at 100 s sampling frequency), while the NH3 in autumn 2021 was measured using the NH3 analyzer Model EC9842 (Ecotech, Knoxfield, VIC, Australia, precision of 1 ppb), which were both calibrated before and after the campaigns using a NH3/N2 (Air Liquide, Houston, TX, USA, traceable to the US National Institute for Standards and Technology) and a NOx/N2 (Chemical Metrology & Analytical Science Division, National Institute of Metrology, Beijing, China) reference gas mixture, respectively. O3 and NOx were measured using the TE 49C O3 analyzer and TE 42C NOx analyzer (Thermo Fisher Scientific, Waltham, MA, USA), where O3 was multipoint calibrated before each campaign and NOx was weekly span checked and monthly multipoint calibrated using standard reference gas mixtures. All multipoint calibrations revealed good linearity with R2 > 0.999. Photolysis rates were measured using an ultra-fast CCD-spectrometer from METCON GmbH (Lippstadt, Germany), with a spectral resolution below 1.8 nm and a spectral range of 280 to 650 nm. Aerosol chemical composition (including N O 3 , S O 4 2 , N H 4 + and organic aerosol mass concentrations) was only measured during the autumn campaign using an aerosol mass spectrometer (AMS, Aerodyne Research, Inc., Billerica, MA, USA), with details on its calibration and data processing described in Kuang, et al.’s paper [51]. Aerosol hygroscopicity was measured using a self-assembled humidified nephelometer system, that can derive aerosol liquid water content as well as ambient aerosol surface area density, details on which can be found in Kuang, et al. [52,53]. Since N O 3 mass concentrations were not monitored during the spring campaign, it was assumed that N O 3 made up a fraction of 12% of total PM2.5 based on reported springtime observations [54], wherein PM2.5 mass concentrations were predicted using humidified nephelometer measurements using machine learning methods described in Xue, et al. [55]. Conventional meteorological data such as atmospheric pressure (hPa), air temperature (°C), soil temperature (10 cm depth, °C), relative humidity (RH), wind direction and wind speed were obtained from an automatic weather station within the site yard.

2.2. Data Processing and Definitions of Morning Peaks

Since HONO is very easily photolyzed after sunrise, its daytime formation is often overshadowed by its photolysis loss. To better discuss the variations and potential formation or emission of HONO after sunrise, a photolysis correction was applied to observed HONO concentrations using the following equation:
H O N O c =   H O N O p × e J H O N O × t  
where H O N O p represents the concentration of HONO after photolysis, i.e., the observed concentration, H O N O c the initial concentration before photolysis, J(HONO) the photolysis rate of HONO, and t is the duration of sunlight exposure. HONO and NH3 both exhibited typical increases after sunrise, reaching a peak between 8:00 and 10:00 local time (LT), defined as the morning peak. Sometimes they would also reach a peak between 12:00 and 14:00 LT in the afternoon, defined as the afternoon peak. The simultaneous growth and common peak of HONO and NH3 was defined as the “dual peak” phenomenon.

2.3. HONO Budget Analysis

To evaluate the unknown sources and sinks within the HONO budget, a detailed HONO budget analysis was performed considering currently known and parameterizable HONO generation and consumption pathways. This allows us to estimate a net HONO production rate and by subtracting it from the actually observed HONO variation rate, the currently unexplained HONO production/destruction rate can be obtained, which is denoted as P u n k n o w n . P u n k n o w n > 0 indicates the presence of unknown HONO sources, while P u n k n o w n < 0 suggests the existence of unaccounted sinks.
Currently known sources of HONO include primary emissions (from vehicles, biomass burning and soil bacterial/microbial activities) and secondary homogeneous and heterogeneous formation pathways. Among the emission sources, the contribution of vehicle emissions to HONO ( P V e h i c l e ) is typically estimated based on the ratio between vehicle HONO and NOx emissions (k) that was obtained during tunnel experiments [56,57]. Tunnel experiments and car exhaust analyses showed that k varied within a wide range of 0.18 to 2.1%. Spataro et al. [58] reported a k upper limit of 0.65% for Beijing urban regions in 2013, while Zhang et al. [59] adopted k = 0.8% for the Gucheng agricultural site (the same site as in this study), which is used in this study. By assuming that all the observed NOx was contributed by vehicle emissions, an upper limit was obtained for vehicle HONO emissions using:
P V e h i c l e = 0.008 × N O x
In the sensitivity study, the variation range of k (mentioned above) was applied to test the response of calculation results towards uncertainties in k.
Biomass burning events were not encountered during our observation periods and were thus not considered in the budget analysis. Soil emissions (Psoil) are typically quantified by HONO flux measurements [16,38,60,61,62,63], based on which parameterizations of soil HONO emission rates have been proposed, mainly as a function of temperature [61]. Based on such parameterizations, soil emissions revealed very limited influences on HONO during the autumn campaign in our previous study [39]. In this study, another approach was adopted to deduce Psoil, which will be discussed in Section 2.3.
HONO can be directly produced via homogeneous gas phase oxidation of NO by OH radicals:
N O + O H H O N O , k 1   =   7.2     ×     10 12   c m 3   m o l e c   s 1
While at the same time, it can also be further oxidized by OH radicals into NO2:
H O N O + O H   N O 2 +   H 2 O , k 2   =   5.0     ×     10 12   c m 3   m o l e c   s 1
Thus, the overall homogeneous HONO production rate (Phomo) can be calculated as:
P h o m o = k 1 × N O k 2 × H O N O × O H
Since OH was not directly measured in the two observations, a parameterization based on the strong linear relationship between J(O1D) and [OH] was adopted following parameterizations proposed based on previous OH observational studies carried out during summer and winter in Wangdu, which is another agricultural site only ~70 km away from GC [64,65]:
Spring   O H = 4.5   ×   10 11   × J O 1 D + 10 6
A u t u m n   O H = 3.6 × 10 8 × J O 1 D + 1.1 × 10 5
To evaluate potential uncertainties caused by the parameterization of OH radicals, we multiplied and divided [OH] by a factor of 2 in the sensitivity study.
Aside from homogeneous gas phase reactions, HONO can also be formed through the heterogeneous conversion of NO2 on the ground surface ( P g r o u n d ) and aerosol surfaces ( P a e r o s o l ) , which are parameterized as:
P g r o u n d = γ g     ×   υ N O 2 8   ×   S V   ×   N O 2 ,
P a e r o s o l =   γ a     ×   S A C ×   υ N O 2 4   ×   N O 2 ,
where υ N O 2 is the mean molecular speed of NO2, S/V is the ground surface-area-to-volume ratio (m−1), which was assumed to be 1/PBLH according to VandenBoer et al. [66], and SAC is the aerosol surface area density at ambient RH conditions derived from the humidified nephelometer measurements [52]. γg is the NO2 uptake coefficient on the ground surface, which has been determined to range from 2 × 10⁻⁶ to 1.6 × 10⁻⁵ based on nocturnal vertical profile measurements during spring in a rural environment [66], with an average of 8 × 10⁻⁶. γa is the uptake coefficient of NO2 on the aerosol surface, which was reported to range from 1 × 10⁻⁹ (mineral dust) to 7.0 × 10⁻⁶ (liquid organic aerosols) on different kinds of aerosols under steady states in laboratory experiments [67] (except for sea salt aerosols, which exhibited uptake coefficients between 6.0 × 10⁻⁷ and 3.0 × 10⁻⁴). Considering that aerosols in GC mainly comprised secondary inorganic aerosols (sulfate, nitrate, and ammonium salts), primary and secondary organic aerosols, and mineral dust [49], an averaged aerosol uptake coefficient of 1.9 × 10 6 was adopted. To further account for the enhancement of solar radiation on NO2 uptake, as proposed by previous laboratory and field studies [68,69,70], a weighting factor was constructed using J(NO2) following the methods in [32,39]:
γ g =     8.0 × 10 6 × ( 1 + J N O 2 J N O 2 n o o n )
γ a =   1.9 × 10 6 × ( 1 + J N O 2 J N O 2 n o o n )
The above mentioned variation range of γ g and γ a and their influence on calculations results were evaluated in the sensitivity study.
Aside from the heterogeneous conversion of NO2, HONO can also be produced upon nitrate ( N O 3 ) aerosol photolysis ( P N O 3 ), which can be estimated using the observed N O 3 concentration and the photolysis rate of J( N O 3 ):
P N O 3 =   J N O 3   ×   N O 3
where J( N O 3 ) was parameterized following previous work [71,72]:
J N O 3 = 8.3   ×   10 5 7   ×   10 7   × J ( H N O 3 )
J H N O 3 = 3.6   ×   10 5   ×   J ( H O N O ) 4 7.3   ×   10 2   ×   J ( H O N O ) 3 + 0.65   ×   J ( H O N O ) 2 3.9   ×   10 5   × J ( H O N O ) 3.6   ×   10 10
where J(HNO3) is the photolysis rate of gaseous HNO3. In the sensitivity study, a J N O 3 bias of ±20% was considered.
The most important consumption pathway of HONO is its own photolysis decomposition process:
H O N O +     h v J H O N O   N O + O H
with a HONO loss rate of:
L h v = J H O N O   ×     H O N O
Otherwise, HONO is mainly lost through dry deposition:
L d e p = v d P B L H   ×     H O N O ,
where vd is the dry deposition velocity of HONO, which is assumed to be 0.5 cm s−1 [19,73], PBLH is the planetary boundary layer height (obtained from ERA5 reanalysis data (https://cds.climate.copernicus.eu/#!/home, accessed date: 27 October 2023). By integrating the above sources and sinks, P H O N O n e t was calculated as:
  P H O N O n e t = P V e h i c l e + P h o m o + P g r o u n d + P a e r o s o l + P N O 3 L h v L d e p ,
and the unknown source/sink of HONO can be obtained using Equation (16):
P u n k n o w n = d H O N O d t P H O N O n e t

2.4. Derivation of Soil and Dew Water HONO Emissions

In agricultural regions, possible processes that could have been behind P u n k n o w n are mainly soil emissions and dew formation/evaporation (given there were no biomass burning events). In recent years, soil emissions of nitrogen containing gases have been widely studied in the fields of soil science, agriculture, and atmospheric science. As already mentioned in Section 2.3, soil emissions of HONO were determined using HONO flux measurements and parameterizations were established using its linear relationship with temperature, which only exists when emissions are present. However, there are commonly no or only very weak HONO emissions under temperatures below a certain threshold, where previous parameterizations would yield irrational negative emission rates. Additionally, the emission factor should vary with distinct soil conditions (soil water content and concentration of nitrogen species), which the typically used linear regression with fixed coefficients cannot reflect. Dew and guttation water formation and evaporation processes are highly complicated and their impact on HONO is even harder to parameterize.
In this study, we assume that all the P u n k n o w n was contributed by soil emissions and dew deposition/emissions. In previous field observations, dew water has mostly evaporated by noontime, only remaining until afternoon hours under strong daytime fog events. Thus, we adopted the time window of 13:00 to 19:00, during which we assumed that only soil emissions contributed to P u n k n o w n , avoiding the time range when dew evaporation might overlap with soil emissions.
Thus, we could perform a fitting between Tsoil and P u n k n o w n within this time window for each day, to yield a parameterization for Psoil that varies with each day. During the fitting process, we found that the exponential fitting equation (Equation (17)) could best describe the relationship between T s o i l and P u n k n o w n .
P s o i l = A   s o i l   × e B s o i l   ×   T s o i l
A s o i l and B s o i l in Equation (16) are unknown constants that were determined during the fitting. Negative A s o i l and B s o i l were considered unreasonable, and the contribution of soil emissions to HONO was considered negligible on that day. Thus, P HONO s o i l over the whole day could be derived by using the diurnal variation of T s o i l . Using the exponential form to parameterize soil emissions instead of the traditional linear fitting approach could better reflect the fact that HONO emissions are close to zero beneath a certain temperature threshold. Additionally, parameters Asoil and Bsoil varied from day to day, reflecting changes in soil emission strength impacted by environmental factors other than soil temperature.
By subtracting derived P s o i l from P u n k n o w n , we obtained the remaining unknown HONO source/sink, which was attributed to dew emissions/depositions P d e w :
P d e w = P u n k n o w n P s o i l
with positive values representing HONO emissions during dew evaporation and negative ones representing HONO deposition due to its dissolution in dew water.

3. Results and Discussions

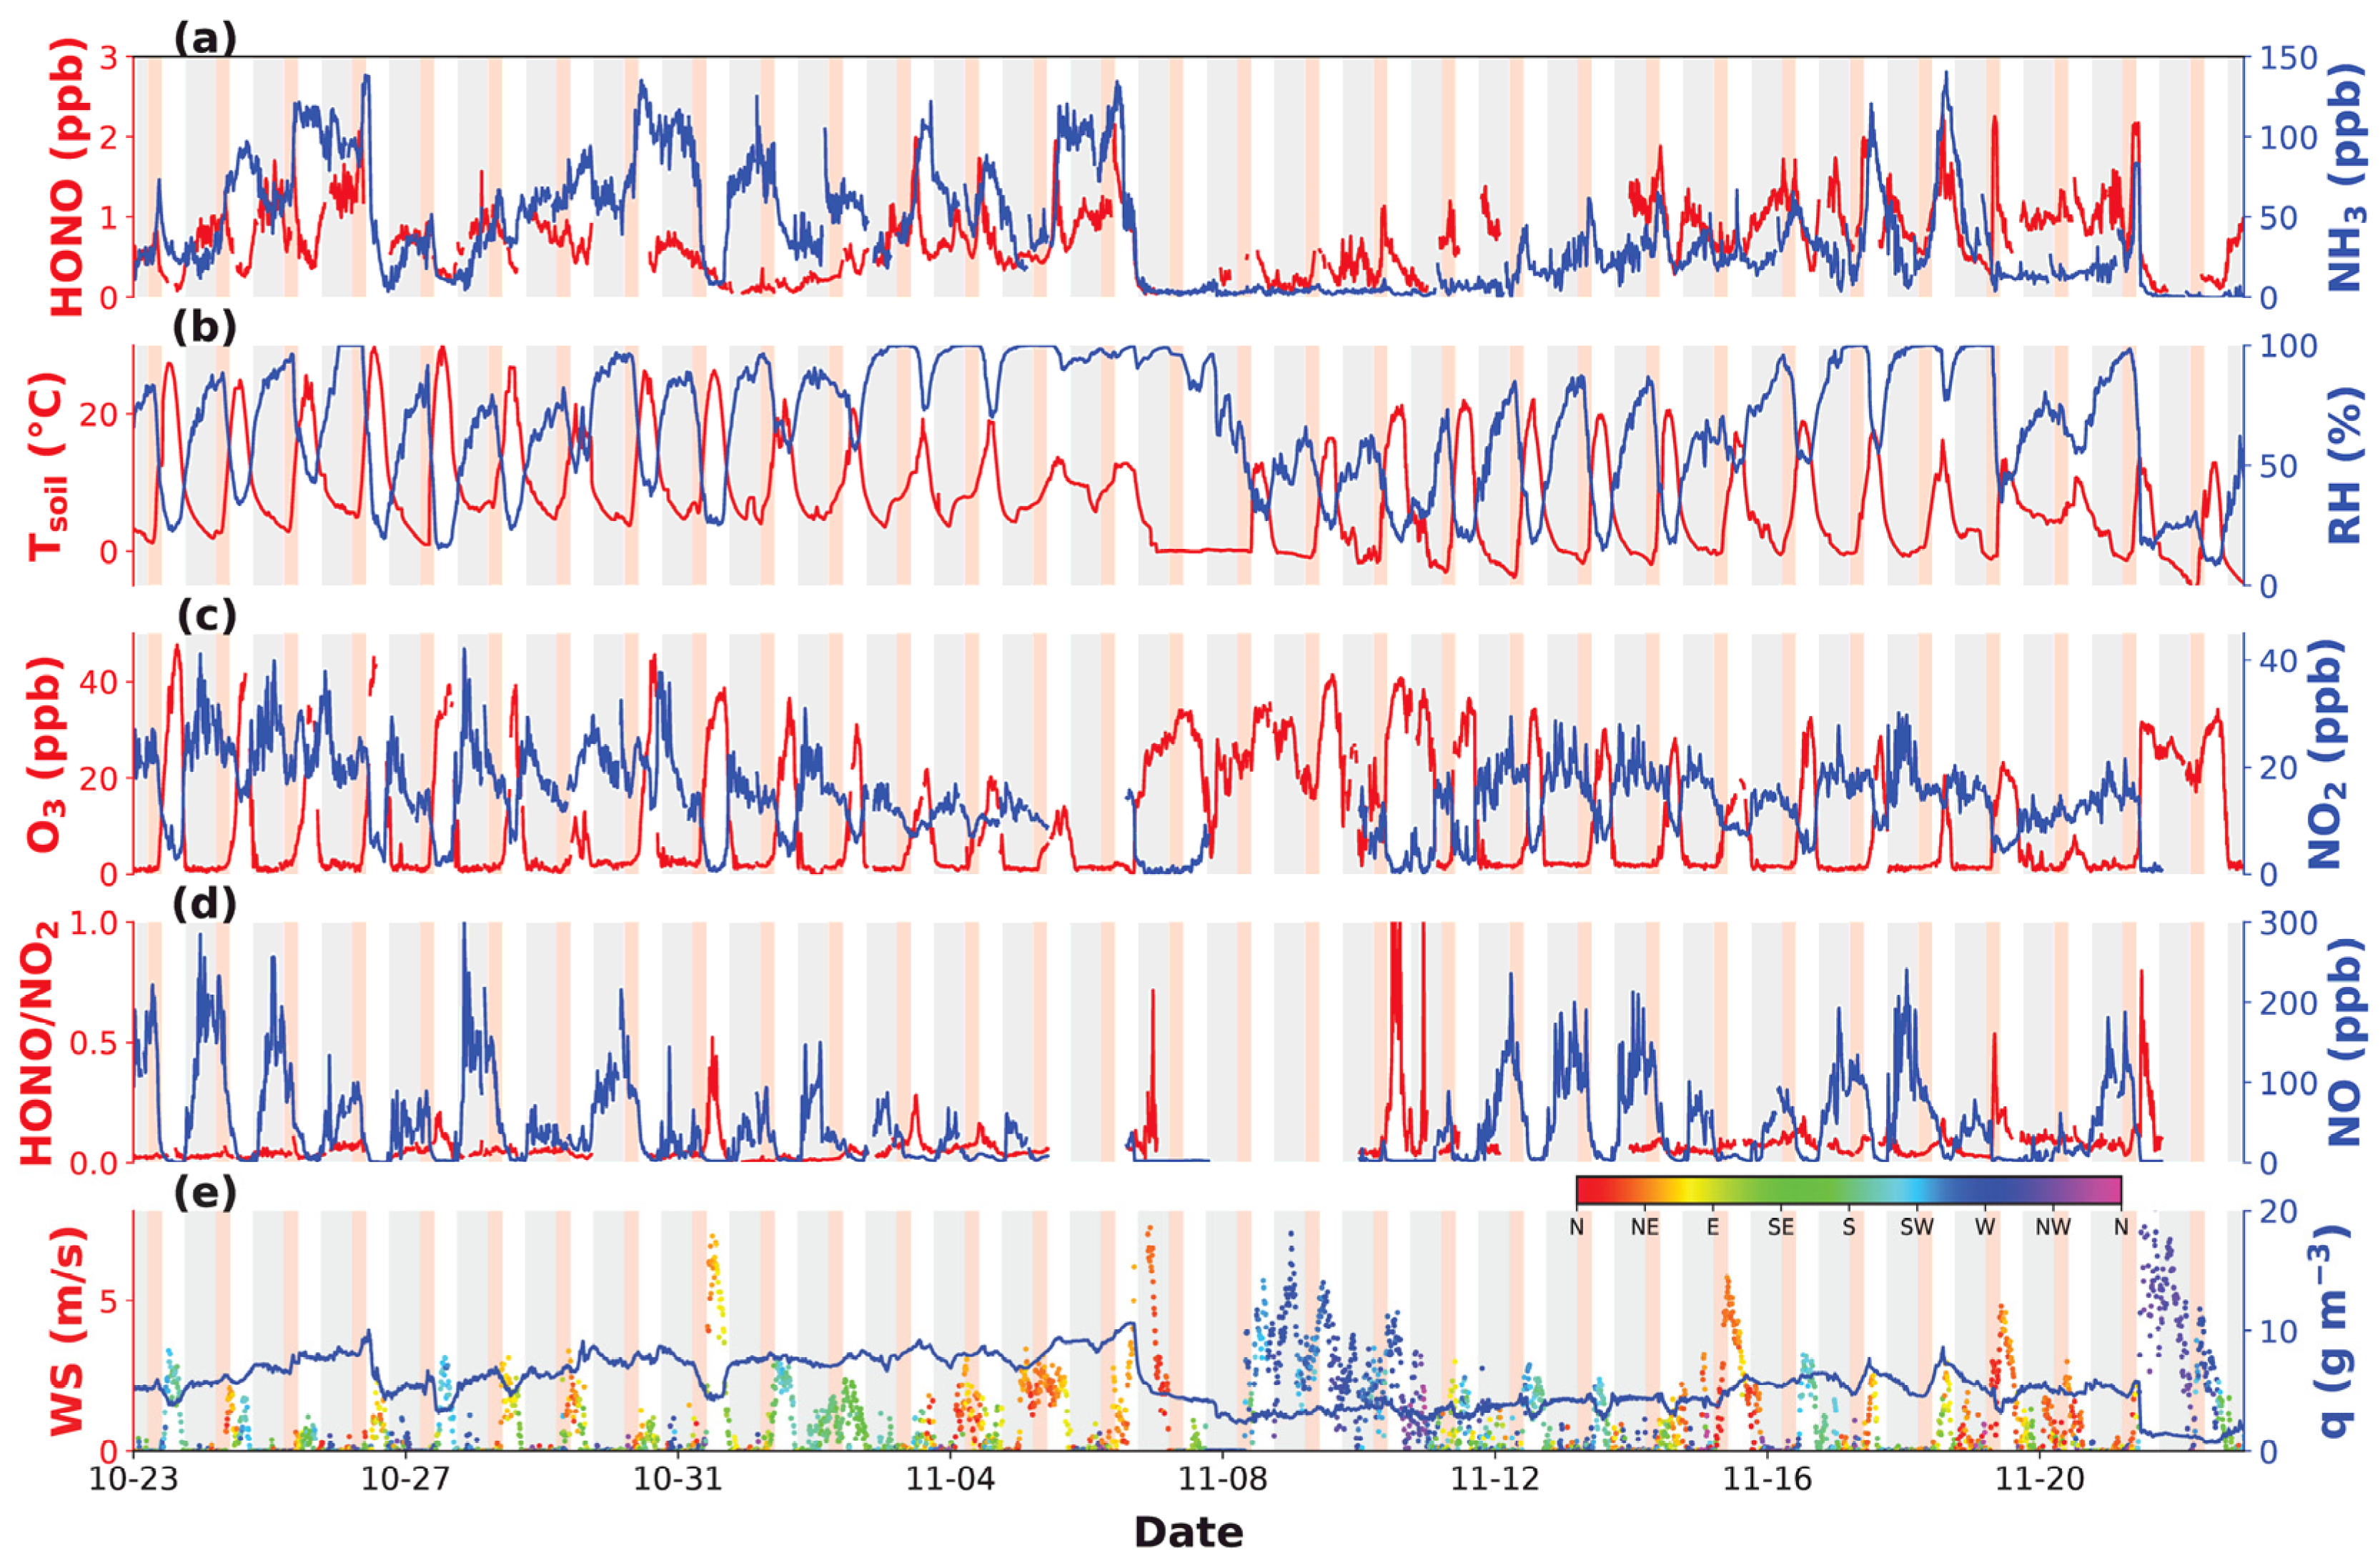
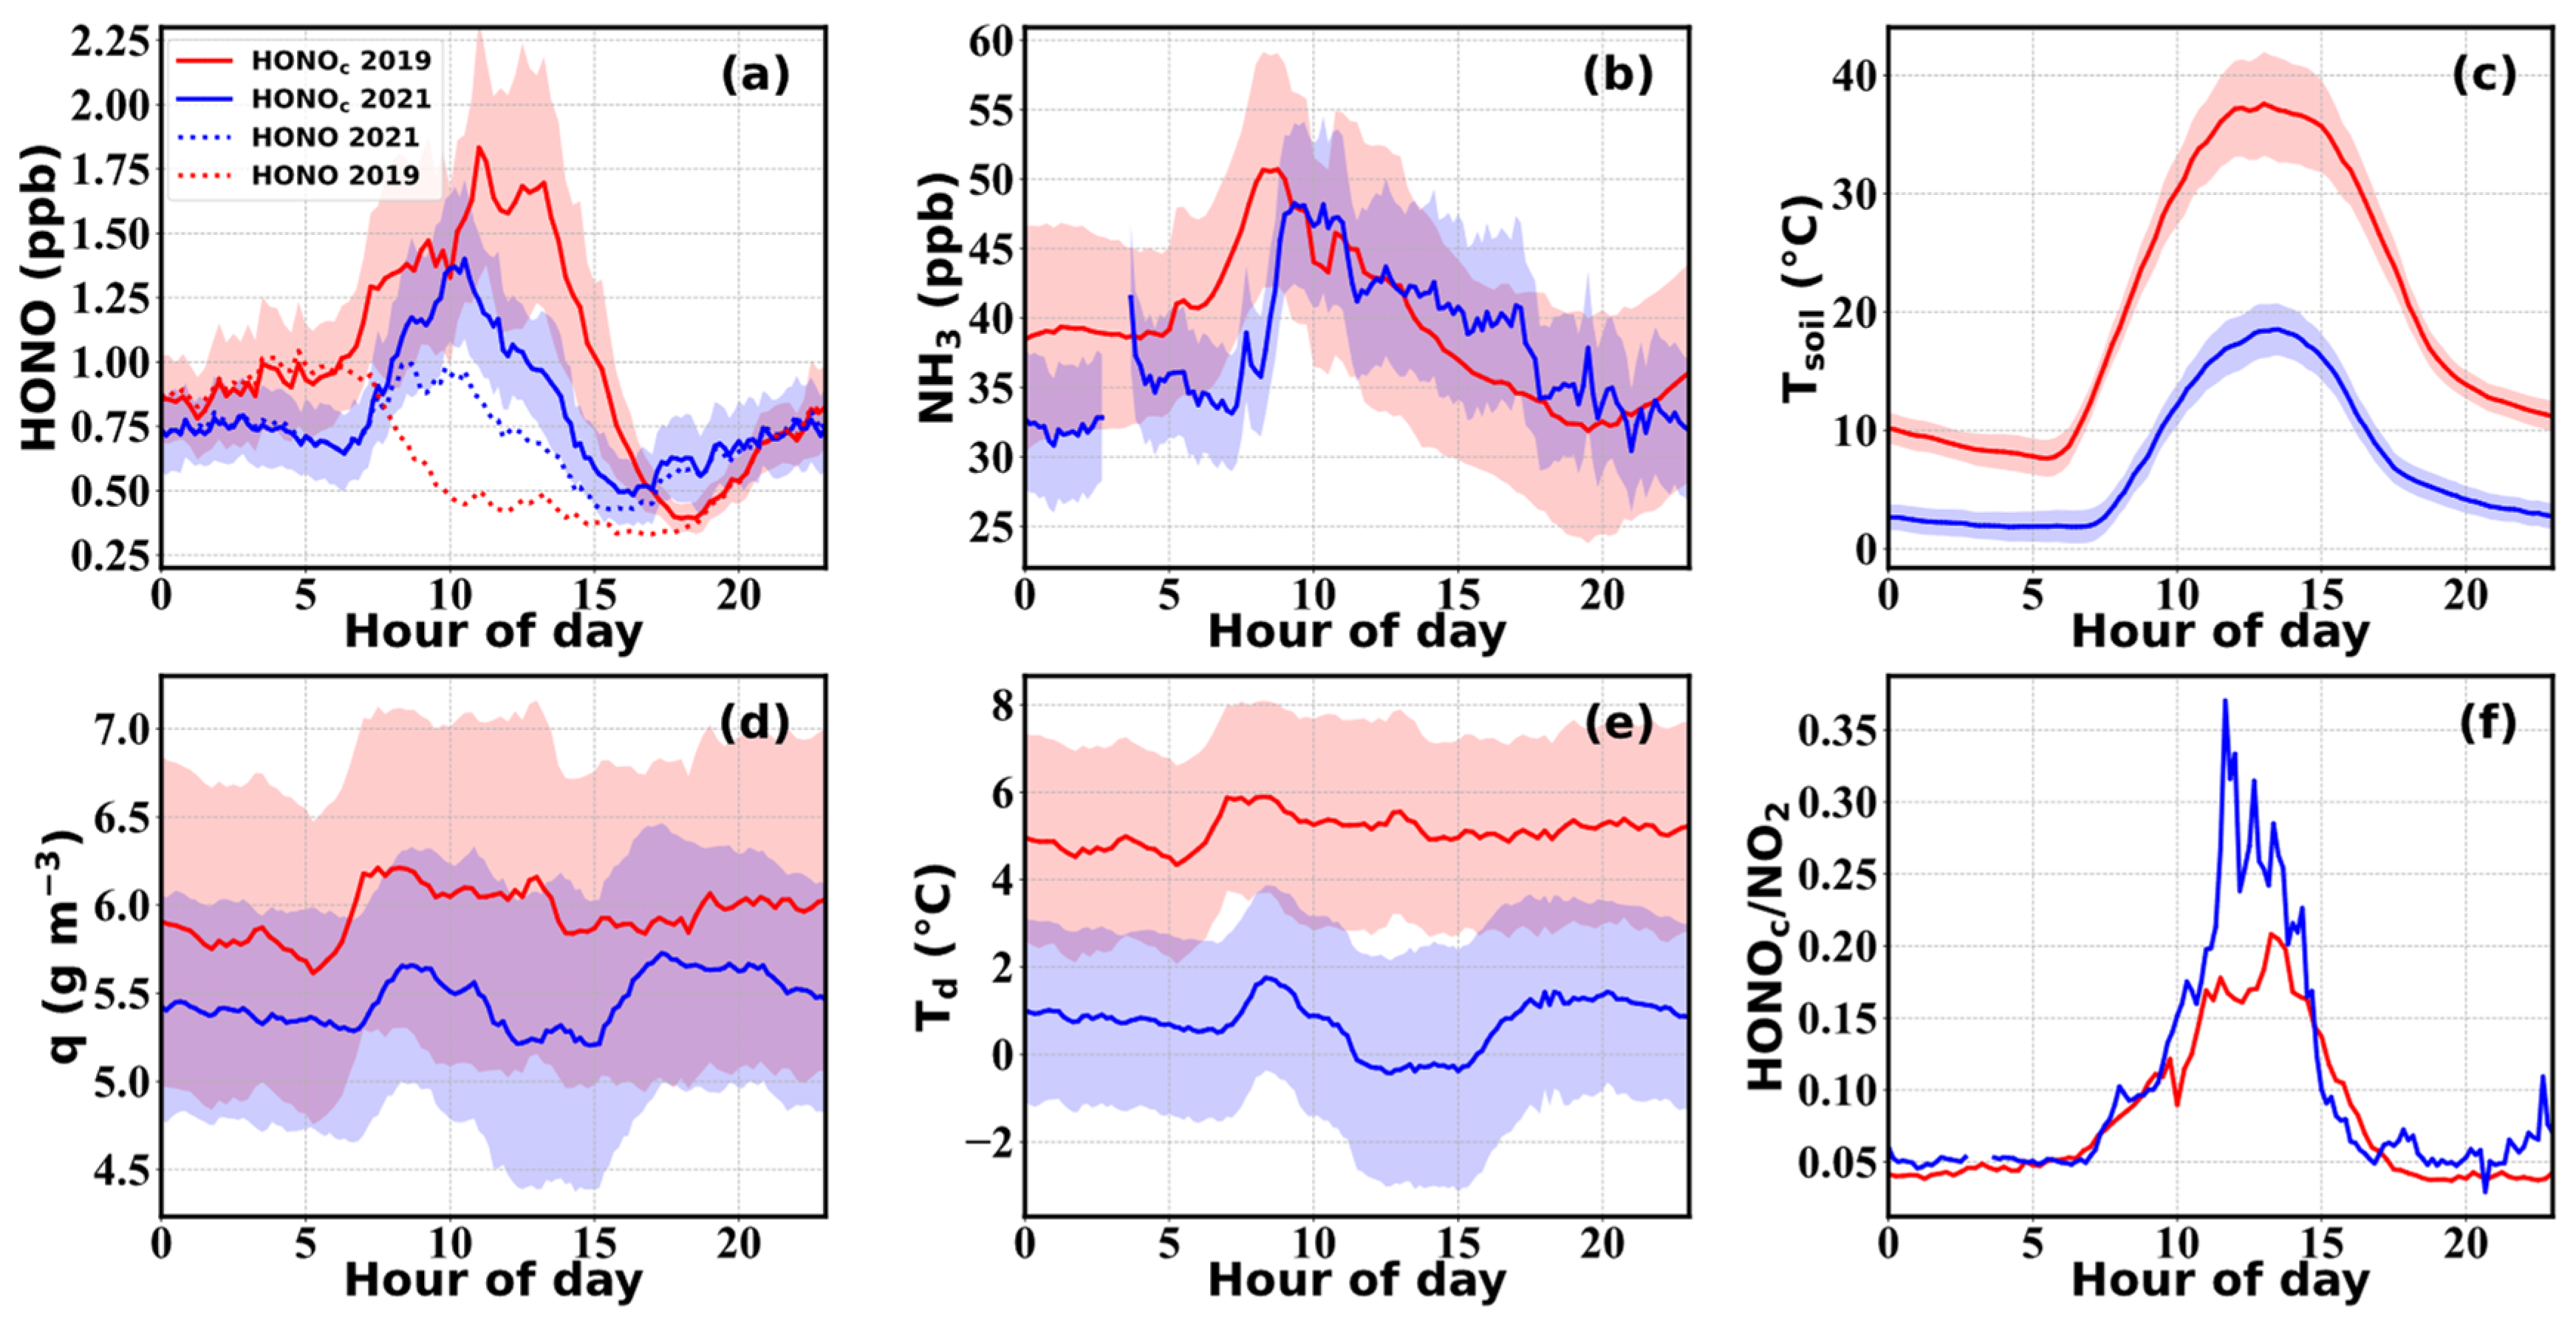
3.1. Variations of HONO and NH3
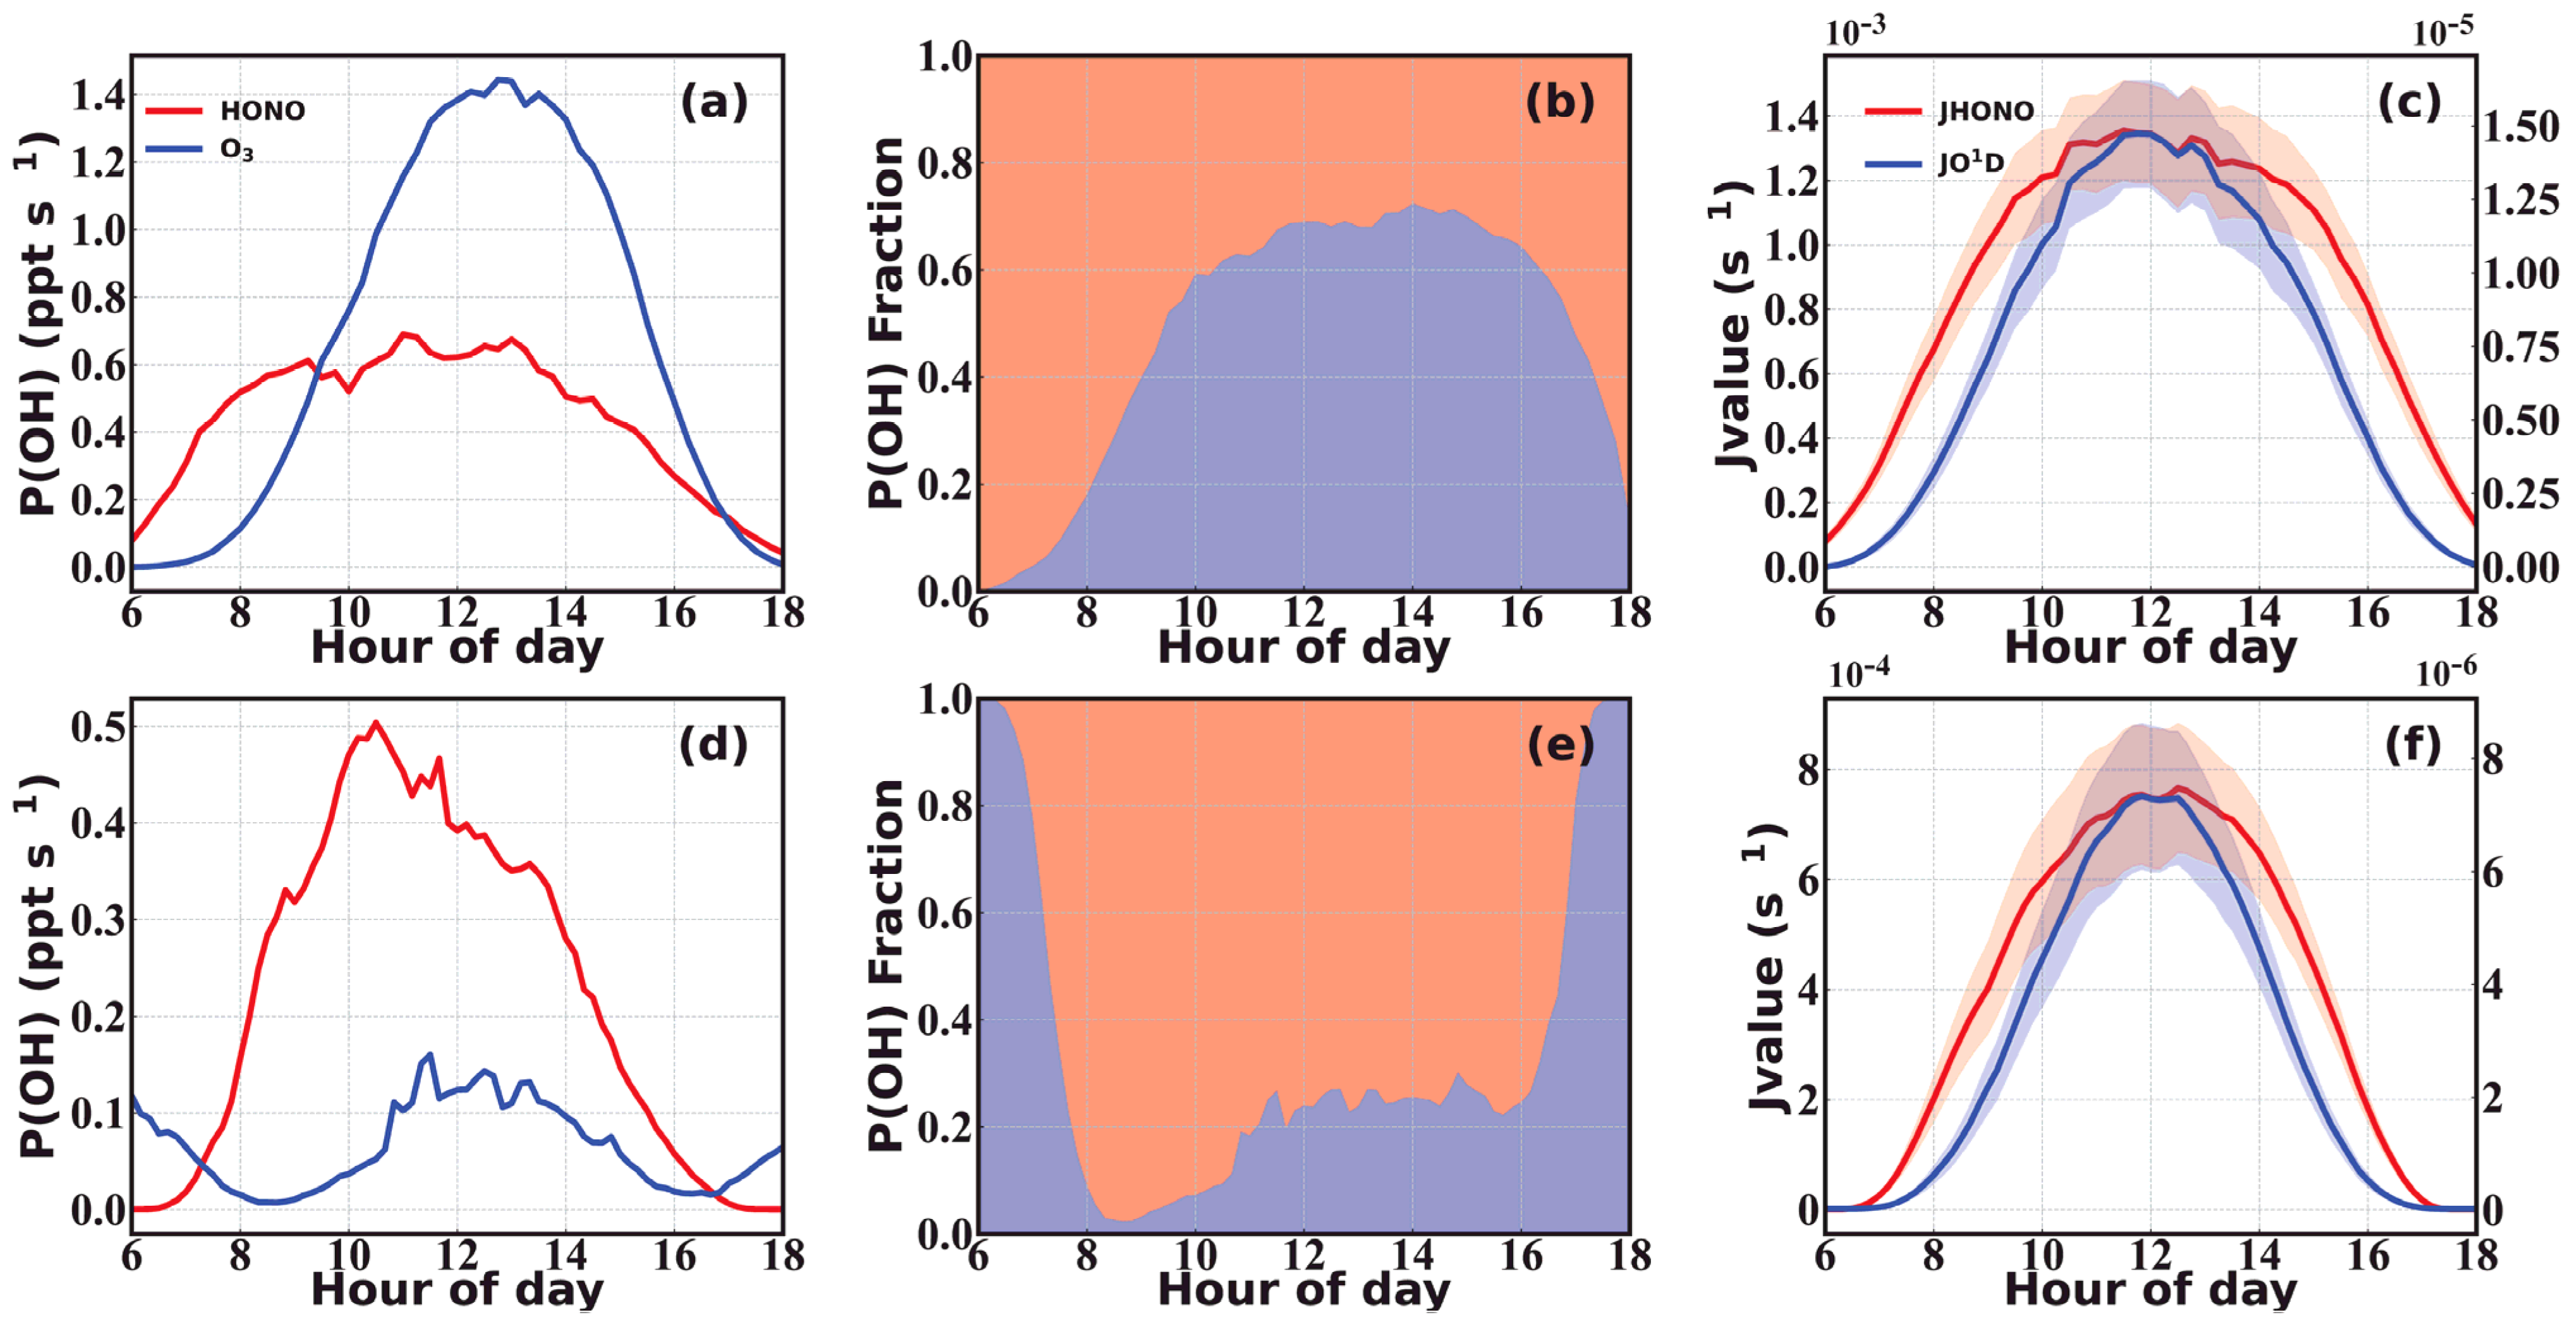
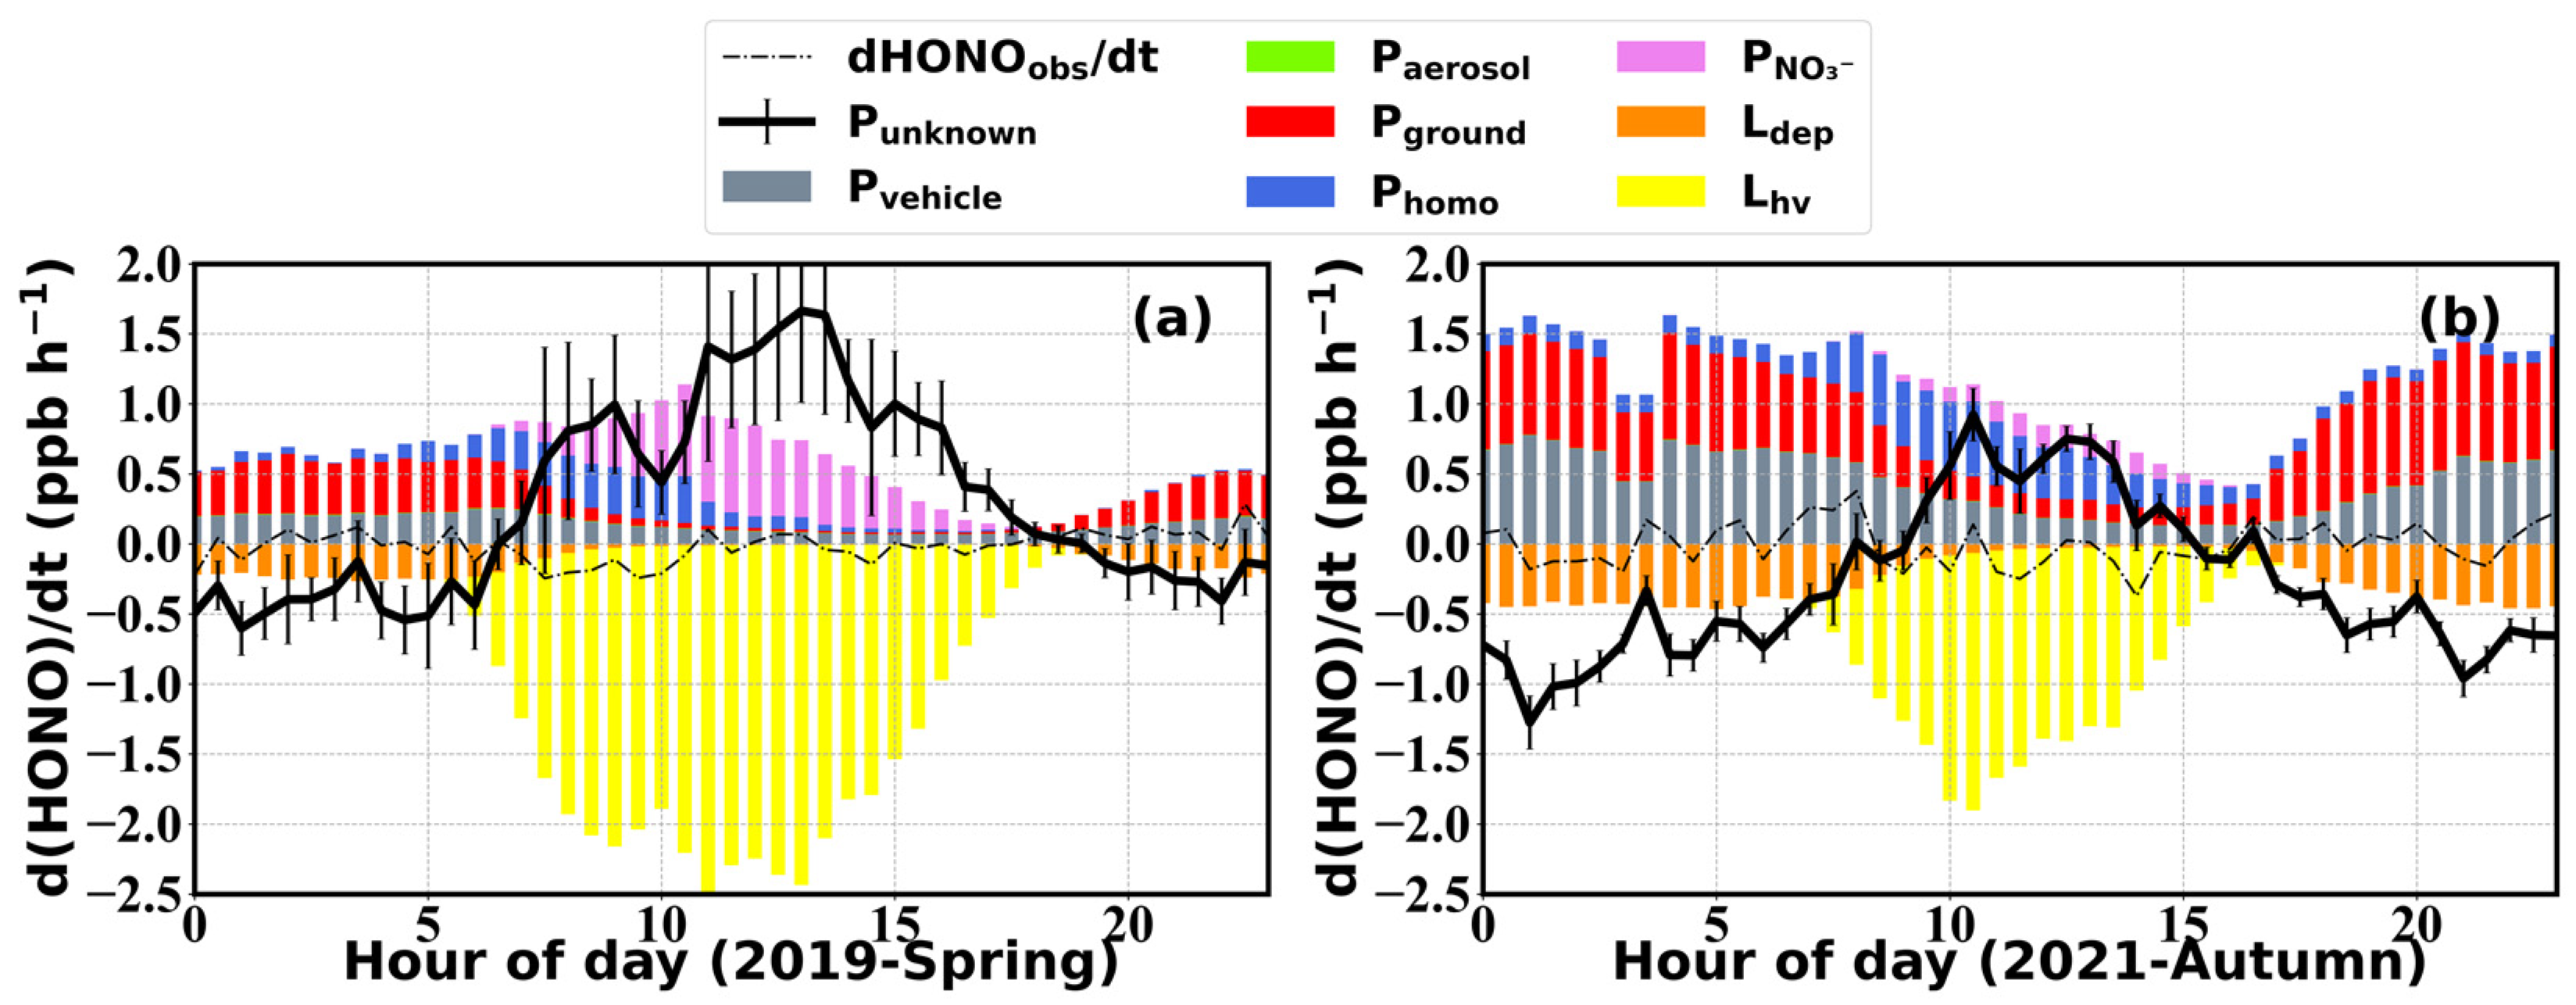
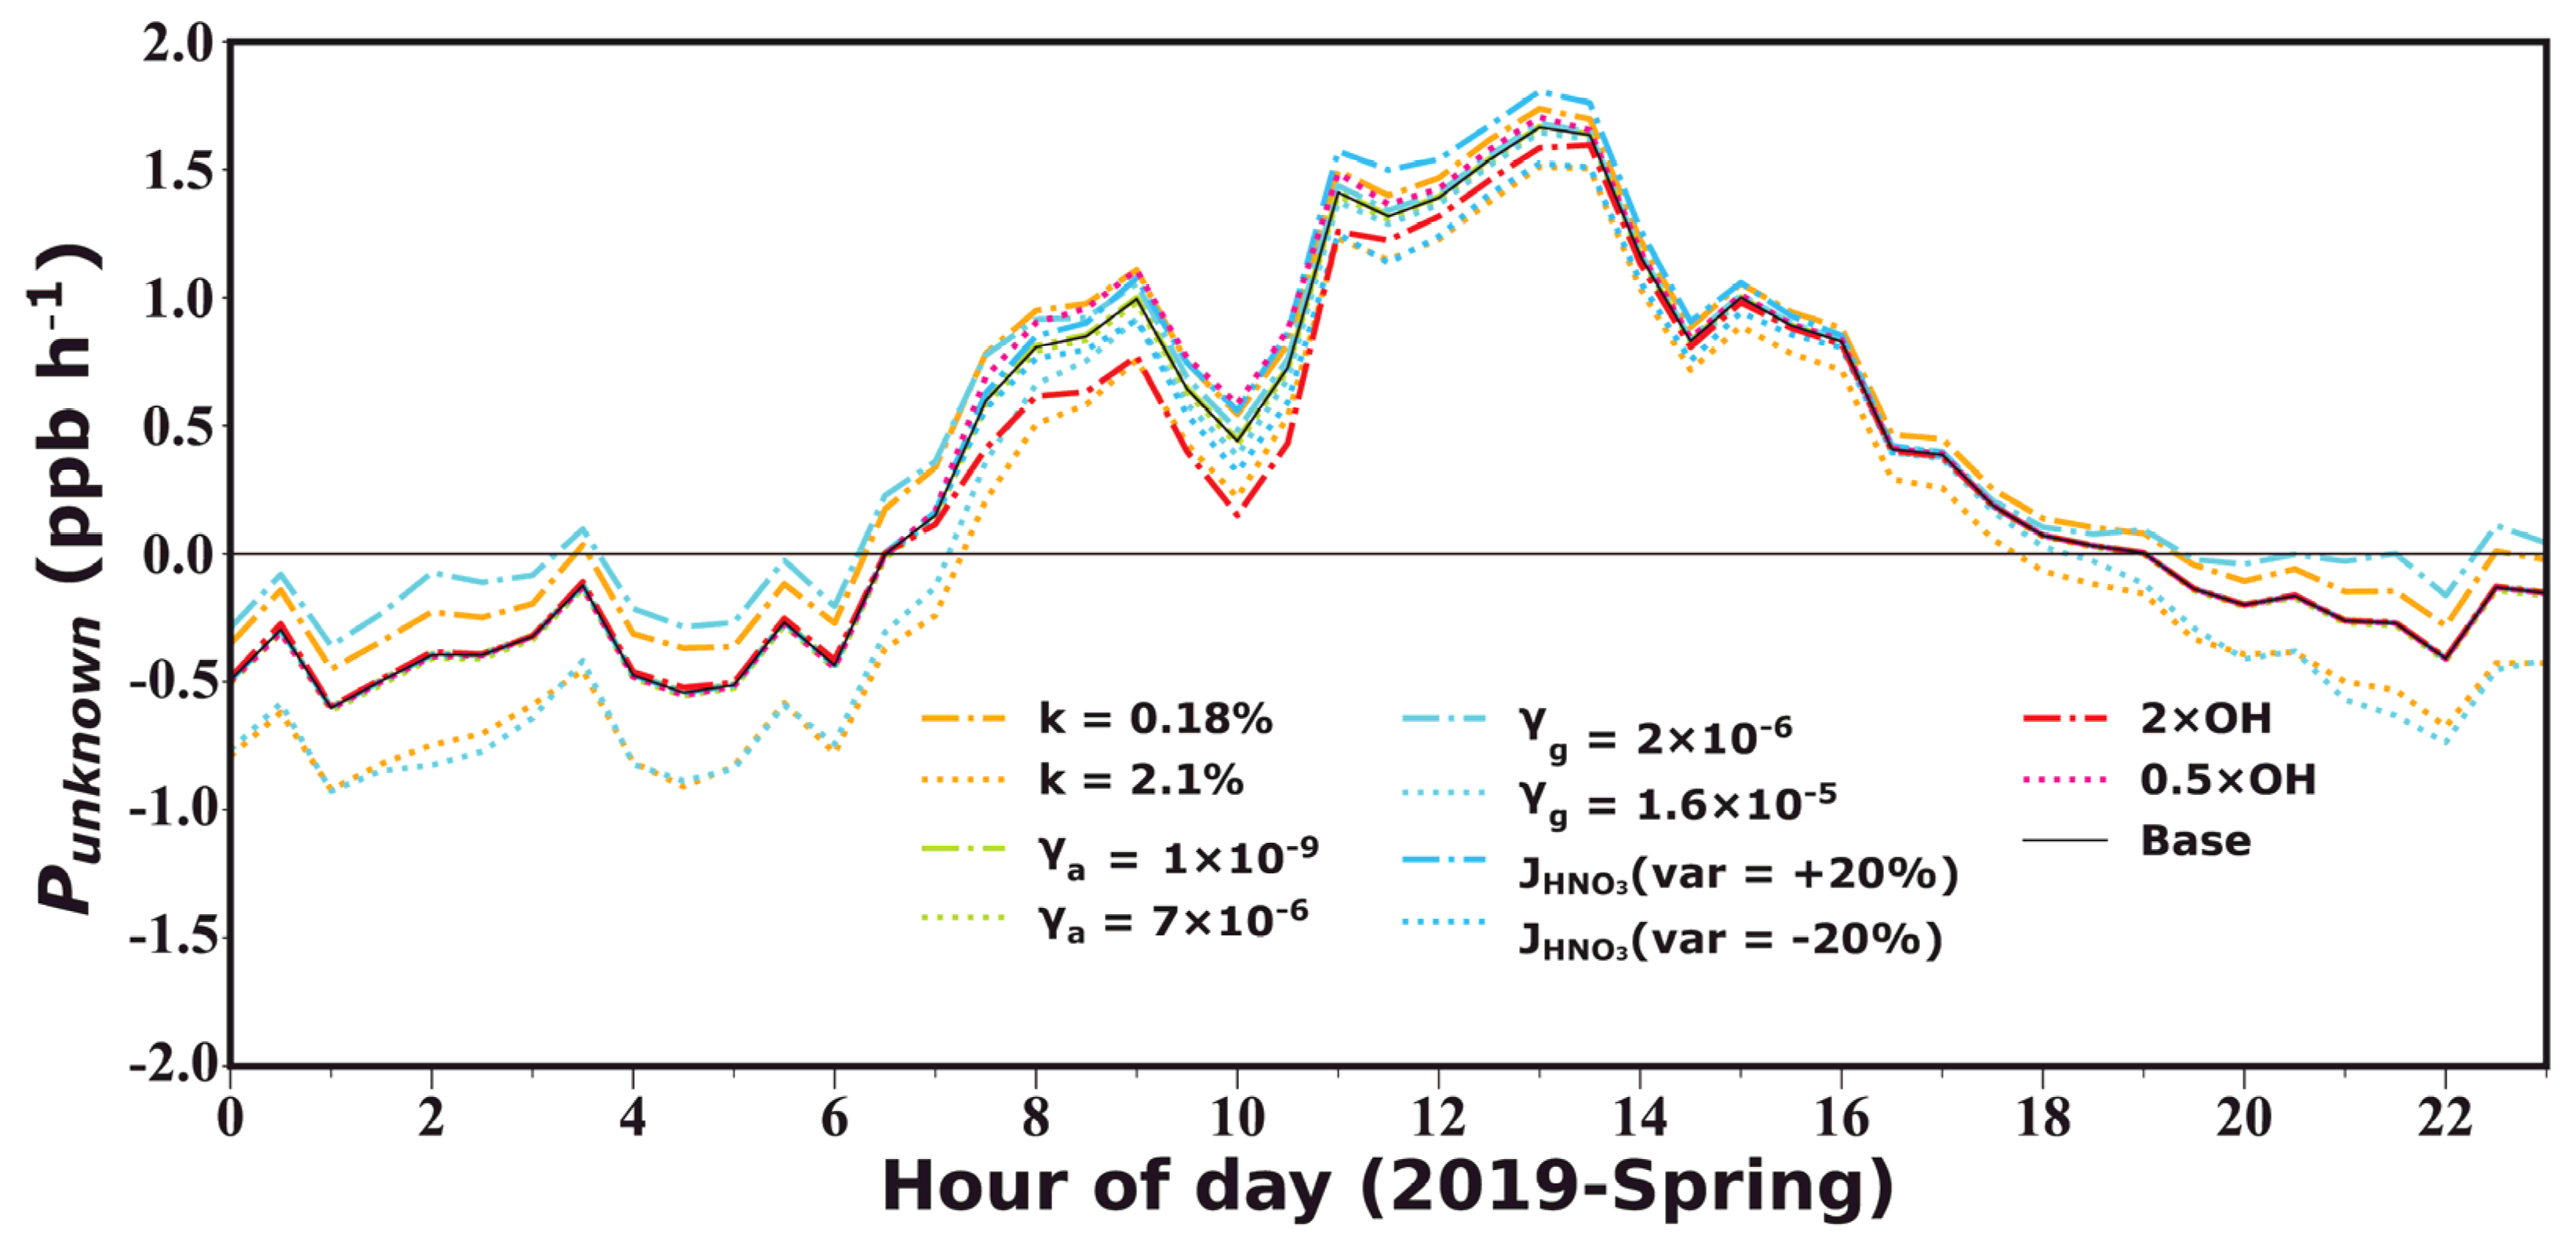
Figure 1 and Figure 2 present the time series of HONO, NH3, related gaseous pollutants and meteorological parameters measured during the spring of 2019 and the autumn of 2021 at GC, respectively. In spring 2019, HONO concentrations fluctuated between 0.08 and 2.6 ppbv, with an average of 0.7 ± 0.4 ppbv, while in autumn 2021, HONO concentrations fluctuated between 0.04 and 2.3 ppbv, with an average of 0.7 ± 0.4 ppbv. NH3 concentrations varied from 7.9 to 146.7 ppbv in spring, with an average of 40.2 ± 22.1 ppbv, while that in autumn ranged from 1.5 to 140.2 ppbv, with an average of 37.9 ± 33.1 ppbv. There was no significant difference in HONO concentrations between the two seasons, while NH3 concentrations in spring were only slightly higher than those in autumn, with a difference of ~2 ppbv.
The observed HONO and NH3 concentrations in both spring and autumn were similar to previously reported values for nearby urban and rural areas during the same seasons [20], but were generally higher than measurements in rural areas of European countries during the same seasons (Table 1). Compared to HONO observations in late autumn 2016 at GC, HONO reported in this study were much lower, while NH3 was significantly higher [48]. Another rural site very close to GC (Wangdu station, 70 km south of GC) is also representative of polluted rural NCP. Comparing observations in Wangdu and GC, a drastic drop in HONO levels was observed from 2016 to 2019 (Table 1), which might have been due to stringent air pollution control strategies implemented since 2013.
This was supported by the fact that NOx levels also significantly decreased from 2016 to 2021, with NOx reaching averages of 80.6 ± 44.7 ppbv, 19.3 ± 14.6 ppbv and 57.4 ± 52.1 ppbv in autumn 2016, spring 2019 and autumn 2021, respectively. NO2 concentrations in autumn 2021 (14.2 ± 7.5 ppbv) were significantly lower than those in 2016 (34.7 ± 13.8 ppbv) and were also lower than those in the spring of 2019 (16.6 ± 9.8 ppbv). Since NOx is typically high during cold seasons and low during warm seasons, this further supports the notion that NOx reductions were prominent under stringent emission control measures. Although NO2 concentrations were lower in autumn 2021, the NO2 to HONO conversion rate (HONO/NO2) was higher than during spring 2019 (Figure 3f), indicating that environmental conditions in autumn 2019 might have been more favorable for heterogeneous NO2 to HONO conversions.
Figure 3 shows the average diurnal variations of observed HONO concentrations and those corrected for its photolysis (HONOc), as well as NH3 concentrations and other related parameters for spring 2019 and autumn 2021. A morning increase was detected in the averaged diel cycle of observed HONO during autumn 2021, but hardly for spring 2019. A common daytime decrease in uncorrected HONO concentration was noted, which was mainly caused by its strong photolysis loss that exceeded its production and emission rates. The daytime concentration of HONO in autumn was higher than that in spring, and remained at a relatively high level for a longer period of time. After the correction for its photolysis, HONOc concentrations exhibited significant growth during the morning in both seasons, and concentrations were overall higher during spring than autumn, especially during noontime hours. After sunset, HONO concentrations started to accumulate throughout the night until reaching another peak on the next day. In autumn, a slight decrease was observed in HONO during the night before sunrise, which was not detected in spring. The average diurnal variation of HONOc reached a daily maximum of 1.8 ± 0.5 ppbv around 11:00 LT and a minimum level of 0.4 ± 0.1 ppbv around 16:00 LT in spring. In autumn, the HONOc reached its maximum (1.4 ± 0.3 ppbv) and minimum (0.5 ± 0.1 ppbv) around 10:00 LT and 15:00 LT, respectively; overall occurring an hour earlier than in spring, possibly due to differences in its budget between the two seasons. The differences in solar radiation conditions resulted in earlier onset, longer duration, and elevated strength in HONO photolysis loss during spring compared to that in autumn. Additionally, differences in atmospheric and soil temperatures and humidity between spring and autumn both impacted HONO soil emission strength, as well as the formation of dew and guttation water that determines the source and deposition strength of HONO within the aqueous phase.
The average diurnal variation of NH3 displayed a diel pattern similar to that of HONOc, with a gradual increase after sunrise. NH3 declined after sunset during autumn, which was inconsistent with HONO, while it increased after sunset during spring as HONO also did. While the peak time was similar during autumn, an earlier peak was observed in NH3 than in HONOc during spring. It is also worth noting that the start time of the morning HONO increase was consistent with that of NH3 during both spring and autumn. The difference in NH3 peak concentration between spring and autumn was insignificant, with an average peak concentration of 50.7 ± 8.3 and 48.2 ± 5.7 ppbv in spring and autumn, respectively.
Among the 33 days of HONO observations in the spring, HONO morning peaks were observed 23 times (70%), while NH3 morning peaks were observed 22 times (67%), with simultaneous HONO and NH3 morning peaks (“dual-peak” phenomenon) occurring on 19 days (58%). No morning peaks were detected under rainy or foggy meteorological conditions. During autumn, HONO and NH3 morning increases were reported to occur almost on all days with valid observations. Note that specific humidity (q), which reflects the absolute amount of water vapor in air, also revealed morning increases simultaneous to those of HONO and NH3, indicating that dew water evaporation might be determining the HONO and NH3 morning growth, which was proved for the 2021 autumn campaign [39].
The continuous increase in HONO after sunrise indicated strong secondary formations or emissions that dominated over its deposition and photolysis loss during the morning, under relatively low solar radiation intensity and weak dry deposition. After sunrise, the persistent photolysis of the produced or emitted HONO would lead to rapid generation of OH radicals, increasing atmospheric oxidation capacities, initiating the oxidation of primary air pollutants and contributing to the formation of secondary gaseous pollutants (such as O3 or peroxyacetyl nitrate) and secondary aerosols ( N O 3 , S O 4 2 and secondary organic aerosol, SOA) [79]. Aside from HONO photolysis, OH radicals can also be produced during the photodissociation of O3. The absolute and relative contributions of both O3 and HONO to OH radical production rates (P(OH)) during spring and autumn are shown in Figure 4a,b,d,e, respectively. During the entire spring observation period, the daytime average relative contribution of HONO to the total P(OH) reached 40 ± 14%, dominating before 9:30 LT and after 17:00 LT (Figure 4b). The high springtime O3 concentration allows it to dominate the noontime P(OH), reaching a maximum of ~70%. Conversely, during the cooler autumn season with lower O3 concentrations, the contribution of HONO to the total OH production rate can reach a daytime average of 82 ± 9% and a maximum of 97% during the morning. Therefore, HONO played a deterministic role in OH production during autumn and despite the lower contributions of HONO in spring, it still played an important role in the generation of daytime OH radicals, especially during early morning hours, which may enhance the daytime formation of O3, thereby feeding back on OH production.
Our previous study demonstrated that the formation and evaporation of dew and guttation water had significant impacts on the HONO diurnal budget during autumn, storing atmospheric HONO within the aqueous phase in the form of nitrite over nighttime and releasing HONO during the daytime evaporation process [39]. The influence of such a process on HONO under springtime meteorological and environmental conditions, however, has not been investigated before. The formation of dew depends on environmental RH over the plant, soil, and ground surfaces. The amount of guttation, however, is mostly influenced by soil moisture and the amount of water transported from roots to leaf tips and edges by the plants after sunset. Compared to dew formation, which requires high RH conditions, guttation occurs far more frequently. In the morning, as the temperature rises, water drops on plant and soil surfaces evaporate, releasing water vapor and HONO, as well as other water-soluble trace gases such as NH3. RH conditions strongly influence the rate of water evaporation and thus also determine the rate and time of HONO emissions.
In the 35-day observation period during spring, there were 17 days with nighttime RH exceeding 75%, accounting for approximately 50% of the total number of days. Among those days, there were 11 days with nighttime RH exceeding 90%. In the 33-day observation period in autumn, there were 21 days with nighttime RH exceeding 75%, accounting for more than 60% of the total number of days. Among these, there were 12 days with nighttime RH exceeding 90%. High RH conditions provided favorable conditions for the nighttime formation of dew, whose evaporation led to increases of q during daytime (Figure 5e,f). Additionally, the longer duration of dew and fog droplet evaporation, under stable atmospheric conditions, can maintain the presence of liquid water and dew until mid-afternoon, leading to an extended period of water vapor growth, as shown in Figure 5e,f. Under stable meteorological conditions, the concentrations of HONOc and NH3 in the atmosphere remained relatively stable before sunrise. Afterwards, during the rapid evaporation of water droplets, both HONOc and NH3 experienced rapid growths lasting for approximately 1–2 h (Figure 5a,b,e,f). The average growth rates of HONOc and NH3 during this stage reached 0.5 ± 0.2 and 22.0 ± 8.1 ppb h−1 in spring, and 0.8 ± 0.3 and 20.0 ± 15.2 ppb h−1 in autumn, respectively. Under higher RH conditions, the daily average increments of HONOc and NH3 were significantly higher than those observed under lower RH conditions. However, in terms of relative increments, there were no significant differences between high and low RH conditions. During springtime, the HONOc diurnal profile under high RH conditions revealed two separate peaks, which suggests that there might have been two distinct HONO production or emission pathways leading to these two peaks. Prenoon HONOc was the highest on days following nighttime high RH conditions, suggesting that the prenoon HONO production or emission process was promoted by humid conditions. However, noontime HONOc was the highest following low RH nights, which suggests that low RH conditions were most favorable for the noontime HONO production or emission. The prenoon source of HONO corresponds well with previously confirmed daytime dew and guttation evaporation and emissions, while the noontime source may be dominated by soil emissions, which were probably enhanced on clear and dry days when the fertilized soils were sufficiently heated by solar radiation. During autumn, prenoon rises in HONOc were observed under all nighttime RH conditions, with the peak occurring earlier under low nighttime RH and later under higher nighttime RH. The highest HONOc peak was observed following high RH nighttime conditions. This may be attributed to weak HONO soil emissions during the cold late autumn season, which rendered dew evaporations (that occurred earlier during the day when RH was lower) to be the dominant contributor to HONOc variations. To further elucidate how much of the observed HONO could not be explained by currently known and accounted sources during the spring and autumn seasons, we performed a detailed budget study that is presented in the following section.

3.2. Budget of HONO

The contribution of various HONO sources and sinks to the overall HONO budget during spring and autumn are displayed in Figure 6, with the black line representing the unknown HONO production/destruction rate (Punknown) that could not be explained with processes currently accounted for. Punknown was significantly higher during spring 2019 than in autumn 2021, exhibiting two daytime peaks (around 9:00 and 14:00) in spring and only one peak (from 10:00 to 14:00) in autumn.
The estimated vehicle emissions revealed similar diurnal variation patterns in spring and autumn, with the contribution being higher during nighttime and decreasing after sunrise to a minimum in the afternoon, following the diel cycle of NOx. The averaged contribution in autumn (0.44 ± 0.42 ppb h−1) was higher than that in spring (0.15 ± 0.12) due to elevated cold season NOx concentrations. Uncertainties in the HONO/NOx emission ratio introduced averaged deviations of −0.24 ± 0.09 to 0.11 ± 0.04 ppb h−1, with larger deviations during nighttime (20:00–8:00 LT, deviations between −0.31 ± 0.05 and 0.14 ± 0.02) than daytime (8:00–20:00 LT, deviations between −0.17 ± 0.05 and 0.08±0.02 ppb h−1). Overall, uncertainties in vehicle emission parameterization were among the most important contributors to Punknown estimation errors; however, they exerted insignificant influences on the daytime Punknown and the derivation of dew and soil HONO emissions (Figure 7). Note that the upper limit in the vehicle emission factor caused a larger deviation, which is however unrealistic, since such a high emission factor was scarcely reported. Additionally, the assumption that all observed NOx came from vehicle emissions was already responsible for an overestimation in Pvehicle, implying that the actual Pvehicle might be far lower than that estimated using the upper limit of k = 2.1%.
Phomo mostly contributed to prenoon Punknown during spring, while its peak shifted to later hours during autumn. Larger contributions to the HONO budget were observed during autumn (0.20 ± 0.41 ppb h−1) rather than in spring (0.09 ± 0.24 ppb h−1), also due to higher cold season NO levels. Estimation uncertainties in Phomo mainly come from OH radical concentrations parameterizations. Using parameterization schemes proposed based on measurements in Wangdu during summer and winter seasons, we yield OH concentrations within a reasonable variation range (<1.3 × 10⁷ and 3.1 × 10⁶ molec m−3 during spring and autumn, respectively). Assuming a 20% uncertainty in [OH] estimates, Punknown fluctuated on average within −0.17 ± 0.10 to 0.08 ± 0.05 ppb h−1 during daytime prenoon hours, while during the rest of the day its influence was negligible (−0.01 ± 0.03 to 0.003 ± 0.01 ppb h−1).
Pground also made relatively higher contributions to HONO in autumn (0.49 ± 0.49 ppb h−1) compared to spring (0.23 ± 0.38 ppb h−1), which is also reflected in the higher HONOc/NO2 ratios in Figure 3f. Pground mostly contributed to nighttime Punknown due to elevated S/V, despite photo-enhanced NO2 uptake assumptions that increased γg by an order of magnitude [69,70,71], exceeding contributions of Pvehicle during nighttime. In comparison, NO2 conversions on aerosol surfaces were negligible in both seasons (0.003 ± 0.003 ppb h−1). Thus, uncertainties in NO2 uptake coefficients were more important for the accuracy of Punknown estimations, especially during nighttime. The upper limit in γg resulted in averaged Punknown deviations of −0.18 ± 0.14 ppb h−1, with nighttime deviations similar to those resulting from the upper limit of the vehicle emission coefficient. The lower limit in γg resulted in 0.13 ± 0.10 ppb h−1 deviations, which exceeded the deviations introduced by the lower limit of the vehicle emission coefficient. It should be noted that NO2 uptake might be enhanced on wet surfaces, such as dew water, moist soil, wet aerosols, and fog water, however, there is currently no appropriate parameterization to describe such behavior. Thus, there might be overestimations in the nighttime Punknown. Since we mostly focus on daytime Punknown in the later section, this might not be of specific concern.
HONO formation from the photolysis of nitrate was higher during spring (0.17 ± 0.33 ppb h−1) and much lower in autumn (0.04 ± 0.06 ppb h−1), on the one hand, due to stronger solar radiation during spring and on the other hand due to decreases in nitrate mass concentrations from 2019 to 2021. Uncertainties in nitrate photolysis rate estimations of 20% brought on deviations in Punknown of ±0.12 ppb h−1 between 8:00 and 14:00, while during the rest of the day influences were very small.
Regardless of spring or autumn, photolysis was the main sink for HONO during the day, exerting a strong effect on daytime HONO, especially between 7:00 and 18:00 LT in spring and between 9:00 and 15:00 in autumn, during which the photolysis loss rate exceeded the sum of the aforementioned sources.
The unknown variation rate of HONO, Punknown, exhibited a clear diel variation with negative values during nighttime and strong positive ones during daytime, especially towards noontime. Daytime Punknown exceeded the HONO production rates of all accounted sources during noontime hours in spring and reached comparable levels to the total accounted PHONO in autumn. Nighttime Punknown was far greater than the deposition loss of HONO in both spring and autumn. This further emphasized the urgency and importance of unraveling these unknown sources for a better representation of HONO formation in atmospheric chemistry-related observational and modelling studies.
Overall, uncertainties in nighttime Punknown are greater than those during the daytime, which were mostly contributed by coefficients used in the calculation of vehicle emissions and NO2 conversion on the ground surface. Daytime uncertainties were mostly attributed to [OH] estimation and nitrate photolysis rate errors. Despite the existence of various uncertainties, Punknown was always maintained at high levels (with the average diurnal maximum ranging from 1.57 to 1.83 ppb h−1), indicating that missing sources of HONO indeed existed and that the discrepancy was not caused by uncertainties within the HONO budget calculation.
To maintain such high HONO concentrations at noontime, there must have been strong HONO emission sources or production pathways during the day with emission intensities of up to 7 ppb h−1, in addition to the sources that were already accounted for in the budget analysis. Microorganisms in soil widely exist that can produce NO2 as a byproduct during nitrification processes. Soil emissions of HONO were suggested to be especially pronounced within farmlands with both extensive vegetation coverage and large loads of fertilizer application [63,80], and would be promoted by higher atmospheric temperatures and lower RH, thus exhibiting noontime peaks. Aside from possible contributions from soil emissions, our previous study suggested that there were significant emissions from dew and guttation water during autumn, with rapid emissions within relatively short time windows mostly during prenoon hours. However, under extremely stable foggy conditions, the emission process can be extended until early afternoon hours [39]. Earlier studies have also suggested that HONO was also generated through liquid-phase chemical reactions aside from simple dissolution loss and evaporative emissions.
In spring, Punknown peaked around 9:00 and 13:30 LT, and was observed on particular days, possibly related to dew evaporation and soil emissions. In autumn, the average Punknown increased during the day and displayed small peaks between 10:30 and 13:30. It should be noted that the averaged result does not necessarily reflect the true diel variations of Punknown, especially during autumn, when peaks occurred during distinct hours of the day (from 11:00 to 13:00). This might have been due to the aforementioned distinct time windows of dew HONO emissions depending on atmospheric stability and evaporation conditions. Negative nighttime Punknown suggests that there were unaccounted sinks of HONO, which correspond well to its dissolution in near-surface liquid water, that were not considered in the budget study. This deposition loss was stronger during spring than autumn, possibly due to the dense coverage of grown wheat leaves and larger amounts of dew and guttation water. The daytime unknown source of HONO might have been commonly contributed by dew water evaporation and soil emissions, which have resulted in elevated Punknown during distinct time windows. Based on these premises, we try to separate these two emission sources and quantify their source strength in the next section.

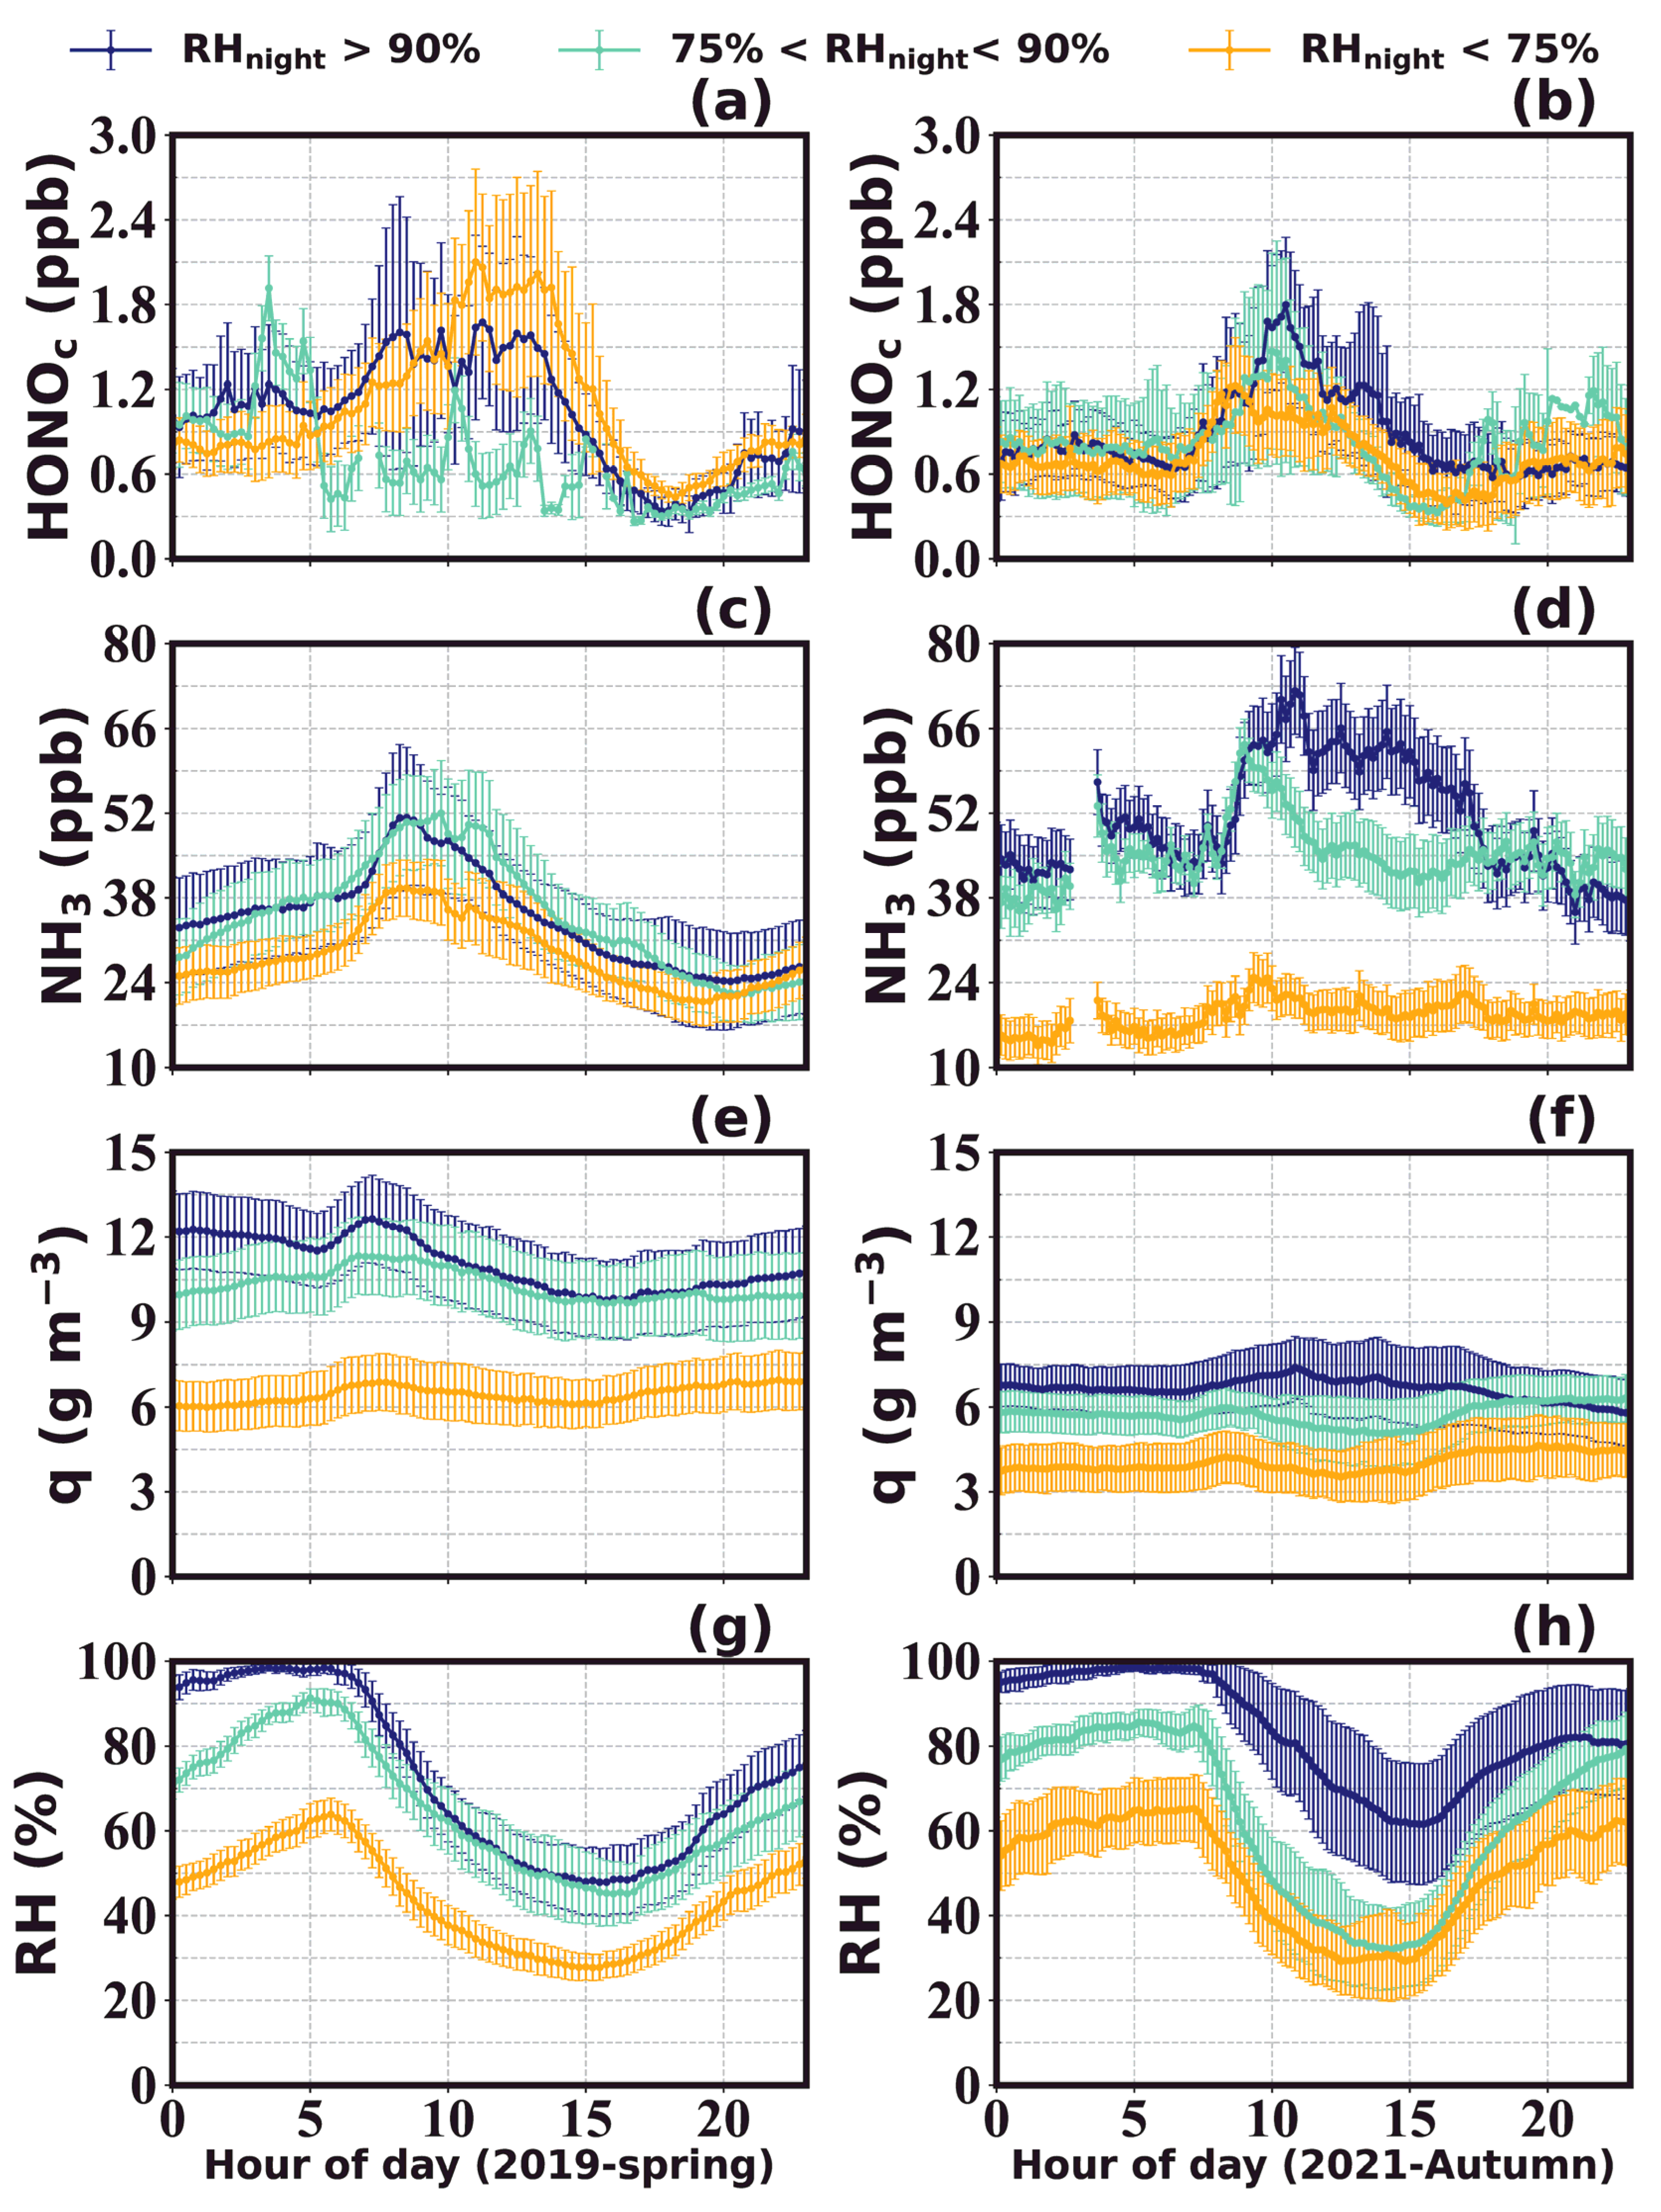
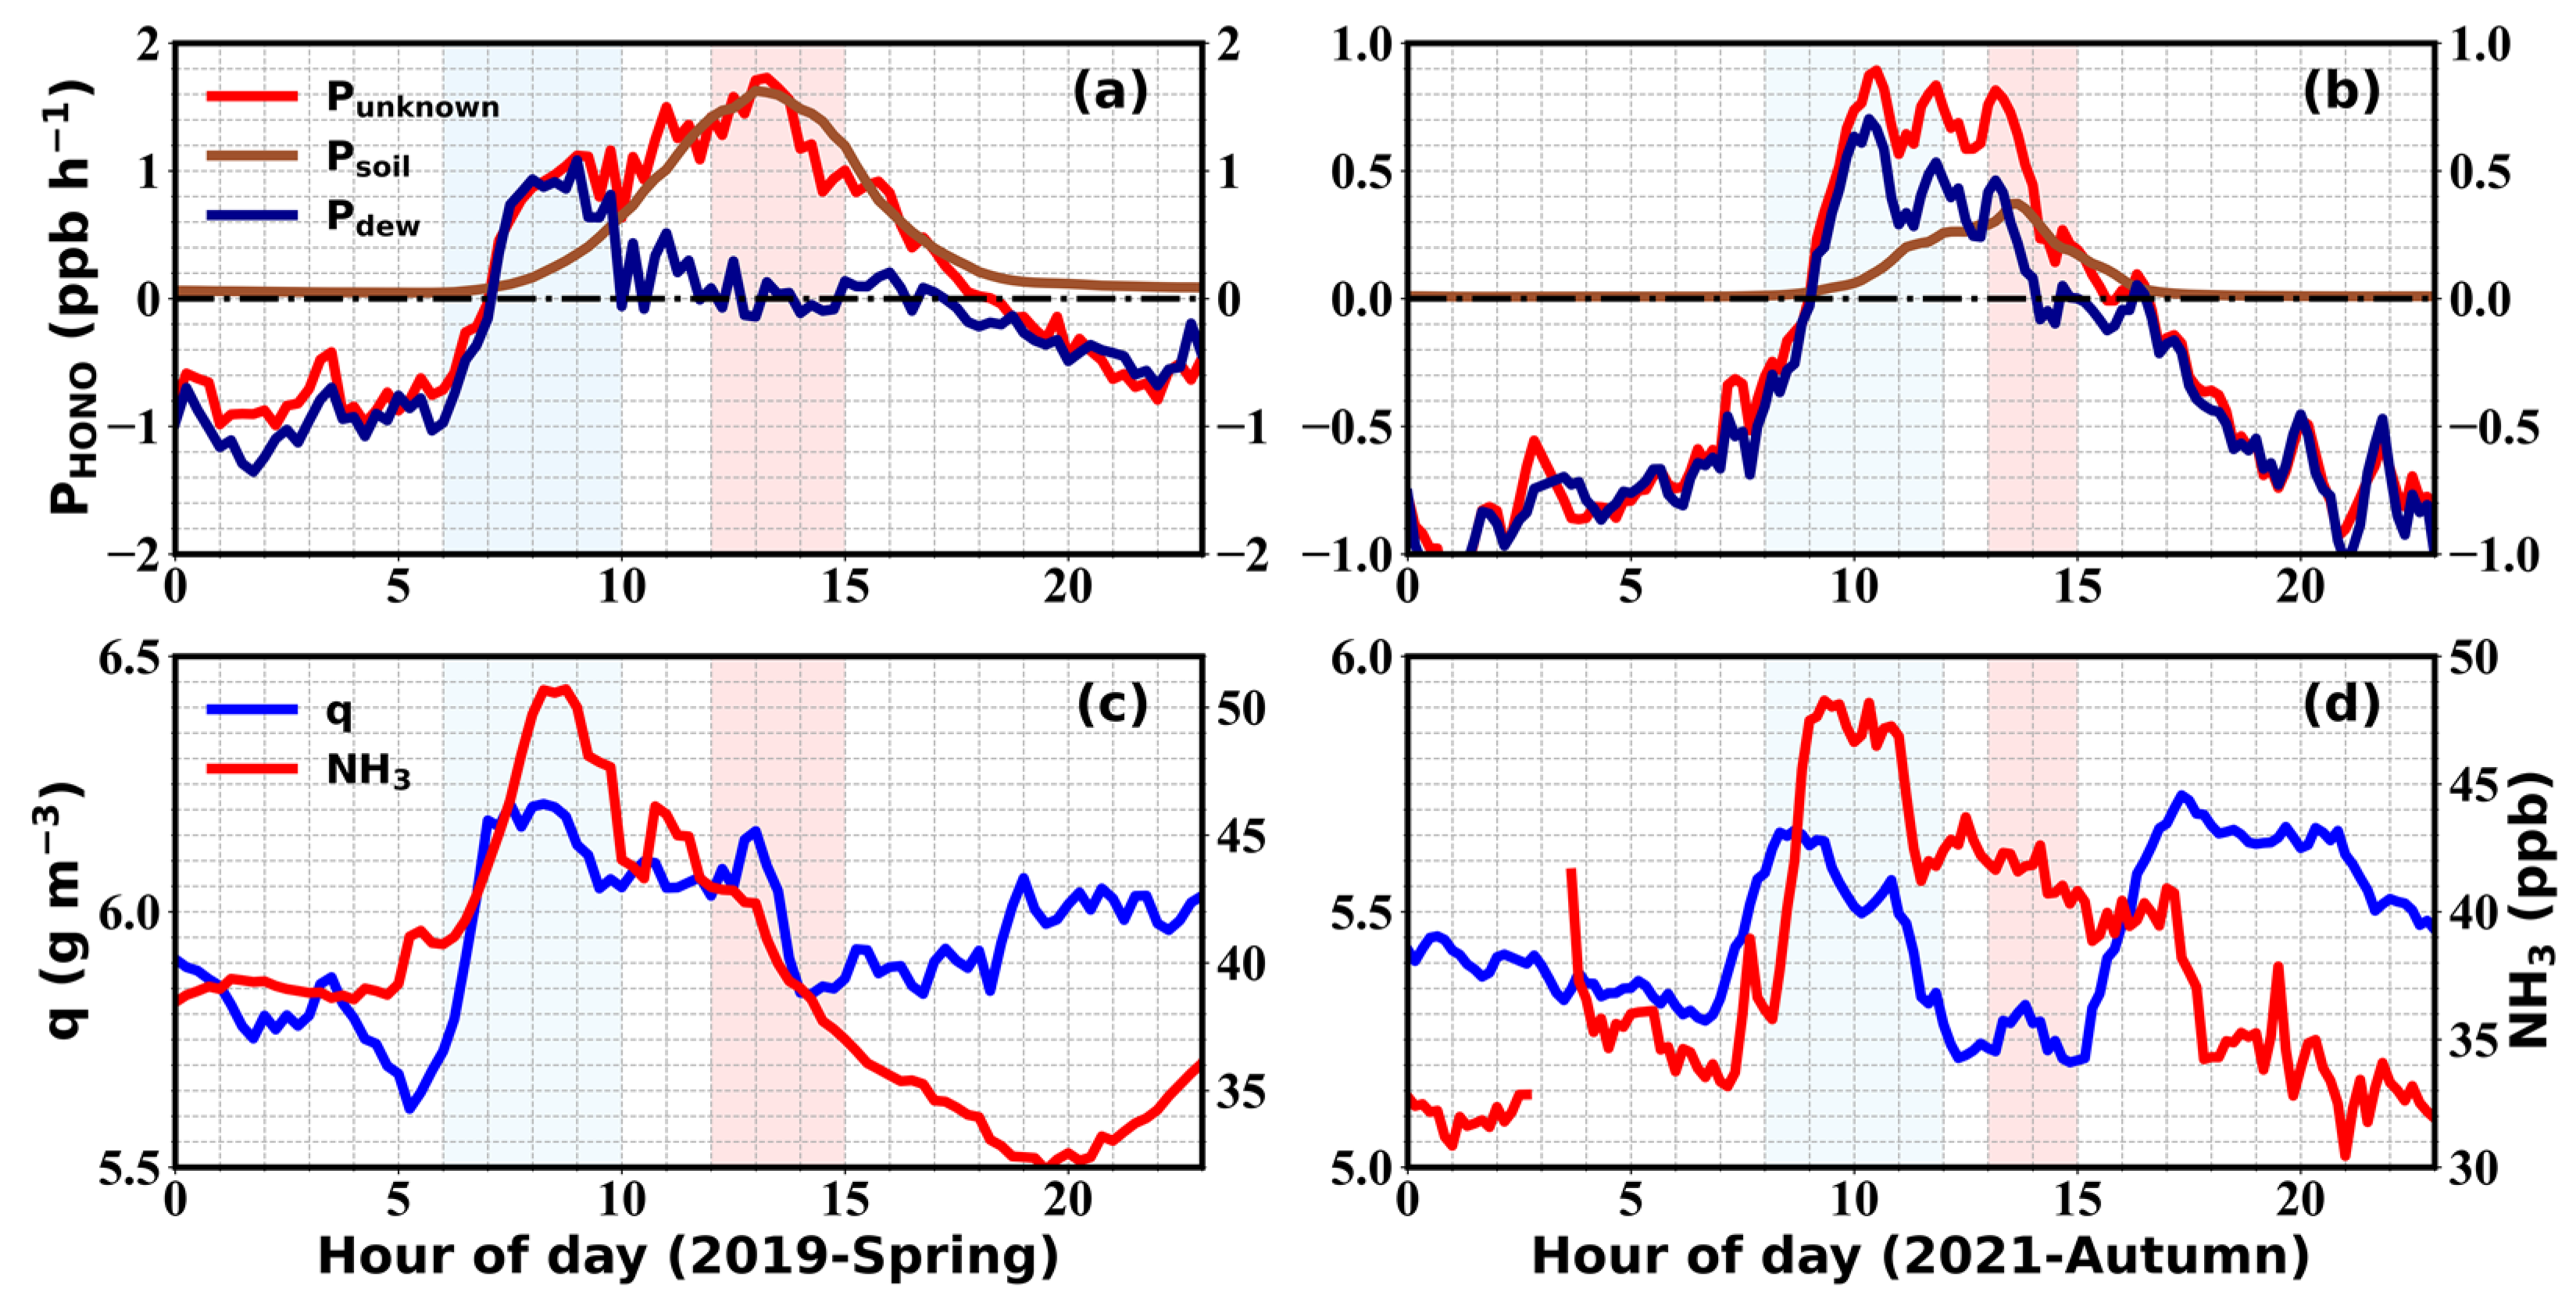
3.3. Soil Emissions of HONO and NH3

Using methods described in Section 2.3, diel variations of soil emissions (Psoil) were fitted using an afternoon time window, which was believed to be undisturbed by dew and guttation water emissions. Afterwards, evaporative emissions from dew water (Pdew) were deduced by subtracting soil emissions from Punknown.
From the springtime fitting results, Punknown and Pdew both increased after sunrise and reached a first peak of 1.12 ± 1.13 ppb h−1 at around 9:00 LT on average (Figure 8a), which was in high accordance with the drastic increase and peak in water vapor and NH3 (Figure 8c). Soil emission remained insignificant during this period due to relatively lower soil temperatures, however, with the increase in temperature after 9:00 LT, Psoil increased and Pdew drastically decreased under the rapid evaporation of dew drops and remained near zero until guttation started again (near sunset). As the soil temperature rose and reached its average peak at 13:00 LT, Psoil also reached its highest value of 1.63 ± 1.37 ppb h−1 throughout the day, which compensated for the missing noontime source. Before 7:00 and after 17:00, Punknown was dominated by the negative contribution of Pdew, whose role as a sink for HONO was not considered in the budget study. Altogether, springtime soil emissions impacted HONO throughout the day, with a broad peak and a maximum during noontime hours, while dew emissions were only present during prenoon hours before their complete evaporation, resulting in drastic morning time HONO emissions within relatively short time scales. Integrating over the entire day, Psoil generally contributed more strongly to daytime HONO than Pdew during springtime, both due to large loadings of nitrogen-containing fertilizer application and more favorable meteorological conditions (higher temperatures, stronger solar radiation, and lower RH) for soil emissions. During the spring observations, only on 7 April, dew emissions were comparable to soil emissions throughout the entire daytime period, which was due to minimal temperature increments and thus lower soil temperatures, as well as an extended dew evaporation and emission window on that day. Additionally, it should be noted that NH3 could also be emitted from fertilized soils, however, soil emissions had less impact on the overall diurnal variation of NH3 compared to dew emissions (Figure 8c).
During autumn, Pdew increased after 8:30 LT and reached a several peaks between 10:00 and 12:00 LT, whose peak heights (0.56 ± 1.13 to 0.90 ± 0.96 ppb h−1) were higher than that of Psoil (0.40 ± 0.89 ppb h−1) reached near 13:30 LT (Figure 8b). The average peak time corresponded well with those of q and NH3 (Figure 8d), with dew emissions also having more pronounced impacts than soil emissions on NH3 during autumn. Compared to the spring season, the autumn season displayed lower temperatures, leading to a ~1-h delay of the dew emission window. Tsoil also rose more slowly and exhibited a noticeably lower peak compared to the spring. As a result, there was an overlap in the emission windows of dew and soil emissions during noontime hours (11:00 to 13:00 LT) in autumn. Compared to spring, Pdew turned negative earlier during the afternoon and stayed negative until later hours in the morning during autumn due to earlier sunsets and later sunrises. Frequently occurring stagnant atmospheric conditions favored the formation and prolonged the lifetime of fogs, dewfall, and plant guttation in autumn, which all acted as sinks for atmospheric HONO.
The diurnal variations of the relative contribution of Pdew and Psoil to Punknown during spring and autumn are depicted in Figure 9. During spring, dew evaporation dominantly contributed to the unknown source of HONO from 6:00 to 9:00 LT in the morning, with contributions decreasing gradually from 88% to 70%. Soil emissions took over as dew completely evaporated and became dominant after 10:00 LT, with an average relative contribution of 88% from 10:00 to 15:00 LT. In autumn, dew emissions predominantly contributed to Punknown before 13:00, with relative contributions decreasing from 99% to 54% during the period from 6:00 to 13:30, which could be attributed to weaker radiative heating and thus lower air and soil temperatures that resulted in both weaker soil emissions and slower evaporations of dew and guttation water (Figure 8b). Therefore, it could be concluded that the sudden increases in HONO concentration and Punknown during the morning were positively correlated to dew water evaporation as denoted by simultaneous increments in q (Figure 8d), while the high afternoon levels were largely maintained by soil emissions. Due to the alternating contributions of these two sources throughout the day, the averaged HONO diurnal variation typically exhibited overlayered morning and afternoon peaks during daytime in the spring and autumn seasons.
Overall, it can be concluded that dew and soil emissions both had important impacts on the diel variations of HONO at GC, with dew emissions playing a major role before the afternoon in autumn and during early morning hours in the spring season. Soil emissions were more pronounced and recognizable during the spring season due to elevated temperatures and solar radiation, while those in autumn only contributed to HONO emissions within a short time window in the afternoon hours.

4. Conclusions and Implications

During the two observation periods, the concentration of HONO and NH3 was notably higher than those observed in urban areas, indicating the importance of rural areas to the emissions and background levels of HONO and NH3. This study provides a comprehensive analysis of the variations in HONO and NH3 during the spring and autumn seasons in rural areas of the NCP and explores the potential contributions of dew and soil emissions to their significant diurnal variations.
The large unknown daytime source and nighttime sink of HONO were manifested based on observations and theoretical calculations, with the unknown daytime source of HONO displaying distinct diel variations during spring and autumn. The results in this study revealed dew evaporation to be a significant process contributing to the morning peaks of unknown HONO sources, while soil emissions were the key drivers of high afternoon HONO levels. HONO is typically commonly deposited and accumulated in dew and liquid water droplets after sunset, reducing their dispersion in the atmosphere and resulting in their release in the morning during plant surface dew evaporation. After sunrise, rising soil temperatures also lead to the increase in soil emissions of evaporative trace gases including HONO.
The unknown daytime source and nighttime sink of HONO were both larger during spring than in autumn. Thus, the absolute contribution of dew and soil HONO emissions was also higher in spring. However, the relative contribution of dew emissions was higher during autumn, despite larger amounts of springtime dew water, which was mainly due to higher springtime soil temperatures. Nevertheless, dew emissios remained the dominant contributor to morning time HONO emissions in spring.
After sunrise, HONO is easily photolyzed and generates a substantial amount of OH radicals, initiating photochemical reactions leading to the formation of secondary air pollutants. During spring, HONO photolysis is the major contributor to OH production in the morning and during the late afternoon, while noontime contributions of 30~40% were also nonnegligible. During autumn, HONO photolysis contributed over 70% to OH production throughout sunlight hours, with morning contributions reaching over 90%. Thus, dew processes were determinative of atmospheric oxidation capacity during the morning and were responsible for the initiation of daytime photochemistry, while soil emissions further maintained P(OH)HONO at a high level, especially during spring.
The formation and evaporation of liquid water on plant surfaces is a frequently occurring process not only in agricultural ecosystems, but also in other vegetated environments, thus exerting far-reaching impacts on HONO over a large spatial scale. The consequences of these processes on atmospheric oxidizing capacity and the formation of secondary air pollutants have not been adequately recognized and emphasized in previous observational and modelling studies. This has led to a significant underestimation of daytime OH radical levels in the NCP, profoundly affecting the progression of daytime atmospheric chemical reactions and potentially causing significant discrepancies in secondary air pollution predictions. Future studies need to thoroughly investigate the influencing factors of dew and soil emissions and establish their relations to HONO emission rates, in order to form parameterizations for regional and global models.

Author Contributions

Conceptualization, W.X. (Wanyun Xu); Formal analysis, J.Z. and W.X. (Wanyun Xu); data curation, Y.K., W.X. (Weiqi Xu), X.X., C.L., G.Z. (Gen Zhang), H.Z., S.R. and G.Z. (Guangsheng Zhou); writing—original draft preparation, J.Z. and W.X. (Wanyun Xu); writing—review and editing, Y.K. and X.X.; funding acquisition, W.X. (Wanyun Xu). All authors have read and agreed to the published version of the manuscript.

Funding

This research was funded by the National Natural Science Foundation of China (42375117 and 42175127), Natural Science Foundation of Beijing Municipality (8222078), Basic Research Fund of CAMS (2023Z012), S&T development fund of CAMS (2024KJ026).

Institutional Review Board Statement

Not applicable.

Informed Consent Statement

Not applicable.

Data Availability Statement

Data available on request from the corresponding author.

Conflicts of Interest

The authors declare no conflicts of interest.

References

  1. Finlayson-Pitts, B.J.; Pitts, J.N., Jr. Tropospheric air pollution: Ozone, airborne toxics, polycyclic aromatic hydrocarbons, and particles. Science 1997, 276, 1045–1052. [Google Scholar] [CrossRef]
  2. Kleffmann, J.; Gavriloaiei, T.; Hofzumahaus, A.; Holland, F.; Koppmann, R.; Rupp, L.; Schlosser, E.; Siese, M.; Wahner, A. Daytime formation of nitrous acid: A major source of OH radicals in a forest. Geophys. Res. Lett. 2005, 32, L05818. [Google Scholar] [CrossRef]
  3. Levy, H., 2nd. Normal atmosphere: Large radical and formaldehyde concentrations predicted. Science 1971, 173, 141–143. [Google Scholar] [CrossRef]
  4. Lu, K.; Guo, S.; Tan, Z.; Wang, H.; Shang, D.; Liu, Y.; Li, X.; Wu, Z.; Hu, M.; Zhang, Y. Exploring atmospheric free-radical chemistry in China: The self-cleansing capacity and the formation of secondary air pollution. Natl. Sci. Rev. 2019, 6, 579–594. [Google Scholar] [CrossRef]
  5. Zheng, J.; Shi, X.; Ma, Y.; Ren, X.; Jabbour, H.; Diao, Y.; Wang, W.; Ge, Y.; Zhang, Y.; Zhu, W. Contribution of nitrous acid to the atmospheric oxidation capacity in an industrial zone in the Yangtze River Delta region of China. Atmos. Chem. Phys. 2020, 20, 5457–5475. [Google Scholar] [CrossRef]
  6. Zhang, X.; Tong, S.; Jia, C.; Zhang, W.; Li, J.; Wang, W.; Sun, Y.; Wang, X.; Wang, L.; Ji, D.; et al. The Levels and Sources of Nitrous Acid (HONO) in Winter of Beijing and Sanmenxia. J. Geophys. Res. Atmos. 2022, 127, e2021JD036278. [Google Scholar] [CrossRef]
  7. Xu, W.; Takeuchi, M.; Chen, C.; Qiu, Y.; Xie, C.; Xu, W.; Ma, N.; Worsnop, D.R.; Ng, N.L.; Sun, Y. Estimation of particulate organic nitrates from thermodenuder–aerosol mass spectrometer measurements in the North China Plain. Atmos. Meas. Tech. 2021, 14, 3693–3705. [Google Scholar] [CrossRef]
  8. Yang, Y.; Li, X.; Zu, K.; Lian, C.; Chen, S.; Dong, H.; Feng, M.; Liu, H.; Liu, J.; Lu, K.; et al. Elucidating the effect of HONO on O3 pollution by a case study in southwest China. Sci. Total Environ. 2021, 756, 144127. [Google Scholar] [CrossRef] [PubMed]
  9. Zhang, G.; Hu, R.; Xie, P.; Lou, S.; Wang, F.; Wang, Y.; Qin, M.; Li, X.; Liu, X.; Wang, Y.; et al. Observation and simulation of HOx radicals in an urban area in Shanghai, China. Sci. Total Environ. 2022, 810, 152275. [Google Scholar] [CrossRef]
  10. Bao, F.; Li, M.; Zhang, Y.; Chen, C.; Zhao, J. Photochemical Aging of Beijing Urban PM2.5: HONO Production. Environ. Sci. Technol. 2018, 52, 6309–6316. [Google Scholar] [CrossRef]
  11. Klosterköther, A.; Kurtenbach, R.; Wiesen, P.; Kleffmann, J. Determination of the emission indices for NO, NO2, HONO, HCHO, CO, and particles emitted from candles. Indoor Air 2021, 31, 116–127. [Google Scholar] [CrossRef]
  12. Kramer, L.J.; Crilley, L.R.; Adams, T.J.; Ball, S.M.; Pope, F.D.; Bloss, W.J. Nitrous acid (HONO) emissions under real-world driving conditions from vehicles in a UK road tunnel. Atmos. Chem. Phys. 2020, 20, 5231–5248. [Google Scholar] [CrossRef]
  13. Liu, Y.; Lu, K.; Ma, Y.; Yang, X.; Zhang, W.; Wu, Y.; Peng, J.; Shuai, S.; Hu, M.; Zhang, Y. Direct emission of nitrous acid (HONO) from gasoline cars in China determined by vehicle chassis dynamometer experiments. Atmos. Environ. 2017, 169, 89–96. [Google Scholar] [CrossRef]
  14. Palm, B.B.; Peng, Q.; Hall, S.R.; Ullmann, K.; Campos, T.L.; Weinheimer, A.; Montzka, D.; Tyndall, G.; Permar, W.; Hu, L.; et al. Spatially Resolved Photochemistry Impacts Emissions Estimates in Fresh Wildfire Plumes. Geophys. Res. Lett. 2021, 48, e2021GL095443. [Google Scholar] [CrossRef]
  15. Vogel, B.; Vogel, H.; Kleffmann, J.; Kurtenbach, R. Measured and simulated vertical profiles of nitrous acid—Part II. Model simulations and indications for a photolytic source. Atmos. Environ. 2003, 37, 2957–2966. [Google Scholar] [CrossRef]
  16. Xue, C.; Ye, C.; Zhang, C.; Catoire, V.; Liu, P.; Gu, R.; Zhang, J.; Ma, Z.; Zhao, X.; Zhang, W.; et al. Evidence for Strong HONO Emission from Fertilized Agricultural Fields and its Remarkable Impact on Regional O3 Pollution in the Summer North China Plain. ACS Earth Space Chem. 2021, 5, 340–347. [Google Scholar] [CrossRef]
  17. Zhou, X.; Zhang, N.; TerAvest, M.; Tang, D.; Hou, J.; Bertman, S.; Alaghmand, M.; Shepson, P.B.; Carroll, M.A.; Griffith, S.; et al. Nitric acid photolysis on forest canopy surface as a source for tropospheric nitrous acid. Nat. Geosci. 2011, 4, 440–443. [Google Scholar] [CrossRef]
  18. Chen, D.; Zhou, L.; Liu, S.; Lian, C.; Wang, W.; Liu, H.; Li, C.; Liu, Y.; Luo, L.; Xiao, K.; et al. Primary sources of HONO vary during the daytime: Insights based on a field campaign. Sci. Total Environ. 2023, 903, 166605. [Google Scholar] [CrossRef]
  19. Li, Y.; An, J.; Min, M.; Zhang, W.; Wang, F.; Xie, P. Impacts of HONO sources on the air quality in Beijing, Tianjin and Hebei Province of China. Atmos. Environ. 2011, 45, 4735–4744. [Google Scholar] [CrossRef]
  20. Song, Y.; Zhang, Y.; Xue, C.; Liu, P.; He, X.; Li, X.; Mu, Y. The seasonal variations and potential sources of nitrous acid (HONO) in the rural North China Plain. Environ. Pollut. 2022, 311, 119967. [Google Scholar] [CrossRef]
  21. Yang, Q.; Su, H.; Li, X.; Cheng, Y.; Lu, K.; Cheng, P.; Gu, J.; Guo, S.; Hu, M.; Zeng, L.; et al. Daytime HONO formation in the suburban area of the megacity Beijing, China. Sci. China Chem. 2014, 57, 1032–1042. [Google Scholar] [CrossRef]
  22. Ali, M.A.; Huang, Z.; Bilal, M.; Assiri, M.E.; Mhawish, A.; Nichol, J.E.; de Leeuw, G.; Almazroui, M.; Wang, Y.; Alsubhi, Y. Long-term PM2.5 pollution over China: Identification of PM2.5 pollution hotspots and source contributions. Sci. Total Environ. 2023, 893, 164871. [Google Scholar] [CrossRef]
  23. Chen, J.; Zhao, C.S.; Ma, N.; Liu, P.F.; Göbel, T.; Hallbauer, E.; Deng, Z.Z.; Ran, L.; Xu, W.Y.; Liang, Z.; et al. A parameterization of low visibilities for hazy days in the North China Plain. Atmos. Chem. Phys. 2012, 12, 4935–4950. [Google Scholar] [CrossRef]
  24. Shen, L.; Liu, J.; Zhao, T.; Xu, X.; Han, H.; Wang, H.; Shu, Z. Atmospheric transport drives regional interactions of ozone pollution in China. Sci. Total Environ. 2022, 830, 154634. [Google Scholar] [CrossRef]
  25. Liu, B. Analysis of the Vegetation Cover Change and the Relative Role of Its Influencing Factors in North China. J. Nat. Resour. 2015, 30, 12–23. [Google Scholar]
  26. Liu, X.; Zhang, Y.; Han, W.; Tang, A.; Shen, J.; Cui, Z.; Vitousek, P.; Erisman, J.W.; Goulding, K.; Christie, P.; et al. Enhanced nitrogen deposition over China. Nature 2013, 494, 459–462. [Google Scholar] [CrossRef]
  27. Wang, S.; Zhang, X.; Wang, C.; Zhang, X.; Reis, S.; Xu, J.; Gu, B. A high-resolution map of reactive nitrogen inputs to China. Sci. Data 2020, 7, 379. [Google Scholar] [CrossRef]
  28. Cui, L.; Li, R.; Zhang, Y.; Meng, Y.; Fu, H.; Chen, J. An observational study of nitrous acid (HONO) in Shanghai, China: The aerosol impact on HONO formation during the haze episodes. Sci. Total Environ. 2018, 630, 1057–1070. [Google Scholar] [CrossRef]
  29. Jiang, H.; Bao, F.; Wang, J.; Chen, J.; Zhu, Y.; Huang, D.; Chen, C.; Zhao, J. Direct Formation of Electronic Excited NO2 Contributes to the High Yield of HONO during Photosensitized Renoxification. Environ. Sci. Technol. 2023, 57, 11144–11151. [Google Scholar] [CrossRef]
  30. Monge, M.E.; D’Anna, B.; Mazri, L.; Giroir-Fendler, A.; Ammann, M.; Donaldson, D.J.; George, C. Light changes the atmospheric reactivity of soot. Proc. Natl. Acad. Sci. USA 2010, 107, 6605–6609. [Google Scholar] [CrossRef]
  31. Ricker, H.M.; Leonardi, A.; Navea, J.G. Reduction and Photoreduction of NO2 in Humic Acid Films as a Source of HONO, ClNO, N2O, NOx, and Organic Nitrogen. ACS Earth Space Chem. 2022, 6, 3066–3077. [Google Scholar] [CrossRef]
  32. Feng, J.; Ren, E.; Hu, M.; Fu, Q.; Duan, Y.; Huang, C.; Zhao, Y.; Wang, S. Budget of atmospheric nitrous acid (HONO) during the haze and clean periods in Shanghai: Importance of heterogeneous reactions. Sci. Total Environ. 2023, 900, 165717. [Google Scholar] [CrossRef]
  33. Gu, R.; Shen, H.; Xue, L.; Wang, T.; Gao, J.; Li, H.; Liang, Y.; Xia, M.; Yu, C.; Liu, Y.; et al. Investigating the sources of atmospheric nitrous acid (HONO) in the megacity of Beijing, China. Sci. Total Environ. 2022, 812, 152270. [Google Scholar] [CrossRef]
  34. Huang, R.-J.; Yang, L.; Cao, J.; Wang, Q.; Tie, X.; Ho, K.-F.; Shen, Z.; Zhang, R.; Li, G.; Zhu, C.; et al. Concentration and sources of atmospheric nitrous acid (HONO) at an urban site in Western China. Sci. Total Environ. 2017, 593–594, 165–172. [Google Scholar] [CrossRef]
  35. Li, X.; Brauers, T.; Häseler, R.; Bohn, B.; Fuchs, H.; Hofzumahaus, A.; Holland, F.; Lou, S.; Lu, K.D.; Rohrer, F.; et al. Exploring the atmospheric chemistry of nitrous acid (HONO) at a rural site in Southern China. Atmos. Chem. Phys. 2012, 12, 1497–1513. [Google Scholar] [CrossRef]
  36. Xue, C.; Zhang, C.; Ye, C.; Liu, P.; Catoire, V.; Krysztofiak, G.; Chen, H.; Ren, Y.; Zhao, X.; Wang, J.; et al. HONO Budget and Its Role in Nitrate Formation in the Rural North China Plain. Environ. Sci. Technol. 2020, 54, 11048–11057. [Google Scholar] [CrossRef]
  37. Oswald, R.; Behrendt, T.; Ermel, M.; Wu, D.; Su, H.; Cheng, Y.; Breuninger, C.; Moravek, A.; Mougin, E.; Delon, C.; et al. HONO emissions from soil bacteria as a major source of atmospheric reactive nitrogen. Science 2013, 341, 1233–1235. [Google Scholar] [CrossRef]
  38. Wu, D.; Horn, M.A.; Behrendt, T.; Müller, S.; Li, J.; Cole, J.A.; Xie, B.; Ju, X.; Li, G.; Ermel, M.; et al. Soil HONO emissions at high moisture content are driven by microbial nitrate reduction to nitrite: Tackling the HONO puzzle. ISME J. 2019, 13, 1688–1699. [Google Scholar] [CrossRef]
  39. Xu, W.; Kuang, Y.; Liu, C.; Ma, Z.; Zhang, X.; Zhai, M.; Zhang, G.; Xu, W.; Cheng, H.; Liu, Y.; et al. Severe photochemical pollution formation associated with strong HONO emissions from dew and guttation evaporation. Sci. Total Environ. 2024, 913, 169309. [Google Scholar] [CrossRef]
  40. Rubio, M.A.; Lissi, E.; Villena, G. Nitrite in rain and dew in Santiago city, Chile. Its possible impact on the early morning start of the photochemical smog. Atmos. Environ. 2002, 36, 293–297. [Google Scholar] [CrossRef]
  41. He, Y.; Zhou, X.; Hou, J.; Gao, H.; Bertman, S.B. Importance of dew in controlling the air-surface exchange of HONO in rural forested environments. Geophys. Res. Lett. 2006, 33, L02813. [Google Scholar] [CrossRef]
  42. Xu, Y.; Zhu, H.; Tang, J.; Lin, Y. Chemical Compositions of Dew and Scavenging of Particles in Changchun, China. Adv. Meteorol. 2015, 2015, 104048. [Google Scholar] [CrossRef]
  43. Ren, Y.; Stieger, B.; Spindler, G.; Grosselin, B.; Mellouki, A.; Tuch, T.; Wiedensohler, A.; Herrmann, H. Role of the dew water on the ground surface in HONO distribution: A case measurement in Melpitz. Atmos. Chem. Phys. 2020, 20, 13069–13089. [Google Scholar] [CrossRef]
  44. Richards, K. Observation and simulation of dew in rural and urban environments. Prog. Phys. Geogr. Earth Environ. 2004, 28, 76–94. [Google Scholar] [CrossRef]
  45. Hughes, R.N.; Brimblecombe, P. Dew and guttation: Formation and environmental significance. Agric. For. Meteorol. 1994, 67, 173–190. [Google Scholar] [CrossRef]
  46. Kuang, Y.; Xu, W.; Lin, W.; Meng, Z.; Zhao, H.; Ren, S.; Zhang, G.; Liang, L.; Xu, X. Explosive morning growth phenomena of NH3 on the North China Plain: Causes and potential impacts on aerosol formation. Environ. Pollut. 2020, 257, 113621. [Google Scholar] [CrossRef]
  47. Bian, Y.X.; Zhao, C.S.; Ma, N.; Chen, J.; Xu, W.Y. A study of aerosol liquid water content based on hygroscopicity measurements at high relative humidity in the North China Plain. Atmos. Chem. Phys. 2014, 14, 6417–6426. [Google Scholar] [CrossRef]
  48. Xu, W.; Kuang, Y.; Zhao, C.; Tao, J.; Zhao, G.; Bian, Y.; Yang, W.; Yu, Y.; Shen, C.; Liang, L.; et al. NH3-promoted hydrolysis of NO2 induces explosive growth in HONO. Atmos. Chem. Phys. 2019, 19, 10557–10570. [Google Scholar] [CrossRef]
  49. Kuang, Y.; He, Y.; Xu, W.; Yuan, B.; Zhang, G.; Ma, Z.; Wu, C.; Wang, C.; Wang, S.; Zhang, S.; et al. Photochemical Aqueous-Phase Reactions Induce Rapid Daytime Formation of Oxygenated Organic Aerosol on the North China Plain. Environ. Sci. Technol. 2020, 54, 3849–3860. [Google Scholar] [CrossRef]
  50. Xu, W.; Kuang, Y.; Liang, L.; He, Y.; Cheng, H.; Bian, Y.; Tao, J.; Zhang, G.; Zhao, P.; Ma, N.; et al. Dust-Dominated Coarse Particles as a Medium for Rapid Secondary Organic and Inorganic Aerosol Formation in Highly Polluted Air. Environ. Sci. Technol. 2020, 54, 15710–15721. [Google Scholar] [CrossRef]
  51. Kuang, Y.; Xu, W.; Tao, J.; Luo, B.; Liu, L.; Xu, H.; Xu, W.; Xue, B.; Zhai, M.; Liu, P.; et al. Divergent Impacts of Biomass Burning and Fossil Fuel Combustion Aerosols on Fog-Cloud Microphysics and Chemistry: Novel Insights From Advanced Aerosol-Fog Sampling. Geophys. Res. Lett. 2024, 51, e2023GL107147. [Google Scholar] [CrossRef]
  52. Kuang, Y.; Tao, J.; Xu, W.; Yu, Y.; Zhao, G.; Shen, C.; Bian, Y.; Zhao, C. Calculating ambient aerosol surface area concentrations using aerosol light scattering enhancement measurements. Atmos. Environ. 2019, 216, 116919. [Google Scholar] [CrossRef]
  53. Kuang, Y.; Zhao, C.; Tao, J.; Bian, Y.; Ma, N.; Zhao, G. A novel method for deriving the aerosol hygroscopicity parameter based only on measurements from a humidified nephelometer system. Atmos. Chem. Phys. 2017, 17, 6651–6662. [Google Scholar] [CrossRef]
  54. Huang, R.-J.; Zhang, Y.; Bozzetti, C.; Ho, K.-F.; Cao, J.-J.; Han, Y.; Daellenbach, K.R.; Slowik, J.G.; Platt, S.M.; Canonaco, F.; et al. High secondary aerosol contribution to particulate pollution during haze events in China. Nature 2014, 514, 218–222. [Google Scholar] [CrossRef] [PubMed]
  55. Xue, B.; Kuang, Y.; Xu, W.; Zhao, P. Joint increase of aerosol scattering efficiency and aerosol hygroscopicity aggravate visibility impairment in the North China Plain. Sci. Total Environ. 2022, 839, 156279. [Google Scholar] [CrossRef] [PubMed]
  56. Trinh, H.T.; Imanishi, K.; Morikawa, T.; Hagino, H.; Takenaka, N. Gaseous nitrous acid (HONO) and nitrogen oxides (NOx) emission from gasoline and diesel vehicles under real-world driving test cycles. J. Air Waste Manag. Assoc. 2017, 67, 412–420. [Google Scholar] [CrossRef] [PubMed]
  57. Li, S.; Song, W.; Zhan, H.; Zhang, Y.; Zhang, X.; Li, W.; Tong, S.; Pei, C.; Wang, Y.; Chen, Y.; et al. Contribution of Vehicle Emission and NO2 Surface Conversion to Nitrous Acid (HONO) in Urban Environments: Implications from Tests in a Tunnel. Environ. Sci. Technol. 2021, 55, 15616–15624. [Google Scholar] [CrossRef]
  58. Spataro, F.; Ianniello, A.; Esposito, G.; Allegrini, I.; Zhu, T.; Hu, M. Occurrence of atmospheric nitrous acid in the urban area of Beijing (China). Sci. Total Environ. 2013, 447, 210–224. [Google Scholar] [CrossRef]
  59. Zhang, S.; Li, G.; Ma, N.; He, Y.; Zhu, S.; Pan, X.; Dong, W.; Zhang, Y.; Luo, Q.; Ditas, J.; et al. Exploring HONO formation and its role in driving secondary pollutants formation during winter in the North China Plain. J. Environ. Sci. 2023, 132, 83–97. [Google Scholar] [CrossRef]
  60. Meng, F.; Qin, M.; Fang, W.; Duan, J.; Tang, K.; Zhang, H.; Shao, D.; Liao, Z.; Feng, Y.; Huang, Y.; et al. Measurement of HONO flux using the aerodynamic gradient method over an agricultural field in the Huaihe River Basin, China. J. Environ. Sci. 2022, 114, 297–307. [Google Scholar] [CrossRef]
  61. Xue, C.; Ye, C.; Zhang, Y.; Ma, Z.; Liu, P.; Zhang, C.; Zhao, X.; Liu, J.; Mu, Y. Development and application of a twin open-top chambers method to measure soil HONO emission in the North China Plain. Sci. Total Environ. 2019, 659, 621–631. [Google Scholar] [CrossRef] [PubMed]
  62. Bao, F.; Cheng, Y.; Kuhn, U.; Li, G.; Wang, W.; Kratz, A.M.; Weber, J.; Weber, B.; Pöschl, U.; Su, H. Key Role of Equilibrium HONO Concentration over Soil in Quantifying Soil–Atmosphere HONO Fluxes. Environ. Sci. Technol. 2022, 56, 2204–2212. [Google Scholar] [CrossRef]
  63. Song, Y.; Xue, C.; Zhang, Y.; Liu, P.; Bao, F.; Li, X.; Mu, Y. Measurement report: Exchange fluxes of HONO over agricultural fields in the North China Plain. Atmos. Chem. Phys. 2023, 23, 15733–15747. [Google Scholar] [CrossRef]
  64. Tan, Z.; Fuchs, H.; Lu, K.; Hofzumahaus, A.; Bohn, B.; Broch, S.; Dong, H.; Gomm, S.; Häseler, R.; He, L.; et al. Radical chemistry at a rural site (Wangdu) in the North China Plain: Observation and model calculations of OH, HO2 and RO2 radicals. Atmos. Chem. Phys. 2017, 17, 663–690. [Google Scholar] [CrossRef]
  65. Ma, X.; Tan, Z.; Lu, K.; Yang, X.; Liu, Y.; Li, S.; Li, X.; Chen, S.; Novelli, A.; Cho, C.; et al. Winter photochemistry in Beijing: Observation and model simulation of OH and HO2 radicals at an urban site. Sci. Total Environ. 2019, 685, 85–95. [Google Scholar] [CrossRef] [PubMed]
  66. VandenBoer, T.C.; Brown, S.S.; Murphy, J.G.; Keene, W.C.; Young, C.J.; Pszenny, A.A.P.; Kim, S.; Warneke, C.; de Gouw, J.A.; Maben, J.R.; et al. Understanding the role of the ground surface in HONO vertical structure: High resolution vertical profiles during NACHTT-11. J. Geophys. Res. Atmos. 2013, 118, 10155–10171. [Google Scholar] [CrossRef]
  67. Li, M.; Su, H.; Li, G.; Ma, N.; Pöschl, U.; Cheng, Y. Relative importance of gas uptake on aerosol and ground surfaces characterized by equivalent uptake coefficients. Atmos. Chem. Phys. 2019, 19, 10981–11011. [Google Scholar] [CrossRef]
  68. Yang, W.; Han, C.; Zhang, T.; Tang, N.; Yang, H.; Xue, X. Heterogeneous photochemical uptake of NO2 on the soil surface as an important ground-level HONO source. Environ. Pollut. 2021, 271, 116289. [Google Scholar] [CrossRef] [PubMed]
  69. George, C.; Strekowski, R.S.; Kleffmann, J.; Stemmler, K.; Ammann, M. Photoenhanced uptake of gaseous NO2 on solid organic compounds: A photochemical source of HONO? Faraday Discuss. 2005, 130, 195–210. [Google Scholar] [CrossRef]
  70. Liu, J.; Li, S.; Mekic, M.; Jiang, H.; Zhou, W.; Loisel, G.; Song, W.; Wang, X.; Gligorovski, S. Photoenhanced Uptake of NO2 and HONO Formation on Real Urban Grime. Environ. Sci. Technol. Lett. 2019, 6, 413–417. [Google Scholar]
  71. Fu, X.; Wang, T.; Zhang, L.; Li, Q.; Wang, Z.; Xia, M.; Yun, H.; Wang, W.; Yu, C.; Yue, D.; et al. The significant contribution of HONO to secondary pollutants during a severe winter pollution event in southern China. Atmos. Chem. Phys. 2019, 19, 1–14. [Google Scholar] [CrossRef]
  72. Liu, J.; Liu, Z.; Ma, Z.; Yang, S.; Yao, D.; Zhao, S.; Hu, B.; Tang, G.; Sun, J.; Cheng, M.; et al. Detailed budget analysis of HONO in Beijing, China: Implication on atmosphere oxidation capacity in polluted megacity. Atmos. Environ. 2020, 244, 117957. [Google Scholar] [CrossRef]
  73. Gong, Y.; Cheng, P.; Yang, W. Aloft HONO measurement and its impact on atmospheric oxidation at the Canton Tower. Acta Sci. Circumstantiae 2023, 44, 330–342. [Google Scholar] [CrossRef]
  74. Michoud, V.; Colomb, A.; Borbon, A.; Miet, K.; Beekmann, M.; Camredon, M.; Aumont, B.; Perrier, S.; Zapf, P.; Siour, G.; et al. Study of the unknown HONO daytime source at a European suburban site during the MEGAPOLI summer and winter field campaigns. Atmos. Chem. Phys. 2014, 14, 2805–2822. [Google Scholar] [CrossRef]
  75. Tsai, C.; Spolaor, M.; Colosimo, S.F.; Pikelnaya, O.; Cheung, R.; Williams, E.; Gilman, J.B.; Lerner, B.M.; Zamora, R.J.; Warneke, C.; et al. Nitrous acid formation in a snow-free wintertime polluted rural area. Atmos. Chem. Phys. 2018, 18, 1977–1996. [Google Scholar] [CrossRef]
  76. Shon, Z.H.; Lee, G.; Song, S.K.; Lee, M.; Han, J.; Lee, D. Characteristics of reactive nitrogen compounds and other relevant trace gases in the atmosphere at urban and rural areas of Korea during May–June, 2004. J. Atmos. Chem. 2007, 58, 203–218. [Google Scholar] [CrossRef]
  77. Gu, R.; Zheng, P.; Chen, T.; Dong, C.; Wang, Y.n.; Liu, Y.; Liu, Y.; Luo, Y.; Han, G.; Wang, X.; et al. Atmospheric nitrous acid (HONO) at a rural coastal site in North China: Seasonal variations and effects of biomass burning. Atmos. Environ. 2020, 229, 117429. [Google Scholar] [CrossRef]
  78. Song, M.; Zhao, X.; Liu, P.; Mu, J.; He, G.; Zhang, C.; Tong, S.; Xue, C.; Zhao, X.; Ge, M.; et al. Atmospheric NOx oxidation as major sources for nitrous acid (HONO). NPJ Clim. Atmos. Sci. 2023, 6, 30. [Google Scholar] [CrossRef]
  79. Nie, W.; Yan, C.; Huang, D.D.; Wang, Z.; Liu, Y.; Qiao, X.; Guo, Y.; Tian, L.; Zheng, P.; Xu, Z.; et al. Secondary organic aerosol formed by condensing anthropogenic vapours over China’s megacities. Nat. Geosci. 2022, 15, 255–261. [Google Scholar] [CrossRef]
  80. Wang, Y.; Fu, X.; Wu, D.; Wang, M.; Lu, K.; Mu, Y.; Liu, Z.; Zhang, Y.; Wang, T. Agricultural Fertilization Aggravates Air Pollution by Stimulating Soil Nitrous Acid Emissions at High Soil Moisture. Environ. Sci. Technol. 2021, 55, 14556–14566. [Google Scholar] [CrossRef]
Figure 1. Measurements of (a) HONO and NH3, (b) soil temperature (Tsoil) and RH, (c) O3 and NO2, (d) HONO/NO2 and NO, (e) wind speed, direction (denoted by colors), and specific humidity (q) at GC Station in spring 2019. Grey shadings mark out nighttime periods (18:00 to 8:00) and red shadings denote periods with HONO morning peak occurrences.
Toxics 12 00331 g001
Figure 2. Measurements of (a) HONO and NH3, (b) soil temperature (Tsoil) and RH, (c) O3 and NO2, (d) HONO/NO2 and NO, (e) wind speed, direction (denoted by colors), and specific humidity (q) at GC Station in autumn 2021. Grey shadings mark out nighttime periods (18:00 to 8:00) and red shadings denote periods with HONO morning peak occurrences.
Toxics 12 00331 g002
Figure 3. Diurnal variations in (a) HONOc (solid line) and HONO (dashed line), (b) NH3, (c) Tsoil, (d) q, (e) dew temperature (Td), and (f) HONOc/NO2 observed in GC during spring 2019 (red) and autumn 2021 (blue).
Toxics 12 00331 g003
Figure 4. (a,d) Daytime OH production rates (P(OH)) of HONO and O3, (b,e) relative contributions of HONO and O3 to the total P(OH), and (c,f) photolysis rates of HONO and O3 during (ac) spring and (df) autumn.
Toxics 12 00331 g004
Figure 5. The average diel variations of HONOc (a,b), NH3 (c,d) and q (e,f) in spring 2019 and autumn 2021 under different relative humidity conditions (g,h). Dark blue for high relative humidity conditions (RHnight > 90%), pale green for medium relative humidity conditions (75% < RHnight ≤ 90%), orange for low relative humidity conditions (RHnight < 75%).
Toxics 12 00331 g005
Figure 6. Averaged diurnal variation in HONO budgets during (a) spring 2019 and (b) autumn 2021. Gray, green, red and pink bars represent vehicle HONO emissions, heterogeneous transformation of NO2 to HONO on aerosol and ground surfaces, and HONO production during nitrate photolysis, respectively, while orange and yellow bars show dry deposition and photolysis removal of HONO.
Toxics 12 00331 g006
Figure 7. The unknown variation rate of HONO (Punknown) under different parameter assumptions. The solid black line represents the base case. The orange dashed and dotted lines represent Punknown calculated using k = 0.18% and 2.1% as the lower and upper limits of vehicle emission coefficients obtained in previous tunnel experiments [13,56], respectively. The green dashed and dotted lines represent calculation results adopting γa = 1 × 10⁻⁹ and 7 × 10⁻⁶ as the lower and upper limits of aerosol surface uptake coefficients according to laboratory measurements summarized in Li, Su, Li, Ma, Pöschl and Cheng [67], respectively. The turquoise dashed and dotted lines represent those applying γg = 2 × 10⁻⁶ and 1.6 × 10⁻⁵ as the lower and upper estimates for ground surface uptake coefficients of NO2 following the field measurement results of VandenBoer, et al. [66], respectively. The blue dashed and dotted lines represent the results obtained by adjusting the nitrate photolysis coefficient down or up by 20%, respectively. The red dashed and dotted lines represent the results obtained by multiplying [OH] by 2 and 0.5, respectively.
Toxics 12 00331 g007
Figure 8. Diel profiles of Punknown (red line) with calculated soil (brown line) and dew (dark blue line) HONO emissions during (a) spring and (b) autumn, as well as the corresponding changes in q and NH3 during (c) spring and (d) autumn. The light blue shading denotes the time range from 6:00 to 10:00 LT, corresponding to the peak of Pdew, while the red shading denotes the time range from 12:00 to 15:00 LT, corresponding to the peak of Psoil.
Toxics 12 00331 g008
Figure 9. The relative contribution of Pdew (blue) and Psoil (brown) to P u n k n o w n .
Toxics 12 00331 g009
Table 1. Comparison between ground-based atmospheric HONO measurements at rural or suburban sites.
LocationPeriodHONO (ppbv)Reference
Paris/FranceJuly 20090.01–0.50[74]
Melpitz/GermanyApril 20180.25 ± 0.11[43]
Utah/AmericaJanuary–February 20120–0.27[75]
Seoul/KoreaJune 20040.6 ± 0.8[76]
Dongying/ChinaJune–July 20170.17 ± 0.20[77]
GC/ChinaOctober 20166.3 ± 4.6[48]
Wangdu/ChinaJune 20171.1 ± 1.2[78]
Wangdu/ChinaDecember 20171.8 ± 1.4[20]
GC/ChinaApril 20190.7 ± 0.4This study
Wangdu/ChinaJune–August 20200.7 ± 0.5[20]
Wangdu/ChinaSeptember 20200.8 ± 0.6[20]
GC/ChinaNovember 20210.7 ± 0.4This study
Disclaimer/Publisher’s Note: The statements, opinions and data contained in all publications are solely those of the individual author(s) and contributor(s) and not of MDPI and/or the editor(s). MDPI and/or the editor(s) disclaim responsibility for any injury to people or property resulting from any ideas, methods, instructions or products referred to in the content.

