
Development of an Improved Thiosulfate-Utilizing Denitrifying Bacteria-Based Ecotoxicity Test with High Detection Sensitivity and Reproducibility


Abstract
1. Introduction
2. Materials and Methods
2.1. TUDB Strain and Cultivation
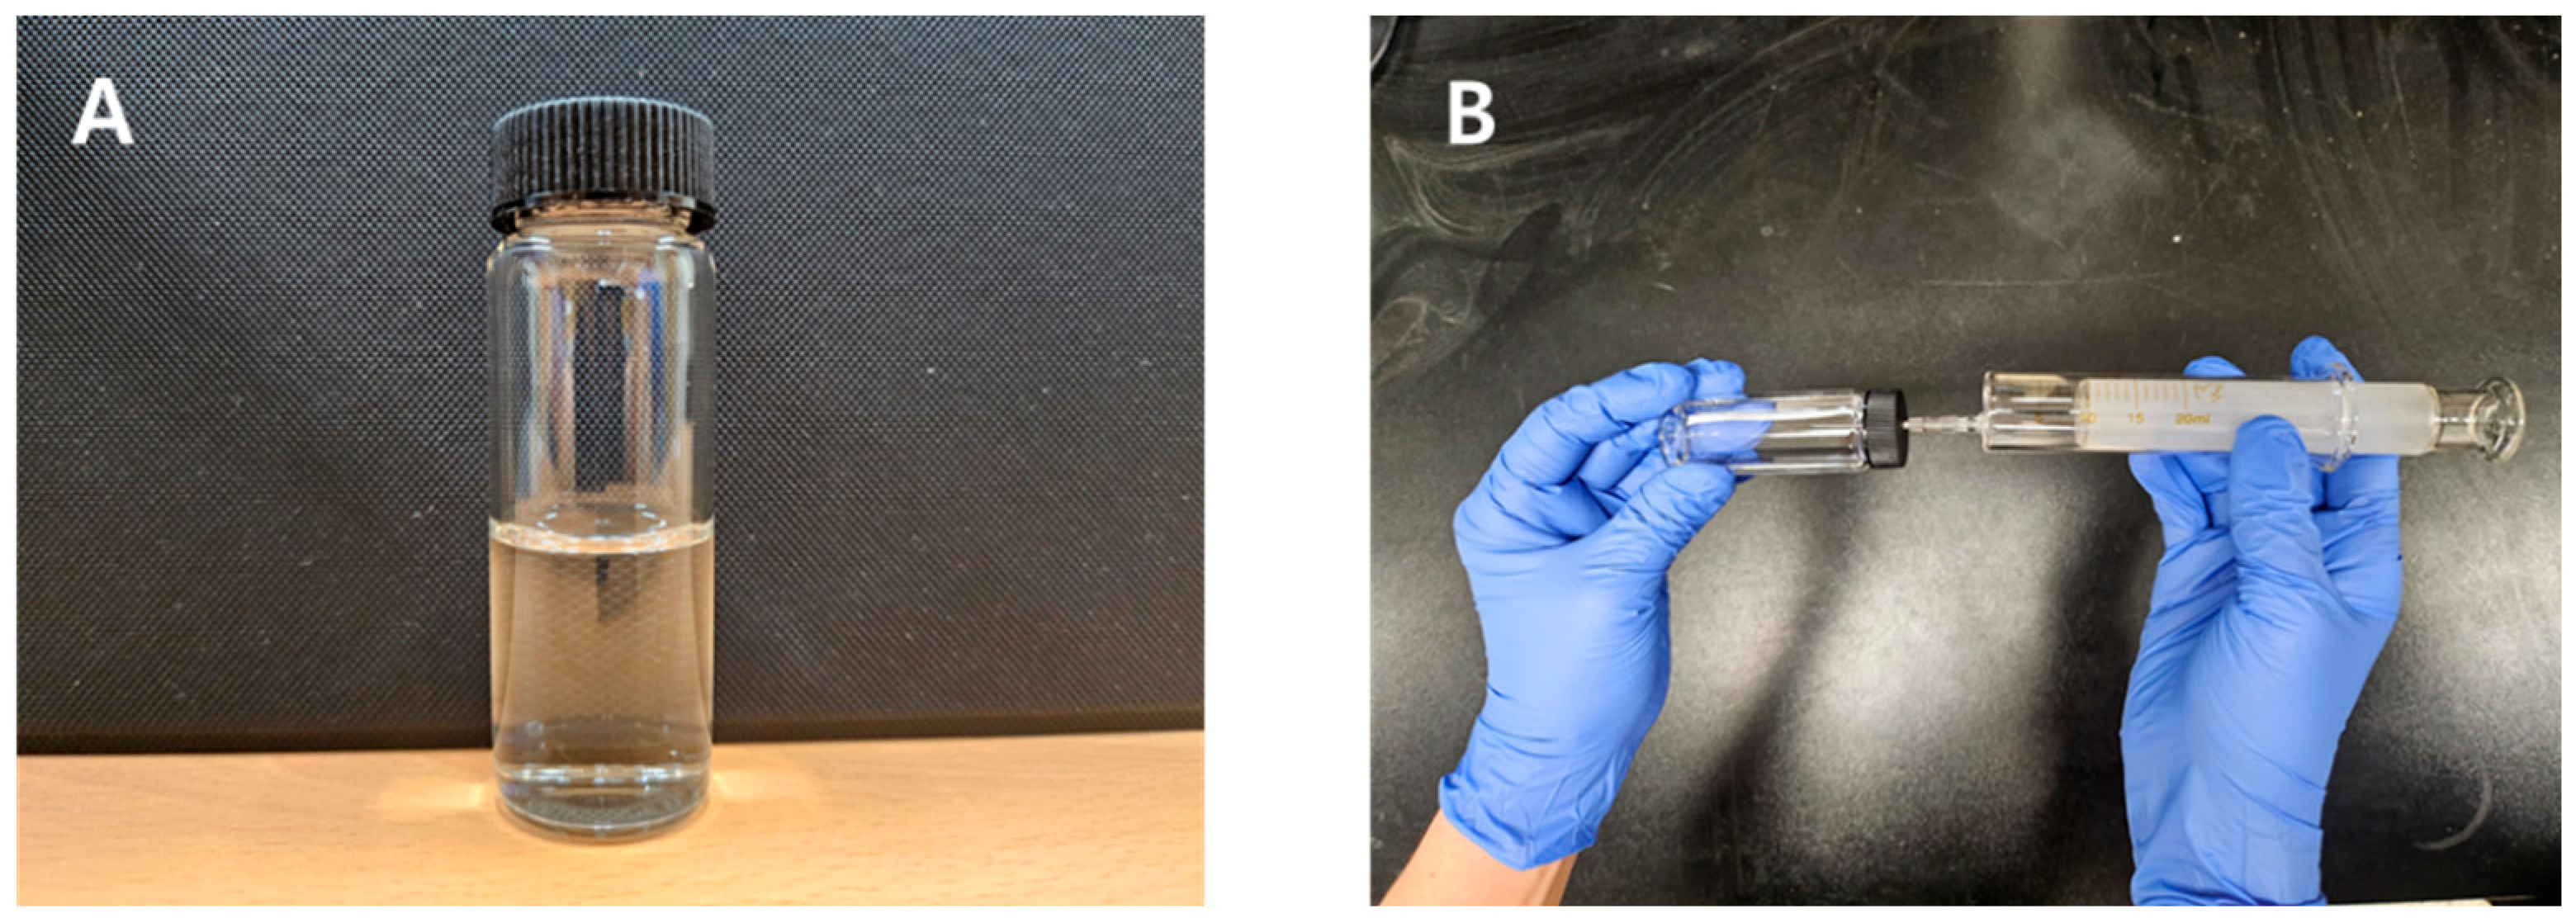
2.2. TUDB Toxicity Kit Tests
2.3. Syringe Method for Measuring Gas Production from TUDB Toxicity Kit
2.4. Chemicals and Laboratory Analyses
3. Results
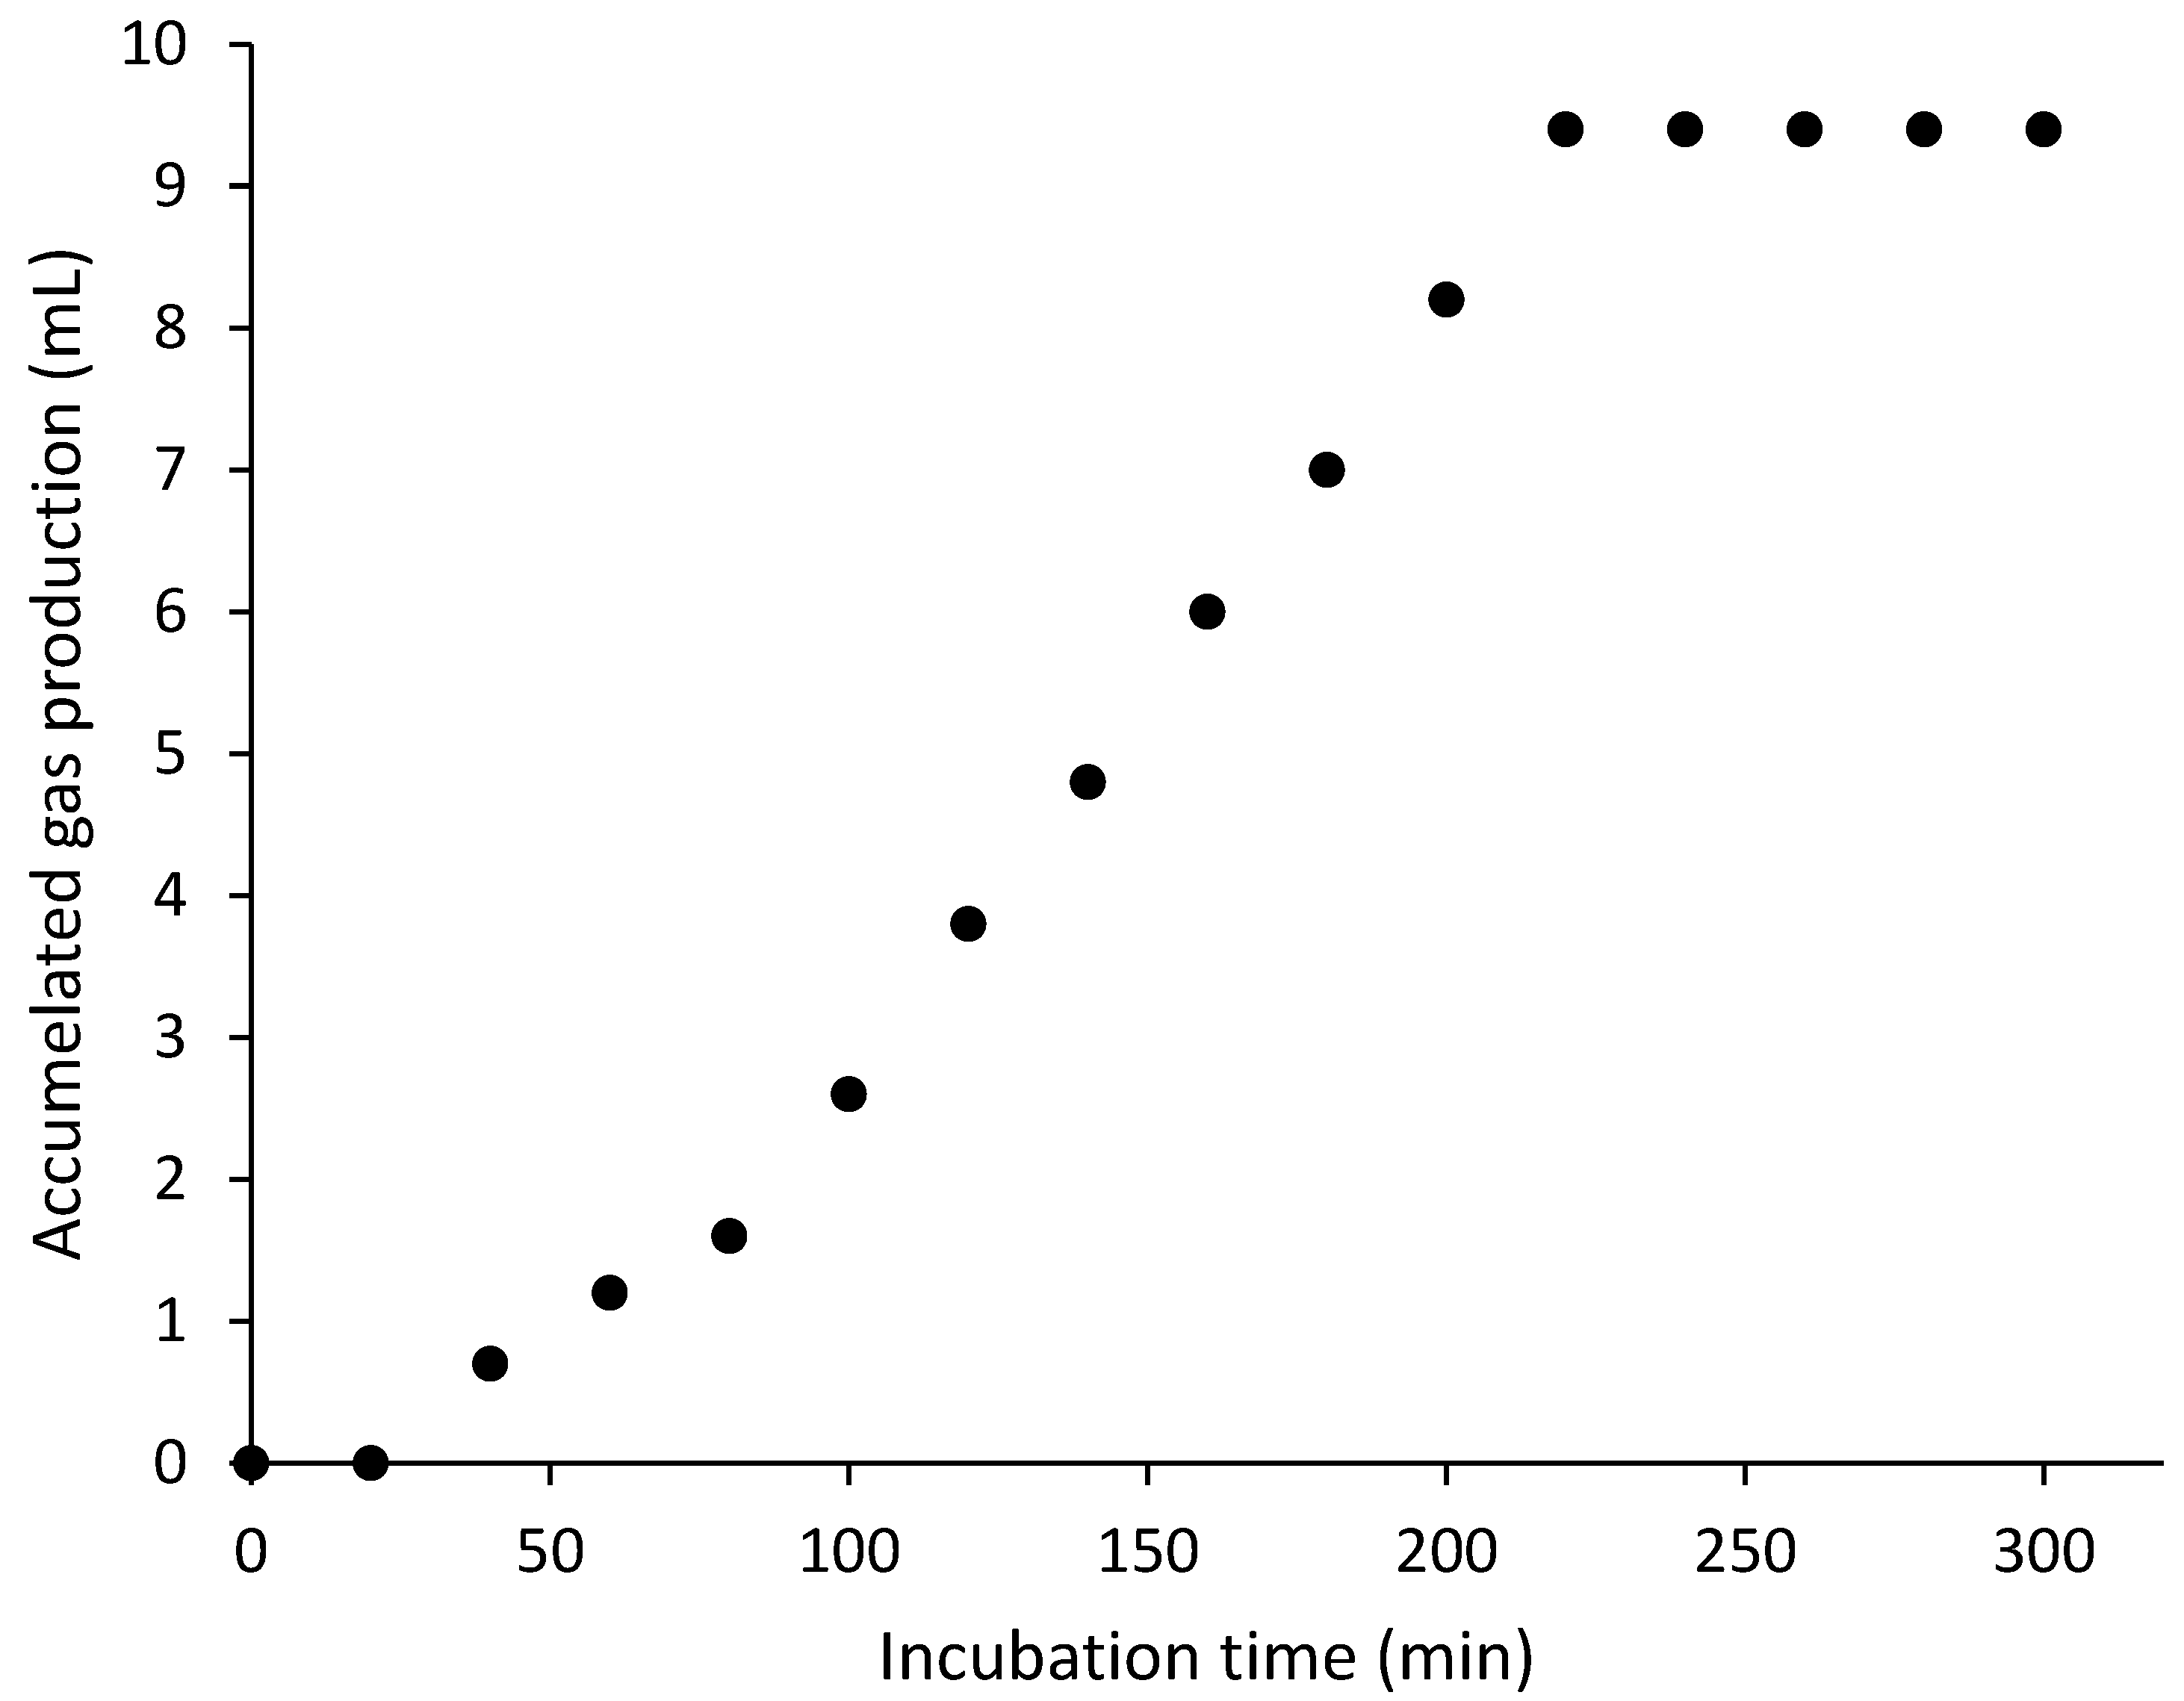
3.1. Control Tests
3.2. Optimization Tests
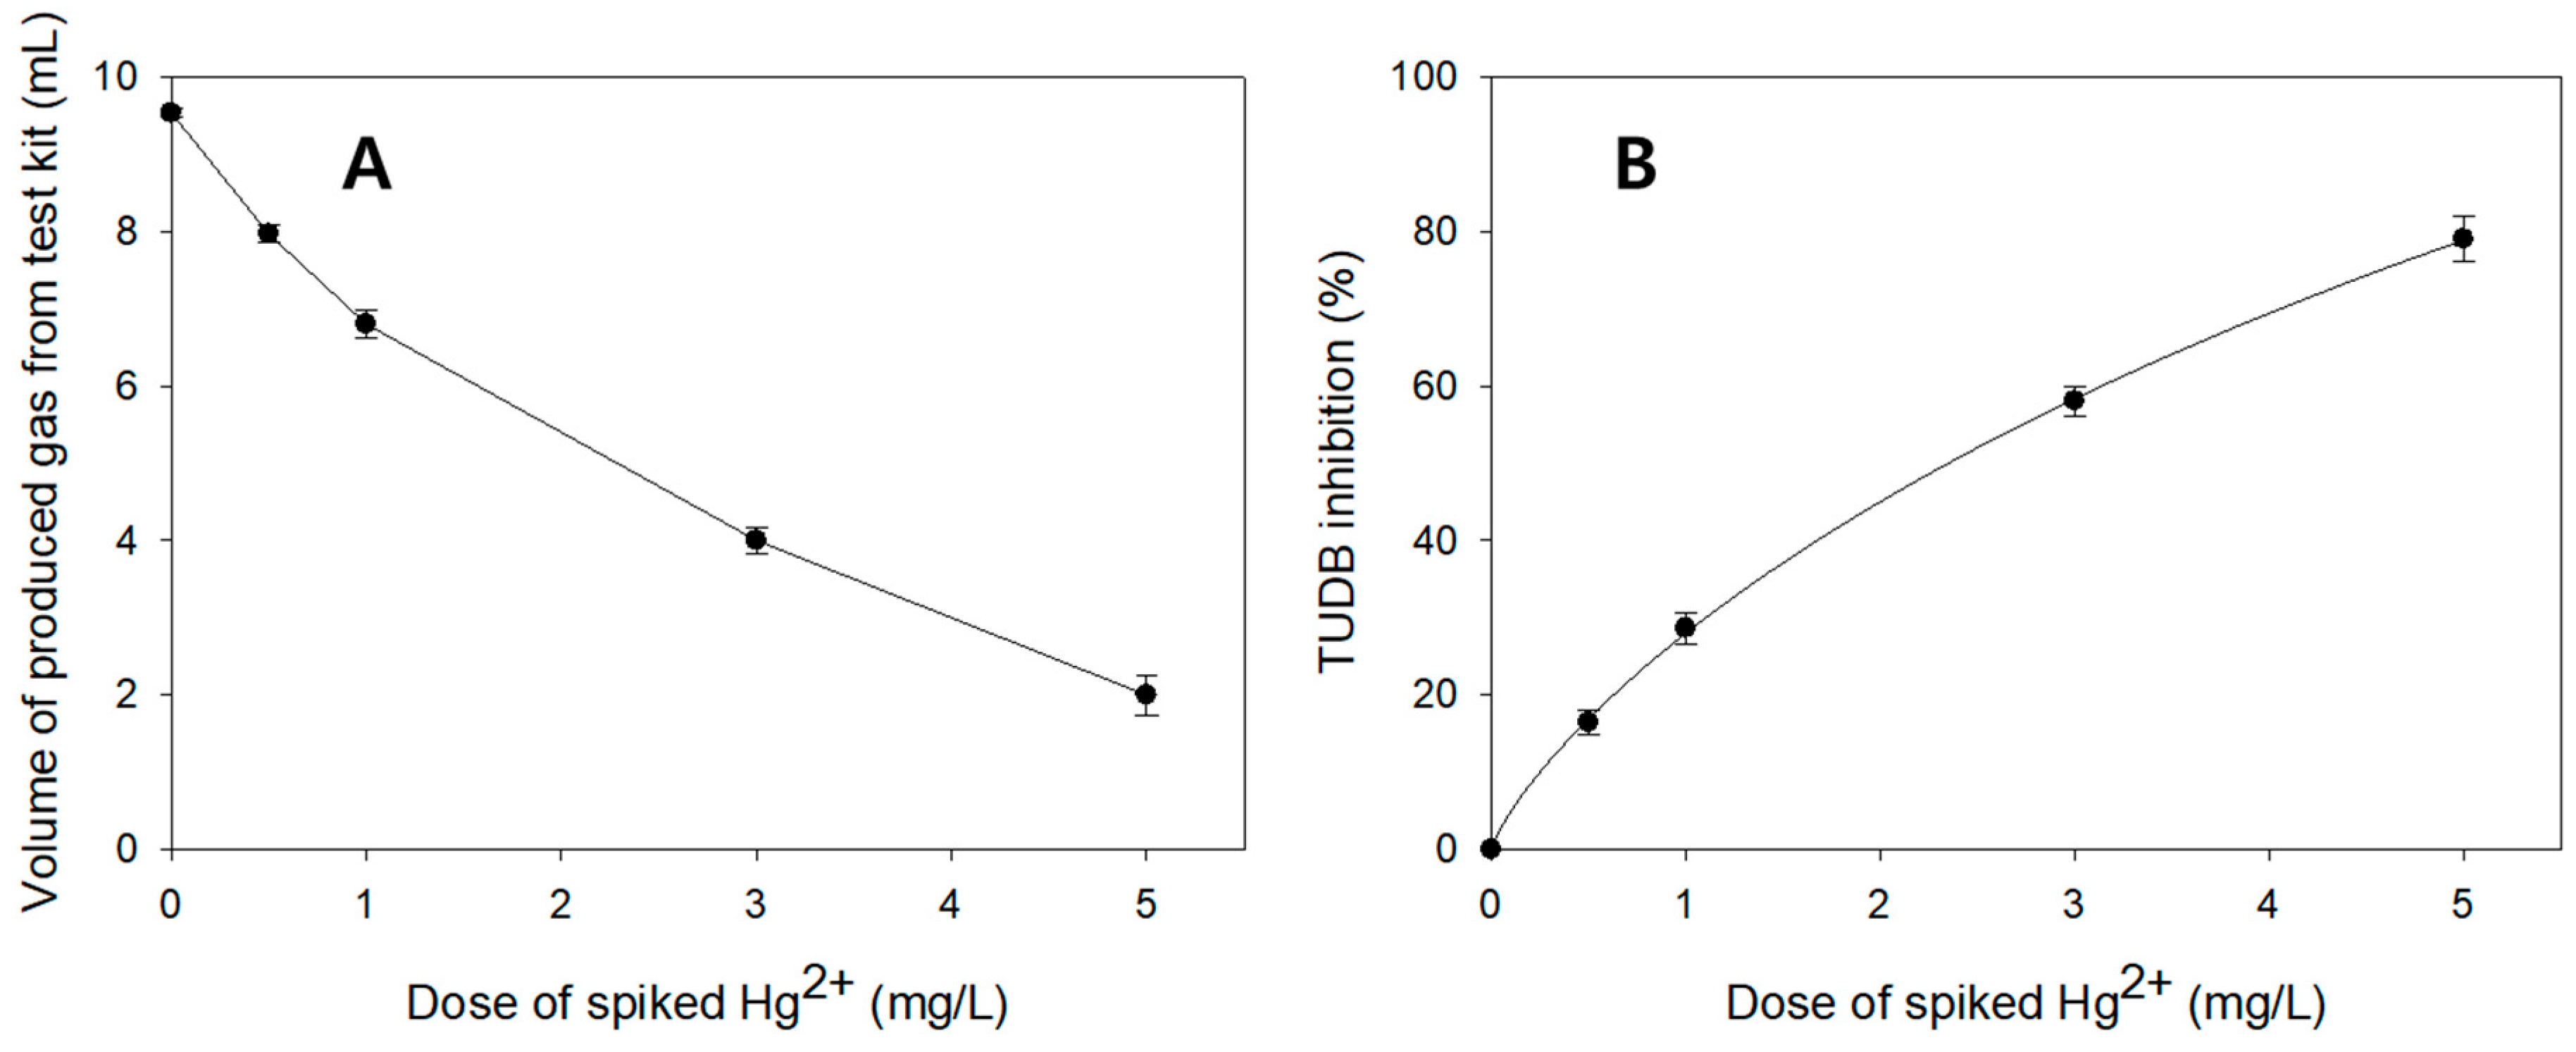
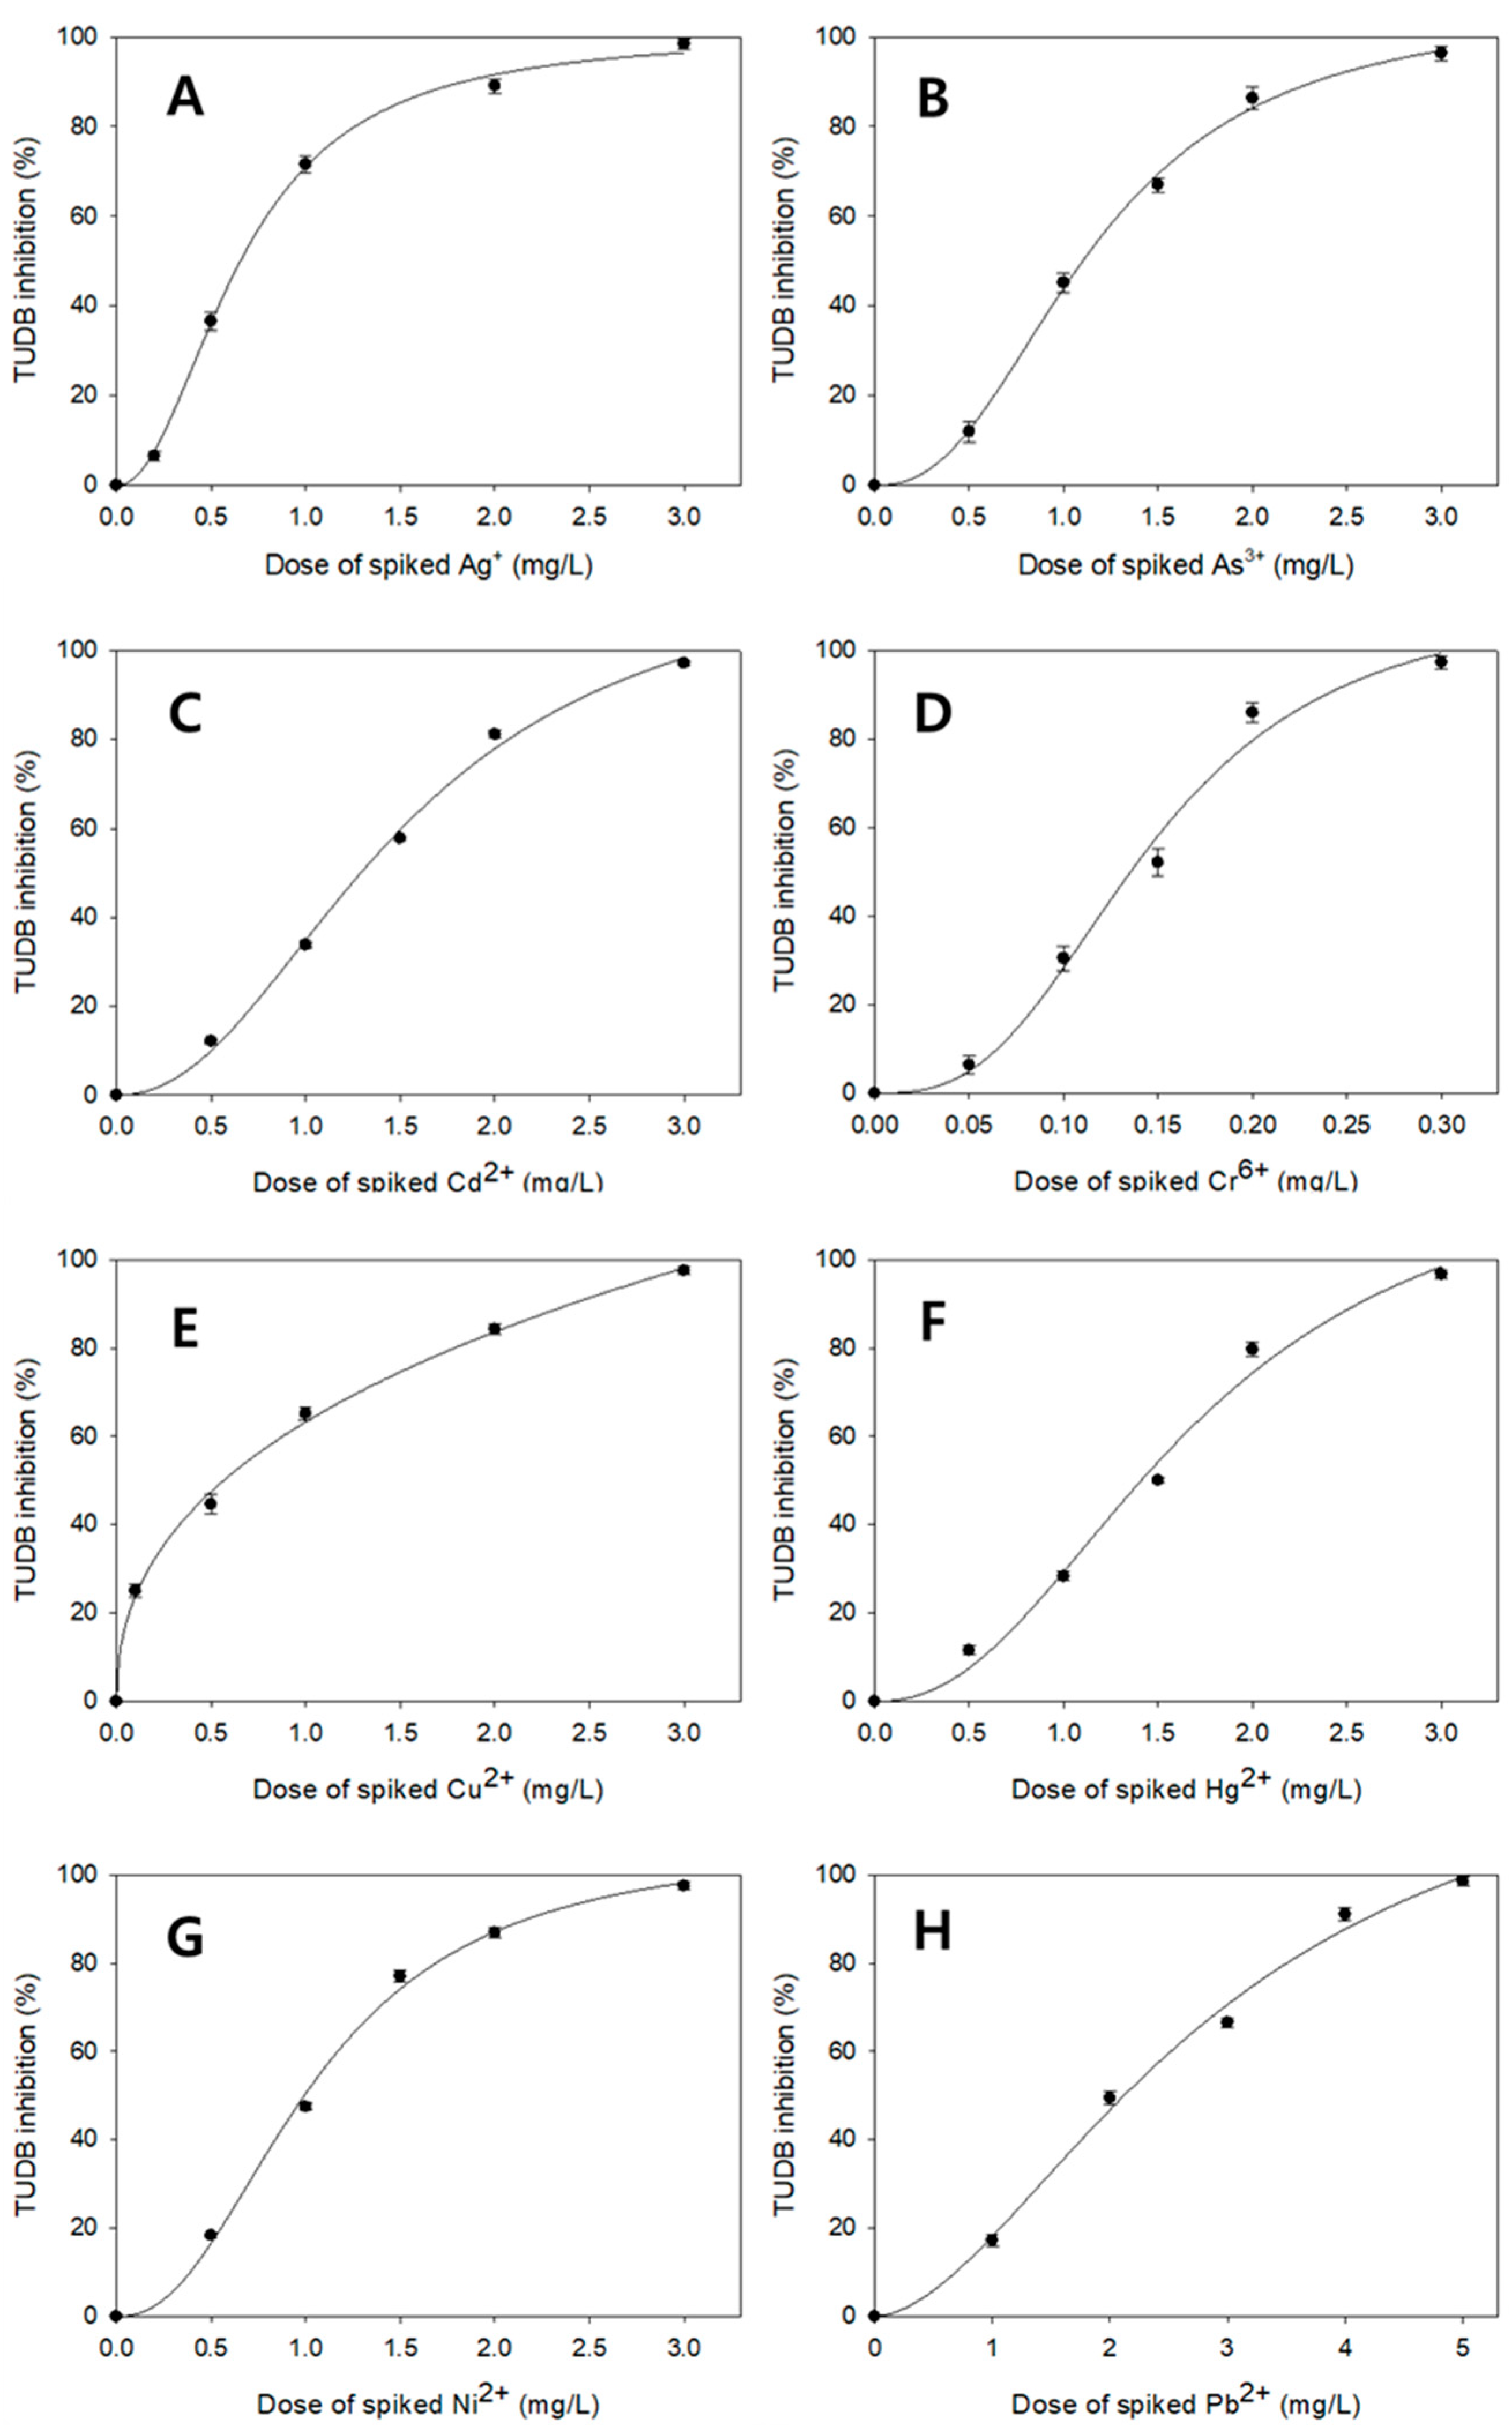
3.3. Comparisons of TUDB Toxicity Test Results Between the Present and Earlier Techniques
4. Discussion
5. Conclusions
Funding
Institutional Review Board Statement
Informed Consent Statement
Data Availability Statement
Acknowledgments
Conflicts of Interest
References
- Truhaut, R. Ecotoxicology: Objectives, principles and perspectives. Ecotoxicol. Environ. Saf. 1977, 1, 151–173. [Google Scholar] [CrossRef] [PubMed]
- Connell, D.W.; Lam, P.; Richardson, B.; Wu, R. Introduction to Ecotoxicology; John Wiley & Sons: New York, NY, USA, 2009. [Google Scholar]
- McFeters, G.A.; Bond, P.J.; Olson, S.B.; Tchan, Y.T. A comparison of microbial bioassays for the detection of aquatic toxicants. Water Res. 1983, 17, 1757–1762. [Google Scholar] [CrossRef]
- Kim, S.D. Acute toxicity of copper in flow-through system with suspended particles. Environ. Eng. Res. 2001, 6, 131–138. [Google Scholar]
- Cho, J.C.; Park, K.J.; Ihm, H.S.; Park, J.E.; Kim, S.Y.; Kang, I.; Lee, K.H.; Jahng, D.; Lee, D.H.; Kim, S.J. A novel continuous toxicity test system using a luminously modified freshwater bacterium. Biosens. Bioelectron. 2004, 20, 338–344. [Google Scholar] [CrossRef]
- Hassan, S.H.; Oh, S.E. Improved detection of toxic chemicals by Photobacterium phosphoreum using modified Boss medium. J. Photochem. Photobiol. B 2010, 101, 16–21. [Google Scholar] [CrossRef]
- Brayner, R.; Couté, A.; Livage, J.; Perrette, C.; Sicard, C. Micro-algal biosensors. Anal. Bioanal. Chem. 2011, 401, 581–597. [Google Scholar] [CrossRef]
- Oh, S.E.; Hassan, S.; Van Ginkel, S.W. A novel biosensor for detecting toxicity in water using sulfur-oxidizing bacteria. Sens. Actuators B Chem. 2011, 154, 17–21. [Google Scholar] [CrossRef]
- Hassan, S.H.A.; Van Ginkel, S.W.; Hussein, M.A.M.; Abskharon, R.; Oh, S.E. Toxicity assessment using different bioassays and microbial biosensors. Environ. Int. 2016, 92–93, 106–118. [Google Scholar] [CrossRef]
- Sponza, D.T. Incorporation of toxicity tests into the Turkish industrial discharge monitoring systems. Arch. Environ. Contam. Toxicol. 2002, 43, 186–197. [Google Scholar] [CrossRef]
- Farré, M.; Barceló, D. Toxicity testing of wastewater and sewage sludge by biosensors, bioassays and chemical analysis. TrAC-Trend. Anal. Chem. 2003, 22, 299–310. [Google Scholar] [CrossRef]
- Niemirycz, E.; Nichthauser, J.; Staniszewska, M.; Nałęcz-Jawecki, G.; Bolalek, J. The Microtox® biological test: Application in toxicity evaluation of surface waters and sediments in Poland. Oceanol. Hydrobiol. Stud. 2007, 36, 151–163. [Google Scholar] [CrossRef]
- Mishra, S.; Barik, S.K.; Ayyappan, S.; Mohapatra, B.C. Fish bioassays for evaluation of raw and bioremediated dairy effluent. Bioresour. Technol. 2000, 72, 213–218. [Google Scholar] [CrossRef]
- Moreira-Santos, M.; Soares, A.; Ribeiro, R. An in situ bioassay for freshwater environments with the microalga Pseudokirchneriella subcapitata. Ecotoxicol. Environ. Saf. 2004, 59, 164–173. [Google Scholar] [CrossRef]
- Barata, C.; Alañon, P.; Gutierrez-Alonso, S.; Riva, M.C.; Fernández, C.; Tarazona, J.V. A Daphnia magna feeding bioassay as a cost effective and ecological relevant sublethal toxicity test for environmental risk assessment of toxic effluents. Sci. Total. Environ. 2008, 405, 78–86. [Google Scholar] [CrossRef]
- Palma, P.; Palma, V.L.; Delerue-Matos, C.; Fernandes, R.M.; Bohn, A.; Soares, A.; Barbosa, I. Effects of Atrazine and Endosulfan sulphate on the ecdysteroid system of Daphnia magna. Chemosphere 2008, 74, 676–681. [Google Scholar] [CrossRef]
- Liu, D.; Chau, Y.K.; Dutka, B.J. Rapid toxicity assessment of water-soluble and water-insoluble chemicals using a modified agar plate method. Water Res. 1989, 23, 333–339. [Google Scholar] [CrossRef]
- Rönnpagel, K.; Liss, W.; Ahlf, W. Microbial bioassays to assess the toxicity of solid-associated contaminants. Ecotoxicol. Environ. Saf. 1995, 31, 99–103. [Google Scholar] [CrossRef]
- Catterall, K.; Robertson, D.; Hudson, S.; Teasdale, P.R.; Welsh, D.T.; John, R. A sensitive, rapid ferricyanide-mediated toxicity bioassay developed using Escherichia coli. Talanta 2010, 82, 751–757. [Google Scholar] [CrossRef]
- Eom, H. Development of an improved sulfur-oxidizing bacteria-based ecotoxicity test for simple and rapid on-site application. Toxics 2023, 11, 352. [Google Scholar] [CrossRef]
- Ashun, E.; Kang, W.; Thapa, B.S.; Gurung, A.; Rahimnejad, M.; Jang, M.; Jeon, B.H.; Oh, S.E. A novel gas production bioassay of thiosulfate utilizing denitrifying bacteria (TUDB) for the toxicity assessment of heavy metals contaminated water. Chemosphere 2022, 303, 134902. [Google Scholar] [CrossRef]
- Chung, J.; Amin, K.; Kim, S.; Yoon, S.; Kwon, K.; Bae, W. Autotrophic denitrification of nitrate and nitrite using thiosulfate as an electron donor. Water Res. 2014, 58, 169–178. [Google Scholar] [CrossRef] [PubMed]
- Cui, Y.X.; Biswal, B.K.; Guo, G.; Deng, Y.F.; Huang, H.; Chen, G.H.; Wu, D. Biological nitrogen removal from wastewater using sulphur-driven autotrophic denitrification. Appl. Microbiol. Biotechnol. 2019, 103, 6023–6039. [Google Scholar] [CrossRef]
- Ashun, E.; Kim, S.; Jang, M.; Chae, K.J.; Oh, S.E. Assessing the toxicity of contaminated soils via direct contact using a gas production bioassay of thiosulfate utilizing denitrifying bacteria (TUDB). J. Environ. Manag. 2023, 336, 117616. [Google Scholar] [CrossRef]
- Eom, H.; Kang, W.; Kim, S.; Chon, K.; Lee, Y.G.; Oh, S.E. Improved toxicity analysis of heavy metal-contaminated water via a novel fermentative bacteria-based test kit. Chemosphere 2020, 258, 127412. [Google Scholar] [CrossRef]
- Claus, G.; Kutzner, H.J. Autotrophic denitrification by Thiobacillus denitrificans in a packed bed reactor. Appl. Microbiol. Biotechnol. 1985, 22, 289–296. [Google Scholar] [CrossRef]
- APHA. Standard Methods for the Examination of Water and Wastewater, 22nd ed.; Rice, E.W., Baird, R.B., Eaton, A.D., Clesceri, L.S., Eds.; American Public Health Association (APHA), American Water Works Association (AWWA) and Water Environment Federation (WEF): Washington, DC, USA, 2012.
- Vidal, S.; Rocha, C.; Galvao, H. A comparison of organic and inorganic carbon control over biological denitrification in aqua. Chemosphere 2002, 48, 445–451. [Google Scholar] [CrossRef]
- Di Capua, F.; Ahoranta, S.H.; Papirio, S.; Lens, P.N.; Esposito, G. Impacts of sulfur source and temperature on sulfur-driven denitrification by pure and mixed cultures of Thiobacillus. Process Biochem. 2016, 51, 1576–1584. [Google Scholar] [CrossRef]
- Lin, J.H.; Kao, W.C.; Tsai, K.P.; Chen, C.Y. A novel algal toxicity testing technique for assessing the toxicity of both metallic and organic toxicants. Water Res. 2005, 39, 1869–1877. [Google Scholar] [CrossRef]
- Singh, P.K.; Shrivastava, A.K. Role of initial cell density of algal bioassay of toxic chemicals. J. Basic. Microbiol. 2015, 56, 812–819. [Google Scholar] [CrossRef]
- Eom, H.; Park, M.; Jang, A.; Kim, S.; Oh, S.E. A simple and rapid algal assay kit to assess toxicity of heavy metal-contaminated water. Environ. Pollut. 2021, 269, 116135. [Google Scholar] [CrossRef]
- Van Coillie, R.; Couture, P.; Schoenert, R.; Thellen, C. Mise au Point d’une ‘Evaluation Rapide de Latoxicit’e Originale des Effluents et de Leurs Composantes Al’aide D’algues; Environnement Canada, Service de la Protection de l’Environnement: Quebec, QC, Canada, 1982.
- Blaise, C.; Legault, R.; Bermingham, N.; Van Coillie, R.; Vasseur, P. A simple microplate algal assay technique for aquatic assessment. Toxic Assess. 1986, 1, 261–281. [Google Scholar] [CrossRef]

| Initial Bacterial Biomass (mg VSS/L) | Incubating Temperature (°C) | Operational pH | Volume of Total Produced Gas (mL) | Time for Completion of Gas Production | Initial Bacterial Biomass (mg VSS/L) | Incubating Temperature (°C) | Operational pH | Volume of Total Produced Gas (mL) | Time for Completion of Gas Production |
|---|---|---|---|---|---|---|---|---|---|
| 10 | 20 °C | 5 | 9.2 | 3 h 40 min | 30 | 20 °C | 5 | 9.4 | 3 h 20 min |
| 6 | 9.3 | 3 h 40 min | 6 | 9.4 | 3 h 20 min | ||||
| 7 | 9.4 | 3 h 20 min | 7 | 9.6 | 3 h 00 min | ||||
| 8 | 9.4 | 3 h 40 min | 8 | 9.6 | 3 h 20 min | ||||
| 25 °C | 5 | 9.3 | 3 h 40 min | 25 °C | 5 | 9.4 | 3 h 20 min | ||
| 6 | 9.3 | 3 h 40 min | 6 | 9.4 | 3 h 20 min | ||||
| 7 | 9.4 | 3 h 20 min | 7 | 9.6 | 3 h 00 min | ||||
| 8 | 9.4 | 3 h 40 min | 8 | 9.6 | 3 h 20 min | ||||
| 30 °C | 5 | 9.3 | 3 h 40 min | 30 °C | 5 | 9.4 | 3 h 20 min | ||
| 6 | 9.3 | 3 h 40 min | 6 | 9.6 | 3 h 20 min | ||||
| 7 | 9.5 | 3 h 20 min | 7 | 9.6 | 3 h 00 min | ||||
| 8 | 9.4 | 3 h 40 min | 8 | 9.6 | 3 h 00 min | ||||
| 35 °C | 5 | 9.2 | 3 h 40 min | 35 °C | 5 | 9.4 | 3 h 20 min | ||
| 6 | 9.3 | 3 h 20 min | 6 | 9.4 | 3 h 00 min | ||||
| 7 | 9.5 | 3 h 0 min | 7 | 9.6 | 2 h 40 min | ||||
| 8 | 9.5 | 3 h 20 min | 8 | 9.6 | 3 h 00 min | ||||
| 20 | 20 °C | 5 | 9.4 | 3 h 40 min | 40 | 20 °C | 5 | 9.2 | 3 h 20 min |
| 6 | 9.3 | 3 h 40 min | 6 | 9.3 | 3 h 20 min | ||||
| 7 | 9.4 | 3 h 20 min | 7 | 9.6 | 3 h 00 min | ||||
| 8 | 9.5 | 3 h 40 min | 8 | 9.4 | 3 h 00 min | ||||
| 25 °C | 5 | 9.4 | 3 h 40 min | 25 °C | 5 | 9.4 | 3 h 20 min | ||
| 6 | 9.4 | 3 h 40 min | 6 | 9.5 | 3 h 20 min | ||||
| 7 | 9.5 | 3 h 20 min | 7 | 9.6 | 3 h 00 min | ||||
| 8 | 9.5 | 3 h 40 min | 8 | 9.4 | 3 h 20 min | ||||
| 30 °C | 5 | 9.3 | 3 h 20 min | 30 °C | 5 | 9.4 | 3 h 00 min | ||
| 6 | 9.4 | 3 h 20 min | 6 | 9.5 | 3 h 00 min | ||||
| 7 | 9.6 | 3 h 20 min | 7 | 9.6 | 2 h 40 min | ||||
| 8 | 9.5 | 3 h 40 min | 8 | 9.6 | 2 h 40 min | ||||
| 35 °C | 5 | 9.2 | 3 h 20 min | 35 °C | 5 | 9.4 | 3 h 20 min | ||
| 6 | 9.4 | 3 h 20 min | 6 | 9.6 | 3 h 00 min | ||||
| 7 | 9.4 | 3 h 00 min | 7 | 9.6 | 2 h 40 min | ||||
| 8 | 9.5 | 3 h 20 min | 8 | 9.5 | 2 h 40 min |
| Initial Bacterial Biomass (mg VSS/L) | Incubating Temperature (°C) | Operational pH | 4 h EC50 (mg/L) | CV (%) | Initial Bacterial Biomass (mg VSS/L) | Incubating Temperature (°C) | Operational pH | 4 h EC50 (mg/L) | CV (%) |
|---|---|---|---|---|---|---|---|---|---|
| 10 | 20 °C | 5 | 2.66 ± 0.84 | 31.4 | 30 | 20 °C | 5 | 4.05 ± 0.50 | 12.4 |
| 6 | 1.67 ± 0.41 | 24.4 | 6 | 3.08 ± 0.08 | 2.6 | ||||
| 7 | 2.01 ± 0.41 | 20.4 | 7 | 3.64 ± 0.18 | 4.8 | ||||
| 8 | 2.13 ± 0.45 | 21.3 | 8 | 3.53 ± 0.20 | 5.6 | ||||
| 25 °C | 5 | 1.71 ± 0.53 | 31.2 | 25 °C | 5 | 3.41 ± 0.54 | 15.8 | ||
| 6 | 1.44 ± 0.34 | 23.7 | 6 | 2.80 ± 0.06 | 2.1 | ||||
| 7 | 1.69 ± 0.40 | 23.5 | 7 | 3.02 ± 0.09 | 3.0 | ||||
| 8 | 1.68 ± 0.44 | 26.3 | 8 | 3.25 ± 0.09 | 2.8 | ||||
| 30 °C | 5 | 3.06 ± 0.93 | 30.3 | 30 °C | 5 | 4.15 ± 0.51 | 12.3 | ||
| 6 | 2.42 ± 0.52 | 21.4 | 6 | 3.82 ± 0.21 | 5.5 | ||||
| 7 | 2.77 ± 0.59 | 21.4 | 7 | 4.28 ± 0.22 | 5.1 | ||||
| 8 | 3.02 ± 0.61 | 20.2 | 8 | 4.04 ± 0.06 | 1.4 | ||||
| 35 °C | 5 | 3.17 ± 1.00 | 31.6 | 35 °C | 5 | 4.28 ± 0.52 | 12.1 | ||
| 6 | 2.67 ± 0.56 | 21.0 | 6 | 4.11 ± 0.09 | 2.2 | ||||
| 7 | 2.82 ± 0.59 | 21.0 | 7 | 4.32 ± 0.17 | 4.0 | ||||
| 8 | 2.97 ± 0.67 | 22.6 | 8 | 4.22 ± 0.20 | 4.7 | ||||
| 20 | 20 °C | 5 | 2.75 ± 0.44 | 16.1 | 40 | 20 °C | 5 | 4.10 ± 0.46 | 11.3 |
| 6 | 1.98 ± 0.08 | 4.0 | 6 | 3.65 ± 0.11 | 3.0 | ||||
| 7 | 2.26 ± 0.13 | 5.6 | 7 | 3.78 ± 0.18 | 4.8 | ||||
| 8 | 2.36 ± 0.14 | 6.0 | 8 | 3.99 ± 0.11 | 2.8 | ||||
| 25 °C | 5 | 1.92 ± 0.27 | 14.1 | 25 °C | 5 | 3.99 ± 0.44 | 11.1 | ||
| 6 | 1.42 ± 0.03 | 2.2 | 6 | 3.17 ± 0.09 | 2.7 | ||||
| 7 | 1.83 ± 0.09 | 4.7 | 7 | 3.71 ± 0.10 | 2.7 | ||||
| 8 | 1.82 ± 0.06 | 3.3 | 8 | 3.94 ± 0.10 | 2.6 | ||||
| 30 °C | 5 | 3.11 ± 0.44 | 14.0 | 30 °C | 5 | 4.80 ± 0.48 | 10.1 | ||
| 6 | 2.61 ± 0.07 | 2.8 | 6 | 4.21 ± 0.07 | 1.7 | ||||
| 7 | 2.85 ± 0.09 | 3.1 | 7 | 4.67 ± 0.09 | 1.9 | ||||
| 8 | 3.04 ± 0.12 | 4.0 | 8 | 4.62 ± 0.05 | 1.0 | ||||
| 35 °C | 5 | 3.35 ± 0.53 | 15.9 | 35 °C | 5 | 4.93 ± 0.70 | 14.3 | ||
| 6 | 2.81 ± 0.11 | 3.8 | 6 | 4.55 ± 0.09 | 1.9 | ||||
| 7 | 3.07 ± 0.14 | 4.6 | 7 | 4.89 ± 0.08 | 1.5 | ||||
| 8 | 3.19 ± 0.13 | 4.1 | 8 | 4.94 ± 0.09 | 1.7 |
Disclaimer/Publisher’s Note: The statements, opinions and data contained in all publications are solely those of the individual author(s) and contributor(s) and not of MDPI and/or the editor(s). MDPI and/or the editor(s) disclaim responsibility for any injury to people or property resulting from any ideas, methods, instructions or products referred to in the content. |
© 2024 by the author. Licensee MDPI, Basel, Switzerland. This article is an open access article distributed under the terms and conditions of the Creative Commons Attribution (CC BY) license (https://creativecommons.org/licenses/by/4.0/).
Share and Cite
Eom, H. Development of an Improved Thiosulfate-Utilizing Denitrifying Bacteria-Based Ecotoxicity Test with High Detection Sensitivity and Reproducibility. Toxics 2024, 12, 788. https://doi.org/10.3390/toxics12110788
Eom H. Development of an Improved Thiosulfate-Utilizing Denitrifying Bacteria-Based Ecotoxicity Test with High Detection Sensitivity and Reproducibility. Toxics. 2024; 12(11):788. https://doi.org/10.3390/toxics12110788
Chicago/Turabian StyleEom, Heonseop. 2024. "Development of an Improved Thiosulfate-Utilizing Denitrifying Bacteria-Based Ecotoxicity Test with High Detection Sensitivity and Reproducibility" Toxics 12, no. 11: 788. https://doi.org/10.3390/toxics12110788
APA StyleEom, H. (2024). Development of an Improved Thiosulfate-Utilizing Denitrifying Bacteria-Based Ecotoxicity Test with High Detection Sensitivity and Reproducibility. Toxics, 12(11), 788. https://doi.org/10.3390/toxics12110788