
Interlaboratory Study on Zebrafish in Toxicology: Systematic Evaluation of the Application of Zebrafish in Toxicology’s (SEAZIT’s) Evaluation of Developmental Toxicity

 ,
,  ,
,  ,
,  ,
,
Abstract
1. Introduction
2. Materials and Methods
2.1. Test Substance Selection
2.2. Test Substance Procurement
2.3. Laboratory Selection
2.4. Animal Husbandry
2.5. Interlaboratory Study Design
2.6. Dose-Range-Finding (DRF) Study
2.7. Definitive (Def) Study Design
- Static exposure of chorionated embryos (S-C)
- Static renewal exposure of chorionated embryos (SR-C)
- Static exposure of dechorionated embryos (S-DC)
- Static renewal exposure of dechorionated embryos (SR-DC)
2.8. Data Analysis
3. Results
3.1. Test Substances Characteristics
- A total of 25 substances had test data generated in zebrafish embryos as part of ToxCastTM. The activity of the substances ranged from inactive to potent with a median logAC50 value for substances producing phenotypic alterations or mortality of 1.06 µM [62]. In addition, DTT has previously tested 24 of the substances in studies using embryonic zebrafish [48,49,50].
- A total of 26 substances had in vivo developmental toxicity studies conducted in rodents that were available from DTT’s studies, ToxRefDB, or the European Chemicals Agency (ECHA).

| Substance Information | Physicochemical Properties 1 | In Vivo Reference Data | ToxPi Score for Vascular Disruption Markers 4 | Suggested by Zebrafish Researchers 5 | ||||
|---|---|---|---|---|---|---|---|---|
| Name | CASRN | Molecular Weight | logP | ToxCastTM Zebrafish | Rodent In Vivo Reference Data Identified 2 | NTP Studies Conducted in Zebrafish 3 | ||
| 3,3′,5,5′-tetrabromobisphenol A | 79-94-7 | 543.87 | 5.682 | Yes | - | Alzualde et al. [48]; Behl et al. [49] | 0.27 | Yes |
| 3,4-dichloroaniline | 95-76-1 | 162.02 | 2.37 | - | - | - | - | - |
| 6-propyl-2-thiouracil | 51-52-5 | 170.23 | 0.98 | - | Yes | Behl et al. [49] | 0.05 | - |
| Abamectin | 71751-41-2 | 873.08 | 6.61 | Yes | - | - | 0.33 | Yes |
| Acetaldehyde | 75-07-0 | 44.05 | −0.17 | - | - | - | - | - |
| Aldicarb | 116-06-3 | 190.26 | 1.13 | Yes | Yes | Behl et al. [49]; Quevedo et al. [50] | 0.07 | - |
| Amoxicillin | 26787-78-0 | 365.40 | −3.064 | - | - | Behl et al. [49]; Quevedo et al. [50] | - | - |
| Aspirin | 50-78-2 | 180.16 | 0.67 | - | Yes | Behl et al. [49] | 0.03 | - |
| Atrazine | 1912-24-9 | 215.69 | 2.82 | Yes | Yes | - | 0.06 | - |
| Bis(tributyltin)oxide | 56-35-9 | 596.11 | 5.02 | - | Yes | Behl et al. [49]; Quevedo et al. [50] | - | - |
| Bisphenol A | 80-05-7 | 228.29 | 3.092 | Yes | Yes | Behl et al. [49]; Quevedo et al. [50] | 0.10 | - |
| Caffeine | 58-08-2 | 194.19 | 0.16 | - | Yes | Behl et al. [49] | 0.00 | - |
| Chlorpyrifos | 2921-88-2 | 350.59 | 0.357 | Yes | Yes | Behl et al. [49]; Quevedo et al. [50] | 0.10 | Yes |
| Chlorpyrifos oxon | 5598-15-2 | 334.52 | 3.73 | Yes | - | - | 0.12 | Yes |
| Dibenz(a,h)anthracene | 53-70-3 | 278.36 | 6.7 | - | - | Behl et al. [49]; Quevedo et al. [50] | - | Yes |
| Dibutyl phthalate | 84-74-2 | 278.34 | NA | Yes | Yes | Behl et al. [49] | 0.02 | - |
| Diethylstilbestrol | 56-53-1 | 268.36 | 5.64 | Yes | Yes | Behl et al. [49]; Quevedo et al. [50] | 0.30 | - |
| Fluazifop-butyl | 69806-50-4 | 383.37 | 5.34 | Yes | Yes | Behl et al. [49] | 0.00 | - |
| Flusilazole | 85509-19-9 | 315.4 | 4.89 | Yes | Yes | - | 0.06 | - |
| Hydroxyurea | 127-07-1 | 76.06 | −1.606 | - | Yes | Behl et al. [49]; Quevedo et al. [50] | 0.01 | - |
| Iprodione | 36734-19-7 | 330.17 | 2.85 | Yes | Yes | - | 0.06 | - |
| Lindane | 58-89-9 | 290.83 | 4.26 | Yes | Yes | Behl et al. [49]; Quevedo et al. [50] | 0.04 | - |
| Linuron | 330-55-2 | 249.1 | 2.91 | Yes | Yes | Behl et al. [49] | 0.03 | - |
| Paclobutrazol | 76738-62-0 | 293.79 | 3.2 | Yes | Yes | - | 0.03 | - |
| Pentachlorophenol | 87-86-5 | 266.34 | 4.74 | Yes | Yes | - | 0.24 | - |
| Phorate | 298-02-2 | 260.37 | 3.37 | Yes | Yes | - | 0.03 | - |
| Propofol | 2078-54-8 | 178.27 | 3.244 | - | - | - | - | Yes |
| Pyrene | 129-00-0 | 202.26 | 4.93 | Yes | - | Quevedo et al. [50] | 0.04 | Yes |
| Pyriproxyfen | 95737-68-1 | 321.38 | 5.55 | Yes | Yes | - | 0.05 | - |
| Resorcinol | 108-46-3 | 110.11 | 0.8 | - | Yes | - | 0.00 | Yes |
| Rotenone | 83-79-4 | 394.42 | 4.1 | Yes | Yes | Behl et al. [49]; Quevedo et al. [50] | 0.17 | - |
| Sodium valproate | 1069-66-5 | 166.19 | NA | - | - | Quevedo et al. [50] | - | - |
| Thalidomide | 50-35-1 | 258.24 | −0.24 | - | - | Behl et al. [49]; Quevedo et al. [50] | 0.00 | - |
| Triadimefon | 43121-43-3 | 293.76 | 2.94 | Yes | Yes | Behl et al. [49] | 0.03 | - |
| Triclosan | 3380-34-5 | 289.55 | 4.66 | Yes | Yes | - | 0.27 | - |
| Triphenyl phosphate | 115-86-6 | 326.29 | 4.7 | Yes | Yes | Alzualde et al. [48]; Behl et al. [49]; Quevedo et al. [50] | 0.15 | - |
| Tris(1,3-dichloro-2-propyl)phosphate | 13674-87-8 | 430.91 | 3.65 | Yes | - | Alzualde et al. [48] | - | Yes |
| Valproic acid | 99-66-1 | 144.22 | 2.96 | Yes | - | Behl et al. [49] | 0.00 | - |
| Ziram | 137-30-4 | 305.84 | 1.29 | - | Yes | - | 0.30 | Yes |
3.2. DRF Study Results: Summary of Test Substance Activity and Comparison to ToxCast Database
3.3. Vehicle Control Performance
3.4. Positive Control Performance
3.5. Reproducibility of Duplicate Test Substances
3.6. Test Substance Interlaboratory Variability
4. Discussion
Supplementary Materials
Author Contributions
Funding
Institutional Review Board Statement
Informed Consent Statement
Data Availability Statement
Acknowledgments
Conflicts of Interest
References
- Dai, Y.-J.; Jia, Y.-F.; Chen, N.; Bian, W.-P.; Li, Q.-K.; Ma, Y.-B.; Chen, Y.-L.; Pei, D.-S. Zebrafish as a model system to study toxicology. Environ. Toxicol. Chem. 2014, 33, 11–17. [Google Scholar] [CrossRef]
- Lawrence, C. The husbandry of zebrafish (Danio rerio): A review. Aquaculture 2007, 269, 1–20. [Google Scholar] [CrossRef]
- Lawrence, C.; Mason, T. Zebrafish housing systems: A review of basic operating principles and considerations for design and functionality. ILAR J. 2012, 53, 179–191. [Google Scholar] [CrossRef] [PubMed]
- Howe, K.; Clark, M.D.; Torroja, C.F.; Torrance, J.; Berthelot, C.; Muffato, M.; Collins, J.E.; Humphray, S.; McLaren, K.; Matthews, L.; et al. The zebrafish reference genome sequence and its relationship to the human genome. Nature 2013, 496, 498–503, Erratum in Nature 2014, 505, 248. [Google Scholar] [CrossRef] [PubMed]
- Postlethwait, J.H.; Woods, I.G.; Ngo-Hazelett, P.; Yan, Y.-L.; Kelly, P.D.; Chu, F.; Huang, H.; Hill-Force, A.; Talbot, W.S. Zebrafish Comparative Genomics and the Origins of Vertebrate Chromosomes. Genome Res. 2000, 10, 1890–1902. [Google Scholar] [CrossRef] [PubMed]
- Padilla, S.; Corum, D.; Padnos, B.; Hunter, D.L.; Beam, A.; Houck, K.A.; Sipes, N.; Kleinstreuer, N.; Knudsen, T.; Dix, D.J.; et al. Zebrafish developmental screening of the ToxCast™ Phase I chemical library. Reprod. Toxicol. 2012, 33, 174–187. [Google Scholar] [CrossRef] [PubMed]
- Truong, L.; Reif, D.M.; St Mary, L.; Geier, M.C.; Truong, H.D.; Tanguay, R.L. Multidimensional in vivo hazard assessment using zebrafish. Toxicol. Sci. 2014, 137, 212–233. [Google Scholar] [CrossRef]
- Tanguay, R.L. The Rise of Zebrafish as a Model for Toxicology. Toxicol. Sci. 2018, 163, 3–4. [Google Scholar] [CrossRef]
- Ball, J.S.; Stedman, D.B.; Hillegass, J.M.; Zhang, C.X.; Panzica-Kelly, J.; Coburn, A.; Enright, B.P.; Tornesi, B.; Amouzadeh, H.R.; Hetheridge, M.; et al. Fishing for teratogens: A consortium effort for a harmonized zebrafish developmental toxicology assay. Toxicol. Sci. 2014, 139, 210–219. [Google Scholar] [CrossRef]
- Panzica-Kelly, J.M.; Zhang, C.X.; Augustine-Rauch, K.A. Optimization and Performance Assessment of the Chorion-Off [Dechorinated] Zebrafish Developmental Toxicity Assay. Toxicol. Sci. 2015, 146, 127–134. [Google Scholar] [CrossRef]
- Dasgupta, S.; Simonich, M.T.; Tanguay, R.L. Zebrafish Behavioral Assays in Toxicology. In High-Throughput Screening Assays in Toxicology; Methods in Molecular Biology Book Series; Humana: New York, NY, USA, 2022; Volume 2474, pp. 109–122. [Google Scholar] [CrossRef]
- Rennekamp, A.J.; Peterson, R.T. 15 years of zebrafish chemical screening. Curr. Opin. Chem. Biol. 2015, 24, 58–70. [Google Scholar] [CrossRef] [PubMed]
- Cassar, S.; Adatto, I.; Freeman, J.L.; Gamse, J.T.; Iturria, I.; Lawrence, C.; Muriana, A.; Peterson, R.T.; Van Cruchten, S.; Zon, L.I. Use of Zebrafish in Drug Discovery Toxicology. Chem. Res. Toxicol. 2020, 33, 95–118. [Google Scholar] [CrossRef] [PubMed]
- Song, Y.-S.; Dai, M.-Z.; Zhu, C.-X.; Huang, Y.-F.; Liu, J.; Zhang, C.-D.; Xie, F.; Peng, Y.; Zhang, Y.; Li, C.-Q.; et al. Validation, Optimization, and Application of the Zebrafish Developmental Toxicity Assay for Pharmaceuticals Under the ICH S5(R3) Guideline. Front. Cell Dev. Biol. 2021, 9, 721130. [Google Scholar] [CrossRef] [PubMed]
- Almond, K.M.; Trombetta, L.D. The effects of copper pyrithione, an antifouling agent, on developing zebrafish embryos. Ecotoxicology 2016, 25, 389–398. [Google Scholar] [CrossRef] [PubMed]
- de Oliveira, G.A.; de Lapuente, J.; Teixido, E.; Porredon, C.; Borras, M.; de Oliveira, D.P. Textile dyes induce toxicity on zebrafish early life stages. Environ. Toxicol. Chem. 2016, 35, 429–434. [Google Scholar] [CrossRef] [PubMed]
- Martins, J.; Oliva Teles, L.; Vasconcelos, V. Assays with Daphnia magna and Danio rerio as alert systems in aquatic toxicology. Environ. Int. 2007, 33, 414–425. [Google Scholar] [CrossRef]
- Russell, W.M.S.; Burch, R.L. The Principles of Humane Experimental Technique; Special Edition; Digitized; Johns Hopkins Bloomberg School of Public Health: Baltimore, MD, USA, 1992; Available online: https://caat.jhsph.edu/principles/the-principles-of-humane-experimental-technique (accessed on 15 January 2024).
- Tannenbaum, J.; Bennett, B.T. Russell and Burch’s 3Rs then and now: The need for clarity in definition and purpose. J. Am. Assoc. Lab. Anim. Sci. 2015, 54, 120–132. [Google Scholar]
- Embry, M.R.; Belanger, S.E.; Braunbeck, T.A.; Galay-Burgos, M.; Halder, M.; Hinton, D.E.; Léonard, M.A.; Lillicrap, A.; Norberg-King, T.; Whale, G. The fish embryo toxicity test as an animal alternative method in hazard and risk assessment and scientific research. Aquat. Toxicol. 2010, 97, 79–87. [Google Scholar] [CrossRef]
- OECD. Test No. 236: Fish Embryo Acute Toxicity (FET) Test, OECD Guidelines for the Testing of Chemicals, Section 2; OECD Publishing: Paris, France, 2013. [Google Scholar]
- Brannen, K.C.; Panzica-Kelly, J.M.; Danberry, T.L.; Augustine-Rauch, K.A. Development of a zebrafish embryo teratogenicity assay and quantitative prediction model. Birth Defects Res. Part B Dev. Reprod. Toxicol. 2010, 89, 66–77. [Google Scholar] [CrossRef]
- Gustafson, A.L.; Stedman, D.B.; Ball, J.; Hillegass, J.M.; Flood, A.; Zhang, C.X.; Panzica-Kelly, J.; Cao, J.; Coburn, A.; Enright, B.P.; et al. Inter-laboratory assessment of a harmonized zebrafish developmental toxicology assay—Progress report on phase I. Reprod. Toxicol. 2012, 33, 155–164. [Google Scholar] [CrossRef]
- Beekhuijzen, M.; de Koning, C.; Flores-Guillén, M.E.; de Vries-Buitenweg, S.; Tobor-Kaplon, M.; van de Waart, B.; Emmen, H. From cutting edge to guideline: A first step in harmonization of the zebrafish embryotoxicity test (ZET) by describing the most optimal test conditions and morphology scoring system. Reprod. Toxicol. 2015, 56, 64–76. [Google Scholar] [CrossRef] [PubMed]
- Truong, L.; Bugel, S.M.; Chlebowski, A.; Usenko, C.Y.; Simonich, M.T.; Simonich, S.L.; Tanguay, R.L. Optimizing multi-dimensional high throughput screening using zebrafish. Reprod. Toxicol. 2016, 65, 139–147. [Google Scholar] [CrossRef] [PubMed]
- Wilson, L.B.; Truong, L.; Simonich, M.T.; Tanguay, R.L. Systematic Assessment of Exposure Variations on Observed Bioactivity in Zebrafish Chemical Screening. Toxics 2020, 8, 87. [Google Scholar] [CrossRef] [PubMed]
- Adatto, I.; Lawrence, C.; Thompson, M.; Zon, L. A new system for the rapid collection of large numbers of developmentally staged zebrafish embryos. PLoS ONE 2011, 6, e21715. [Google Scholar] [CrossRef] [PubMed]
- Westerfield, M. The Zebrafish Book: A Guide for the Laboratory Use of Zebrafish Danio (Brachydanio) Rerio, 4th ed.; University of Oregon Press: Eugene, OR, USA, 2000. [Google Scholar]
- Forbes, E.L.; Preston, C.D.; Lokman, P.M. Zebrafish (Danio rerio) and the egg size versus egg number trade off: Effects of ration size on fecundity are not mediated by orthologues of the Fec gene. Reprod. Fertil. Dev. 2010, 22, 1015–1021. [Google Scholar] [CrossRef] [PubMed]
- Kimmel, C.B.; Ballard, W.W.; Kimmel, S.R.; Ullmann, B.; Schilling, T.F. Stages of embryonic development of the zebrafish. Dev. Dyn. 1995, 203, 253–310. [Google Scholar] [CrossRef]
- Mandrell, D.; Truong, L.; Jephson, C.; Sarker, M.R.; Moore, A.; Lang, C.; Simonich, M.T.; Tanguay, R.L. Automated zebrafish chorion removal and single embryo placement: Optimizing throughput of zebrafish developmental toxicity screens. J. Lab. Autom. 2012, 17, 66–74. [Google Scholar] [CrossRef]
- Nagel, R. DarT: The embryo test with the zebrafish Danio rerio—A general model in ecotoxicology and toxicology. ALTEX 2002, 19 (Suppl. S1), 38–48. [Google Scholar]
- Auer, T.O.; Duroure, K.; De Cian, A.; Concordet, J.-P.; Del Bene, F. Highly efficient CRISPR/Cas9-mediated knock-in in zebrafish by homology-independent DNA repair. Genome Res. 2014, 24, 142–153. [Google Scholar] [CrossRef]
- Busquet, F.; Nagel, R.; von Landenberg, F.; Mueller, S.O.; Huebler, N.; Broschard, T.H. Development of a new screening assay to identify proteratogenic substances using zebrafish Danio rerio embryo combined with an exogenous mammalian metabolic activation system (mDarT). Toxicol. Sci. 2008, 104, 177–188. [Google Scholar] [CrossRef]
- Letamendia, A.; Quevedo, C.; Ibarbia, I.; Virto, J.M.; Holgado, O.; Diez, M.; Belmonte, J.C.I.; Callol-Massot, C. Development and validation of an automated high-throughput system for zebrafish in vivo screenings. PLoS ONE 2012, 7, e36690. [Google Scholar] [CrossRef] [PubMed]
- Ducharme, N.A.; Reif, D.M.; Gustafsson, J.A.; Bondesson, M. Comparison of toxicity values across zebrafish early life stages and mammalian studies: Implications for chemical testing. Reprod. Toxicol. 2015, 55, 3–10. [Google Scholar] [CrossRef] [PubMed]
- Sipes, N.S.; Padilla, S.; Knudsen, T.B. Zebrafish: As an integrative model for twenty-first century toxicity testing. Birth Defects Res. Part C Embryo Today 2011, 93, 256–267. [Google Scholar] [CrossRef] [PubMed]
- van der Zalm, A.J.; Barroso, J.; Browne, P.; Casey, W.; Gordon, J.; Henry, T.R.; Kleinstreuer, N.C.; Lowit, A.B.; Perron, M.; Clippinger, A.J. A framework for establishing scientific confidence in new approach methodologies. Arch. Toxicol. 2022, 96, 2865–2879. [Google Scholar] [CrossRef] [PubMed]
- Planchart, A.; Mattingly, C.J.; Allen, D.; Ceger, P.; Casey, W.; Hinton, D.; Kanungo, J.; Kullman, S.W.; Tal, T.; Bondesson, M.; et al. Advancing toxicology research using in vivo high throughput toxicology with small fish models. ALTEX Altern. Anim. Exp. 2016, 33, 435–452. [Google Scholar] [CrossRef]
- Pelka, K.E.; Henn, K.; Keck, A.; Sapel, B.; Braunbeck, T. Size does matter—Determination of the critical molecular size for the uptake of chemicals across the chorion of zebrafish (Danio rerio) embryos. Aquat. Toxicol. 2017, 185, 1–10. [Google Scholar] [CrossRef]
- Kais, B.; Schneider, K.E.; Keiter, S.; Henn, K.; Ackermann, C.; Braunbeck, T. DMSO modifies the permeability of the zebrafish (Danio rerio) chorion-implications for the fish embryo test (FET). Aquat. Toxicol. 2013, 140–141, 229–238. [Google Scholar] [CrossRef]
- van Gelder, M.M.; van Rooij, I.A.L.M.; Miller, R.K.; Zielhuis, G.A.; Berg, L.T.d.J.-V.D.; Roeleveld, N. Teratogenic mechanisms of medical drugs. Human. Reprod. Update 2010, 16, 378–394. [Google Scholar] [CrossRef]
- Kleinstreuer, N.C.; Judson, R.S.; Reif, D.M.; Sipes, N.S.; Singh, A.V.; Chandler, K.J.; Dewoskin, R.; Dix, D.J.; Kavlock, R.J.; Knudsen, T.B. Environmental impact on vascular development predicted by high-throughput screening. Environ. Health Perspect. 2011, 119, 1596–1603. [Google Scholar] [CrossRef]
- Kleinstreuer, N.; Dix, D.; Rountree, M.; Baker, N.; Sipes, N.; Reif, D.; Spencer, R.; Knudsen, T. A Computational Model Predicting Disruption of Blood Vessel Development. PLoS Comput. Biol. 2013, 9, e1002996. [Google Scholar] [CrossRef]
- Saili, K.S.; Franzosa, J.A.; Baker, N.C.; Ellis-Hutchings, R.G.; Settivari, R.S.; Carney, E.W.; Spencer, R.; Zurlinden, T.J.; Kleinstreuer, N.C.; Li, S.; et al. Systems Modeling of Developmental Vascular Toxicity. Curr. Opin. Toxicol. 2019, 15, 55–63. [Google Scholar] [CrossRef] [PubMed]
- Kleinstreuer, N.C.; Ceger, P.; Watt, E.D.; Martin, M.; Houck, K.; Browne, P.; Thomas, R.S.; Casey, W.M.; Dix, D.J.; Allen, D.; et al. Development and Validation of a Computational Model for Androgen Receptor Activity. Chem. Res. Toxicol. 2017, 30, 946–964. [Google Scholar] [CrossRef] [PubMed]
- Browne, P.; Judson, R.S.; Casey, W.M.; Kleinstreuer, N.C.; Thomas, R.S. Screening Chemicals for Estrogen Receptor Bioactivity Using a Computational Model. Environ. Sci. Technol. 2015, 49, 8804–8814, Erratum in Environ. Sci. Technol. 2017, 51, 9415. [Google Scholar] [CrossRef] [PubMed]
- Alzualde, A.; Behl, M.; Sipes, N.; Hsieh, J.H.; Alday, A.; Tice, R.; Paules, R.; Muriana, A.; Quevedo, C. Toxicity profiling of flame retardants in zebrafish embryos using a battery of assays for developmental toxicity, neurotoxicity, cardiotoxicity and hepatotoxicity toward human relevance. Neurotoxicol. Teratol. 2018, 70, 40–50. [Google Scholar] [CrossRef] [PubMed]
- Behl, M.; Ryan, K.; Hsieh, J.H.; Parham, F.; Shapiro, A.J.; Collins, B.J.; Sipes, N.S.; Birnbaum, L.S.; Bucher, J.R.; Foster, P.M.D.; et al. Screening for Developmental Neurotoxicity at the National Toxicology Program: The Future Is Here. Toxicol. Sci. 2019, 167, 6–14, Erratum in Toxicol. Sci. 2019, 168, 644. [Google Scholar] [CrossRef] [PubMed]
- Quevedo, C.; Behl, M.; Ryan, K.; Paules, R.S.; Alday, A.; Muriana, A.; Alzualde, A. Detection and Prioritization of Developmentally Neurotoxic and/or Neurotoxic Compounds Using Zebrafish. Toxicol. Sci. 2019, 168, 225–240. [Google Scholar] [CrossRef] [PubMed]
- Watford, S.; Pham, L.L.; Wignall, J.; Shin, R.; Martin, M.T.; Friedman, K.P. ToxRefDB version 2.0: Improved utility for predictive and retrospective toxicology analyses. Rep. Toxicol. 2019, 89, 145–158. [Google Scholar] [CrossRef]
- Wu, S.; Fisher, J.; Naciff, J.; Laufersweiler, M.; Lester, C.; Daston, G.; Blackburn, K. Framework for identifying chemicals with structural features associated with the potential to act as developmental or reproductive toxicants. Chem. Res. Toxicol. 2013, 26, 1840–1861. [Google Scholar] [CrossRef]
- Genschow, E.; Spielmann, H.; Scholz, G.; Seiler, A.; Brown, N.; Piersma, A.; Brady, M.; Clemann, N.; Huuskonen, H.; Paillard, F.; et al. The ECVAM international validation study on in vitro embryotoxicity tests: Results of the definitive phase and evaluation of prediction models. European Centre for the Validation of Alternative Methods. Altern. Lab. Anim. 2002, 30, 151–176. [Google Scholar] [CrossRef]
- Daston, G.P.; Beyer, B.K.; Carney, E.W.; Chapin, R.E.; Friedman, J.M.; Piersma, A.H.; Rogers, J.M.; Scialli, A.R. Exposure-based validation list for developmental toxicity screening assays. Birth Defects Res. Part B Dev. Reprod. Toxicol. 2014, 101, 423–428. [Google Scholar] [CrossRef]
- Knudsen, T.B.; Martin, M.T.; Kavlock, R.J.; Judson, R.S.; Dix, D.J.; Singh, A.V. Profiling the activity of environmental chemicals in prenatal developmental toxicity studies using the U.S. EPA’s ToxRefD.B. Reprod. Toxicol. 2009, 28, 209–219. [Google Scholar] [CrossRef] [PubMed]
- Blackburn, K.; Daston, G.; Fisher, J.; Lester, C.; Naciff, J.M.; Rufer, E.S.; Stuard, S.B.; Woeller, K. A strategy for safety assessment of chemicals with data gaps for developmental and/or reproductive toxicity. Regul. Toxicol. Pharmacol. 2015, 72, 202–215. [Google Scholar] [CrossRef] [PubMed]
- Schwetz, B.A.; Harris, M.W. Developmental toxicology: Status of the field and contribution of the National Toxicology Program. Environ. Health Perspect. 1993, 100, 269–282. [Google Scholar] [CrossRef] [PubMed]
- Hewitt, M.; Ellison, C.M.; Enoch, S.J.; Madden, J.C.; Cronin, M.T. Integrating (Q)SAR models, expert systems and read-across approaches for the prediction of developmental toxicity. Reprod. Toxicol. 2010, 30, 147–160. [Google Scholar] [CrossRef] [PubMed]
- Lewin, G.; Escher, S.E.; van der Burg, B.; Simetska, N.; Mangelsdorf, I. Structural features of endocrine active chemicals--A comparison of in vivo and in vitro data. Reprod. Toxicol. 2015, 55, 81–94. [Google Scholar] [CrossRef] [PubMed]
- Hsieh, J.-H.; Ryan, K.; Sedykh, A.; Lin, J.-A.; Shapiro, A.J.; Parham, F.; Behl, M. Application of Benchmark Concentration (BMC) Analysis on Zebrafish Data: A New Perspective for Quantifying Toxicity in Alternative Animal Models. Toxicol. Sci. 2019, 167, 92–104. [Google Scholar] [CrossRef] [PubMed]
- Hsieh, J.-H.; Nolte, S.; Hamm, J.T.; Wang, Z.; Roberts, G.K.; Schmitt, C.P.; Ryan, K.R. Systematic Evaluation of the Application of Zebrafish in Toxicology (SEAZIT): Developing a Data Analysis Pipeline for the Assessment of Developmental Toxicity with an Interlaboratory Study. Toxics 2023, 11, 407. [Google Scholar] [CrossRef] [PubMed]
- CompTox Chemicals Dashboard. Available online: https://comptox.epa.gov/dashboard/ (accessed on 15 January 2024).
- Integrated Chemical Environment. Available online: https://ice.ntp.niehs.nih.gov/ (accessed on 15 January 2024).
- Hamm, J.T.; Ceger, P.; Allen, D.; Stout, M.; Maull, E.A.; Baker, G.; Zmarowski, A.; Padilla, S.; Perkins, E.; Planchart, A.; et al. Characterizing sources of variability in zebrafish embryo screening protocols. ALTEX 2019, 36, 103–120. [Google Scholar] [CrossRef]
- Hsieh, J.H.; Behl, M.; Parham, F.; Ryan, K. Exploring the Influence of Experimental Design on Toxicity Outcomes in Zebrafish Embryo Tests. Toxicol. Sci. 2022, 188, 198–207. [Google Scholar] [CrossRef]
- Festing, M.F. A case for using inbred strains of laboratory animals in evaluating the safety of drugs. Food Cosmet. Toxicol. 1975, 13, 369–375. [Google Scholar] [CrossRef]
- Festing, M.F. Properties of inbred strains and outbred stocks, with special reference to toxicity testing. J. Toxicol. Environ. Health 1979, 5, 53–68. [Google Scholar] [CrossRef] [PubMed]
- Chia, R.; Achilli, F.; Festing, M.F.; Fisher, E.M. The origins and uses of mouse outbred stocks. Nat. Genet. 2005, 37, 1181–1186. [Google Scholar] [CrossRef] [PubMed]
- Festing, M.F. Improving toxicity screening and drug development by using genetically defined strains. In Mouse Models for Drug Discovery; Methods in Molecular Biology Book Series; Humana: New York, NY, USA, 2010; Volume 602, pp. 1–21. [Google Scholar] [CrossRef]
- de Esch, C.; van der Linde, H.; Slieker, R.; Willemsen, R.; Wolterbeek, A.; Woutersen, R.; De Groot, D. Locomotor activity assay in zebrafish larvae: Influence of age, strain and ethanol. Neurotoxicol. Teratol. 2012, 34, 425–433. [Google Scholar] [CrossRef] [PubMed]
- Pannia, E.; Tran, S.; Rampersad, M.; Gerlai, R. Acute ethanol exposure induces behavioural differences in two zebrafish (Danio rerio) strains: A time course analysis. Behav. Brain Res. 2014, 259, 174–185. [Google Scholar] [CrossRef]
- Karmaus, A.L.; Mansouri, K.; To, K.T.; Blake, B.; Fitzpatrick, J.; Strickland, J.; Patlewicz, G.; Allen, D.; Casey, W.; Kleinstreuer, N. Evaluation of Variability across Rat Acute Oral Systemic Toxicity Studies. Toxicol. Sci. 2022, 188, 34–47. [Google Scholar] [CrossRef]
- Schiwy, S.; Herber, A.K.; Hollert, H.; Brinkmann, M. New Insights into the Toxicokinetics of 3,4-Dichloroaniline in Early Life Stages of Zebrafish (Danio rerio). Toxics 2020, 8, 16. [Google Scholar] [CrossRef]
- Thessen, A.E.; Marvel, S.; Achenbach, J.C.; Fischer, S.; Haendel, M.A.; Hayward, K.; Klüver, N.; Könemann, S.; Legradi, J.; Lein, P.; et al. Implementation of Zebrafish Ontologies for Toxicology Screening. Front. Toxicol. 2022, 4, 817999. [Google Scholar] [CrossRef]


| Lab A | Lab B | Lab C |
|---|---|---|
| Abnormal_heartbeat | Abnormal axial bend (AXIS) | Axis__curvature_of_body_axis |
| Abnormal_length | Abnormal brain region (BRN_) | Craniofacial__edema |
| Abnormal_pigmentation | Abnormal notochord (NC__) | Craniofacial__jaw_defects |
| Absence_heartbeat | Abnormal swim bladder, muscle pattern, blood circulation (MUSC) | Craniofacial__snout_defects |
| Altered_jaw_morphology | Abnormal touch response in the caudal fin (TCHR) | fin_absence |
| Altered_snout | Defects in the craniofacial region (CRAN) | necrosis |
| Curved_axis | Defects in the lower trunk region (LTRK) | notochord_defect |
| Decreased_absent_pigmentation | Defects on the skin (SKIN) | otoliths_defects |
| Delayed_Hatching | Edema of the heart, yolk sac or brain region (EDEM) | scoliosis |
| Malformed__disorganized_or_missing_somites | tail_bending | |
| Malformed_or_missing_caudal_fin | Unhatched | |
| Malformed_or_missing_otic_vesicle | Yolk_sac__Edema | |
| Malformed_or_missing_trunk | ||
| Notochord_malformation | ||
| Others | ||
| Presence_of_head_Edema | ||
| Presence_of_pericardial_Edema | ||
| Smaller_abnormal_eye_shape | ||
| Smaller_abnormal_head_shape | ||
| Yolk_opacity | ||
| Yolk_sac_Edema |
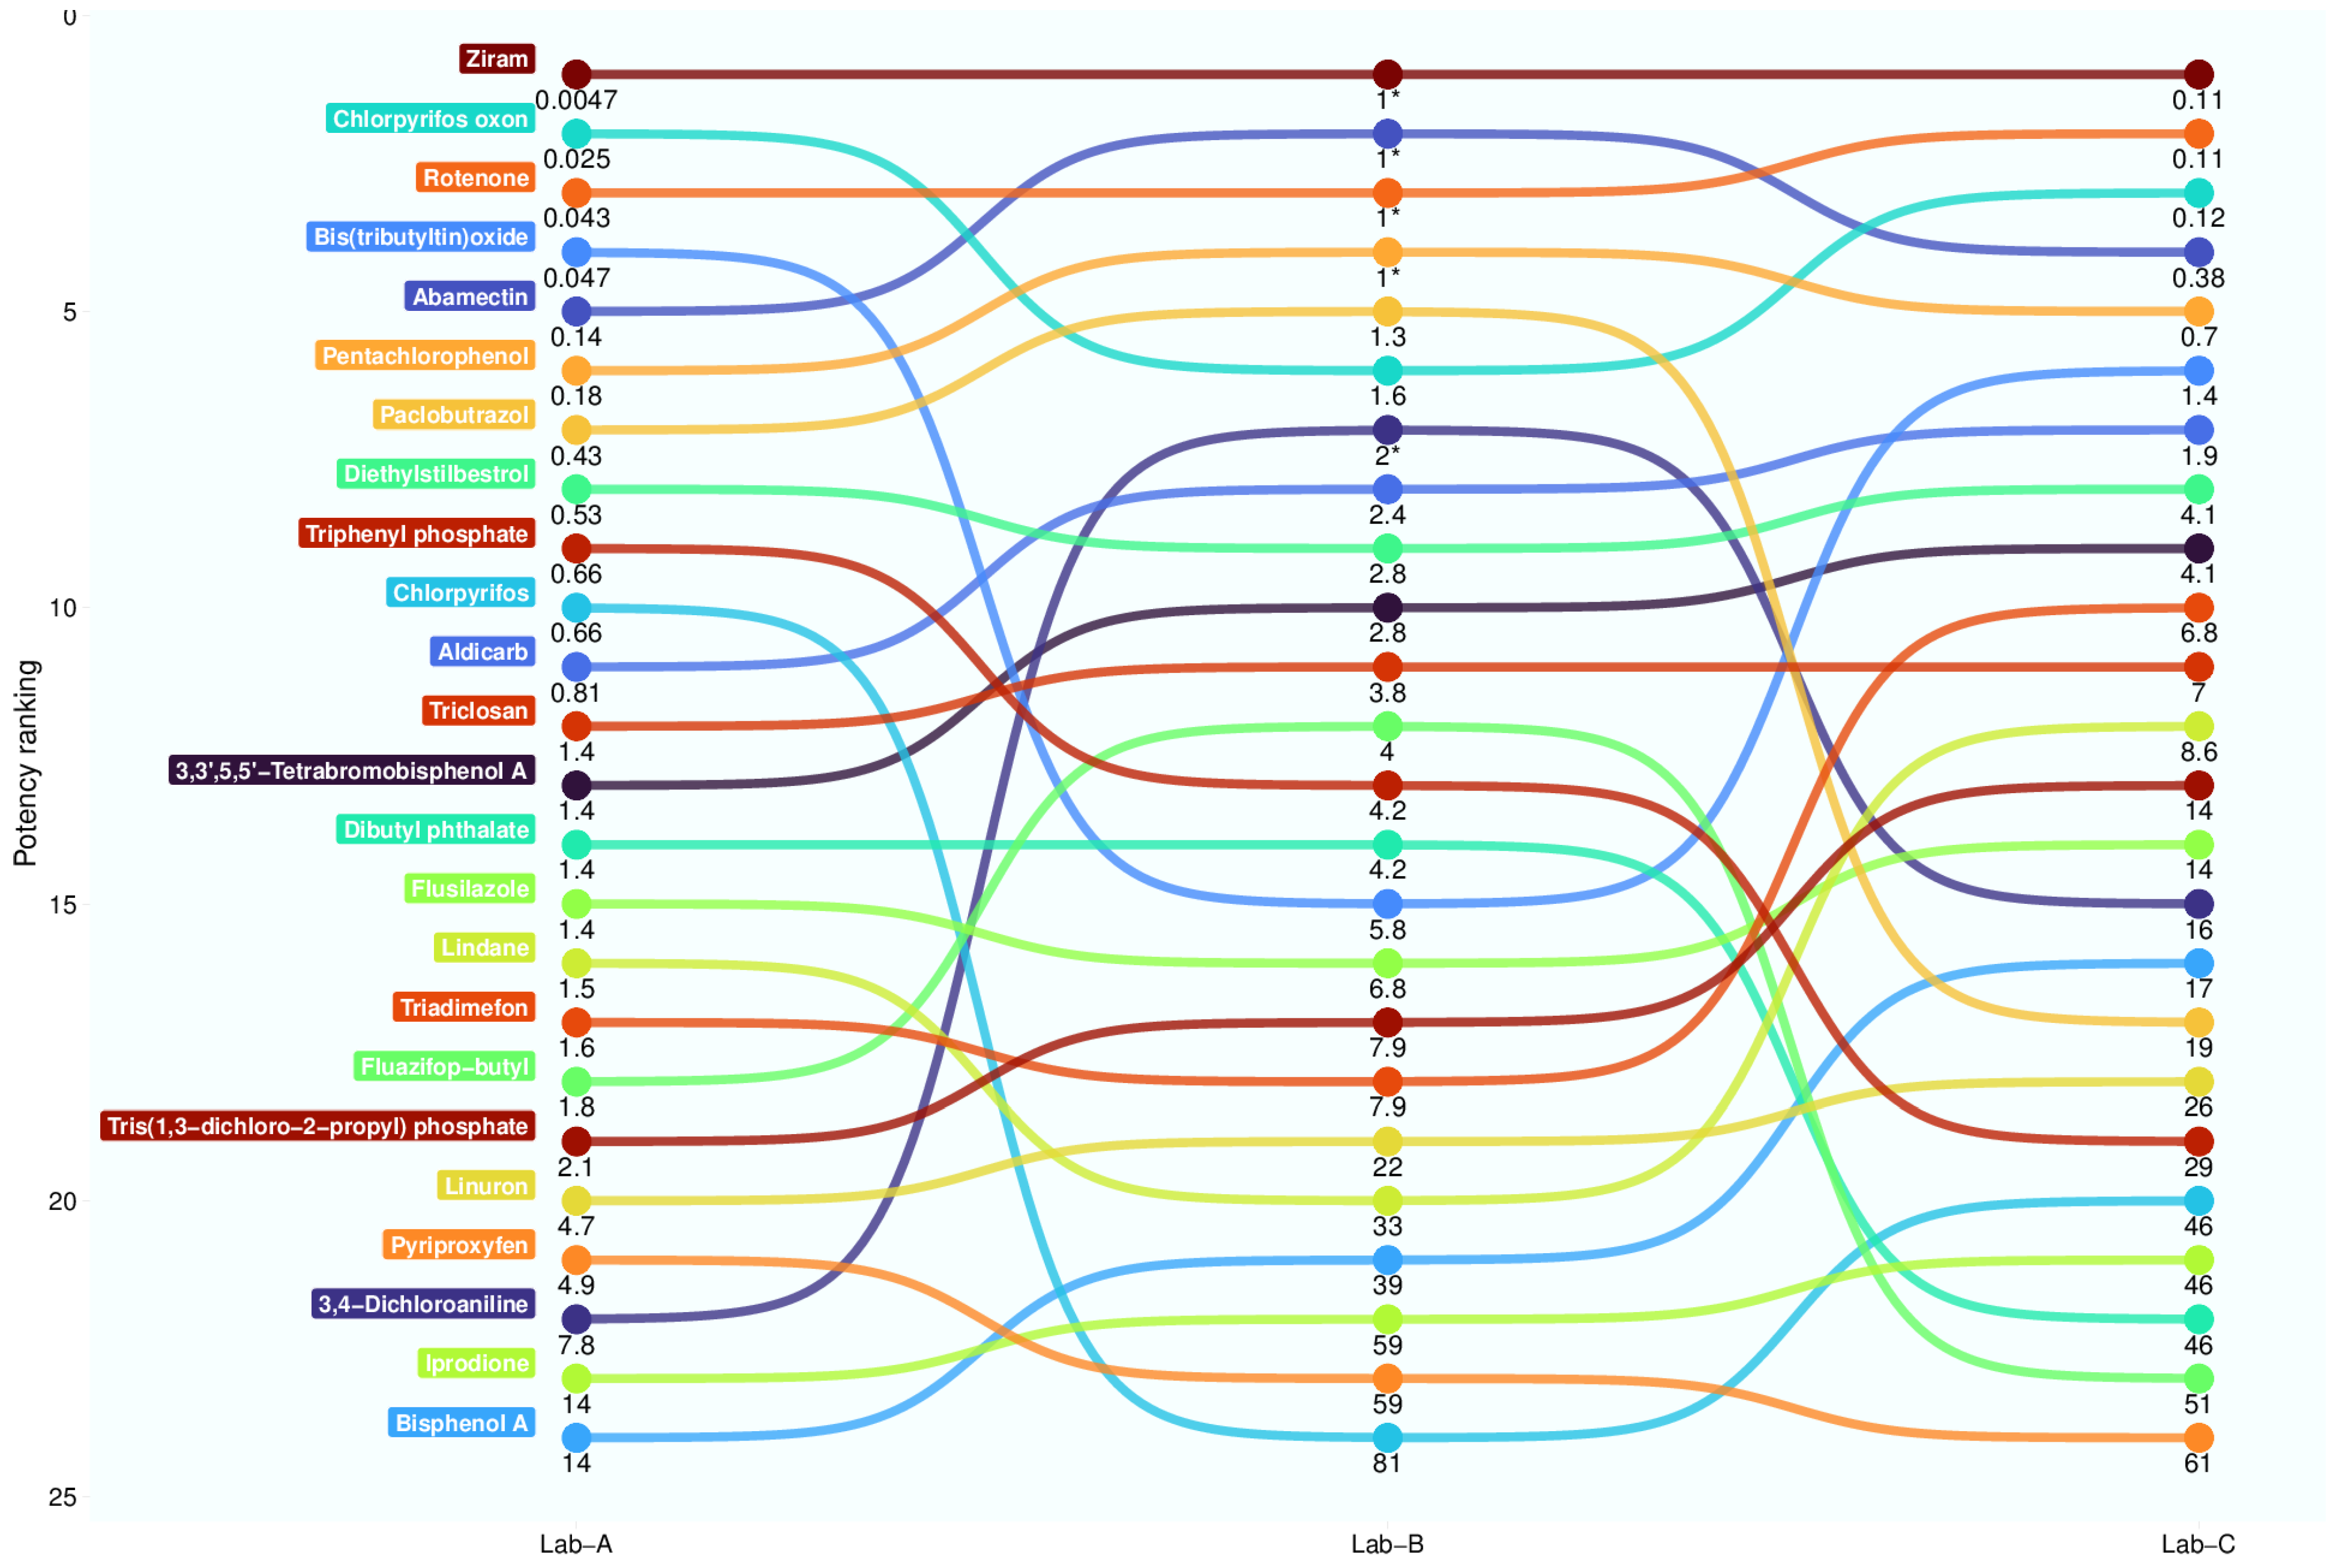
| Substance | CASRN | Lab A_SR-C | Lab B_S-DC | Lab C_S-C |
|---|---|---|---|---|
| 3,3′,5,5′-tetrabromobisphenol A | 79-94-7 | 1.40 1 | 2.80 | 4.10 |
| 3,4-dichloroaniline | 95-76-1 | 7.80 | 2.00 * | 16.00 |
| 6-propyl-2-thiouracil | 51-52-5 | Inactive (100) | Inactive (100) | Inactive (100) |
| Abamectin | 71751-41-2 | 0.14 | 1.00 * | 0.38 |
| Acetaldehyde | 75-07-0 | Inactive (100) | Inactive (100) | Inactive (100) |
| Aldicarb 2 | 116-06-3 | 0.81 | 2.40 | 1.90 |
| Amoxicillin | 26787-78-0 | 81.00 | Inactive (64) | 65.00 |
| Aspirin | 50-78-2 | Inactive (100) | Inactive (100) | 14.00 |
| Atrazine | 1912-24-9 | 49.00 | Inactive (100) | Inactive (100) |
| Bis(tributyltin)oxide | 56-35-9 | 0.047 | 5.80 | 1.40 |
| Bisphenol A 2 | 80-05-7 | 14.00 | 39.00 | 17.00 |
| Caffeine | 58-08-2 | Inactive (100) | Inactive (100) | Inactive (100) |
| Chlorpyrifos | 2921-88-2 | 0.66 | 81.00 | 46.00 |
| Chlorpyrifos oxon | 5598-15-2 | 0.025 | 1.60 | 0.12 |
| Dibenz(a,h)anthracene | 53-70-3 | 0.081 | Inactive (64) | Inactive (100) |
| Dibutyl phthalate | 84-74-2 | 1.40 | 4.20 | 46.00 |
| Diethylstilbestrol | 56-53-1 | 0.53 | 2.80 | 4.10 |
| Fluazifop-butyl | 69806-50-4 | 1.80 | 4.00 | 51.00 |
| Flusilazole | 85509-19-9 | 1.40 | 6.80 | 14.00 |
| Hydroxyurea | 127-07-1 | Inactive (100) | Inactive (100) | Inactive (100) |
| Iprodione | 36734-19-7 | 14 | 59 | 46 |
| Lindane | 58-89-9 | 1.5 | 33 | 8.6 |
| Linuron | 330-55-2 | 4.7 | 22 | 26 |
| Paclobutrazol | 76738-62-0 | 0.43 | 1.3 | 19 |
| Pentachlorophenol | 87-86-5 | 0.18 | 1 * | 0.7 |
| Phorate | 298-02-2 | 1.7 | Inactive (100) | Inactive (100) |
| Propofol | 2078-54-8 | 0.49 | Inactive (100) | Inactive (100) |
| Pyrene | 129-00-0 | 4.3 | 39 | Inactive (100) |
| Pyriproxyfen | 95737-68-1 | 4.9 | 59 | 61 |
| Resorcinol | 108-46-3 | Inactive (100) | Inactive (100) | Inactive (100) |
| Rotenone | 83-79-4 | 0.043 | 1 * | 0.11 |
| Sodium valproate | 1069-66-5 | Inactive (100) | Inactive (100) | 4.1 |
| Thalidomide | 50-35-1 | Inactive (100) | Inactive (100) | Inactive (100) |
| Triadimefon | 43121-43-3 | 1.6 | 7.9 | 6.8 |
| Triclosan | 3380-34-5 | 1.4 | 3.8 | 7 |
| Triphenyl phosphate | 115-86-6 | 0.66 | 4.2 | 29 |
| Tris(1,3-dichloro-2-propyl) phosphate | 13674-87-8 | 2.1 | 7.9 | 14 |
| Valproic acid 2 | 99-66-1 | 76 | Inactive (100) | 4.1 |
| Ziram | 137-30-4 | 0.0047 | 1 * | 0.11 |
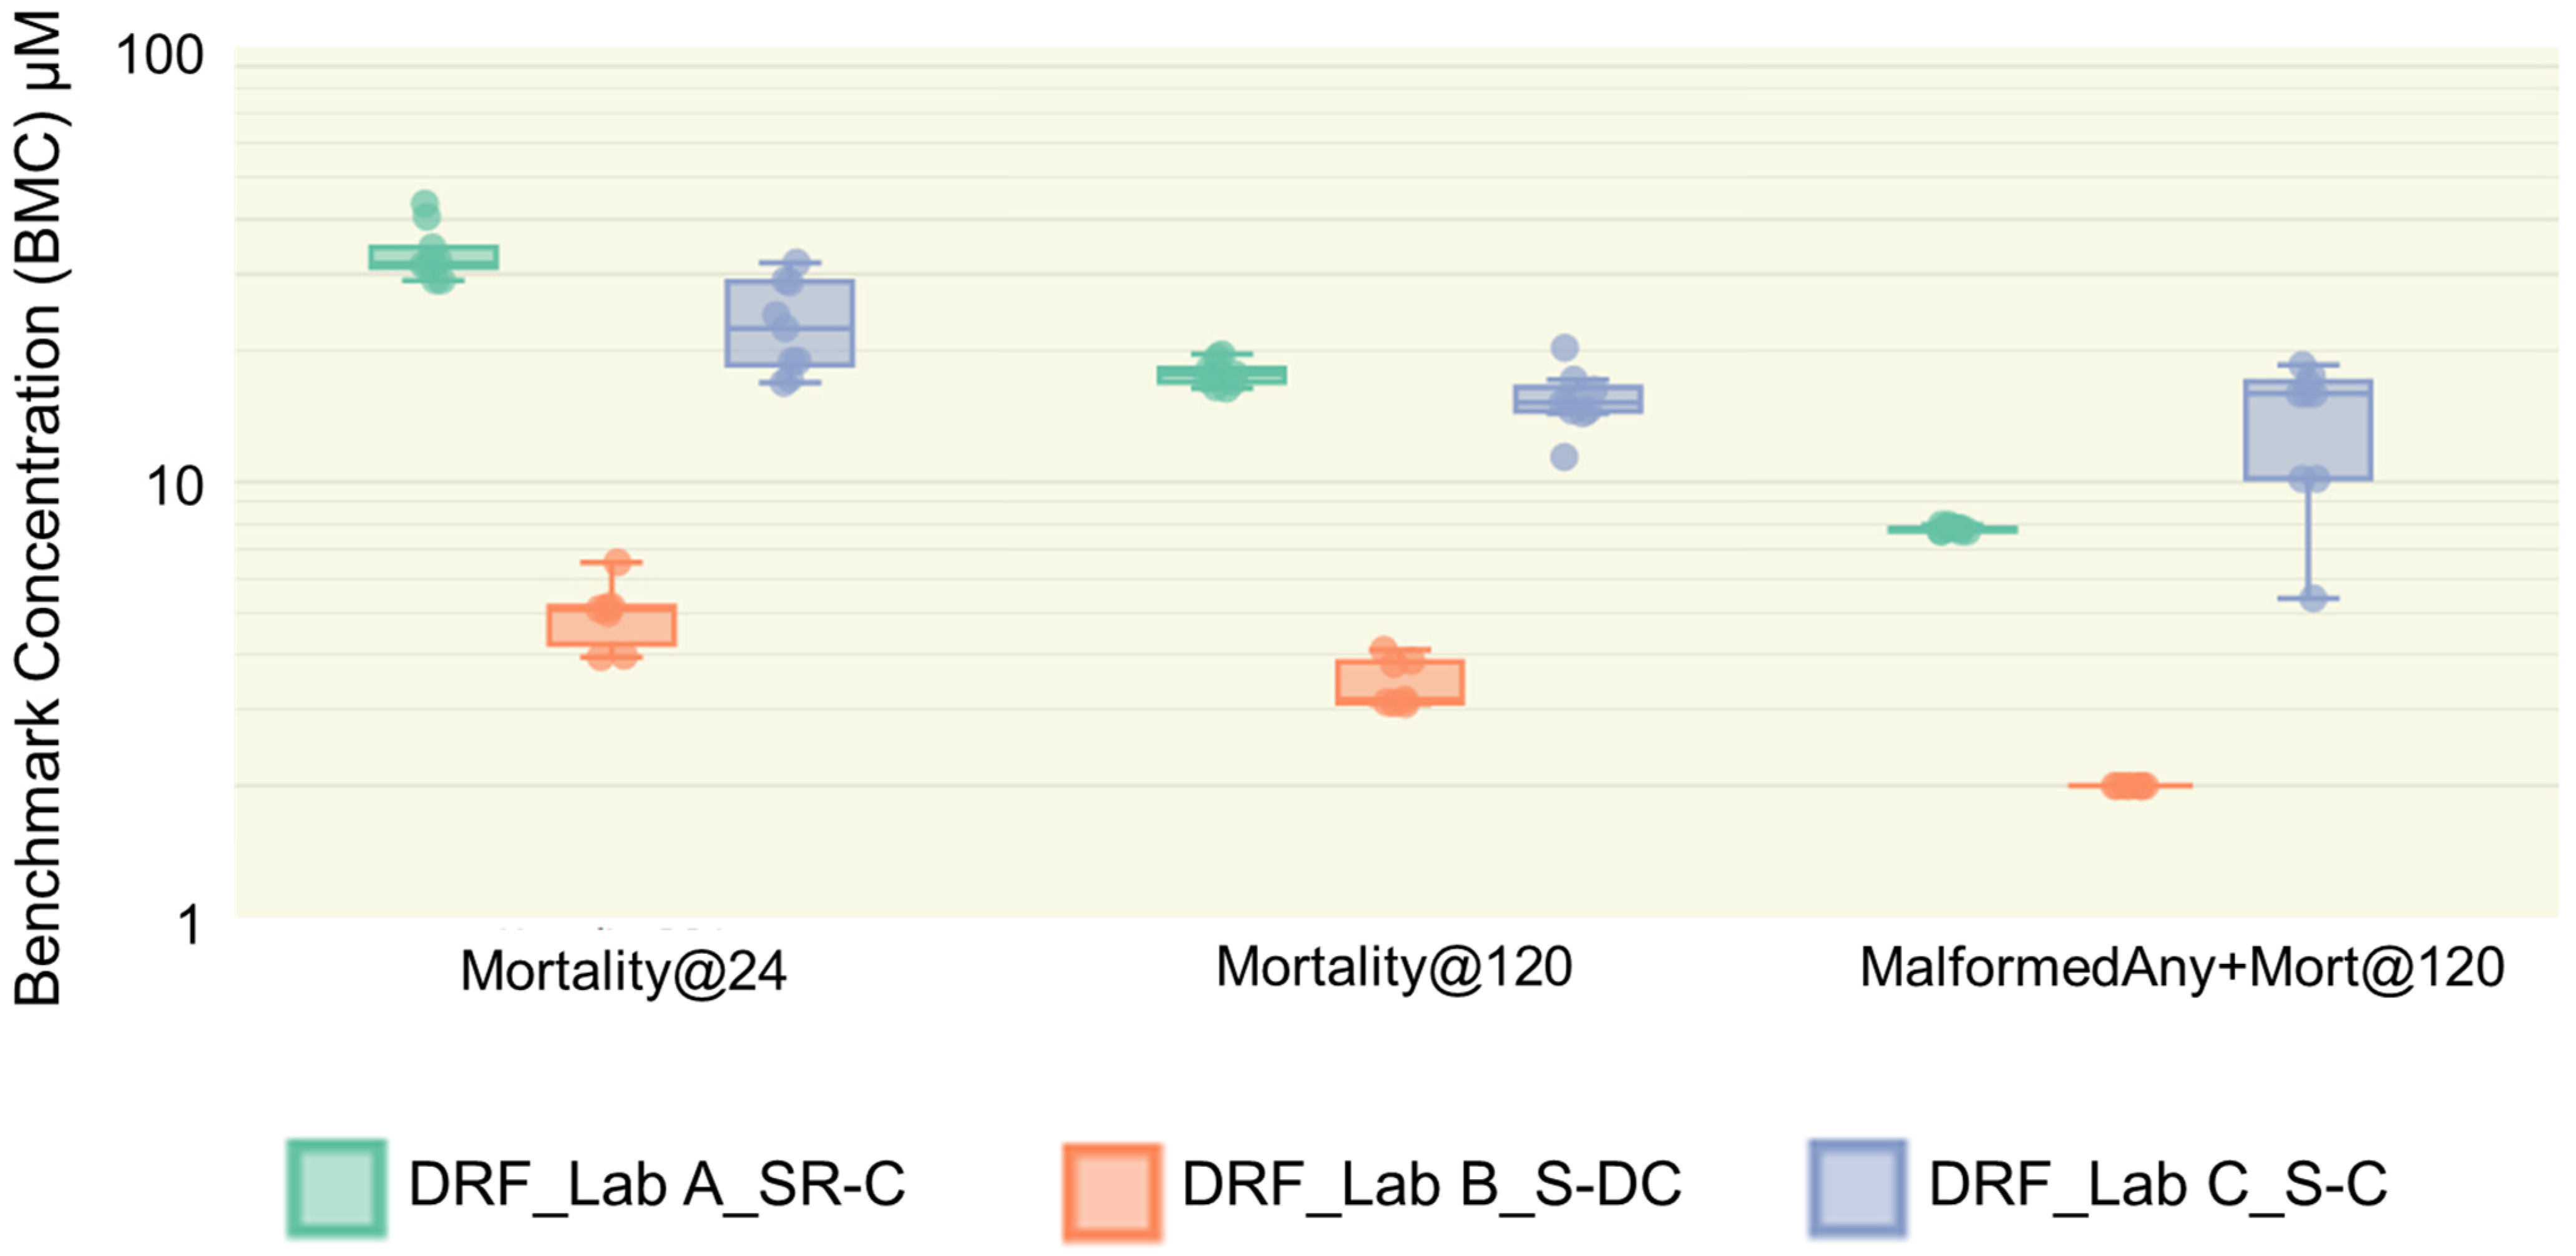
| Mortality@120 | MalformedAny+Mort@120 | |||||
|---|---|---|---|---|---|---|
| Lab-A_SR-C | Lab-B_S-DC | Lab-C_S-C | Lab-A_SR-C | Lab-B_S-DC | Lab-C_S-C | |
| Aldicarb Duplicate #1 | Inactive ** 90.45 90.45 | Inactive Inactive Inactive | Inactive Inactive Inactive | 1.39 * 0.53 1.44 | 1.32 1.42 2.24 | 2.09 1.31 2.58 |
| Aldicarb Duplicate #2 | 90.45 86.41 Inactive | Inactive Inactive Inactive | Inactive Inactive Inactive | 0.81 0.81 0.58 | 2.52 2.52 3.58 | 2.32 1.57 1.75 |
| Bisphenol A Duplicate #1 | 40.54 40.54 40.54 | 61.05 79.16 55.75 | 38.18 38.18 38.18 | 13.90 14.37 13.90 | 32.86 40.29 39.49 | 45.73 18.19 19.24 |
| Bisphenol A Duplicate #2 | 40.54 *** 40.54 40.54 | 55.75 58.52 46.38 | 38.18 38.18 17.47 | 13.90 13.90 8.10 | 39.49 39.49 39.49 | 16.45 14.48 16.45 |
| Valproic Acid Duplicate#1 | Inactive Inactive Inactive | Inactive Inactive Inactive | 11.47 11.47 3.63 | 46.65 58.17 58.17 | Inactive Inactive 87.87 | 0.98 4.12 4.12 |
| Valproic Acid Duplicate #2 | Inactive Inactive Inactive | Inactive Inactive Inactive | 11.47 38.18 6.54 | Inactive Inactive Inactive | Inactive Inactive Inactive | 20.94 1.75 4.12 |
Disclaimer/Publisher’s Note: The statements, opinions and data contained in all publications are solely those of the individual author(s) and contributor(s) and not of MDPI and/or the editor(s). MDPI and/or the editor(s) disclaim responsibility for any injury to people or property resulting from any ideas, methods, instructions or products referred to in the content. |
© 2024 by the authors. Licensee MDPI, Basel, Switzerland. This article is an open access article distributed under the terms and conditions of the Creative Commons Attribution (CC BY) license (https://creativecommons.org/licenses/by/4.0/).
Share and Cite
Hamm, J.T.; Hsieh, J.-H.; Roberts, G.K.; Collins, B.; Gorospe, J.; Sparrow, B.; Walker, N.J.; Truong, L.; Tanguay, R.L.; Dyballa, S.; et al. Interlaboratory Study on Zebrafish in Toxicology: Systematic Evaluation of the Application of Zebrafish in Toxicology’s (SEAZIT’s) Evaluation of Developmental Toxicity. Toxics 2024, 12, 93. https://doi.org/10.3390/toxics12010093
Hamm JT, Hsieh J-H, Roberts GK, Collins B, Gorospe J, Sparrow B, Walker NJ, Truong L, Tanguay RL, Dyballa S, et al. Interlaboratory Study on Zebrafish in Toxicology: Systematic Evaluation of the Application of Zebrafish in Toxicology’s (SEAZIT’s) Evaluation of Developmental Toxicity. Toxics. 2024; 12(1):93. https://doi.org/10.3390/toxics12010093
Chicago/Turabian StyleHamm, Jon T., Jui-Hua Hsieh, Georgia K. Roberts, Bradley Collins, Jenni Gorospe, Barney Sparrow, Nigel J. Walker, Lisa Truong, Robyn L. Tanguay, Sylvia Dyballa, and et al. 2024. "Interlaboratory Study on Zebrafish in Toxicology: Systematic Evaluation of the Application of Zebrafish in Toxicology’s (SEAZIT’s) Evaluation of Developmental Toxicity" Toxics 12, no. 1: 93. https://doi.org/10.3390/toxics12010093
APA StyleHamm, J. T., Hsieh, J.-H., Roberts, G. K., Collins, B., Gorospe, J., Sparrow, B., Walker, N. J., Truong, L., Tanguay, R. L., Dyballa, S., Miñana, R., Schiavone, V., Terriente, J., Weiner, A., Muriana, A., Quevedo, C., & Ryan, K. R. (2024). Interlaboratory Study on Zebrafish in Toxicology: Systematic Evaluation of the Application of Zebrafish in Toxicology’s (SEAZIT’s) Evaluation of Developmental Toxicity. Toxics, 12(1), 93. https://doi.org/10.3390/toxics12010093