


Effects of BPA Exposure and Recovery on the Expression of Genes Involved in the Hepatic Lipid Metabolism in Male Mice

Abstract
:
1. Introduction
2. Materials and Methods
2.1. Chemicals and Materials
2.2. BPA Exposure and Recovery
2.3. Cell Culture and Treatment
2.4. Measurements
2.5. Histological Analysis
2.6. RT-qPCR Analysis
2.7. Western Blot Analyses
2.8. Statistical Analysis
3. Results
3.1. BPA Exposure Induced Obesity in Mice
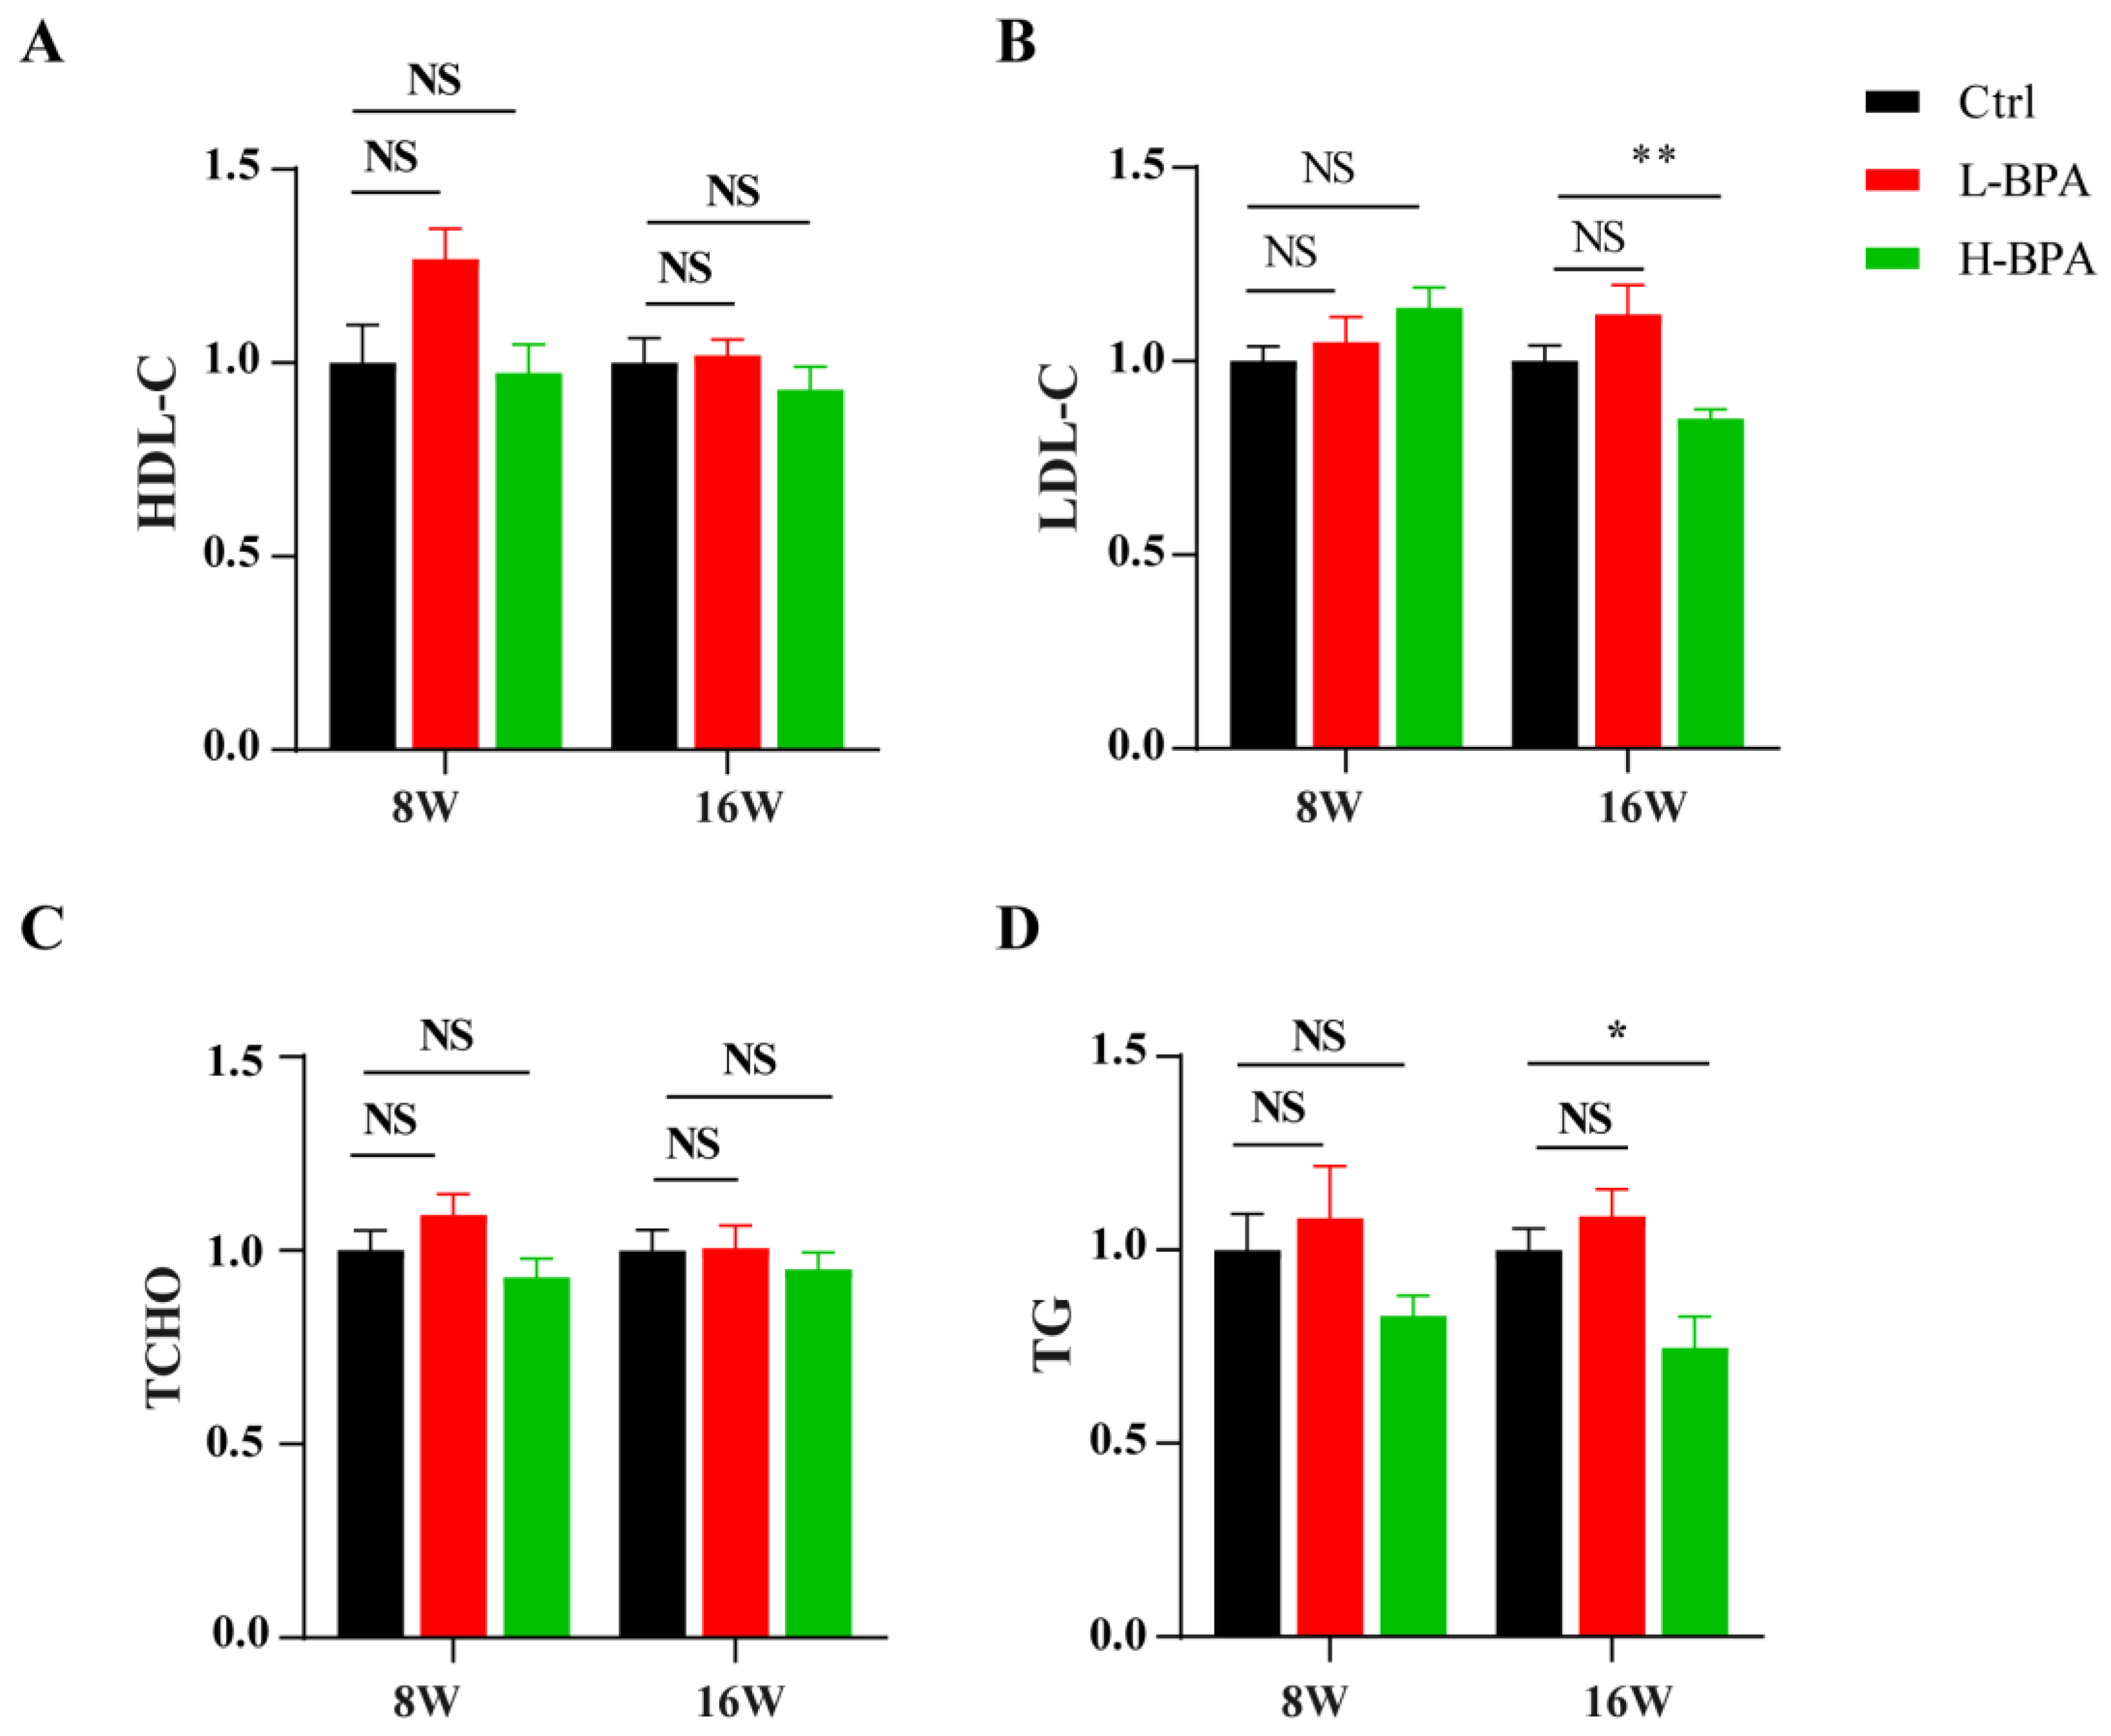
3.2. BPA Exposure Altered the Homeostasis of Metabolic Outcomes in Mice
3.3. BPA Exposure Disrupted Hepatic Lipid Metabolism in Mice
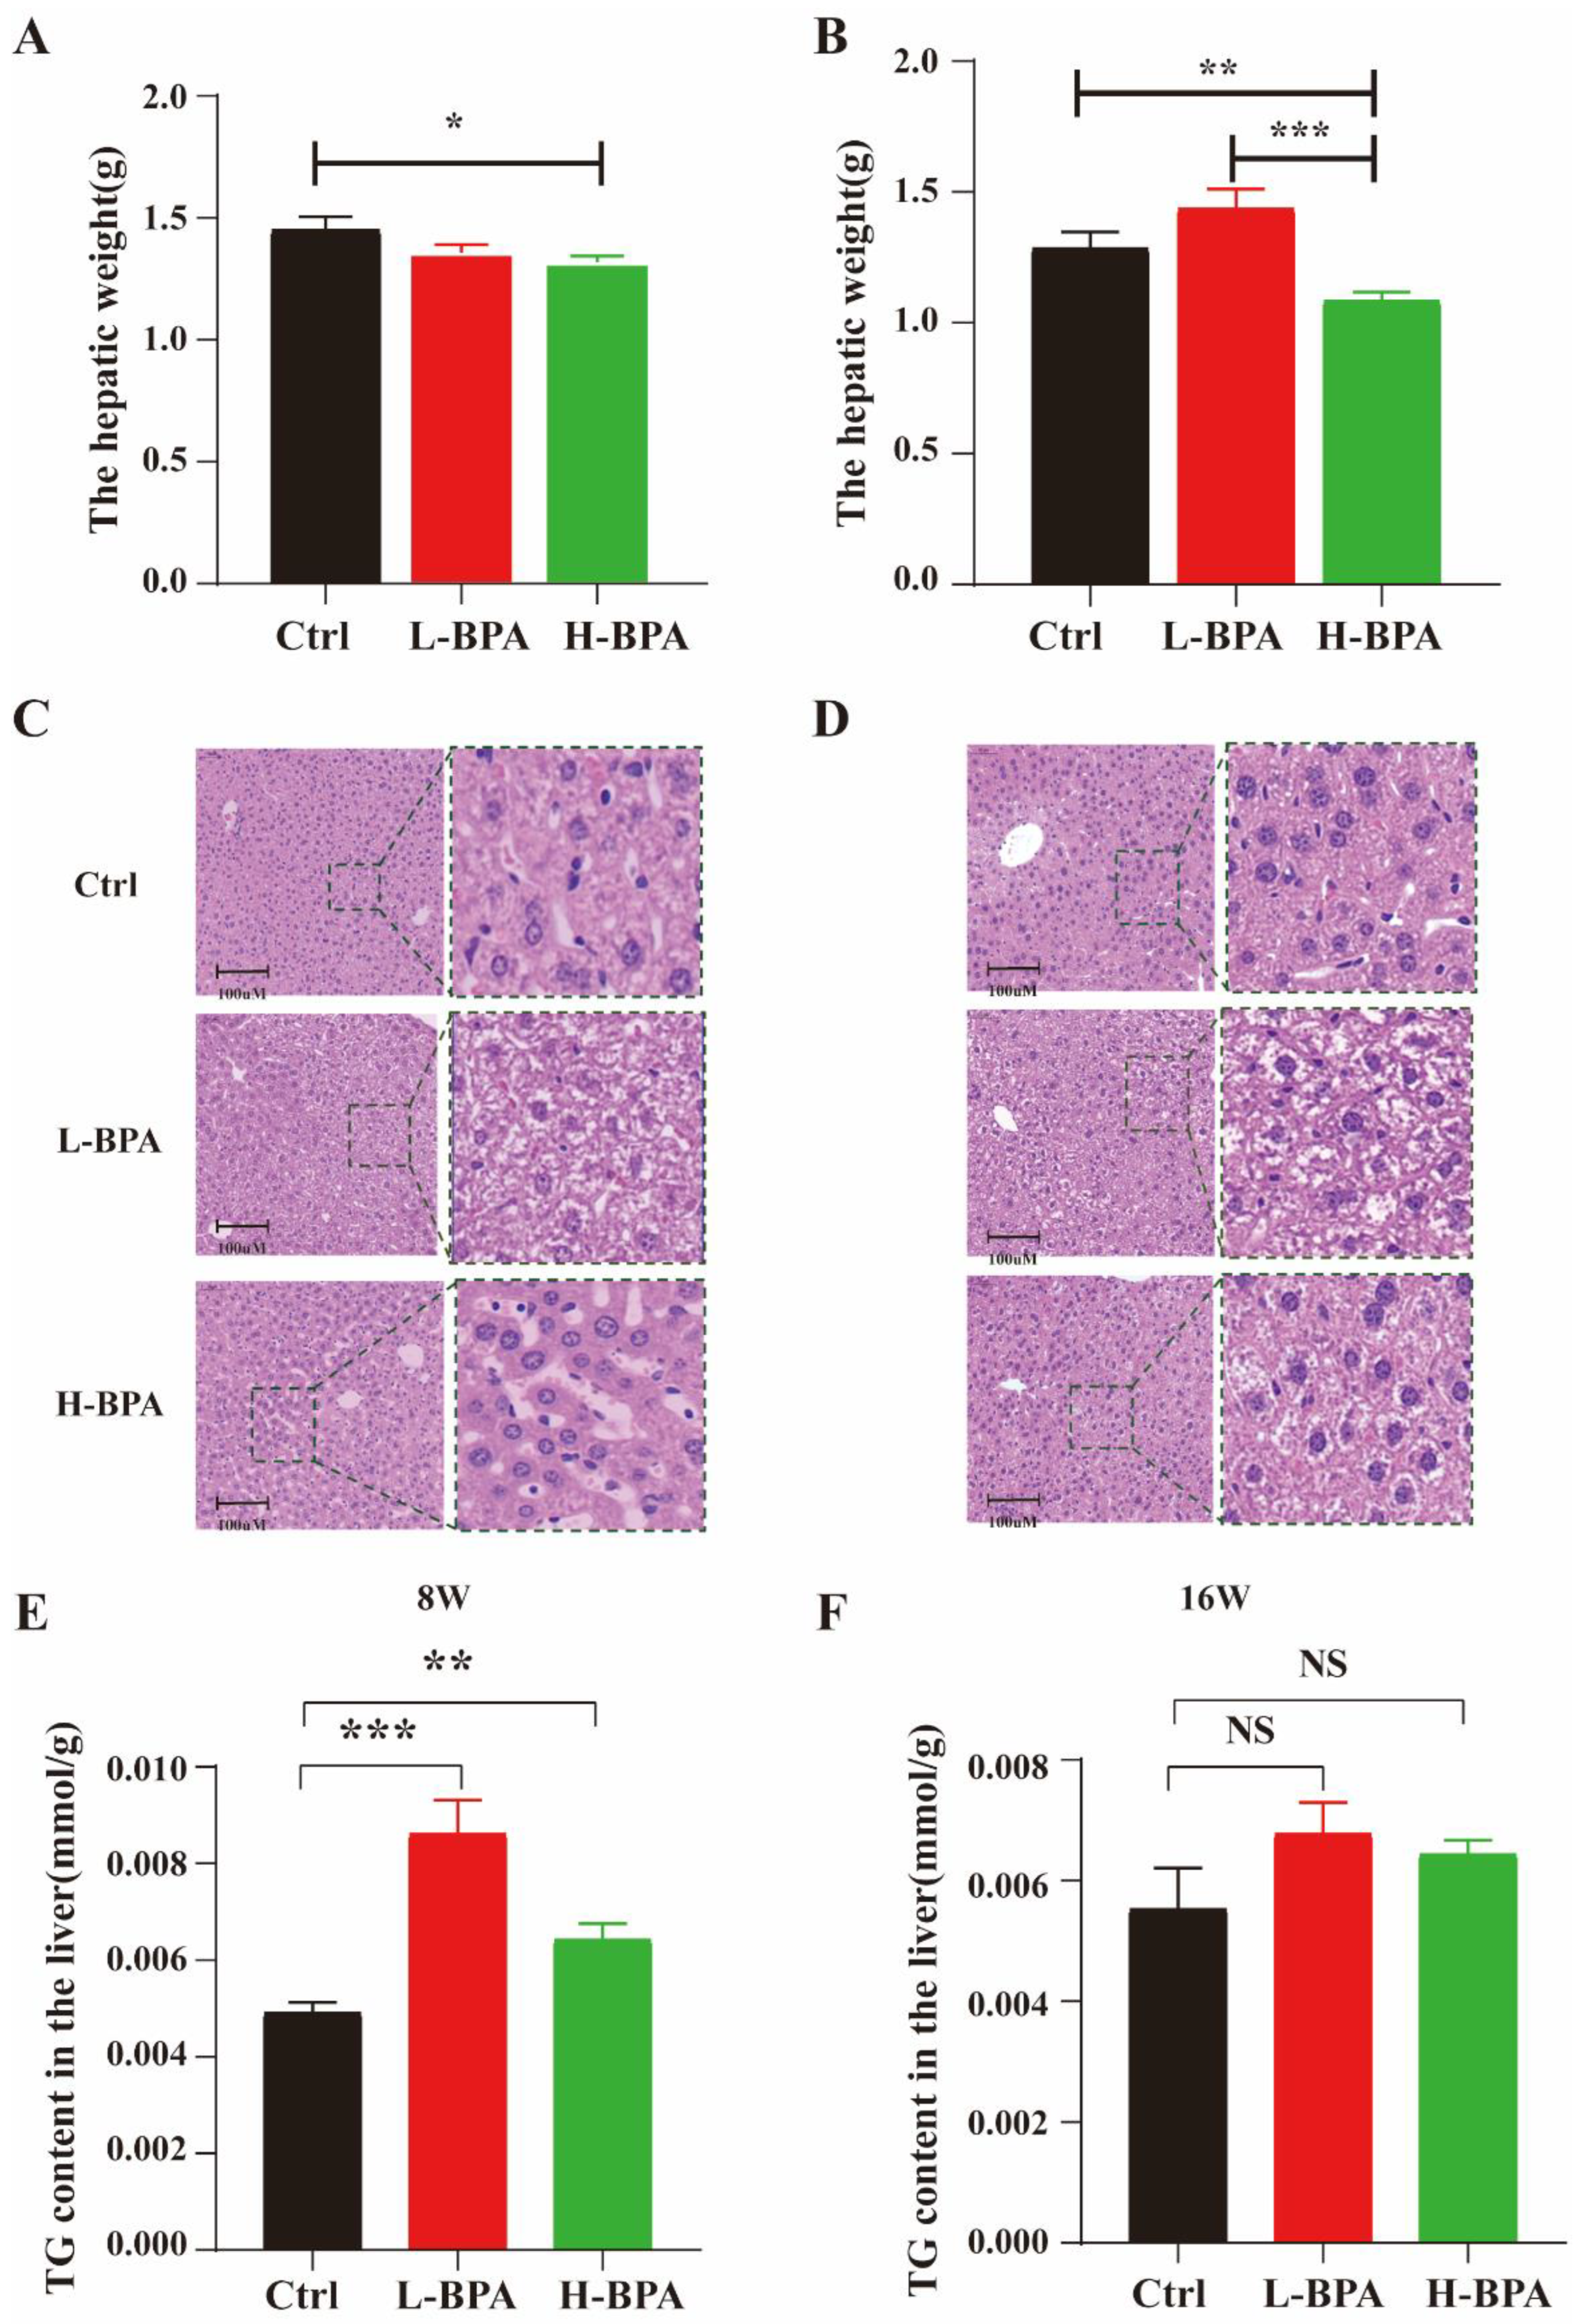
3.3.1. BPA Exposure Induced Liver Injury
3.3.2. BPA Exposure Altered the Genes Expression in Male Mice
3.3.3. BPA Exposure Induced Hepatic Inflammation
3.3.4. Effects of BPA Exposure and Recovery on the Expression of SCD1 and APOD
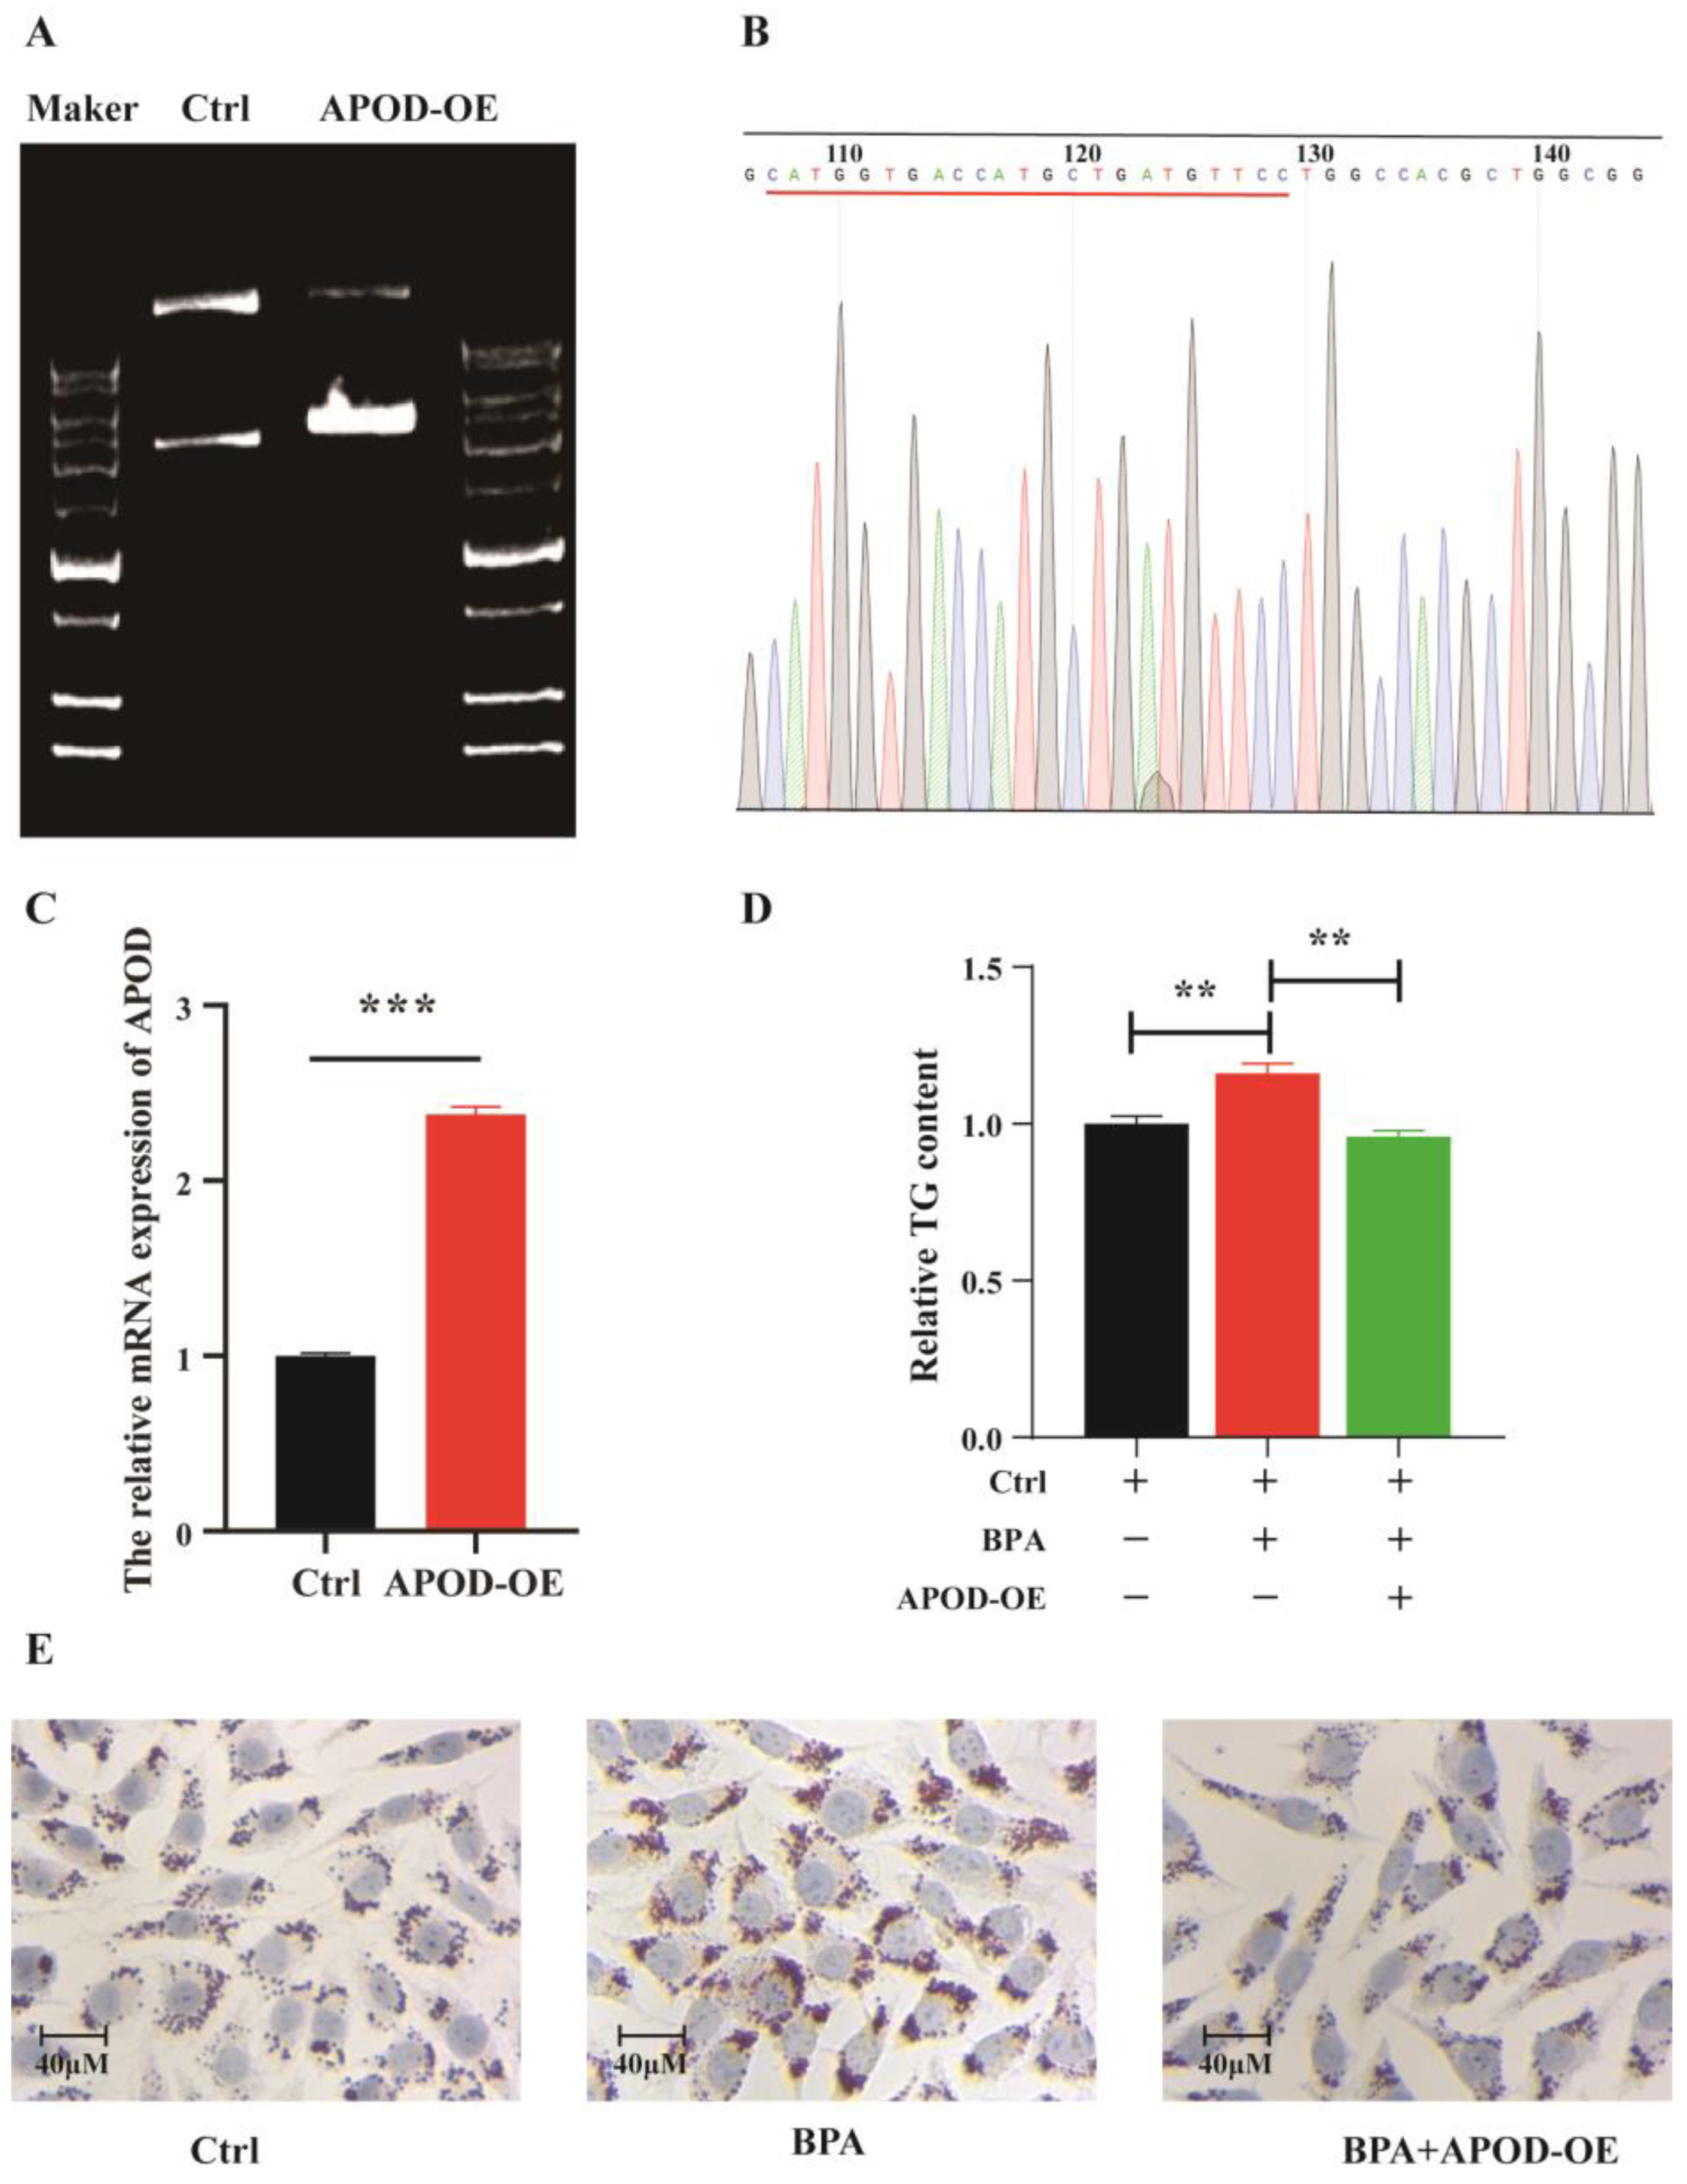
3.4. Effect of APOD Over-Expression on BPA-Induced Dysregulation of Lipid Homeostasis
4. Discussion
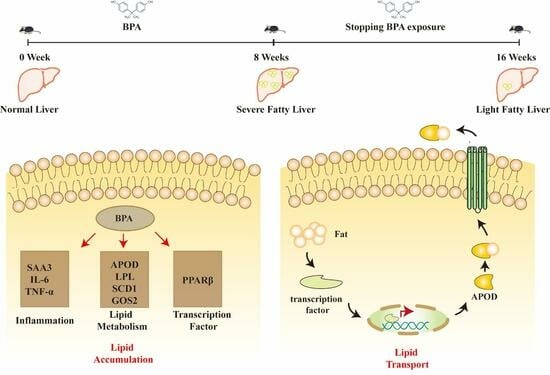
5. Conclusions
Supplementary Materials
Author Contributions
Funding
Institutional Review Board Statement
Informed Consent Statement
Data Availability Statement
Acknowledgments
Conflicts of Interest
References
- Farrell, G.C.; Larter, C.Z. Nonalcoholic fatty liver disease: From steatosis to cirrhosis. Hepatology 2006, 43, S99–S112. [Google Scholar] [CrossRef] [PubMed]
- Al-Eryani, L.; Wahlang, B.; Falkner, K.C.; Guardiola, J.J.; Clair, H.B.; Prough, R.A.; Cave, M. Identification of Environmental Chemicals Associated with the Development of Toxicant-associated Fatty Liver Disease in Rodents. Toxicol. Pathol. 2015, 43, 482–497. [Google Scholar] [CrossRef]
- Špačková, J.; Oliveira, D.; Puškár, M.; Ďurovcová, I.; Gaplovská-Kyselá, K.; Oliveira, R.; Ševčovičová, A. Endocrine-Independent Cytotoxicity of Bisphenol A Is Mediated by Increased Levels of Reactive Oxygen Species and Affects Cell Cycle Progression. J. Agric. Food Chem. 2020, 68, 869–875. [Google Scholar] [CrossRef] [PubMed]
- Diamanti-Kandarakis, E.; Bourguignon, J.P.; Giudice, L.C.; Hauser, R.; Prins, G.S.; Soto, A.M.; Zoeller, R.T.; Gore, A.C. Endocrine-disrupting chemicals: An Endocrine Society scientific statement. Endocr. Rev. 2009, 30, 293–342. [Google Scholar] [CrossRef]
- Karsauliya, K.; Bhateria, M.; Sonker, A.; Singh, S.P. Determination of Bisphenol Analogues in Infant Formula Products from India and Evaluating the Health Risk in Infants Asssociated with Their Exposure. J. Agric. Food Chem. 2021, 69, 3932–3941. [Google Scholar] [CrossRef] [PubMed]
- Trasande, L.; Attina, T.M.; Blustein, J. Association between urinary bisphenol A concentration and obesity prevalence in children and adolescents. JAMA 2012, 308, 1113–1121. [Google Scholar] [CrossRef]
- Grohs, M.N.; Reynolds, J.E.; Liu, J.; Martin, J.W.; Pollock, T.; Lebel, C.; Dewey, D. Prenatal maternal and childhood bisphenol a exposure and brain structure and behavior of young children. Environ. Health 2019, 18, 85. [Google Scholar] [CrossRef]
- Hu, C.Y.; Li, F.L.; Hua, X.G.; Jiang, W.; Mao, C.; Zhang, X.J. The association between prenatal bisphenol A exposure and birth weight: A meta-analysis. Reprod. Toxicol. 2018, 79, 21–31. [Google Scholar] [CrossRef]
- Long, Z.; Fan, J.; Wu, G.; Liu, X.; Wu, H.; Liu, J.; Chen, Y.; Su, S.; Cheng, X.; Xu, Z.; et al. Gestational bisphenol A exposure induces fatty liver development in male offspring mice through the inhibition of HNF1b and upregulation of PPARγ. Cell Biol. Toxicol. 2021, 37, 65–84. [Google Scholar] [CrossRef]
- Rubin, B.S.; Soto, A.M. Bisphenol A: Perinatal exposure and body weight. Mol. Cell Endocrinol. 2009, 304, 55–62. [Google Scholar] [CrossRef]
- Fang, R.; Yang, S.; Gu, X.; Li, C.; Bi, N.; Wang, H.L. Early-life exposure to bisphenol A induces dysregulation of lipid homeostasis by the upregulation of SCD1 in male mice. Environ. Pollut. 2022, 304, 119201. [Google Scholar] [CrossRef] [PubMed]
- Shimpi, P.C.; More, V.R.; Paranjpe, M.; Donepudi, A.C.; Goodrich, J.M.; Dolinoy, D.C.; Rubin, B.; Slitt, A.L. Hepatic Lipid Accumulation and Nrf2 Expression following Perinatal and Peripubertal Exposure to Bisphenol A in a Mouse Model of Nonalcoholic Liver Disease. Environ. Health Perspect. 2017, 125, 087005. [Google Scholar] [CrossRef] [PubMed]
- Verstraete, S.G.; Wojcicki, J.M.; Perito, E.R.; Rosenthal, P. Bisphenol a increases risk for presumed non-alcoholic fatty liver disease in Hispanic adolescents in NHANES 2003-2010. Environ. Health 2018, 17, 12. [Google Scholar] [CrossRef]
- Marmugi, A.; Ducheix, S.; Lasserre, F.; Polizzi, A.; Paris, A.; Priymenko, N.; Bertrand-Michel, J.; Pineau, T.; Guillou, H.; Martin, P.G.; et al. Low doses of bisphenol A induce gene expression related to lipid synthesis and trigger triglyceride accumulation in adult mouse liver. Hepatology 2012, 55, 395–407. [Google Scholar] [CrossRef] [PubMed]
- Li, Q.; Zhang, H.; Zou, J.; Mai, H.; Su, D.; Feng, X.; Feng, D. Bisphenol A exposure induces cholesterol synthesis and hepatic steatosis in C57BL/6 mice by down-regulating the DNA methylation levels of SREBP-2. Food Chem. Toxicol. 2019, 133, 110786. [Google Scholar] [CrossRef] [PubMed]
- Kim, K.Y.; Lee, E.; Kim, Y. The Association between Bisphenol A Exposure and Obesity in Children-A Systematic Review with Meta-Analysis. Int. J. Environ. Res. Public Health 2019, 16, 2521. [Google Scholar] [CrossRef]
- Lind, T.; Lejonklou, M.H.; Dunder, L.; Kushnir, M.M.; Öhman-Mägi, C.; Larsson, S.; Melhus, H.; Lind, P.M. Developmental low-dose exposure to bisphenol A induces chronic inflammation, bone marrow fibrosis and reduces bone stiffness in female rat offspring only. Environ. Res. 2019, 177, 108584. [Google Scholar] [CrossRef]
- Yang, S.; Zhang, A.; Li, T.; Gao, R.; Peng, C.; Liu, L.; Cheng, Q.; Mei, M.; Song, Y.; Xiang, X.; et al. Dysregulated Autophagy in Hepatocytes Promotes Bisphenol A-Induced Hepatic Lipid Accumulation in Male Mice. Endocrinology 2017, 158, 2799–2812. [Google Scholar] [CrossRef]
- Fan, J.G.; Zhu, J.; Li, X.J.; Chen, L.; Lu, Y.S.; Li, L.; Dai, F.; Li, F.; Chen, S.Y. Fatty liver and the metabolic syndrome among Shanghai adults. J. Gastroenterol. Hepatol. 2005, 20, 1825–1832. [Google Scholar] [CrossRef]
- Feng, D.; Zhang, H.; Jiang, X.; Zou, J.; Li, Q.; Mai, H.; Su, D.; Ling, W.; Feng, X. Bisphenol A exposure induces gut microbiota dysbiosis and consequent activation of gut-liver axis leading to hepatic steatosis in CD-1 mice. Environ. Pollut. 2020, 265, 114880. [Google Scholar] [CrossRef]
- Vom Saal, F.S.; Nagel, S.C.; Coe, B.L.; Angle, B.M.; Taylor, J.A. The estrogenic endocrine disrupting chemical bisphenol A (BPA) and obesity. Mol. Cell Endocrinol. 2012, 354, 74–84. [Google Scholar] [CrossRef] [PubMed]
- Sun, L.; Ling, Y.; Jiang, J.; Wang, D.; Wang, J.; Li, J.; Wang, X.; Wang, H. Differential mechanisms regarding triclosan vs. bisphenol A and fluorene-9-bisphenol induced zebrafish lipid-metabolism disorders by RNA-Seq. Chemosphere 2020, 251, 126318. [Google Scholar] [CrossRef] [PubMed]
- Zou, Y.; Wang, Y.N.; Ma, H.; He, Z.H.; Tang, Y.; Guo, L.; Liu, Y.; Ding, M.; Qian, S.W.; Tang, Q.Q. SCD1 promotes lipid mobilization in subcutaneous white adipose tissue. J. Lipid Res. 2020, 61, 1589–1604. [Google Scholar] [CrossRef] [PubMed]
- Miyazaki, M.; Flowers, M.T.; Sampath, H.; Chu, K.; Otzelberger, C.; Liu, X.; Ntambi, J.M. Hepatic stearoyl-CoA desaturase-1 deficiency protects mice from carbohydrate-induced adiposity and hepatic steatosis. Cell Metab. 2007, 6, 484–496. [Google Scholar] [CrossRef] [PubMed]


Disclaimer/Publisher’s Note: The statements, opinions and data contained in all publications are solely those of the individual author(s) and contributor(s) and not of MDPI and/or the editor(s). MDPI and/or the editor(s) disclaim responsibility for any injury to people or property resulting from any ideas, methods, instructions or products referred to in the content. |
© 2023 by the authors. Licensee MDPI, Basel, Switzerland. This article is an open access article distributed under the terms and conditions of the Creative Commons Attribution (CC BY) license (https://creativecommons.org/licenses/by/4.0/).
Share and Cite
Li, C.; Shen, N.; Yang, S.; Wang, H.-L. Effects of BPA Exposure and Recovery on the Expression of Genes Involved in the Hepatic Lipid Metabolism in Male Mice. Toxics 2023, 11, 775. https://doi.org/10.3390/toxics11090775
Li C, Shen N, Yang S, Wang H-L. Effects of BPA Exposure and Recovery on the Expression of Genes Involved in the Hepatic Lipid Metabolism in Male Mice. Toxics. 2023; 11(9):775. https://doi.org/10.3390/toxics11090775
Chicago/Turabian StyleLi, Changqing, Nan Shen, Shaohua Yang, and Hui-Li Wang. 2023. "Effects of BPA Exposure and Recovery on the Expression of Genes Involved in the Hepatic Lipid Metabolism in Male Mice" Toxics 11, no. 9: 775. https://doi.org/10.3390/toxics11090775
APA StyleLi, C., Shen, N., Yang, S., & Wang, H.-L. (2023). Effects of BPA Exposure and Recovery on the Expression of Genes Involved in the Hepatic Lipid Metabolism in Male Mice. Toxics, 11(9), 775. https://doi.org/10.3390/toxics11090775