

Chemical Survey and Risk Assessment of 56 Pesticides in the Sado River Estuary (Iberian Peninsula, Portugal)


Abstract
1. Introduction
2. Materials and Methods
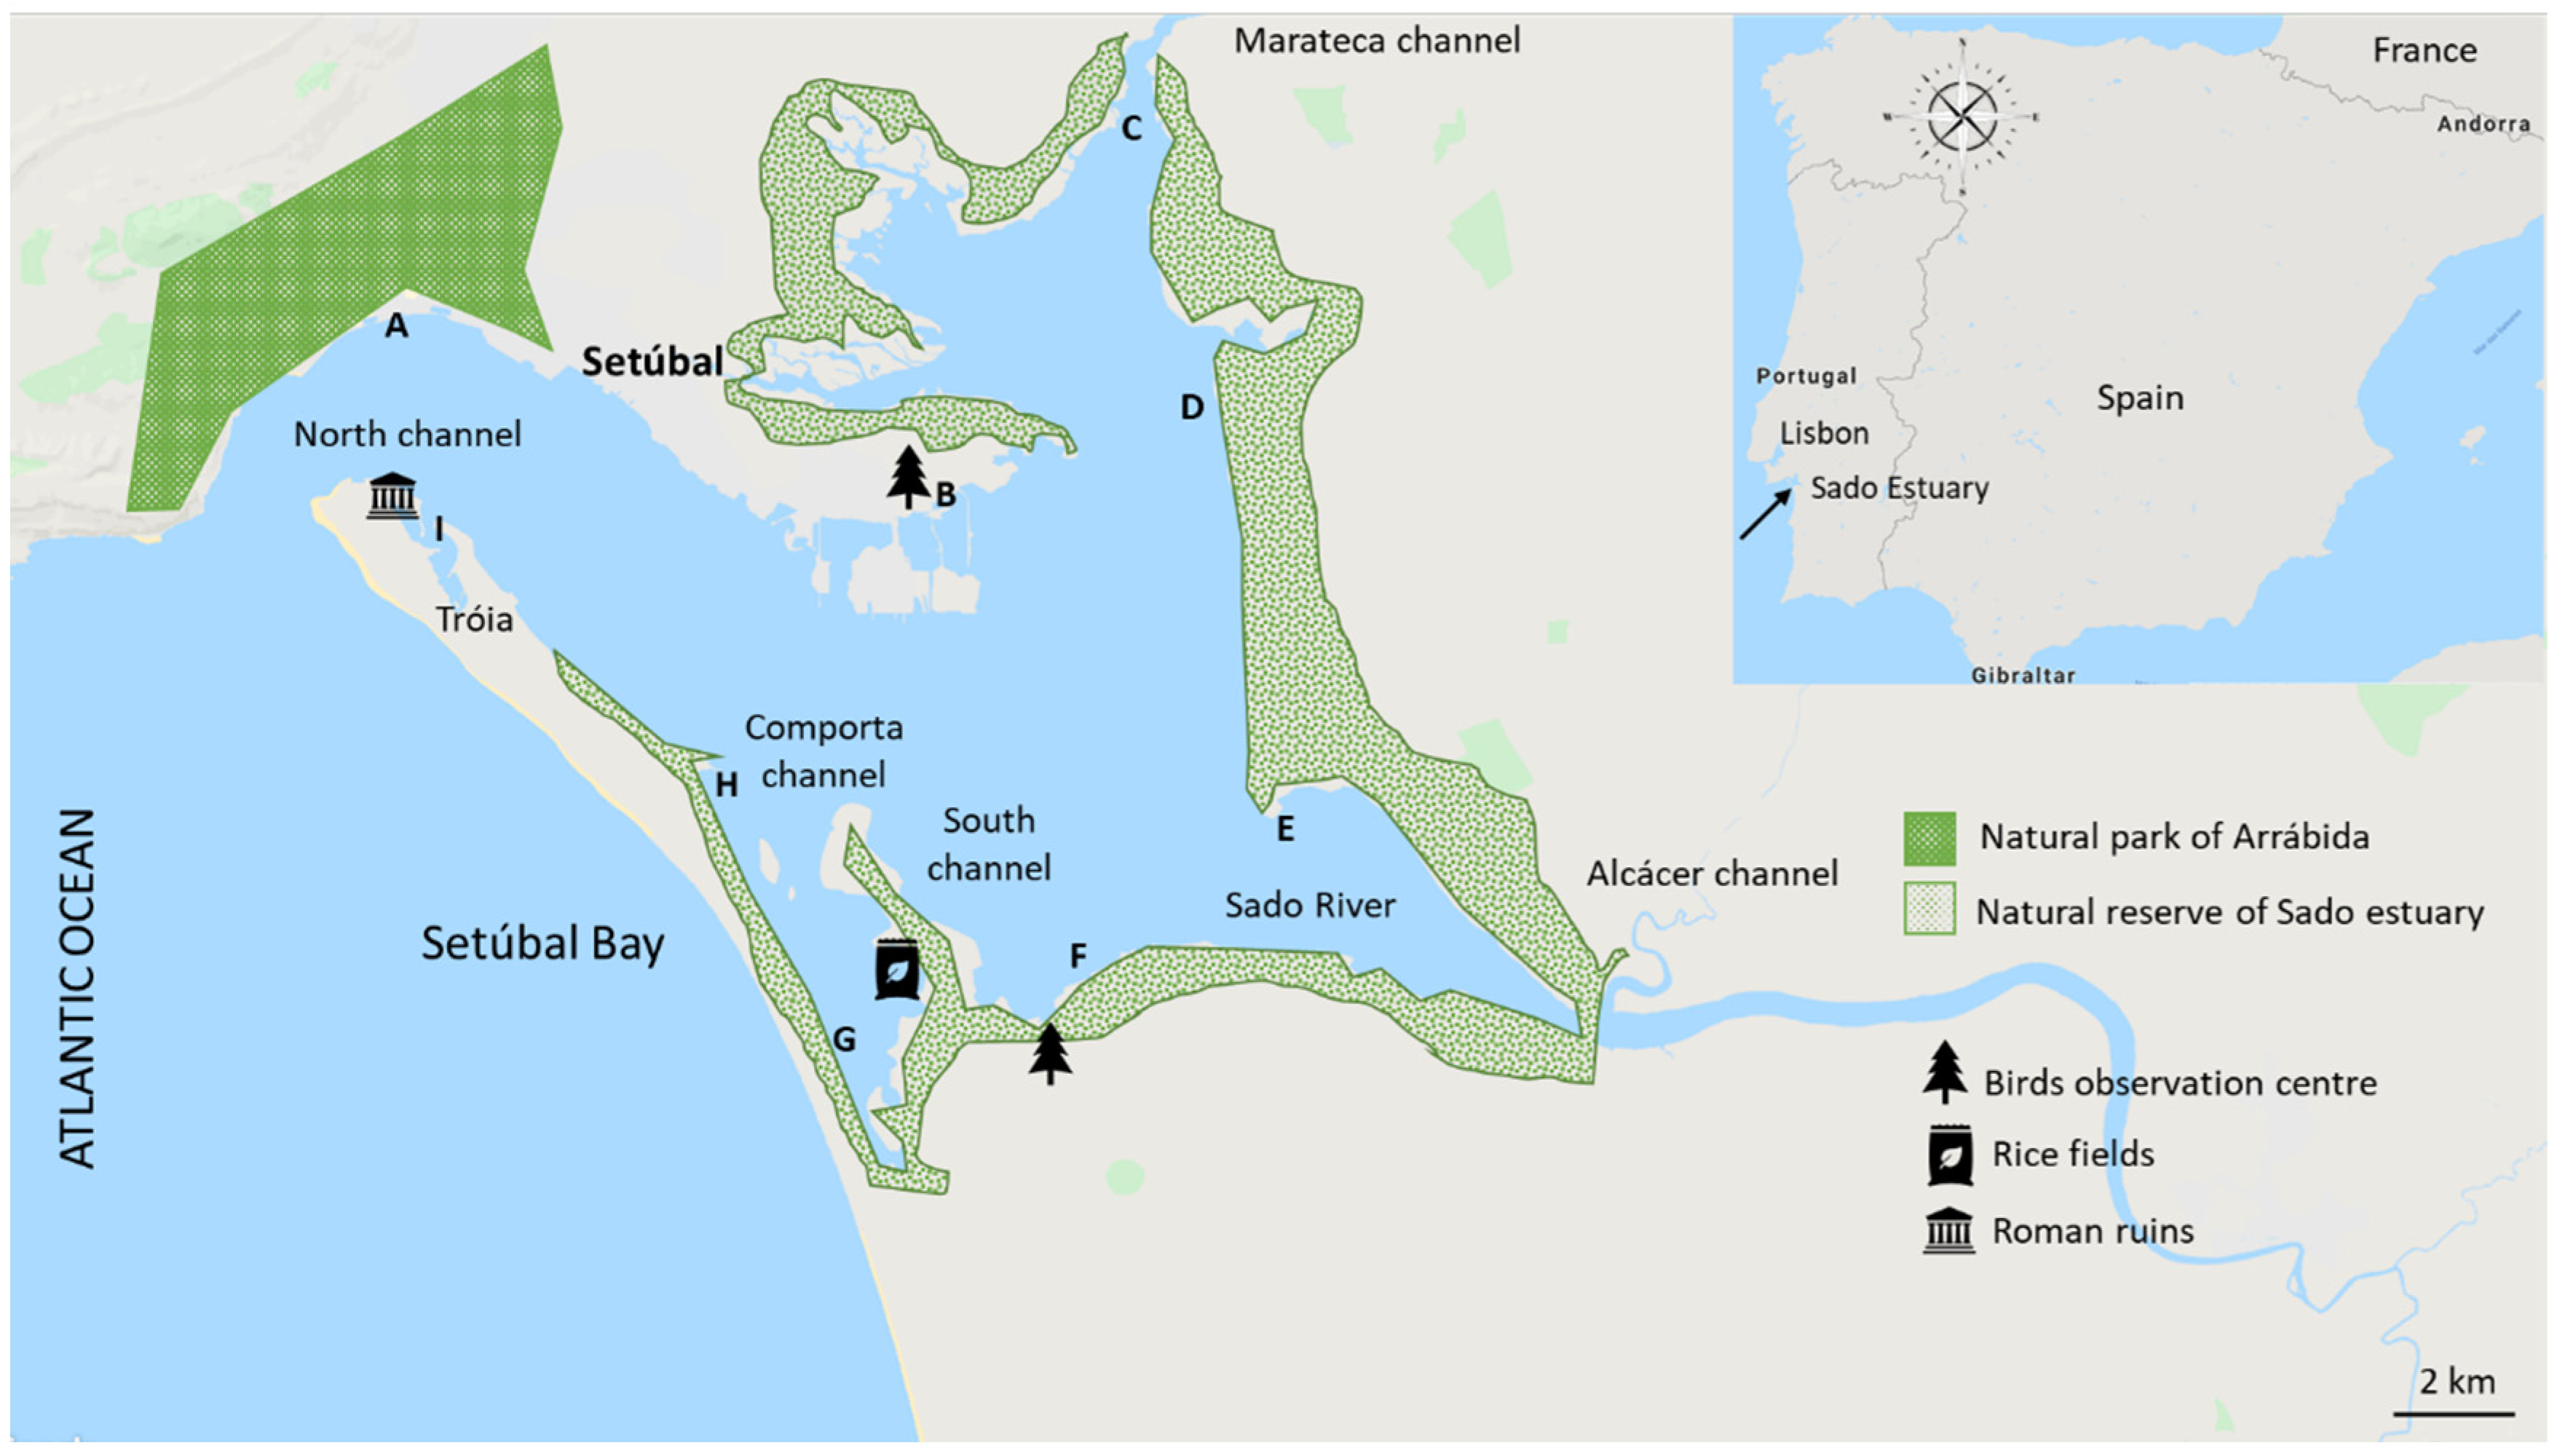
2.1. Study Area
2.2. Water Collection
2.3. Physicochemical Parameters
2.4. Materials and Chemicals for GC-MS/MS Analyses
2.5. Sample Preparation
2.6. Quantitative Analysis
2.7. Pesticide Hazard Assessment
2.8. In Vivo Toxicity Tests
2.9. Data Presentation and Statistical Analyses
3. Results
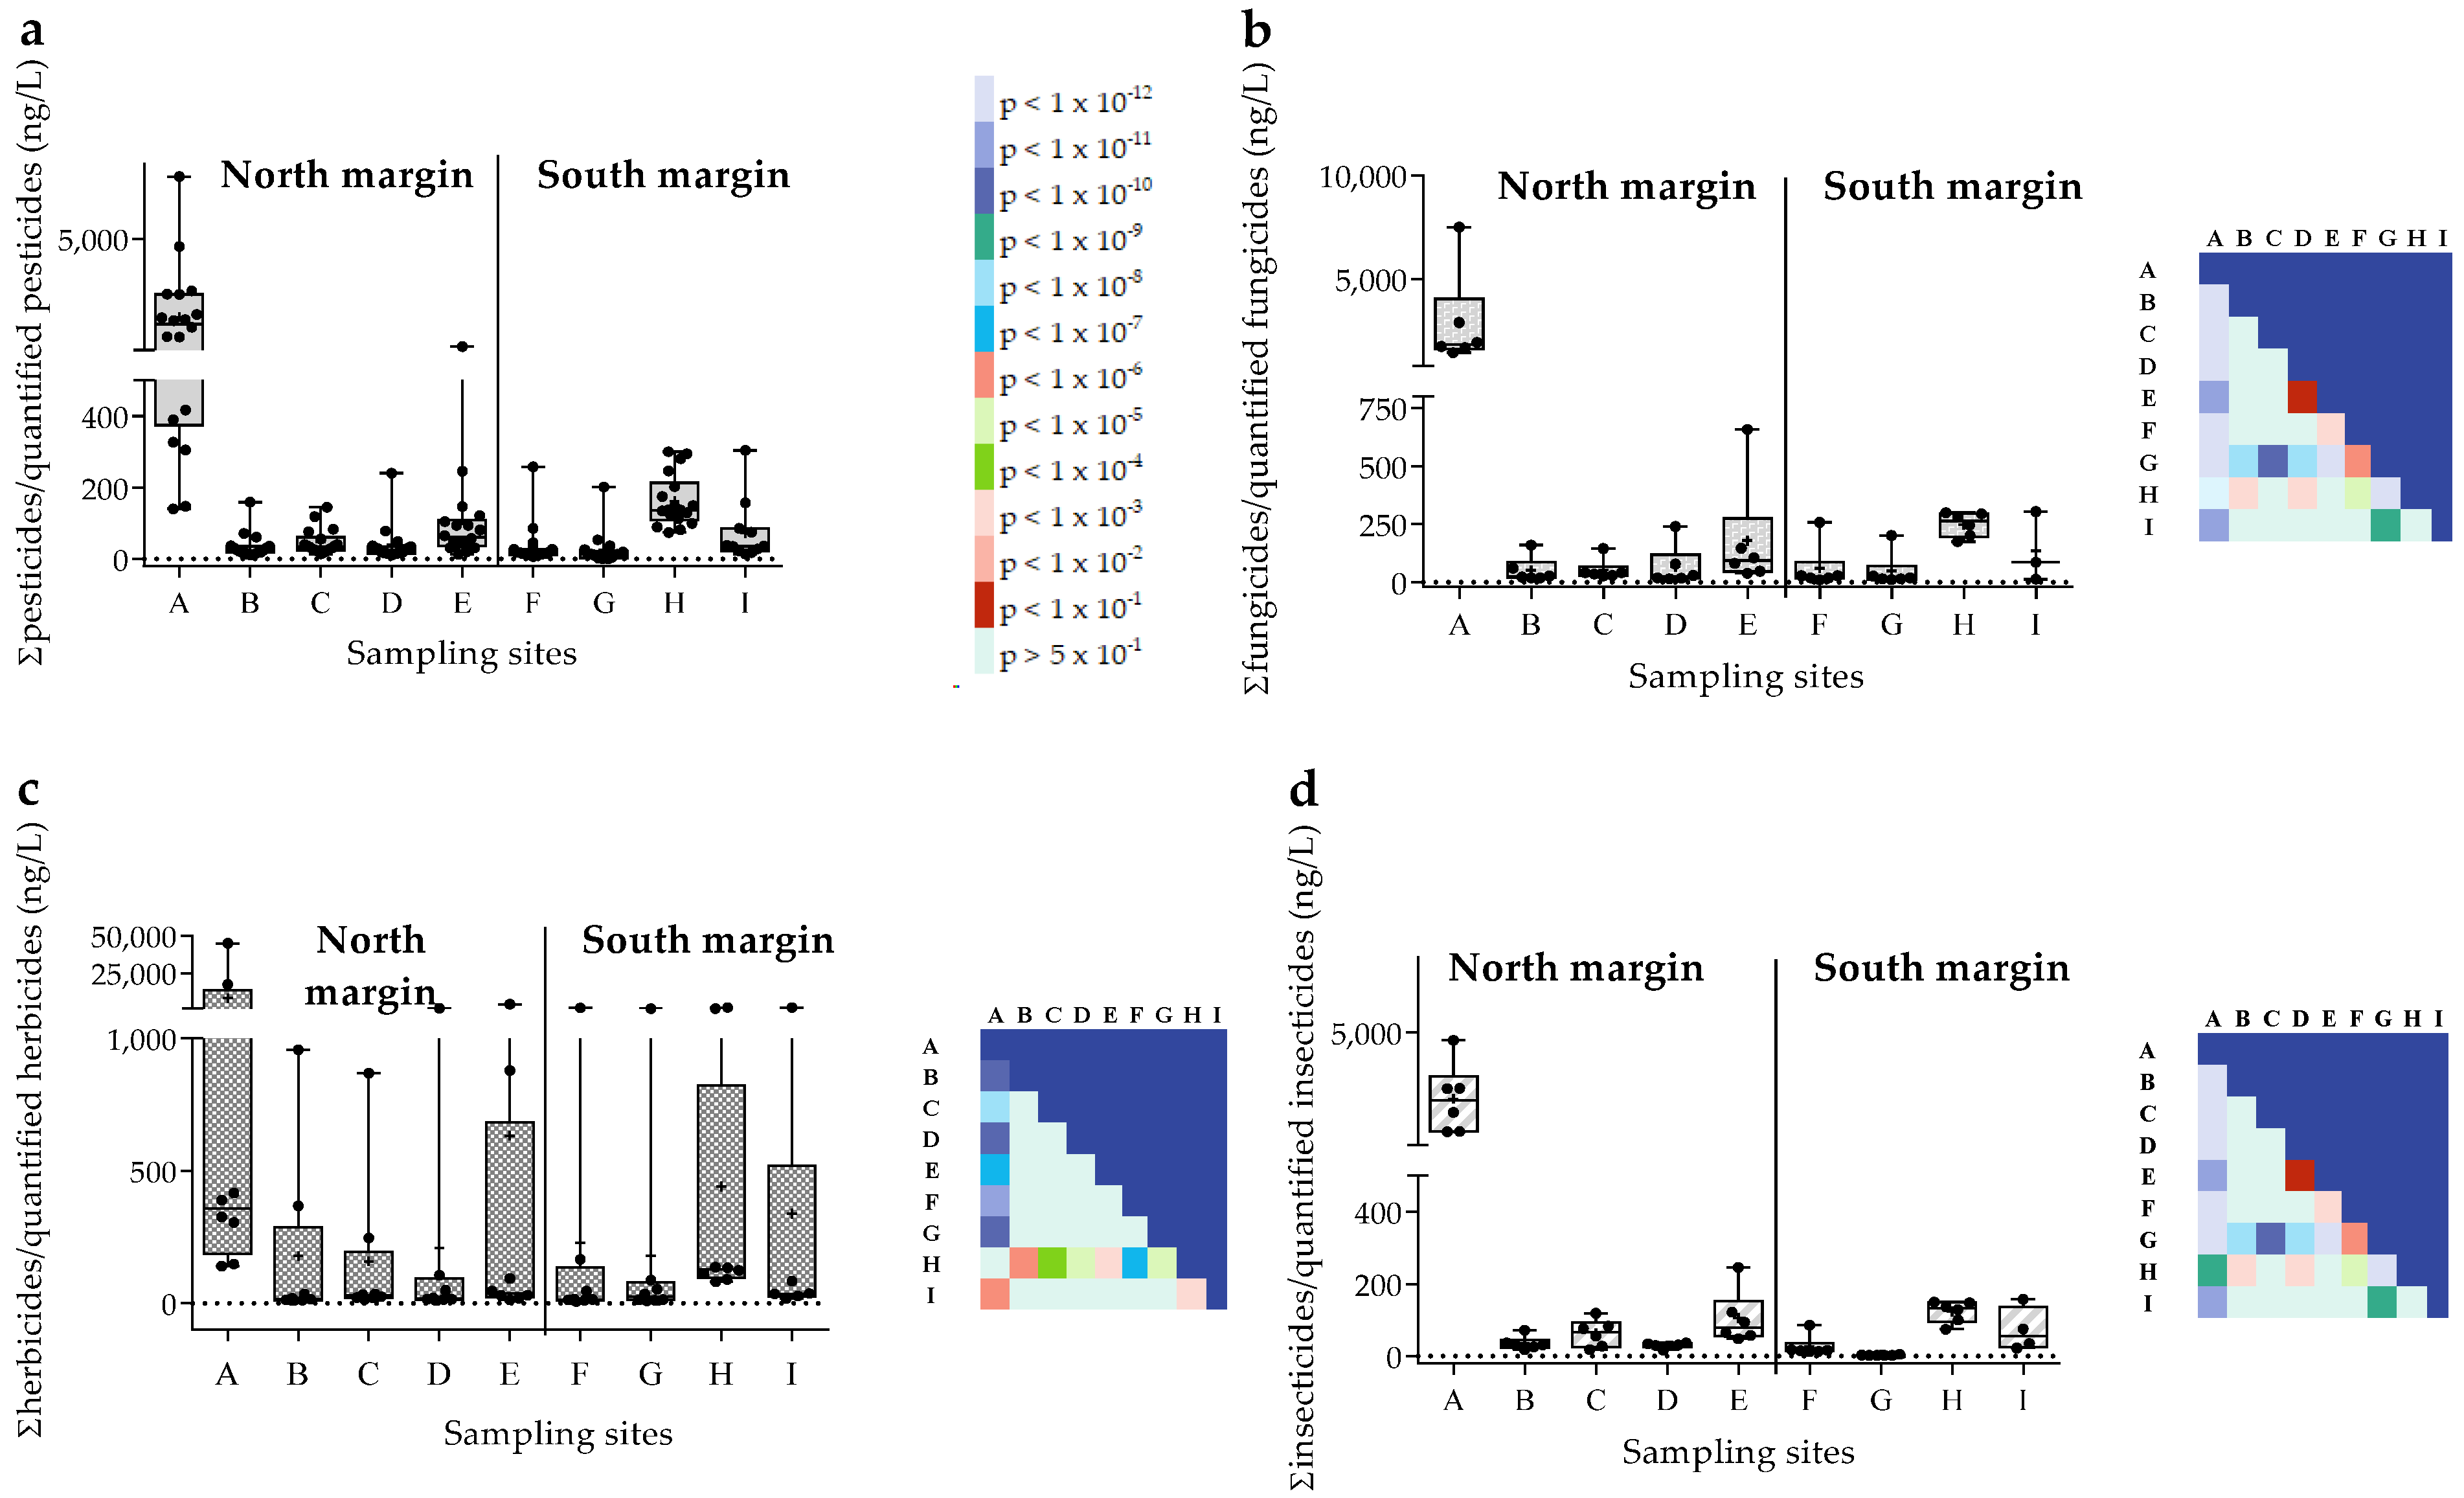
3.1. Pesticide Concentrations in the Sado Surface Waters
3.2. European Regulations for Pesticides
3.3. Evaluation of the Aquatic Hazard of Pesticide Mixtures
3.4. In Vivo Toxicity Test
3.5. Physicochemical Parameters
4. Discussion
Supplementary Materials
Author Contributions
Funding
Institutional Review Board Statement
Informed Consent Statement
Data Availability Statement
Acknowledgments
Conflicts of Interest
References
- Amoatey, P.; Baawain, M.S. Effects of pollution on freshwater aquatic organisms. Water Environ. Res. 2019, 91, 1272–1287. [Google Scholar] [CrossRef] [PubMed]
- Lin, L.; Yang, H.; Xu, X. Effects of Water Pollution on Human Health and Disease Heterogeneity: A Review. Front. Environ. Sci. 2022, 10, 975. [Google Scholar] [CrossRef]
- Mearns, A.J.; Reish, D.J.; Oshida, P.S.; Ginn, T.; Rempel-Hester, M.A.; Arthur, C.; Rutherford, N.; Pryor, R. Effects of Pollution on Marine Organisms. Water Environ. Res. 2015, 87, 1718–1816. [Google Scholar] [CrossRef] [PubMed]
- Rocha, M.J.; Rocha, E. Estrogenic Compounds in Estuarine and Coastal Water Environments of the Iberian Western Atlantic Coast and Selected Locations Worldwide—Relevancy, Trends and Challenges in View of the EU Water Framework Directive; IntechOpen: London, UK, 2015. [Google Scholar]
- Cruzeiro, C.; Pardal, M.A.; Rocha, E.; Rocha, M.J. Occurrence and seasonal loads of pesticides in surface water and suspended particulate matter from a wetland of worldwide interest-the Ria Formosa Lagoon, Portugal. Environ. Monit. Assess. 2015, 187, 669. [Google Scholar] [CrossRef] [PubMed]
- Jwaideh, M.A.A.; Sutanudjaja, E.H.; Dalin, C. Global impacts of nitrogen and phosphorus fertiliser use for major crops on aquatic biodiversity. Int. J. Life Cycle Assess. 2022, 27, 1058–1080. [Google Scholar] [CrossRef]
- Barbier, E.B.; Hacker, S.D.; Kennedy, C.; Koch, E.W.; Stier, A.C.; Silliman, B.R. The value of estuarine and coastal ecosystem services. Ecol. Monogr. 2011, 81, 169–193. [Google Scholar] [CrossRef]
- Katagi, T. Bioconcentration, Bioaccumulation, and Metabolism of Pesticides in Aquatic Organisms. In Reviews of Environmental Contamination and Toxicology; Whitacre, D.M., Ed.; Springer: New York, NY, USA, 2010; pp. 1–132. [Google Scholar]
- Pitarch, E.; Medina, C.; Portolés, T.; López, F.J.; Hernández, F. Determination of priority organic micro-pollutants in water by gas chromatography coupled to triple quadrupole mass spectrometry. Anal. Chim. Acta 2007, 583, 246–258. [Google Scholar] [CrossRef]
- Slaninova, A.; Smutna, M.; Modra, H.; Svobodova, Z. A review: Oxidative stress in fish induced by pesticides. Neuro Endocrinol. Lett. 2009, 30 (Suppl. S1), 2–12. [Google Scholar]
- Scholz, N.L.; Fleishman, E.; Brown, L.; Werner, I.; Johnson, M.L.; Brooks, M.L.; Mitchelmore, C.L.; Schlenk, D. A perspective on modern pesticides, pelagic fish declines, and unknown ecological resilience in highly managed ecosystems. BioScience 2012, 62, 428–434. [Google Scholar] [CrossRef]
- Osterberg, J.S.; Darnell, K.M.; Blickley, T.M.; Romano, J.A.; Rittschof, D. Acute toxicity and sub-lethal effects of common pesticides in post-larval and juvenile blue crabs, Callinectes sapidus. J. Exp. Mar. Biol. Ecol. 2012, 424–425, 5–14. [Google Scholar] [CrossRef]
- Köhler, H.R.; Triebskorn, R. Wildlife ecotoxicology of pesticides: Can we track effects to the population level and beyond? Science 2013, 341, 759–765. [Google Scholar] [CrossRef] [PubMed]
- ICNF. Instituto de Conservação da Natureza e das Florestas. Reserva Natural do Estuário do Sado. 2020. Available online: https://www.icnf.pt/conservacao/reservasnaturais/rnestuariodosado (accessed on 10 May 2023).
- Rocha, M.J.; Cruzeiro, C.; Reis, M.; Rocha, E.; Pardal, M.A. Determination of 17 endocrine disruptor compounds and their spatial and seasonal distribution in the Sado River Estuary (Portugal). Toxicol. Environ. Chem. 2013, 95, 237–253. [Google Scholar] [CrossRef]
- Ferreira, J.G.; Simas, T.; Nobre, A.; Silva, M.C.; Shifferegger, K.; Lencart-Silva, J. Identification of Sensitive Areas and Vulnerable Zones in Transitional and Coastal Portuguese Systems. Application of the United States National Estuarine Eutrophication Assessment to the Minho, Lima, Douro, Ria de Aveiro, Mondego, Tagus, Sado, Mira, Ria Formosa and Guadiana Systems. Hydro-Biol. 2003, 393, 107115. Available online: http://www.eutro.org/documents/NEEA%20Portugal.pdf (accessed on 10 May 2023).
- Almeida, Â.; Calisto, V.; Esteves, V.I.; Schneider, R.J.; Soares, A.M.V.M.; Figueira, E.; Freitas, R. Presence of the pharmaceutical drug carbamazepine in coastal systems: Effects on bivalves. Aquat. Toxicol. 2014, 156, 74–87. [Google Scholar] [CrossRef] [PubMed]
- Caeiro, S.; Costa, M.H.; Ramos, T.B.; Fernandes, F.; Silveira, N.; Coimbra, A.; Medeiros, G.; Painho, M. Assessing heavy metal contamination in Sado Estuary sediment: An index analysis approach. Ecol. Indic. 2005, 5, 151–169. [Google Scholar] [CrossRef]
- DOPA. Digital Observatory for Protected Areas (DOPA) Explorer. Estuário Do Sado Portugal. Available online: https://dopa-explorer.jrc.ec.europa.eu/wdpa/4722 (accessed on 24 April 2023).
- Costa, A.B.; Correia, M.; Silva, G.; Lopes, A.F.; Faria, A.M. Performance of the long-snouted seahorse, Hippocampus guttulatus, under warming conditions. Front. Mar. Sci. 2023, 10, 502. [Google Scholar] [CrossRef]
- Augusto, J.F.; Rachinas-Lopes, P.; dos Santos, M.E. Social structure of the declining resident community of common bottlenose dolphins in the Sado Estuary, Portugal. J. Mar. Biol. Assoc. UK 2012, 92, 1773–1782. [Google Scholar] [CrossRef]
- Belo, J.R.; Dias, M.P.; Jara, J.; Almeida, A.; Morais, F.; Silva, C.; Valadeiro, J.; Alves, J.A. Synchronous Declines of Wintering Waders and High-Tide Roost Area in a Temperate Estuary: Results of a 10-Year Monitoring Programme. Waterbirds 2023, 45, 141–149. [Google Scholar] [CrossRef]
- EU. Regulation (EC) No 1107/2009 of the European Parliament and of the Council of 21 October 2009 Concerning the Placing of Plant Protection Products on the Market and Repealing Council Directives 79/117/EEC and 91/414/EEC; Official Journal of the European Union: Maastricht, The Netherlands, 2009; Volume L 309, pp. 1–50. [Google Scholar]
- DRAP. DRAP, Direção Regional de Agricultura e Pescas 2014; DRAP: Philadelphia, PA, USA, 2012. (In Portuguese) [Google Scholar]
- Cruzeiro, C.; Pardal, M.Â.; Rodrigues-Oliveira, N.; Castro, L.F.C.; Rocha, E.; Rocha, M.J. Multi-matrix quantification and risk assessment of pesticides in the longest river of the Iberian peninsula. Sci. Total Environ. 2016, 572, 263–272. [Google Scholar] [CrossRef]
- EU. Council Directive 98/83/EC of 3 November 1998 on the quality of water intended for human consumption. Off. J. Eur. Communities 1998, 32–54. [Google Scholar]
- EU. Directive 2013/39/EU of the European Parliament and of the Council of 12 August 2013: Amending Directives 2000/60/EC and 2008/105/EC as Regards Priority Substances in the Field of Water Policy; Official Journal of the European Communities: Maastricht, The Netherlands, 2013; Volume 226/1, p. 17. [Google Scholar]
- Brito, A.C.; Pereira, H.; Picado, A.; Cruz, J.; Cereja, R.; Biguino, B.; Chainho, P.; Nascimento, Â.; Carvalho, F.; Cabral, S.; et al. Increased oyster aquaculture in the Sado Estuary (Portugal): How to ensure ecosystem sustainability? Sci. Total Environ. 2023, 855, 158898. [Google Scholar] [CrossRef] [PubMed]
- Cruzeiro, C.; Rocha, E.; Pardal, M.Â.; Rocha, M.J. Seasonal-spatial survey of pesticides in the most significant estuary of the Iberian Peninsula—The Tagus River estuary. J. Clean. Prod. 2016, 126, 419–427. [Google Scholar] [CrossRef]
- Nascimento, Â.; Biguino, B.; Borges, C.; Cereja, R.; Cruz, J.P.C.; Sousa, F.; Dias, J.; Brotas, V.; Palma, C.; Brito, A.C. Tidal variability of water quality parameters in a mesotidal estuary (Sado Estuary, Portugal). Sci. Rep. 2021, 11, 23112. [Google Scholar] [CrossRef]
- Backhaus, T.; Faust, M. Predictive Environmental Risk Assessment of Chemical Mixtures: A Conceptual Framework. Environ. Sci. Technol. 2012, 46, 2564–2573. [Google Scholar] [CrossRef]
- Silva, E.; Cerejeira, M.J. Concentration addition-based approach for aquatic risk assessment of realistic pesticide mixtures in Portuguese river basins. Environ. Sci. Pollut. Res. 2015, 22, 6756–6765. [Google Scholar] [CrossRef]
- OECD. Test No. 202: Daphnia sp. Acute Immobilisation Test; OECD: Paris, France, 2004. [Google Scholar]
- USEPA. Environmental Protection Agency. 40 CFR Part 423, Appendix A; USEPA: Washington, DC, USA, 2012. [Google Scholar]
- Hammer, Ø.; Ryan, P.D. PAST: Paleontological Statistics Software Package for Education and Data Analysis. Palaeontol. Electron. 2001, 4, 9. Available online: http://palaeo-electronica.org/2001_1/past/issue1_01.htm (accessed on 10 May 2023).
- Wu, J.; Li, P.; Wang, D.; Ren, X.; Wei, M. Statistical and multivariate statistical techniques to trace the sources and affecting factors of groundwater pollution in a rapidly growing city on the Chinese Loess Plateau. Hum. Ecol. Risk Assess. Int. J. 2020, 26, 1603–1621. [Google Scholar] [CrossRef]
- Rocha, M.J.; Ribeiro, A.B.; Campos, D.; Rocha, E. Temporal-spatial survey of PAHs and PCBs in the Atlantic Iberian northwest coastline, and evaluation of their sources and risks for both humans and aquatic organisms. Chemosphere 2021, 279, 130506. [Google Scholar] [CrossRef]
- Persoone, G.; Baudo, R.; Cotman, M.; Blaise, C.; Thompson, K.C.; Moreira-Santos, M.; Vollat, B.; Törökne, A.; Han, T. Review on the acute Daphnia magna toxicity test—Evaluation of the sensitivity and the precision of assays performed with organisms from laboratory cultures or hatched from dormant eggs. Knowl. Managt. Aquatic Ecosyst. 2009, 393, 1. [Google Scholar] [CrossRef]
- Vasconcelos, R.P.; Reis-Santos, P.; Fonseca, V.; Maia, A.; Ruano, M.; França, S.; Vinagre, C.; Costa, M.J.; Cabral, H. Assessing anthropogenic pressures on estuarine fish nurseries along the Portuguese coast: A multi-metric index and conceptual approach. Sci. Total Environ. 2007, 374, 199–215. [Google Scholar] [CrossRef]
- Silva, E.; Daam, M.A.; Cerejeira, M.J. Predicting the aquatic risk of realistic pesticide mixtures to species assemblages in Portuguese river basins. J. Environ. Sci. 2015, 31, 12–20. [Google Scholar] [CrossRef] [PubMed]
- Rodrigues, E.T.; Alpendurada, M.F.; Guimarães, A.; Avó, R.; Ferreira, B.; Pardal, M.A. The environmental condition of an estuarine ecosystem disturbed by pesticides. Environ. Sci. Pollut. Res. 2019, 26, 24075–24087. [Google Scholar] [CrossRef] [PubMed]
- EU; European Commission. Technical Guidance for deriving Environmental Quality Standards under the Water Framework Directive. Guidance Document No 27; EU; European Commission: Maastricht, The Netherlands, 2011. [Google Scholar] [CrossRef]
- Gustafson, D.I. Groundwater ubiquity score: A simple method for assessing pesticide leachability. Environ. Toxicol. Chem. 1989, 8, 339–357. [Google Scholar] [CrossRef]
- Cheng, B.; Zou, L.; Zhang, H.; Cao, Z.; Liao, X.; Shen, T.; Xiong, G.; Xiao, J.; Liu, H.; Lu, H. Effects of cyhalofop-butyl on the developmental toxicity and immunotoxicity in zebrafish (Danio rerio). Chemosphere 2021, 263, 127849. [Google Scholar] [CrossRef]
- Thomas, J.E.; Ou, L.-T.; Al-Agely, A. DDE Remediation and Degradation. In Reviews of Environmental Contamination and Toxicology; Whitacre, D.M., Ed.; Springer: New York, NY, USA, 2008; pp. 55–69. [Google Scholar]
- Carvalho, P.N.; Rodrigues, P.N.R.; Basto, M.C.P.; Vasconcelos, M.T.S.D. Organochlorine pesticides levels in Portuguese coastal areas. Chemosphere 2009, 75, 595–600. [Google Scholar] [CrossRef] [PubMed]
- Rocha, M.J.; Ribeiro, M.F.T.; Cruzeiro, C.; Figueiredo, F.; Rocha, E. Development and validation of a GC-MS method for determination of 39 common pesticides in estuarine water—Targeting hazardous amounts in the Douro River estuary. Int. J. Environ. Anal. Chem. 2012, 92, 1587–1608. [Google Scholar] [CrossRef]
- Fernández, M.; Cuesta, S.; Jiménez, O.; García, M.A.; Hernández, L.M.; Marina, M.L.; González, M.J. Organochlorine and heavy metal residues in the water/sediment system of the Southeast Regional Park in Madrid, Spain. Chemosphere 2000, 41, 801–812. [Google Scholar] [CrossRef]
- Cruzeiro, C.; Rocha, E.; Pardal, M.Â.; Rocha, M.J. Environmental assessment of pesticides in the Mondego River Estuary (Portugal). Mar. Pollut. Bull. 2016, 103, 240–246. [Google Scholar] [CrossRef]
- EU. Commission Implementing Decision (EU) 2018/840 Establishing a Watch List of Substances for Union-Wide Monitoring in the Field of water Policy Pursuant to Directive 2008/105/EC of the European Parliament and of the Council and Repealing Commission Implementing Decision (EU) 2015/495; Official Journal of the European Union: Maastricht, The Netherlands, 2018. [Google Scholar]
- Köck, M.; Farré, M.; Martínez, E.; Gajda-Schrantz, K.; Ginebreda, A.; Navarro, A.; Alda, M.L.D.; Barceló, D. Integrated ecotoxicological and chemical approach for the assessment of pesticide pollution in the Ebro River delta (Spain). J. Hydrol. 2010, 383, 73–82. [Google Scholar] [CrossRef]
- Ccanccapa, A.; Masiá, A.; Navarro-Ortega, A.; Picó, Y.; Barceló, D. Pesticides in the Ebro River basin: Occurrence and risk assessment. Environ. Pollut. 2016, 211, 414–424. [Google Scholar] [CrossRef]
- Quednow, K.; Püttmann, W. Monitoring terbutryn pollution in small rivers of Hesse, Germany. J. Environ. Monit. 2007, 9, 1337–1343. [Google Scholar] [CrossRef] [PubMed]
- Cruzeiro, C.; Amaral, S.; Rocha, E.; Rocha, M.J. Determination of 54 pesticides in waters of the Iberian Douro River estuary and risk assessment of environmentally relevant mixtures using theoretical approaches and Artemia salina and Daphnia magna bioassays. Ecotoxicol. Environ. Saf. 2017, 145, 126–134. [Google Scholar] [CrossRef] [PubMed]
- Wuijts, S.; Zijp, M.C.; Reijnders, H.F.R. Drinking Water in River Basin Management Plans of EU Member States in the Rhine and Meuse River Basins; National Institute for Public Health and the Environment (RIVM): Utrecht, The Netherlands, 2008; p. 108. [Google Scholar]
- Wolfram, J.; Stehle, S.; Bub, S.; Petschick, L.L.; Schulz, R. Water quality and ecological risks in European surface waters—Monitoring improves while water quality decreases. Environ. Int. 2021, 152, 106479. [Google Scholar] [CrossRef] [PubMed]
- Ryberg, K.R.; Gilliom, R.J. Trends in pesticide concentrations and use for major rivers of the United States. Sci. Total Environ. 2015, 538, 431–444. [Google Scholar] [CrossRef]
- Donley, N.; Bullard, R.D.; Economos, J.; Figueroa, I.; Lee, J.; Liebman, A.K.; Martinez, D.N.; Shafiei, F. Pesticides and environmental injustice in the USA: Root causes, current regulatory reinforcement and a path forward. BMC Public Health 2022, 22, 708. [Google Scholar] [CrossRef] [PubMed]
- Sharma, A.; Kumar, V.; Shahzad, B.; Tanveer, M.; Sidhu, G.P.S.; Handa, N.; Kohli, S.K.; Yadav, P.; Bali, A.S.; Parihar, R.D.; et al. Worldwide pesticide usage and its impacts on ecosystem. SN Appl. Sci. 2019, 1, 1446. [Google Scholar] [CrossRef]
- Kong, K.L.; Escalada, M.M.; Chien, H.V.; Delos Reyes, J.H. Are There Productivity Gains from Insecticide Applications in Rice Production. In Rice Planthoppers; Heong, K., Cheng, J., Escalada, M., Eds.; Springer: Berlin/Heidelberg, Germany, 2015; pp. 179–189. [Google Scholar]
- AERU (Agriculture & Environment Research Unit). The Pesticide Properties DataBase (PPDB) Developed by the Agriculture & Environment Research Unit, 02-03-2007 ed.; Funded by UK National Sources and through EU-Funded Projects; University of Hertfordshire: London, UK, 2013. [Google Scholar]
- DR. Ministério do Ambiente. Decreto-Lei nº 236/98 de 1 de Agosto. Diário da República, p. 47. 1998.No 1107/2009 of the European Parliament and of the Council of 21 October 2009 Concerning the Placing of plant Protection Products on the Market and Repealing Council Directives 79/117/EEC and 91/414/EEC; Offical Journal of the European Union: Maastricht, The Netherlands, 2009; Volume L 309, pp. 1–50. [Google Scholar]


| Fungicides | MDL (ng/L) | Frequency | Environmental Levels (ng/L) ± Mean (SD) | |||
|---|---|---|---|---|---|---|
| (%) | Spring | Summer | Autumn | Winter | ||
| Azoxystrobin | 2.8 | 100 | 342.4 ± 462.2 | 265.1 ± 386.6 | 315.3 ± 536.6 | 649.9 ± 1466 |
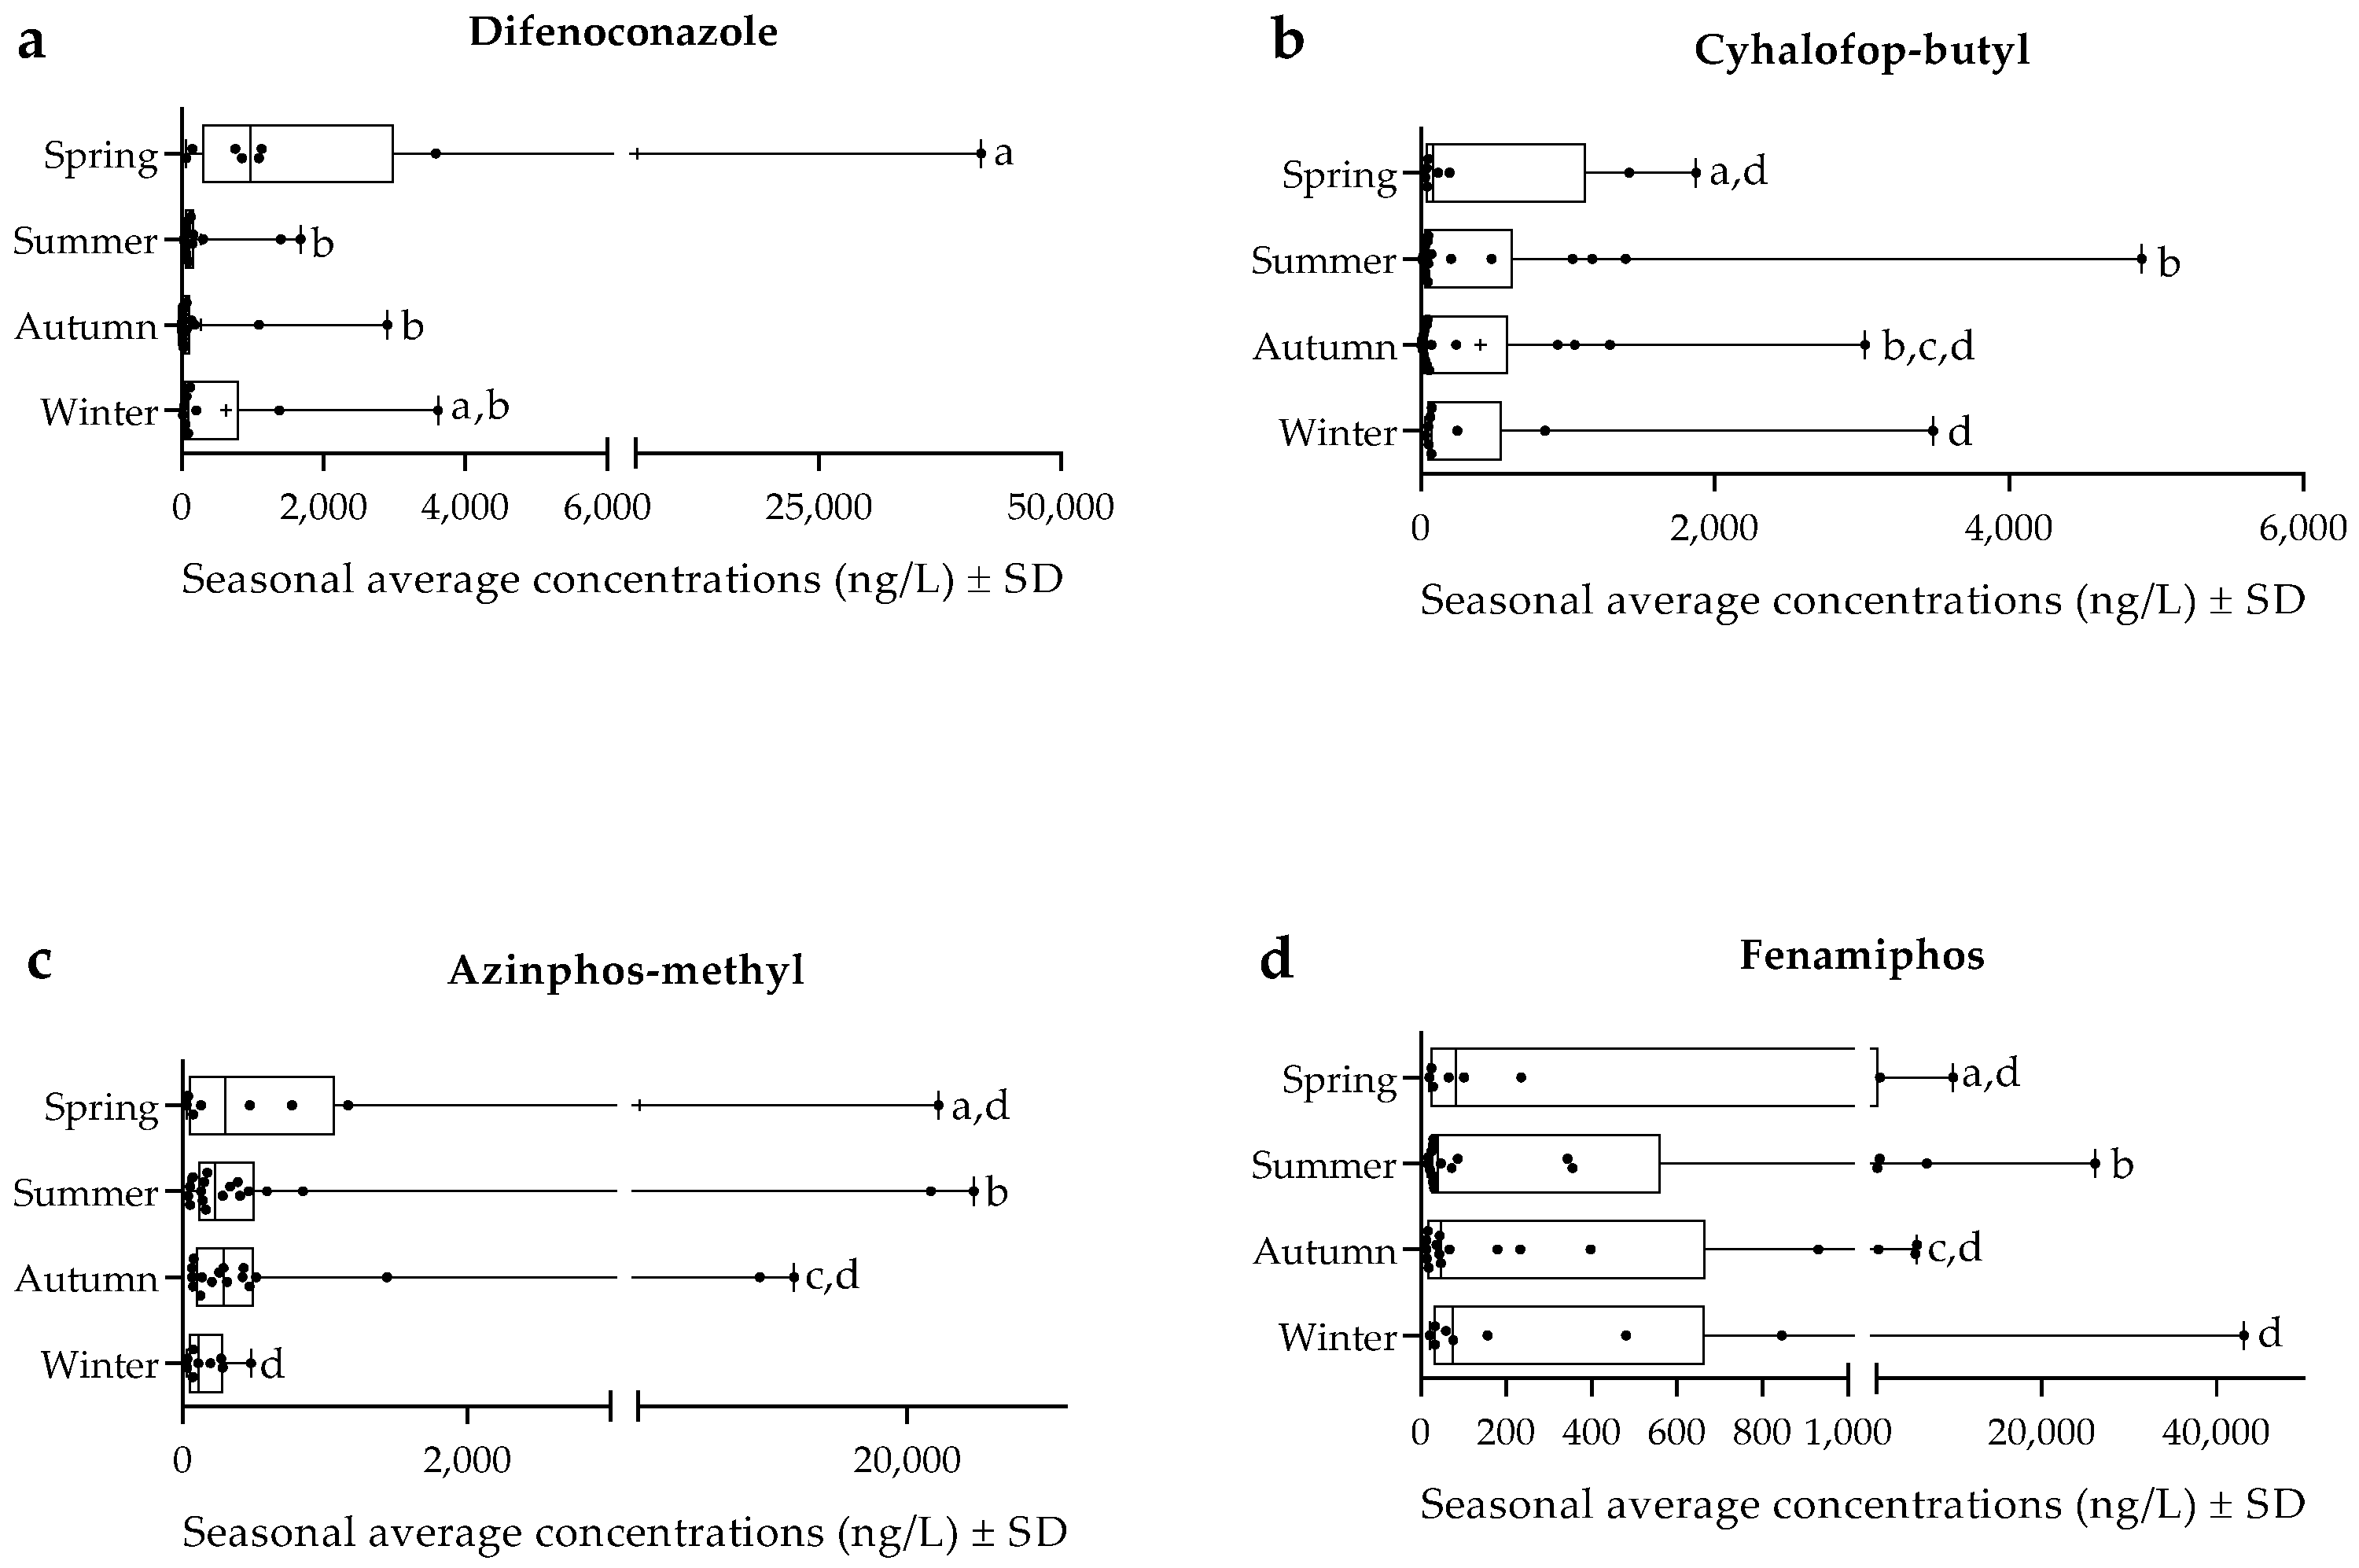
| Difenoconazole | 2.0 | 100 | 6170 ± 14,409 | 262.7 ± 485.5 | 268.4 ± 725.2 | 620.3 ± 1202 |
| HCB | 2.1 | 59 | 3.6 ± 4.8 | 2.6 ± 2.1 | 2.3 ± 2.1 | 3.9 ± 6.6 |
| PCB | 2.7 | 89 | 16.7 ± 17.6 | 17.8 ± 26.6 | 11.8 ± 19.8 | 6.9 ± 5.4 |
| Procymidone | 2.0 | 100 | 159.4 ± 360.1 | 355.5 ± 928.6 | 409.6 ± 967.8 | 915.2 ± 2171 |
| Tebuconazole | 1.8 | 100 | 238.4 ± 388.2 | 675.6 ± 1645 | 509.2 ± 1209 | 388.8 ± 829.4 |
| % Frequency > MDL | 91 | |||||
| Fungicides (Σaverage) | 6930 ± 5785 | 1579 ± 623 | 1517 ± 493 | 2585 ± 851 | ||
| Herbicides | MDL (ng/L) | Frequency (%) | Environmental Levels (ng/L) ± Mean (SD) | |||
| Spring | Summer | Autumn | Winter | |||
| Alachlor | 1.5 | 87 | 8.0 ± 11.5 | 6.6 ± 11.9 | 7.6 ± 11.9 | 5.7 ± 8.5 |
| Atrazine | 2.1 | 68 | 11.4 ± 12.3 | 10.8 ± 9.0 | 7.4 ± 9.0 | 7.0 ± 8.5 |
| Atrazine-desethyl | 1.6 | 100 | 51.9 ± 41.1 | 57.3 ± 48.1 | 56.1 ± 48.1 | 37.2 ± 19.7 |
| Cyanazine | 1.9 | 100 | 95.0 ± 89.5 | 53.6 ± 74.8 | 61.5 ± 74.8 | 69.8 ± 92.3 |
| Cyhalofop-butyl | 2.9 | 98 | 471.3 ± 737.1 | 535.0 ± 790.9 | 406.4 ± 790.9 | 547.4 ± 1131 |
| Metolachlor | 3.1 | 23 | 3.1 ± 1.6 | 2.7 ± 1.9 | 2.9 ± 1.9 | 4.9 ± 7.7 |
| Metribuzin | 1.8 | 100 | 253.3 ± 179.8 | 58.6 ± 55.3 | 60.0 ± 55.3 | 157.5 ±283.0 |
| Pendimethalin | 1.4 | 100 | 5.8 ± 3.2 | 6.0 ± 7.8 | 7.2 ± 7.8 | 5.3 ± 4.4 |
| Propazine | 1.7 | 100 | 161.1 ± 218.2 | 45.4 ± 44.9 | 45.0 ± 44.9 | 54.7 ± 79.4 |
| Propyzamide | 1.8 | 100 | 57.5 ± 66.5 | 25.2 ± 35.3 | 30.9 ± 35.3 | 34.0 ± 39.6 |
| Simazine | 2.8 | 100 | 43.1 ± 52.1 | 37.9 ± 26.9 | 27.0 ± 26.9 | 43.5 ± 78.9 |
| Simetryn | 1.8 | 100 | 21.2 ± 22.6 | 20.1 ± 25.6 | 20.5 ± 25.6 | 23.2 ± 32.2 |
| Terbuthylazine | 1.5 | 100 | 202.0 ± 264.1 | 50.3 ± 60.0 | 56.8 ± 60.0 | 54.6 ± 68.0 |
| Terbutryn | 2.0 | 94 | 10.9 ± 14.2 | 8.8 ± 12.9 | 9.8 ± 12.9 | 10.8 ± 19.7 |
| Trifluralin | 2.2 | 42 | 3.1 ± 2.0 | 2.7 ± 2.0 | 3.0 ± 2.0 | 4.0 ± 5.7 |
| % Frequency > MDL | 87 | |||||
| Herbicides (Σaverage) | 1399 ± 192 | 921 ± 198 | 802 ± 198 | 1060 ± 287 | ||
| Insecticides | MDL (ng/L) | Frequency (%) | Environmental Levels (ng/L) ± Mean (SD) | |||
| Spring | Summer | Autumn | Winter | |||
| Aldrin | 2.5 | 58 | 138.2 ± 283.9 | 91.1 ± 200.4 | 59.5 ± 102.4 | 280.1 ± 821.3 |
| Azinphos-methyl | 2.8 | 100 | 3082 ± 7649 | 2778 ± 7515 | 1673 ± 3839 | 172.2 ± 149.9 |
| Chlordane γ | 1.8 | 47 | 76.9 ± 189.9 | 41.0 ± 98.0 | 18.8 ± 31.7 | 9.6 ± 16.9 |
| Chlorpyriphos | 2.3 | 100 | 115.1 ± 286.1 | 92.3 ± 264.2 | 40.5 ± 82.6 | 375.8 ± 1100.6 |
| Chlorfenvinphos | 1.8 | 75 | 141.5 ± 338.9 | 65.2 ± 149.1 | 64.4 ± 132.5 | 349.5 ± 994.4 |
| Cyfluthrine | 1.9 | 100 | 1643 ± 4381 | 865.6 ± 2255 | 402.5 ± 880.0 | 3574 ± 10,439 |
| Cyhalothrin-λ | 2.1 | 100 | 558.2 ± 1512 | 348.7 ± 1193 | 124.3 ± 292.1 | 489.4 ± 1420 |
| Cypermethrin-α | 1.9 | 100 | 687.0 ± 1833 | 319.2 ± 884.1 | 218.7 ± 495.4 | 689.9 ± 1980 |
| DDD | 1.9 | 92 | 152.5 ± 401.4 | 72.8 ± 200.8 | 33.0 ± 69.9 | 710.5 ± 2100 |
| DDE | 1.6 | 53 | 37.1 ± 94.0 | 24.6 ± 58.1 | 19.3 ± 44.1 | 322.3 ± 955.0 |
| DDT | 2.4 | 72 | 518.3 ± 1218 | 79.9 ± 216.1 | 71.1 ± 185.9 | 470.0 ± 1357 |
| Deltametrin | 2.2 | 100 | 659.8 ± 1608 | 508.2 ± 1375 | 266.1 ± 543.0 | 1062 ± 3026 |
| Diazinon | 1.7 | 100 | 327.5 ± 478.7 | 222.1 ± 265.8 | 197.4 ± 281.2 | 447.9 ± 814.6 |
| Dichlorvos | 2.4 | 100 | 67.1 ± 60.7 | 60.3 ± 101.4 | 62.0 ± 74.1 | 33.0 ± 23.4 |
| Dieldrin | 2.0 | 100 | 153.7 ± 395.3 | 132.7 ± 286.3 | 163.4 ± 293.7 | 869.7 ± 2155.7 |
| Dimethoate | 2.6 | 100 | 349.0 ± 531.7 | 407.2 ± 707.7 | 441.9 ± 403.7 | 581.4 ± 971.6 |
| Endosulfan-α | 1.6 | 100 | 394.5 ± 976.3 | 214.8 ± 526.6 | 193.3 ± 440.2 | 693.4 ± 1990 |
| Endosulfan-β | 2.2 | 70 | 175.7 ± 361.1 | 82.8 ± 161.6 | 55.7 ± 100.8 | 377.0 ± 1035 |
| Endosulfan-sulphate | 2.1 | 100 | 1378 ± 2114 | 410.9 ± 1079 | 226.0 ± 532.0 | 272.4 ± 437.9 |
| Endrin | 2.0 | 100 | 368.8 ± 923.7 | 353.3 ± 1119 | 134.0 ± 251.6 | 1279 ± 3689 |
| Fenamiphos | 2.5 | 100 | 1466 ± 3413 | 2032 ± 6380 | 855.3 ± 1821 | 4986 ± 14,321 |
| Fenitrothion | 1.8 | 98 | 12.6 ± 5.6 | 17.4 ± 19.7 | 15.3 ± 21.7 | 15.2 ± 17.2 |
| Fonofos | 1.4 | 100 | 61.3 ± 36.4 | 104.7 ± 131.1 | 94.7 ± 85.6 | 92.8 ± 105.1 |
| Heptachlor | 2.3 | 51 | 5.0 ± 4.6 | 4.8 ± 4.5 | 5.2 ± 6.9 | 36.6 ± 89.9 |
| Heptachlor-epoxide | 1.6 | 60 | 193.2 ± 347.8 | 46.5 ± 109.5 | 19.0 ± 31.3 | 76.7 ± 139.6 |
| HCCP | 1.1 | 0 | 0.8 ± 0.0 | 0.8 ± 0.0 | 0.8 ± 0.0 | 0.8 ± 0.0 |
| Lindane | 2.3 | 85 | 47.5 ± 68.8 | 8.8 ± 7.7 | 7.5 ± 8.2 | 12.8 ± 16.5 |
| Malathion | 3.1 | 100 | 27.5 ± 21.5 | 18.0 ± 20.3 | 22.1 ± 27.8 | 27.3 ± 36.8 |
| Methoxychlor | 1.3 | 100 | 401.6 ± 712.9 | 257.6 ± 651.8 | 67.6 ± 165.8 | 265.3 ± 608.2 |
| Mirex | 1.8 | 96 | 733.8 ± 2034 | 228.2 ± 785.7 | 125.5 ± 314.5 | 554.4 ± 1621 |
| Parathion-ethyl | 2.6 | 64 | 9.2 ± 7.8 | 8.1 ± 14.0 | 8.7 ± 12.8 | 8.2 ± 13.8 |
| Parathion-methyl | 2.0 | 74 | 25.8 ± 21.8 | 24.1 ± 25.6 | 22.8 ± 18.8 | 16.9 ± 13.0 |
| Phosmet | 2.4 | 87 | 55.1 ± 28.7 | 84.4 ± 93.0 | 54.5 ± 55.9 | 54.2 ± 144.5 |
| Pirimicarb | 1.5 | 100 | 104.0 ± 89.9 | 77.3 ± 70.9 | 115.7 ± 156.1 | 147.1 ± 234.5 |
| Tetrachlorvinphos | 1.2 | 100 | 563.1 ± 1462 | 417.1 ± 1123 | 179.2 ± 389.4 | 621.2 ± 1739 |
| % Frequency > MDL | 85 | |||||
| Insecticides (Σaverage) | 14,731 ± 1541 | 10,499 ± 1625 | 6059 ± 696 | 19,974 ± 2897 | ||
| EU Legislation | Pesticides | Sado Estuary Annual Average Values (ng/L) | Directive Annual Values (ng/L) | License | log Kow | log Koc | GUS Index | |
|---|---|---|---|---|---|---|---|---|
| Drinking waters Directive 98/83/EC | Fungicides | |||||||
| Azoxystrobin | 393 | 100 | A | 2.5 | 2.8 | 2.6 | ||
| Difenoconazole | 1830 | 100 | A | 4.4 | 3.6 | 0.9 | ||
| Tebuconazole | 460 | 100 | A | 3.7 | 3.7 | 2.0 | ||
| Herbicides | ||||||||
| Cyhalofop-butyl | 490 | 100 | A | 6.0 | 3.7 | −0.2 | ||
| Metribuzin | 132 | 100 | A | 1.7 | 1.8 | 2.6 | ||
| Insecticides | ||||||||
| Aldrin | 142 | 100 | B | 6.5 | 4.2 | −0.4 | ||
| Azinphos-methyl | 1926 | 100 | NA | 3.0 | 3.0 | 1.0 | ||
| Chlorpyriphos | 156 | 100 | A | 4.7 | 3.9 | 0.2 | ||
| Chlorfenvinphos | 155 | 100 | NA | 3.8 | 2.8 | 1.9 | ||
| Cyfluthrine | 1621 | 100 | A | 5.6 | 4.8 | −1.7 | ||
| Cyhalothrin-λ | 380 | 100 | A | 6.8 | 5.2 | −2.1 | ||
| Cypermethrin-α | 479 | 100 | A | 6.9 | 4.4 | −2.1 | ||
| DDD | 242 | 100 | B | 6.9 | 4.7 | −0.9 | ||
| DDE | 101 | 100 | B | 6.9 | 4.9 | −2.0 | ||
| DDT | 285 | 100 | B | 6.9 | 5.9 | −4.5 | ||
| Deltametrin | 624 | 100 | A | 4.6 | 7.0 | −3.4 | ||
| Diazinon | 299 | 100 | NA | 3.7 | 2.8 | 1.1 | ||
| Dieldrin | 330 | 100 | B | 3.7 | 4.4 | −0.3 | ||
| Dimethoate | 445 | 100 | A | 0.7 | 1.0 | 1.1 | ||
| Endosulfan | 547 | 100 | NA | 4.8 | 4.2 | −0.1 | ||
| Endosulfan-sulphate | 572 | 100 | NA | 3.7 | 3.7 | 0.5 | ||
| Endrin | 534 | 100 | NA | 3.2 | 4.0 | 0.0 | ||
| Fenamiphos | 2335 | 100 | A | 3.3 | 2.0 | −0.1 | ||
| Methoxychlor | 248 | 100 | NA | 3.8 | 4.9 | −1.9 | ||
| Mirex | 410 | 100 | B | 5.3 | 3.8 | 0.6 | ||
| Pirimicarb | 111 | 100 | A | 1.7 | 2.6 | 2.7 | ||
| Tetrachlorvinphos | 445 | 100 | NA | 3.5 | 3.0 | 0.3 | ||
| ΣAldrin,Dieldrin,Heptachlor,Heptachlor epoxide | 1006 | 100 | B; B; B; NA | 5.2 | 4.3 | −0.7 | ||
| Concentration (average) of the pesticides above 98/83/EC | 596 | |||||||
| EU Legislation | Pesticides | Sado estuary Annual average values (ng/L) | Directive Annual values (ng/L) | License | log Kow | log Koc | GUS index | |
| Surface waters Directive 2013/39/EU | Fungicides | |||||||
| HCP | 3 | 0.02 | - | 4.0 | 3.6 | 0.4 | ||
| PCB | 13 | 7 | NA | 4.8–5.2 | 4.5 | −1.2 | ||
| Herbicides | ||||||||
| Alachor | 7 | 300 | NA | 3.7 | 2.5 | 0.8 | ||
| Atrazine | 9 | 600 | NA | 2.7 | 2.0 | 3.3 | ||
| Simazine | 38 | 1000 | NA | 2.3 | 2.1 | 2.0 | ||
| Terbutryn | 10 | 65 a–0.65 b | NA | 3.7 | 3.4 | 2.4 | ||
| Trifluralin | 3 | 30 | NA | 5.3 | 4.2 | 0.1 | ||
| Insecticides | ||||||||
| Chlorfenvinphos | 155 | 100 | A | 4.7 | 3.9 | 0.2 | ||
| Cypermethrin | 242 | 0.08 a–0.008 b | A | 6.9 | 4.4 | −2.1 | ||
| 4.4’-DDD | 547 | 25 | B | 6.9 | 4.7 | −0.9 | ||
| Dichlorvos | 479 | 0.6 a–0.06 b | NA | 1.9 | 1.7 | 0.7 | ||
| Endosulfan | 56 | 5 a–0.5 b | NA | 4.7–4.8 | 4.1–4.3 | −0.1 | ||
| Heptachlor | 13 | 2 × 10⁻⁴ a–1 ×10⁻⁴ b | B | 5.4 | 4.4 | −0.9 | ||
| Heptachlor epoxide | 84 | 2 × 10⁻⁴ a–1 × 10⁻⁴b | NA | 4.4–5.5 | 4.3 | −1.1 | ||
| ΣAldrin. Dieldrin. Endrin. Isodrin * | 1006 | 5 a–10 b | B; B; NA; - | 4.5 | 4.2 | −0.2 | ||
| The average concentration above 2013/39/EU | 178 | |||||||
| a | Inland surface waters | Licence according to the EU Pesticides Database: NA—authorised; A—Authorised; B—Banned | ||||||
| b | Other surface waters | GUS index (groundwater ubiquity score; GUS = log10 (half life-days) × [4 − log10 (Koc)]) | ||||||
| * | Isodrin was not evaluated in this study | |||||||
| Pesticides | MEC (mg/L) | Algae 72 h EC50 Growth (mg/L) | Invertebrates 48 h EC50 (mg/L) | Fish 96 h LC50 (mg/L) | PNEC (mg/L) | Individual RQ (MEC/PNEC) | RQ TU Algae (MEC/EC50) | RQ TU Invert. (MEC/EC50) | RQ TU Fish (MEC/EC50) | ||
|---|---|---|---|---|---|---|---|---|---|---|---|
| FUNGICIDES | Azoxystrobin | 4.5 × 10⁻³ | 3.6 × 10⁻¹ | 2.3 × 10⁻¹ | 4.7 × 10⁻¹ | 2.3 × 10⁻³ | 2.0 | 0.0 | 0.0 | 0.0 | |
| Difenoconazol | 4.2 × 10⁻² | 3.2 × 10⁻² | 7.7 × 10⁻¹ | 1.1 × 100 | 3.2 × 10⁻⁴ | 130.4 | 1.3 | 0.1 | 0.0 | ||
| HCB | 2.2 × 10⁻⁵ | 1.0 × 10⁻² | 5.0 × 10⁻¹ | 3.0 × 10⁻² | 1.0 × 10⁻⁴ | 0.2 | 0.0 | 0.0 | 0.0 | ||
| PeCB | 1.0 × 10⁻⁴ | 1.3 × 10 | - | 2.5 × 10⁻¹ | 2.5 × 10⁻³ | 0.0 | 0.0 | - | 0.0 | ||
| Procymidone | 6.6 × 10⁻³ | 2.6 × 10 | 1.8 × 100 | 7.2 × 100 | 1.8 × 10⁻² | 0.4 | 0.0 | 0.0 | 0.0 | ||
| Tebuconazole | 5.4 × 10⁻³ | 2.0 + | 2.8 × 100 | 4.4 × 100 | 2.0 × 10⁻² | 0.3 | 0.0 | 0.0 | 0.0 | ||
| HERBICIDES | Alachlor | 5.2 × 10⁻⁵ | 9.7 × 10⁻¹ | 1.0 × 10 | 1.8 × 100 | 9.7 × 10⁻³ | 0.0 | 0.0 | 0.0 | 0.0 | |
| Atrazine | 5.8 × 10⁻⁵ | 5.9 × 10⁻² | 8.5 × 10 | 4.0 × 100 | 5.9 × 10⁻⁴ | 0.1 | 0.0 | 0.0 | 0.0 | ||
| Atrazine-desethyl | 1.9 × 10⁻⁴ | 1.0 × 10⁻¹ | - | - | 1.0 × 10⁻³ | 0.2 | 0.0 | - | - | ||
| Cyanazine | 3.2 × 10⁻⁴ | 2.0 × 10⁻¹ | 4.9 × 10 | 1.0 × 101 | 2.0 × 10⁻³ | 0.2 | 0.0 | 0.0 | 0.0 | ||
| Cyhalofop-butyl | 4.9 × 10⁻³ | 9.6 × 10⁻¹ | 2.7 × 100 | 7.9 × 10⁻¹ | 7.9 × 10⁻³ | 0.6 | 0.0 | 0.0 | 0.0 | ||
| Metolachlor | 2.5 × 10⁻⁵ | 5.7 × 101 | 2.4 × 10 | 3.9 × 100 | 3.9 × 10⁻² | 0.0 | 0.0 | 0.0 | 0.0 | ||
| Metribuzin | 8.7 × 10⁻⁴ | 2.0 × 10⁻² | 4.9 × 10 | 7.5 × 101 | 2.0 × 10⁻⁴ | 4.3 | 0.0 | 0.0 | 0.0 | ||
| Pendimethalin | 3.2 × 10⁻⁵ | 6.0 × 10⁻³ | 2.8 × 10⁻¹ | 1.4 × 10⁻¹ | 6.0 × 10⁻⁵ | 0.5 | 0.0 | 0.0 | 0.0 | ||
| Propazine | 6.9 × 10⁻⁴ | 1.8 × 10⁻¹ | 1.8 × 10 | 1.8 × 101 | 1.8 × 10⁻³ | 0.4 | 0.0 | 0.0 | 0.0 | ||
| Propyzamide | 1.9 × 10⁻⁴ | 2.8 × 10 | 5.6 × 100 | 4.7 × 100 | 2.8 × 10⁻² | 0.0 | 0.0 | 0.0 | 0.0 | ||
| Simazine | 2.5 × 10⁻⁴ | 4.0 × 10⁻² | 1.1 × 100 | 9.0 × 101 | 4.0 × 10⁻⁴ | 0.6 | 0.0 | 0.0 | 0.0 | ||
| Simetryn | 1.1 × 10⁻⁴ | 9.8 × 10⁻³ | - | 7.0 × 100 | 9.8 × 10⁻⁵ | 1.1 | 0.0 | - | 0.0 | ||
| Terbuthylazine | 8.4 × 10⁻⁴ | 1.2 × 10⁻² | 2.1 × 10 | 2.2 × 100 | 1.2 × 10⁻⁴ | 7.0 | 0.1 | 0.0 | 0.0 | ||
| Terbutryn | 6.3 × 10⁻⁵ | 2.4 × 10⁻³ | 2.7 × 100 | 1.1 × 100 | 2.4 × 10⁻⁵ | 2.6 | 0.0 | 0.0 | 0.0 | ||
| Trifluralin | 1.9 × 10⁻⁵ | 1.2 × 10⁻² | 2.5 × 10⁻¹ | 8.8 × 10⁻² | 1.2 × 10⁻⁴ | 0.2 | 0.0 | 0.0 | 0.0 | ||
| INSECTICIDES | Aldrin | 2.5 × 10 −3 | - | 2.8 × 10⁻² | 4.6 × 10⁻³ | 4.6 × 10⁻⁵ | 53.7 | - | 0.1 | 0.5 | |
| Azinphos-methyl | 2.4 × 10⁻² | 7.2 × 100 | 1.1 × 10⁻³ | 2.0 × 10⁻² | 1.1 × 10⁻⁵ | 2201.7 | 0.0 | 22.0 | 1.2 | ||
| Chlordane-γ | 5.4 × 10⁻⁴ | - | 5.9 × 10⁻¹ | 9.0 × 10⁻² | 9.0 × 10⁻⁴ | 0.6 | - | 0.0 | 0.0 | ||
| Chlorpyriphos | 3.3 × 10⁻³ | 4.8 × 10⁻¹ | 4.0 × 10⁻⁵ | 1.3 × 10⁻³ | 4.0 × 10⁻⁷ | 8276.7 | 0.0 | 82.8 | 2.5 | ||
| Chlorfenvinphos | 3.0 × 10⁻³ | 1.4 × 100 | 2.5 × 10⁻⁴ | 1.1 × 100 | 2.5 × 10⁻⁶ | 1200.3 | 0.0 | 12.0 | 0.0 | ||
| Cyfluthrin | 3.1 × 10⁻² | 1.0 × 10 | 1.6 × 10⁻⁴ | 4.7 × 10⁻⁴ | 1.6 × 10⁻⁶ | 19,631.9 | 0.0 | 196.3 | 66.8 | ||
| Cyhalothrin- γ | 4.9 × 10⁻³ | - | 3.8 × 10⁻¹ | 4.6 × 10⁻⁴ | 4.6 × 10⁻⁶ | 1064.6 | - | 0.0 | 10.6 | ||
| Cypermethrin-α | 6.0 × 10⁻³ | 1.0 × 10⁻¹ | 3.0 × 10⁻⁴ | 2.8 × 10⁻³ | 3.0 × 10⁻⁶ | 1990.2 | 0.1 | 19.9 | 2.1 | ||
| ΣDDD,DDE,DDT | 1.3 × 10⁻² | - | 5.0 × 10⁻³ | 7.0 × 100 | 5.0 × 10⁻⁵ | 265.3 | - | 2.7 | 0.0 | ||
| Deltametrin | 9.1 × 10⁻³ | 9.1 × 100 | 5.6 × 10⁻⁴ | 2.6 × 10⁻⁴ | 2.6 × 10⁻⁶ | 3511.8 | 0.0 | 16.3 | 35.1 | ||
| Diazinon | 2.6 × 10⁻³ | 6.4 × 100 | 1.0 × 10⁻³ | 3.1 × 100 | 1.0 × 10⁻⁵ | 260.2 | 0.0 | 2.6 | 0.0 | ||
| Dichlorvos | 4.5 × 10⁻⁴ | 5.3 × 10 | 1.9 × 10⁻⁴ | 5.5 × 10⁻¹ | 1.9 × 10⁻⁶ | 236.3 | 0.0 | 2.4 | 0.0 | ||
| Dieldrin | 6.6 × 10⁻³ | 1.0 × 10⁻¹ | 2.5 × 10⁻¹ | 1.2 × 10⁻³ | 1.2 × 10⁻⁵ | 549.7 | 0.1 | 0.0 | 5.5 | ||
| Dimethoate | 3.0 × 10⁻³ | 9.0 × 10 | 2.0 × 100 | 3.0 × 10 | 2.0 × 10⁻² | 0.1 | 0.0 | 0.0 | 0.0 | ||
| Endosulfan (α + β) | 9.1 × 10⁻³ | 2.2 × 100 | 4.4 × 10⁻¹ | 2.0 × 10⁻³ | 2.0 × 10⁻⁵ | 456.5 | 0.0 | 0.0 | 4.6 | ||
| Endosulfan sulfate | 5.9 × 10⁻³ | - | - | - | - | - | - | - | - | ||
| Endrin | 1.1 × 10⁻² | - | 4.20 × 10⁻³ | 7.3 × 10⁻⁴ | 7.3 × 10⁻⁶ | 1250.8 | - | 2.2 | 12.5 | ||
| Fenamiphos | 4.3 × 10⁻² | 3.8 × 100 | 1.90 × 10⁻³ | 9.3 × 10⁻³ | 1.9 × 10⁻⁵ | 2272.0 | 0.0 | 22.7 | 4.6 | ||
| Fenitrothion | 9.1 × 10⁻⁵ | 1.3 × 100 | 8.60 × 10⁻³ | 1.3 × 100 | 8.6 × 10⁻⁵ | 1.1 | 0.0 | 0.0 | 0.0 | ||
| Fonofos | 5.3 × 10⁻⁴ | 1.5 × 100 | 2.30 × 10⁻³ | 2.8 × 10⁻² | 2.3 × 10⁻⁵ | 23.0 | 0.0 | 0.2 | 0.0 | ||
| Heptachlor | 2.7 × 10⁻⁴ | 2.7 × 10⁻² | 4.20 × 10⁻² | 7.0 × 10⁻³ | 7.0 × 10⁻⁵ | 3.9 | 0.0 | 0.0 | 0.0 | ||
| Heptachlor epoxide | 9.2 × 10⁻⁴ | 2.0 × 10² | 2.40 × 10⁻¹ | 2.0 × 10⁻² | 2.0 × 10⁻⁴ | 4.6 | 0.0 | 0.0 | 0.0 | ||
| HCCP | 8.0 × 10⁻⁷ | - | 5.20 × 10⁻² | 2.4 × 100 | 5.2 × 10⁻⁴ | 0.0 | - | 0.0 | 0.0 | ||
| Lindane | 2.1 × 10⁻⁴ | 2.5 × 100 | 1.60 × 100 | 2.9 × 10⁻³ | 2.9 × 10⁻⁵ | 7.4 | 0.0 | 0.0 | 0.1 | ||
| Malathion | 1.2 × 10⁻⁴ | 1.3 × 10 | 7.0 × 10⁻⁴ | 1.8 × 10⁻² | 7.0 × 10⁻⁶ | 17.4 | 0.0 | 0.2 | 0.0 | ||
| Methoxychlor | 2.6 × 10⁻³ | 6.0 × 10⁻¹ | 7.8 × 10⁻⁴ | 5.2 × 10⁻² | 7.8 × 10⁻⁶ | 329.8 | 0.0 | 3.3 | 0.0 | ||
| Mirex | 5.8 × 10⁻³ | 1.0 × 10⁻¹ | 1.0 × 10⁻¹ | 1.0 × 10² | 1.0 × 10⁻³ | 5.8 | 0.1 | 0.1 | 0.0 | ||
| ∑Parathion-methyl. ethyl | 1.5 × 10⁻⁴ | 3.0 × 100 | 7.3 × 10⁻³ | 2.7 × 100 | 7.3 × 10⁻⁵ | 2.0 | 0.0 | 0.0 | 0.0 | ||
| Phosmet | 4.4 × 10⁻⁴ | 7.0 × 10⁻² | 2.0 × 10⁻³ | 2.3 × 10⁻¹ | 2.0 × 10⁻⁵ | 21.9 | 0.0 | 0.2 | 0.0 | ||
| Pirimicarb | 7.7 × 10⁻⁴ | 1.4 × 10² | 1.7 × 10⁻² | 1.0 × 10² | 1.7 × 10⁻⁴ | 4.5 | 0.0 | 0.0 | 0.0 | ||
| Tetrachlorvinphos | 5.3 × 10⁻³ | - | 2.0 × 10⁻³ | 4.3 × 10⁻¹ | 2.0 × 10⁻⁵ | 262.9 | - | 2.6 | 0.0 | ||
| ∑RQMEC/PNEC | 44,058 | ||||||||||
| First-tier (CA-based) | 1.7 | 388.8 | 146.6 | ||||||||
| RQSTU | 38,875 | ||||||||||
| Second-tier (IA-based) | maxRQSTU/maxTU | 2.0 | |||||||||
| Season | Sites | T (°C) | pH | DO (mg/L) | Salinity (PSU) | Nitrites (mg/L) | Nitrates (mg/L) | Ammonium (mg/L) | Phosphates (mg/L) |
|---|---|---|---|---|---|---|---|---|---|
| Spring (n = 5) | A–E | 16.9 ± 1.1 | 8.0 ± 0.3 | 7.8 ± 2.0 | 31.1 ± 3.7 | 0.02 ± 0.0 | 0.2 ± 0.1 | 0.6 ± 0.5 | 0.6 ± 1.9 |
| Summer (n = 10) | 20.4 ± 1.9 | 8.1 ± 0.2 | 6.6 ± 2.4 | 34.8 ± 1.3 | 0.04 ± 0.1 | 0.2 ± 0.2 | 0.6 ± 0.6 | 1.2 ± 1.4 | |
| Autumn (n = 10) | 14.1 ± 2.3 | 8.4 ± 0.2 | 8.2 ± 1.0 | 31.0 ± 5.4 | 0.02 ± 0.0 | 0.4 ± 0.2 | 1.1 ± 1.5 | 0.7 ± 1.0 | |
| Winter (n = 5) | 12.7 ± 2.6 | 8.2 ± 0.1 | 9.3 ± 0.5 | 28.8 ± 5.6 | 0.03 ± 0.0 | 0.4 ± 0.2 | 0.5 ± 0.4 | 0.01 ± 0.0 | |
| Spring (n = 4) | F–I | 17.6 ± 0.4 | 7.7 ± 0.3 | 6.0 ± 1.8 | 16.9 ± 13.8 | 0.03 ± 0.0 | 1.0 ± 0.5 | 0.8 ± 0.6 | 0.5 ± 0.3 |
| Summer (n = 8) | 22.3 ± 2.1 | 7.9 ± 0.3 | 5.4 ± 1.9 | 12.8 ± 14.7 | 0.07 ± 0.1 | 1.3 ± 2.6 | 0.7 ± 0.9 | 3.0 ± 1.6 | |
| Autumn (n = 8) | 12.6 ± 3.6 | 8.1 ± 0.3 | 7.6 ± 1.4 | 10.0 ± 13.1 | 0.06 ± 0.0 | 1.0 ± 0.7 | 0.4 ± 0.3 | 0.8 ± 0.5 | |
| Winter (n = 4) | 11.2 ± 0.5 | 7.9 ± 0.4 | 6.5 ± 4.8 | 12.8 ± 13.5 | 0.07 ± 0.0 | 0.2 ± 0.4 | 0.4 ± 0.2 | 0.3 ± 0.6 |
Disclaimer/Publisher’s Note: The statements, opinions and data contained in all publications are solely those of the individual author(s) and contributor(s) and not of MDPI and/or the editor(s). MDPI and/or the editor(s) disclaim responsibility for any injury to people or property resulting from any ideas, methods, instructions or products referred to in the content. |
© 2023 by the authors. Licensee MDPI, Basel, Switzerland. This article is an open access article distributed under the terms and conditions of the Creative Commons Attribution (CC BY) license (https://creativecommons.org/licenses/by/4.0/).
Share and Cite
Rocha, M.J.; Rocha, E. Chemical Survey and Risk Assessment of 56 Pesticides in the Sado River Estuary (Iberian Peninsula, Portugal). Toxics 2023, 11, 457. https://doi.org/10.3390/toxics11050457
Rocha MJ, Rocha E. Chemical Survey and Risk Assessment of 56 Pesticides in the Sado River Estuary (Iberian Peninsula, Portugal). Toxics. 2023; 11(5):457. https://doi.org/10.3390/toxics11050457
Chicago/Turabian StyleRocha, Maria João, and Eduardo Rocha. 2023. "Chemical Survey and Risk Assessment of 56 Pesticides in the Sado River Estuary (Iberian Peninsula, Portugal)" Toxics 11, no. 5: 457. https://doi.org/10.3390/toxics11050457
APA StyleRocha, M. J., & Rocha, E. (2023). Chemical Survey and Risk Assessment of 56 Pesticides in the Sado River Estuary (Iberian Peninsula, Portugal). Toxics, 11(5), 457. https://doi.org/10.3390/toxics11050457