Article

Exposure and Risk Assessment to Airborne dl-PCBs and Dioxins in the Population Living in the Neighborhood of a Cement Plant: A Pilot Study in the Valencian Region of Spain

1
Public Health Laboratory of Valencia, 21, Avenida Catalunya, 46020 Valencia, Spain
2
Foundation for the Promotion of Health and Biomedical Research in the Valencian Region, FISABIO—Public Health, 21, Avenida Catalunya, 46020 Valencia, Spain
*
Author to whom correspondence should be addressed.
Toxics 2023, 11(4), 389; https://doi.org/10.3390/toxics11040389
Submission received: 21 March 2023 / Revised: 19 April 2023 / Accepted: 19 April 2023 / Published: 20 April 2023
(This article belongs to the Special Issue The Latest Advances in Air Pollution and Human Health)

Abstract

:
Emissions from cement manufacturing facilities may increase health risks in nearby populations. For this reason, dioxin-like PCB (dl-PCB), polychlorinated dibenzo-p-dioxin (PCDD), and polychlorinated dibenzofuran (PCDF) concentrations in PM10 samples were assessed in the vicinity of a cement manufacturing plant located in the Valencian Region (eastern Spain). The total concentrations of the sum of dl-PCBs, PCDDs, and PCDFs ranged between 1.85 and 42.53 fg TEQ/m3 at the assessed stations. The average daily inhalation dose (DID) for the sum in adults ranged from 8.93 · 10−4 to 3.75 · 10−3 pg WHO TEQ kg−1 b.w. d−1, and, for children, the DID ranged from 2.01 · 10−3 to 8.44 · 10−3 pg WHO TEQ kg−1 b.w. d−1. Risk assessment for adults and children was performed using both daily and chronic exposure. The hazard quotient (HQ) was calculated considering 0.025 pg WHO TEQ kg−1 b.w. d−1 to be the acceptable maximum permitted inhalation exposure. The HQ obtained was slightly higher than 1 for PCDD/Fs at one of the stations (Chiva), indicating a possible health risk for the population under study due to inhalation exposure. In the case of chronic exposure, cancer risk (>10−6) was observed for some samples in one of the assessed sampling sites (Chiva).

Graphical Abstract

1. Introduction

Cement production has increased around the world as a consequence of the growth of population and urbanization ratio [1]. Dioxins, furans (PCDD/Fs), and dioxin-like PCBs (dl-PCBs) can be produced in the cement plant due to the fuel or to its synthesis in the gas treatment system [2]. Combustible material introduced in the precalcination zone can react with the chlorine not retained by the alkaline matrix of the clinker producing dl-PCB and dioxin emissions [3].
Dl-PCBs and PCDD/Fs are regulated and are part of the “dirty dozen” (the 12 persistent organic pollutants regulated by the Stockholm Convention) [4]. Their prolonged exposure can cause reproductive, endocrine, and immunological disorders [5,6,7]. The impact and exposure of dl-PCBs and dioxins is a concerning matter because people are exposed to these contaminants for large periods of their lives.
Although many studies have focused on knowing the emissions of PCDD/Fs and PCBs from cement industries by sampling directly inside the stack gas [8,9], there is little written about the exposure of populations close to the cement industry. Breathing dl-PCBs and dioxins airborne in polluted ambient air around locations close to hotspots such as cement plants could be a relevant exposure source in nearby populations. According to the World Health Organization, the daily inhalation exposure can be considered to be 10% of the tolerable daily intake (TDI) by ingestion exposure if we consider the worst-case scenario [10]. Ingestion exposure is considered the main source of dioxin and dl-PCB exposure in non-hotspot areas [11].
Previous risk assessment studies have studied PCDD/Fs in the ambient air of populations living close to cement plants [12,13,14,15]. Nevertheless, no study has investigated the exposure to dl-PCBs in the population located close to cement plants.
Previous studies have shown the population exposure to dl-PCBs and PCDD/Fs in the Valencian Region (Spain). Quijano et al., 2018 [16] observed that the average adult’s daily intake through diet was 1.58 pg TEQ (toxic equivalent) kg −1 b.w. day −1, and the average for children was 2.76 pg TEQ kg −1 b.w. day −1. Daily inhalation exposure to dl-PCBs and PCDD/Fs has been assessed by López et al., 2021 [17], observing a maximum average inhalation exposure of 1.08 · 10−2 pg TEQ kg−1 b.w. day−1 in adults and 2.42 · 10−2 pg TEQ kg−1 b.w. day−1 in children.
The exposure of lactating mothers and breastfed infants to PCDD/Fs and dl-PCBs was below the reference level reported by the EFSA (5.9 pg TEQ g−1) [18], but this value was exceeded when the 95th percentile or the maximum level was considered in a study carried out in the same region in breast milk samples [19]. Consequently, exposure of these compounds in infants, children, and adults is relevant. It is important to highlight that these substances can produce endocrine, reproductive, neurological, and immunological diseases and, finally, decrease life expectancy [20].
Due to the scarce international information about the influence of cement manufacturing emissions on inhalation risk assessment for dl-PCBs, the present work is a pilot study that has focused on measuring dl-PCB, PCDD, and PCDF profile congeners close to a cement plant located in the Valencian Region (Spain) and assessing the potential human health risks in nearby populations.

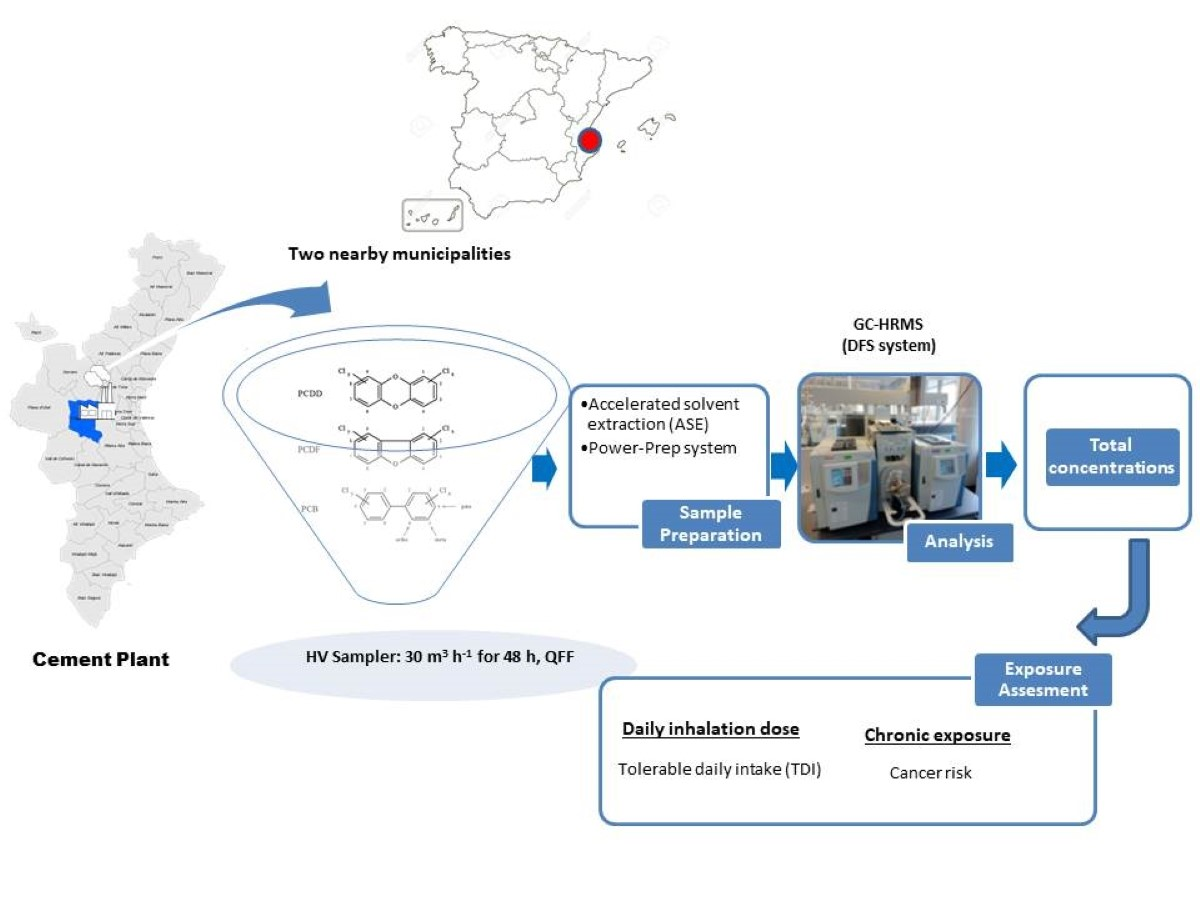
2. Materials and Methods

2.1. Reagents and Chemicals

High-purity reagents dichloromethane, n-hexane, and toluene and HPLC grade acetone were supplied by Merck (Taufkirchen, Germany). 1 µm PTFE filters were supplied by Pall Corporation (South Wagner Road, USA). Columns for sample preparation such as CLDS-ABN-STD (silica), CLDA-BAS-011 (alumina), and CLDC-CCE-034 (carbon) were supplied by Fluid Management System (Watertown, MA, USA) and glass wool for filtration from Merck (Taufkirchen, Germany). Nonane puriss standard for GC was supplied by Merck (Taufkirchen, Germany). The 17 high-purity certified commercial standards of 2,3,7,8-chloro-subsituted PCDD and PCDF and the 12 dl-PCBs congeners, as well as surrogates (EPA1613-LCS and WP-LCS) and internal standards (EPA1613-ISS and WP-ISS), were purchased from Wellington Laboratories (Guelph, ON, Canada).

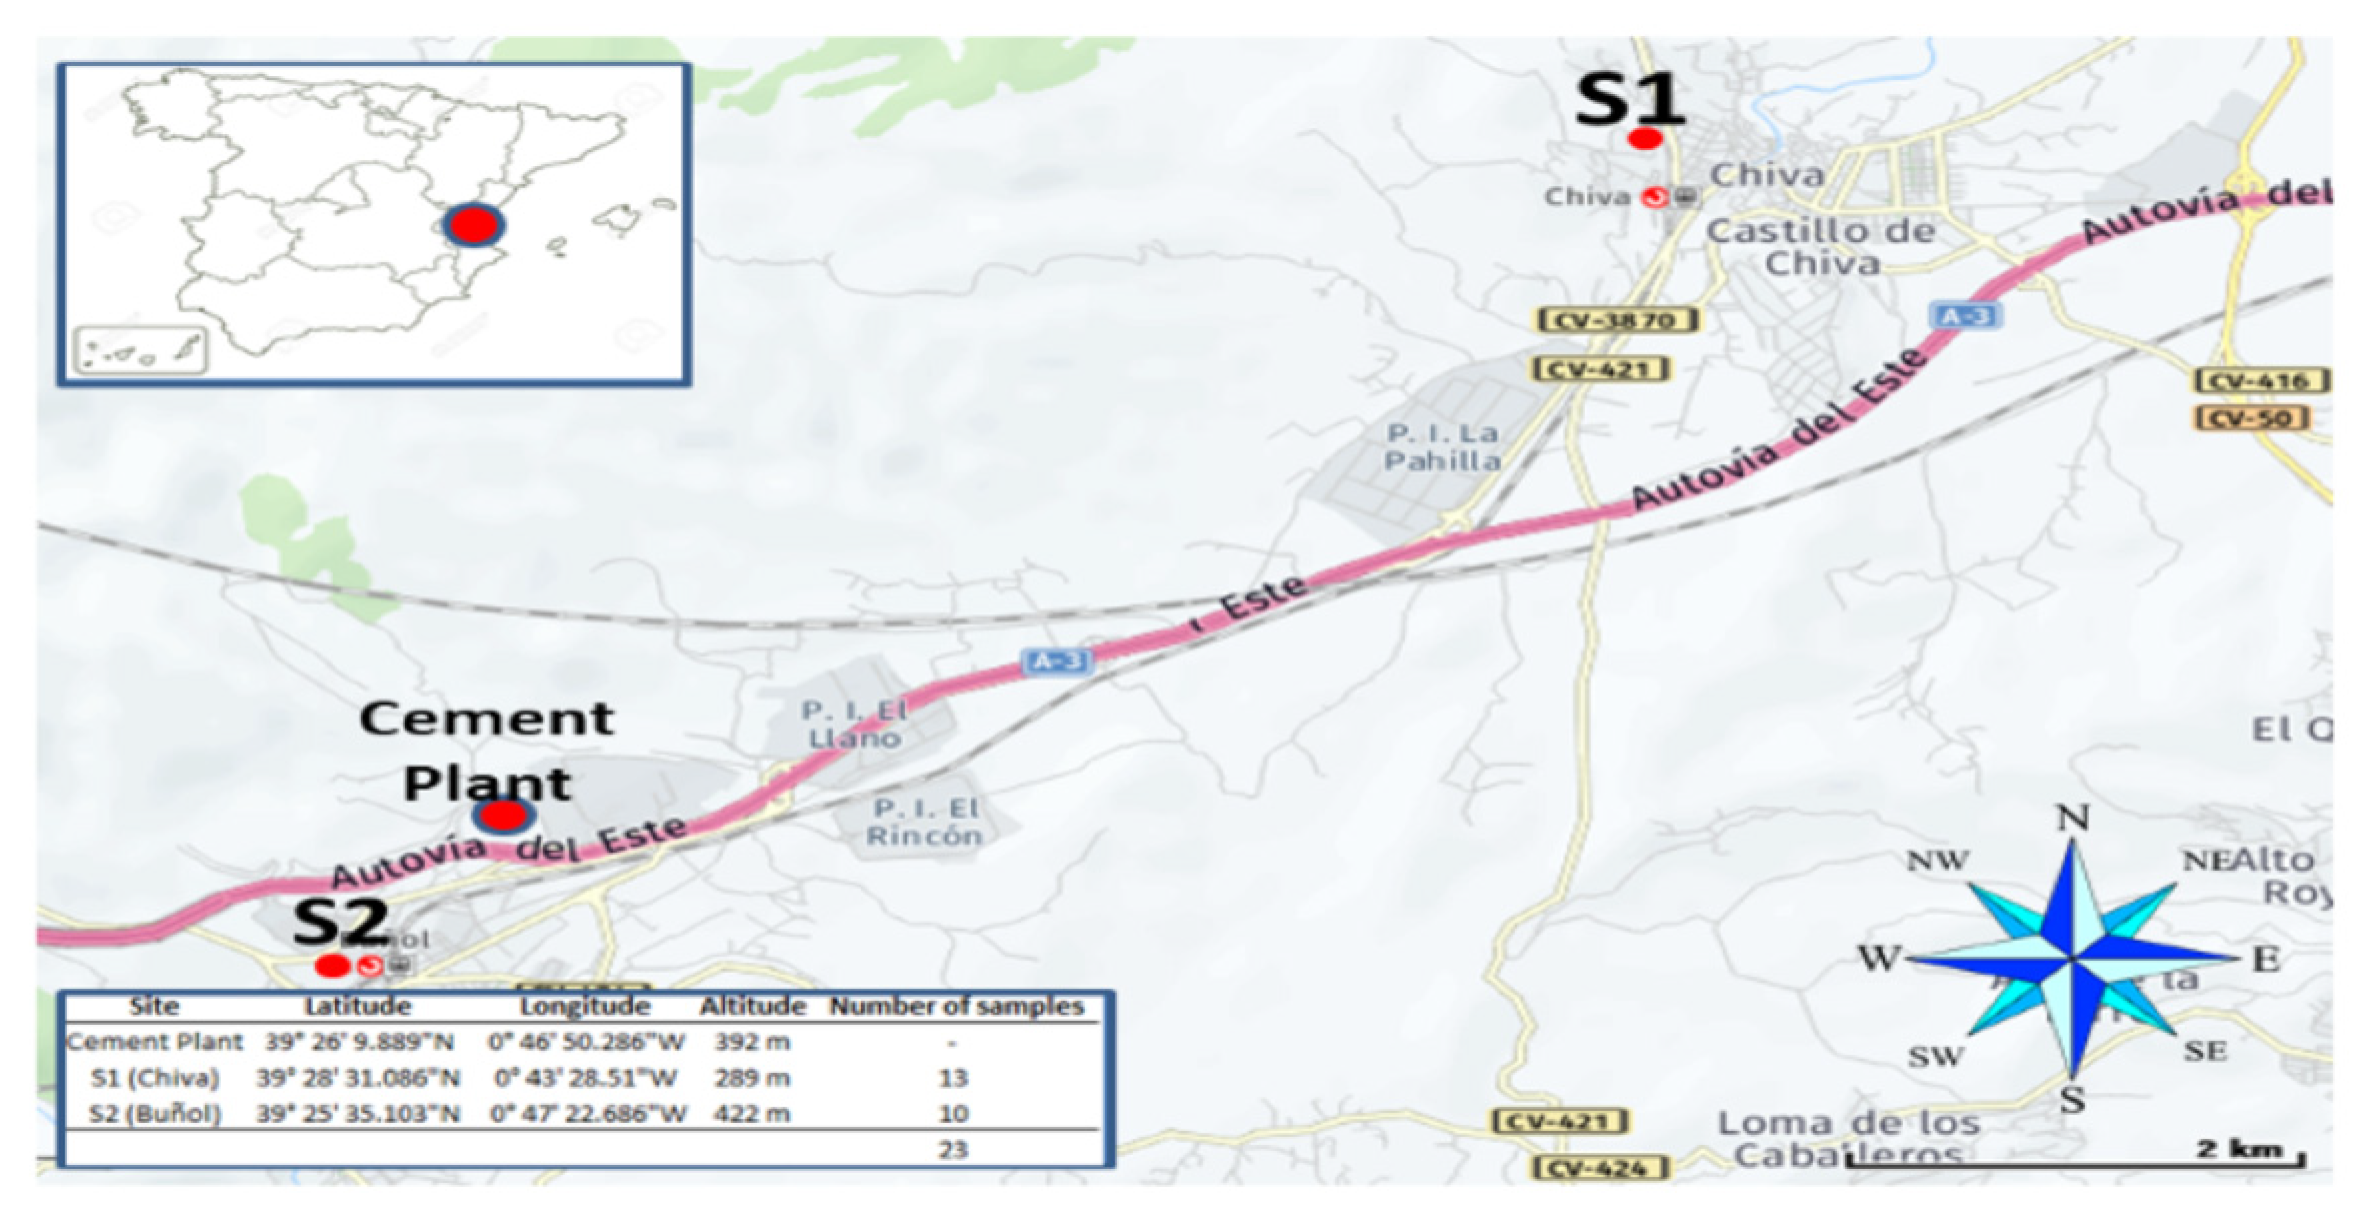
2.2. Sampling and Site Characterization

Samples were collected, as a pilot study, in two towns (Chiva and Buñol) located close to a cement plant in different periods during the year 2020. The S1 sampler was placed in the town of Chiva (14,941 inhabitants) located to the east of the cement plant and 289 m above sea level. Thirteen PM10 samples were collected at this station from February to June 2020.
The S2 sampler was placed in the town of Buñol (9517 inhabitants), located to the west of the cement plant. Ten PM10 samples were collected from August to October 2020 at this station (see Figure 1).
Air samples were taken as described in López et al. (2021) [17], using a high-volume sampling device (HVS) from Digitel (DPA-80, Volketswill, Germany). Total sampling volumes were around 1500 m3 (see Supplementary Table S1) with a sampling flow of 30 m3 h−1 for 48 h. For this, 150 mm diameter quartz fiber filters (QFF) were employed, which were supplied by Munktell Filter AB (Falun, Sweden). Samplers belong to the monitoring network of the Regional Valencia Government (Generalitat Valenciana).

2.3. Analytical Methodology and Identification Criteria

Sample preparation and GC-HRMS system were previously described by López et al. (2021) [17].
Identification and confirmation criteria were based on Commission Regulation 2017/771 [21] and EPA method 1613 [22] (see Supplementary Section S1).
For the calculation of the LOQ (quantification limit), the “Guidance Document on the Estimation of LOD (detection limit) and LOQ (quantification limit) for Measurements in the Field of Contaminants in Feed and Food” [23] was employed. The quantification limit for each sample in PM10 was calculated using TargetQuan software, and the average for the ∑PCDD/Fs and ∑dl-PCBs were 0.43 fg TEQ/m3 and 0.03 fg TEQ/m3, respectively.

2.4. Quality Control Protocol

Each batch of samples included a blank field that was treated in the same way as the air samples. In addition, quality control was carried out using a spiked blank every two analytical sets, and surrogates were evaluated in each sample. Filter analysis was performed after sampling or after the storage period at −20 °C.

2.5. Gaseous-Particle Partitioning Model

To estimate the total air concentrations from the obtained results for PM10, the model validated previously by López et al. (2021) [17] was used, in which the fraction of the compound in the particle phase (ø) and gas phase (1−Ø) was calculated using the Harner–Bidleman absorption model [24]:
Ø = K p · C T S P 1 + K p · C T S P
where CTSP is the concentration of total suspended particles in the air. According to Yusà et al. (2014) [24], its value is 55 µg m−3 in the assessed region, and Kp (m3 µg−1) is the gas-particle partition coefficient; its value can be calculated using the Equation (2):
logKp = logK o a + log f O M 11.91
where log fOM is the fraction of organic matter that was calculated assuming a fOM of 0.2 as representative values in the studied region (Yusà et al., 2014) [25]. Log Koa is the octanol–air partition coefficient, which is different for PCDD/Fs and dl-PCBs. For PCDD/Fs, Koa is a function of the retention time indices (RTI) and temperature (T). The employed formula is different for tetra- to hexa-chlorinated PCDD/Fs (3) and for other PCDD/Fs (4) [24]:
logK o a = 986 T + 0.55 + 1.714 T · RTI 0.0032 · RTI  
logK o a = 1672 T + 2.98 + 0.857 T RTI 7 · 10 5 · RTI  
Dl-PCBs Koa was calculated using the following Equation (5) [26]:
logK o a = K o w + log RT H
where KOW is the octanol–water coefficient for each analyte, T is the temperature (295 K), R is the gas constant (8.21 · 10−5 atm m3 mol−1 K−1), and H is the Henry coefficient (atm m3 mol−1).

2.6. Exposure and Risk Assessment

Based on the risk assessment protocol for human health [27], both (a) daily inhalation exposure and (b) lifetime exposure to PCDD/Fs and dl-PCBs were considered:
(a) In order to calculate the daily intakes, the daily inhalation dose (DID) was estimated for both adults and children (<6 years):
DID = C · IR · ET BW   ( pg   WHO   TEQ   kg 1   b . w . d 1 )
where C is the total ambient air concentration of PPCDD/F and dl-PCB using upper limit concentrations in pg TEQ/m3; IR is the inhalation rate per hour (0.83 m3 h−1 for adults and 0.4 m3 h−1 for children); ET is the exposure time (24 h); and BW is the mean body weight (70 kg for adults and 15 kg for children) [28].
To estimate the risk, the recommended tolerable daily intake (TDI) (0.25 pg TEQ kg−1 day−1 for PCDD/Fs plus dl-PCBs) was taken as reference, according to the EFSA [18].
In order to put this exposure (DID) in a risk assessment context, a hazard quotient (HQ) was also calculated, considering:
(1)
The DID value in each station as p95.
(2)
Considering that daily inhalation exposure accounts for around 10%, this percentage of TDI as a reference health-based value was employed (Equation (7)) [29].
HQ = DID   ( p 95 ) 0.1 · TDI
(b) To calculate the risk of cancer due to lifetime exposure, the product of chronic exposure (CE) and the slope factors (SF) was used [30].
Cancer risk= CE·SF
Cancer exposure was estimated by multiplying the total concentration of each compound analyzed in mg m−3 (C air) and the inhalation factor (IF) (Equation (9)), obtained from Equation (10):
CE = Cair · IF (mg kg−1 day−1)
IF = IR inh · EF · ED · ET BW · AT   ( m 3   kg 1   day 1 )
where IRinh is the inhalation rate per day (20 m3 day−1); EF is the exposure frequency (365 days) per year; ED is the exposure duration (70 years); ET is the exposure time (24 h day−1); BW is the body weight of the subject (70 kg); and AT is average length of time of carcinogenic exposure over a lifetime (25,500 days = 70 years × 365 days per year) [29]. Using these parameters and the Inhalation Risk Units (IUR) of each contaminant, which represent the cancer potency factor for inhalation exposure [30], the SF was calculated according to Equation (11). The IUR values used are shown in Table S2.
SF   ( mg kg   day 1 ) 1 = IUR   ( µ g m 3 ) 1 · BW   ( kg )   ·   1000   ( µ g mg ) IR inh  
The cancer risk values were compared to the carcinogenic benchmark level, considering values higher than 10−6 as concerned cancer risk and values higher than 10−4 as unacceptable [27].

3. Results and Discussion

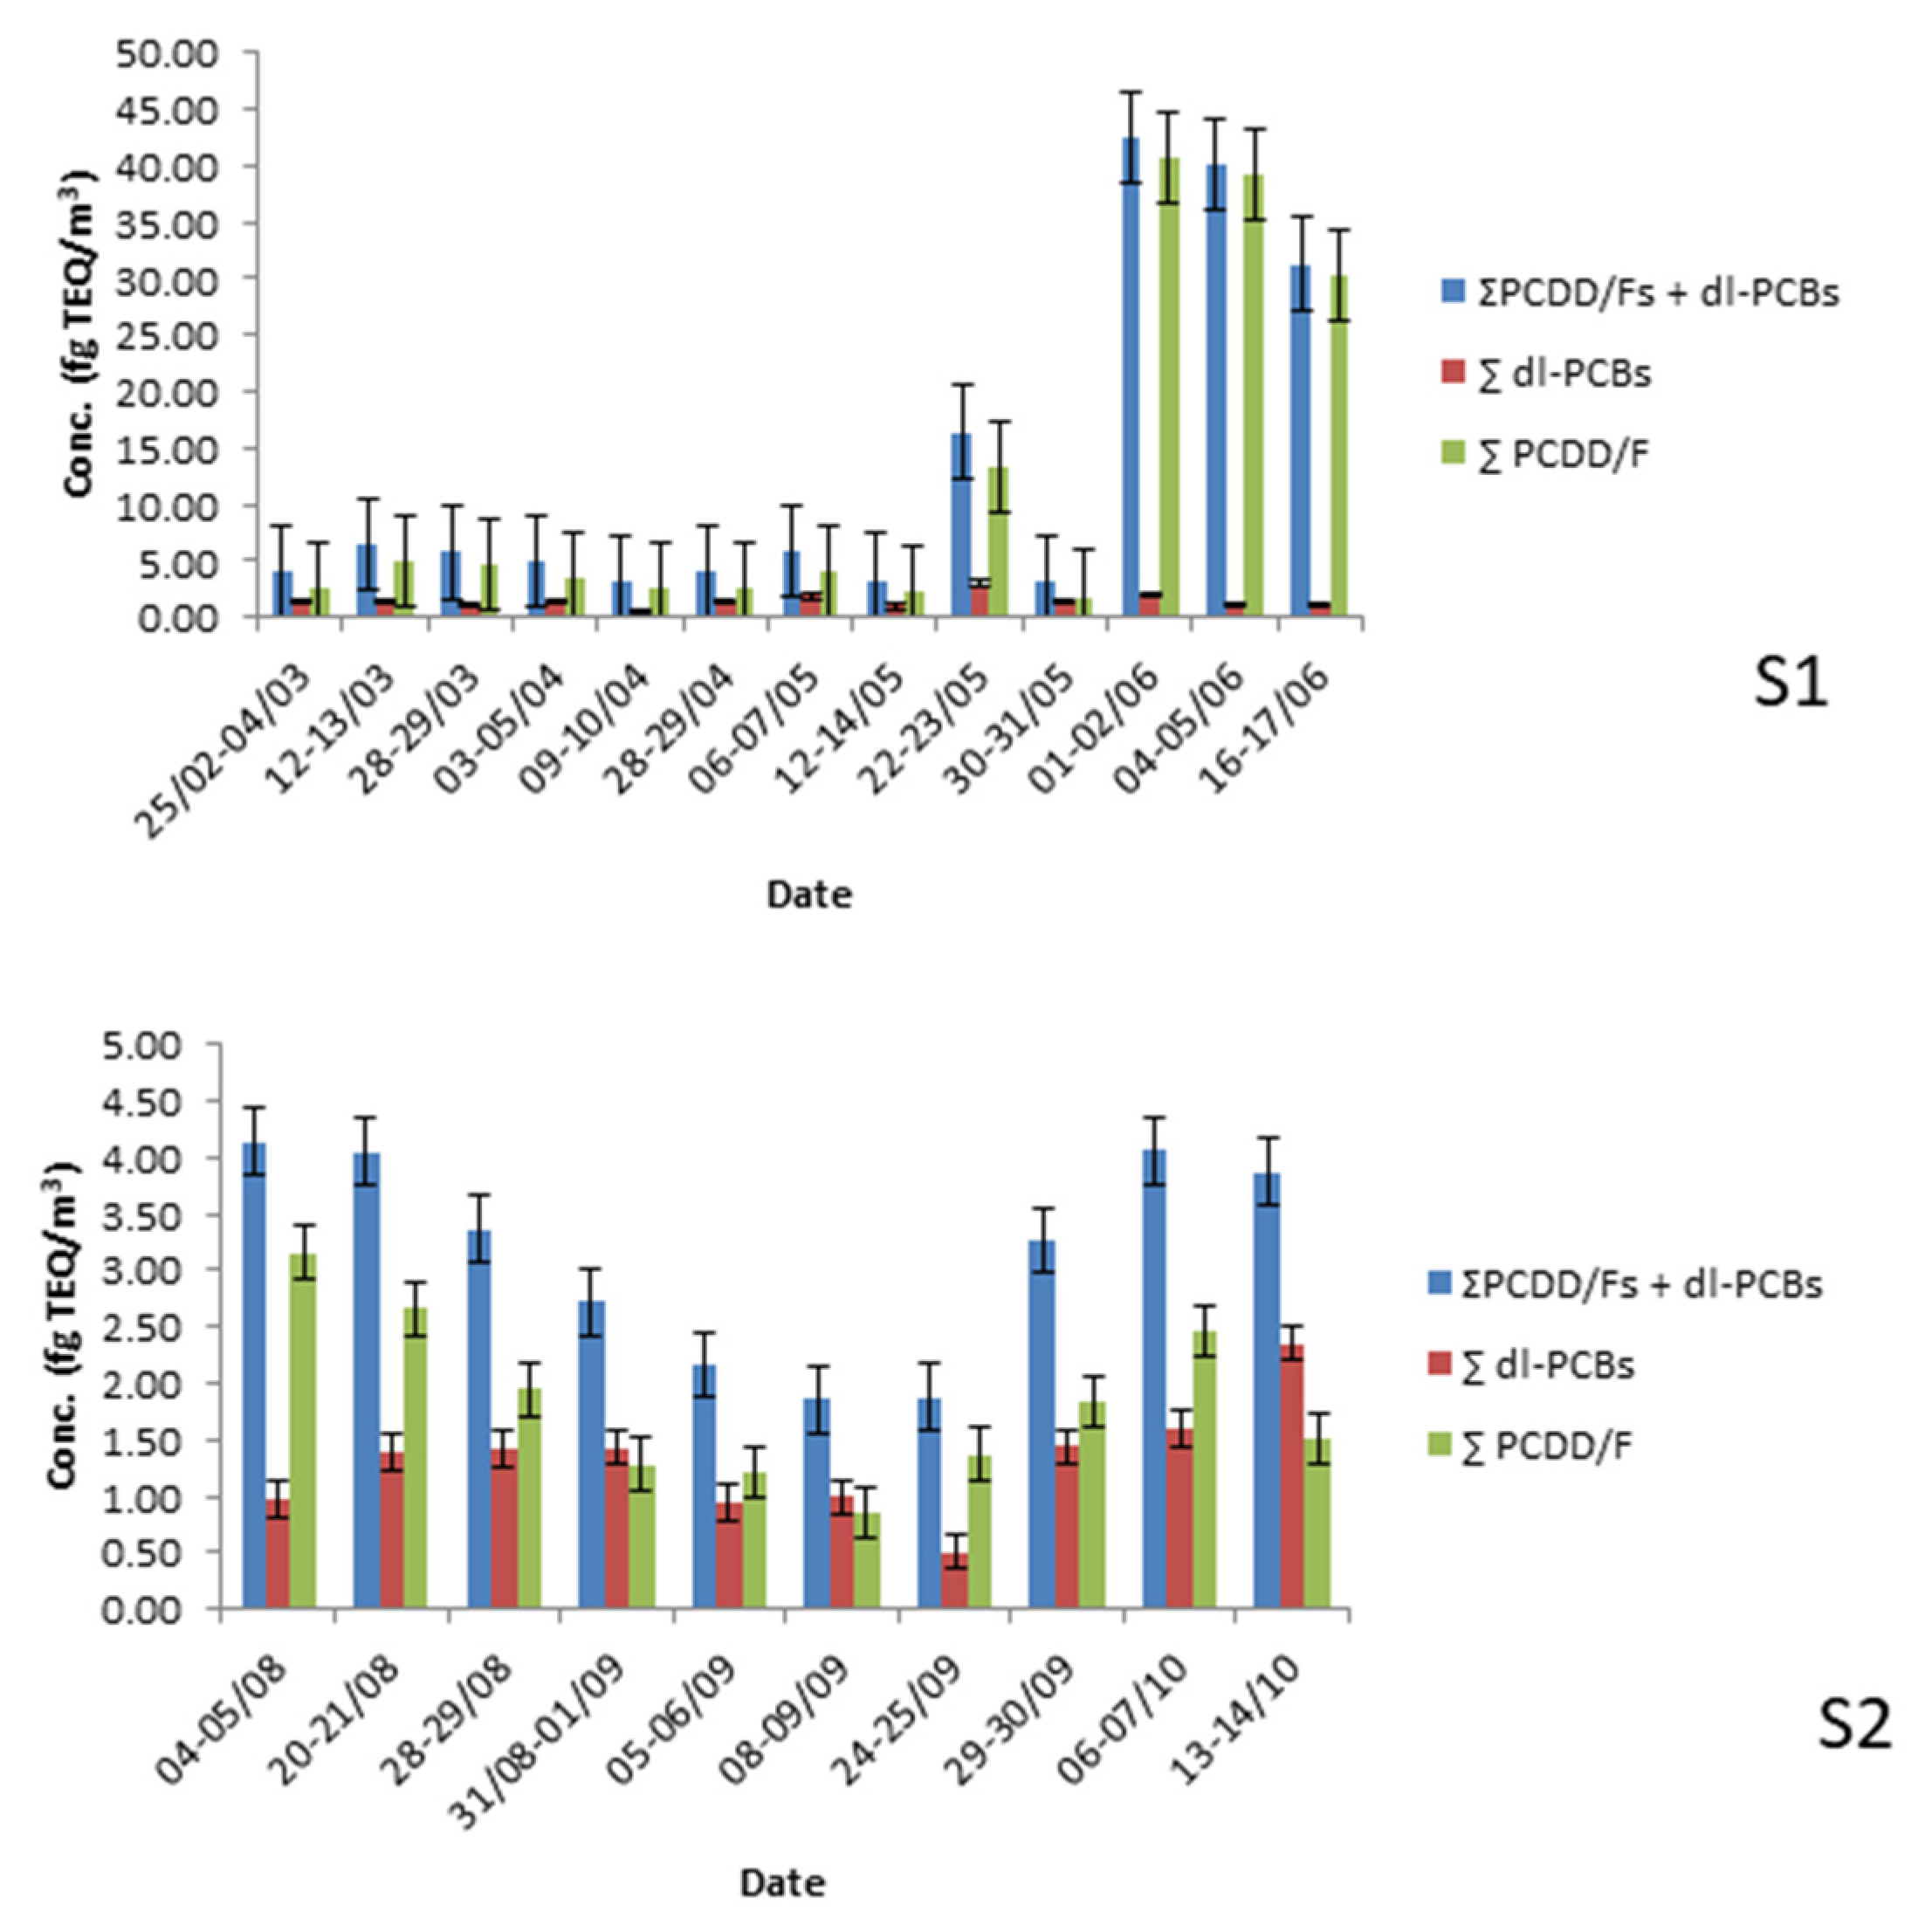
3.1. Total Concentrations

Figure 2 and Table S3 show the results obtained in the S1 (Chiva) and S2 (Buñol) sampling sites for the total concentration (particulate phase plus gas phase) of the ∑dl-PCBs, ∑PCDD/Fs, and the sum of both, in fg TEQ/m3. Overall results are shown in Table 1.
Concentrations of dl-PCBs in Chiva (S1) ranged from 0.59 to 3.03 fg TEQ/m3, obtaining an average mean of 1.43 fg TEQ/m3. Obtained concentrations in Chiva for dl-PCBs were similar to other metallurgical and ceramic areas assessed in the Valencian Region in 2019 (López et al., 2021) [17] and lower than the obtained levels in two different urban areas (more than 2 fg TEQ/m3) of the city of Valencia (the big city close to the assessed sites, around 30 km). Moreover, levels of dl-PCBs in Chiva were lower than other industrial areas in Asia [31,32,33].
Concentrations of dl-PCBs in Buñol (S2) oscillated from 0.51 fg TEQ/m3 to 2.36 fg TEQ/m3, with an average mean of 1.31 fg TEQ/m3. The obtained average mean of dl-PCBs in this area was lower than the obtained levels in a previous study carried out by our research group in the surroundings of four industrial and two urban areas in the Valencian Region [17]. Furthermore, the obtained levels were around three to five times lower than other industrial areas in China [31], Vietnam [32], and Kuwait [33].
At the Chiva station (S1), levels of ∑PCDD/Fs ranged between 1.81 fg TEQ/m3 and 40.66 fg TEQ/m3, with an arithmetic mean of 11.75 fg TEQ/m3. Concentrations found at this station were higher than PCDD/Fs detected close to other cement industries in the Catalonia region of Spain [12,13,14]. In contrast, Rovira et al. (2011) [34] described higher levels of PCDD/Fs around the cement plant of Sant Feliu de Llobregat (34.2 fg TEQ/m3) in Spain. Furthermore, the range of PCDD/F concentrations detected at Chiva were similar than those founded in Turkey by Ercan and Dinçer (2016) [35] (between 0.03 and 27.9 fg TEQ/m3).
Concentrations of ∑PCDD/Fs ranged from 0.86 to 3.16 fg TEQ/m3, with an average mean of 1.68 fg TEQ/m3 at the Buñol site. PCDD/F levels were lower (2 to 20 times lower) than those detected close to other cement industries of Catalonia and Turkey (Table 2).

3.2. Results by Congeners

Table 3 shows the detection frequency and total concentrations (particulate phase plus gaseous phase) (fg/m3) calculated for each congener in the assessed samples.
In the case of the Chiva station (S1), the frequency of detection ranged from 8% (1,2,3,7,8-PCDD) to 100% (PCB-118, PCB-105, OCDF, and OCDD). The minimum concentration detected was 0.13 fg/m3 (1,2,3,4,7,8,9-HpCDF and 1,2,3,4,6,7,8-HpCDD), and the maximum was 2507.90 fg/m3 (PCB-118).
Buñol samples obtained frequencies of detection from 10% (PCB-114 and PCB-169) to 100% (PCB-118, 1,2,3,6,7,8-HxCDF, 2,3,4,6,7,8-HxCDF, 1,2,3,4,6,7,8-HpCDF, 1,2,3,4,6,7,8-HpCDD, and OCDD). The minimum concentration detected was 0.03 fg/m3 (1,2,3,4,7,8,9-HpCDF), and the maximum was 2899.53 fg/m3 (PCB-118).
The fg TEQ/m3 profile obtained for the dl-PCBs in Chiva and Buñol (see Figure S1) shows that PCB-126 is clearly the most present congener. These results are similar to those obtained in other industrial and urban areas of the Valencian Region [17] and other studies around the world [32,36,37]. According to Luthardt et al. (2002) [38], in industrial sources, the contributions of PCB-126 are more than 90% of PCB-TEQ. Moreover, the presence of PCB-169 is characteristic of industrial areas [39]. On the other hand, PCB-118 and PCB-156 are more characteristic of samples close to a cement kiln. Martínez et al. (2010) [39] showed that the concentration profiles taken at a cement plant stack present PCB-118 as the main PCB and PCB-105 as the second one.
For the profile concentrations (fg/m3) of PCDD/Fs in Chiva (see Figure S2) (fg/m3), the congeners with the highest concentrations were 1,2,3,4,7,8,9-HpCDF, OCDF, and OCDD. This profile is similar to those obtained by Abad et al. (2004) [40]. In contrast, at the Buñol station, the congeners with the highest concentrations were OCDD, 1,2,3,4,6,7,8-HpCDF and 1,2,3,4,6,7,8-HpCDD. López et al. (2021) [17] present a similar profile in the same region surrounding metallurgical factories, with OCDD, 1,2,3,4,6,7,8-HpCDD, and 1,2,3,4,6,7,8-HpCDF being the most prominent congeners.

3.3. Inhalation Risk Assessment

3.3.1. Daily Inhalation Exposure

Table 4 shows the AM and percentile 95 (p95) values related to the inhalation exposure to dl-PCBs, PCDD/Fs, and the sum of dioxins, furans, and dl-PCBs in adults and children. To our knowledge, this is the first study to assess dl-PCB inhalation in the surroundings of cement plants.
The inhalation exposure to dl-PCBs for adults at the Chiva station was 4.08 · 10−4 pg WHO TEQ kg−1 b.w. d−1, and 9.18 · 10−4 pg WHO TEQ kg−1 b.w. d−1 for children. Hazard quotients for dl-PCBs calculated for both populations were 2 times lower than 1 (see Figure 3), so no risk by inhalation pathway was observed. At the Buñol station, inhalation exposure to dl-PCBs in adults was 3.72 · 10−4 pg WHO TEQ kg−1 b.w. d−1, and 2.01 · 10−3 pg WHO TEQ kg−1 b.w. d−1 for children. The calculated HQ was lower than 1 (see Figure 3) in both populations, so no inhalation risk was noted. The studies carried out in the literature on the risk of dioxins and furans in the vicinity of cement plants did not estimate the risk of dl-PCBs, so it is not possible to compare the results obtained for dl-PCBs with other similar studies.
The inhalation exposure to adults of PCDD/Fs in Chiva was 3.34 · 10−3 pg WHO TEQ kg−1 b.w. d−1, and 7.52 · 10−3 pg WHO TEQ kg−1 b.w. d−1 for children. The calculated hazard quotient for children was slightly higher than 1 (1.02) at the Chiva station, considering p95 of daily inhalation exposure, so possible risk was observed due to inhalation. The obtained average value for inhalation exposure in adults is similar to other studies in the vicinity of cement plants, which range between 2.1 · 10−3 and 1.2 · 10−2 pg WHO TEQ kg−1 b.w. d−1 (see Table S4). The inhalation exposure to PCDD/Fs observed in Buñol (5.22 · 10−4 pg WHO TEQ kg−1 b.w. d−1 for adults and 1.17 · 10−3 pg WHO TEQ kg−1 b.w. d−1 for children) was a magnitude order lower than the studies carried out in Catalonia in the vicinity of cement plants (see Table 2). The calculated HQ for PCDD/Fs was lower than 1 in adults and children at the Buñol station.

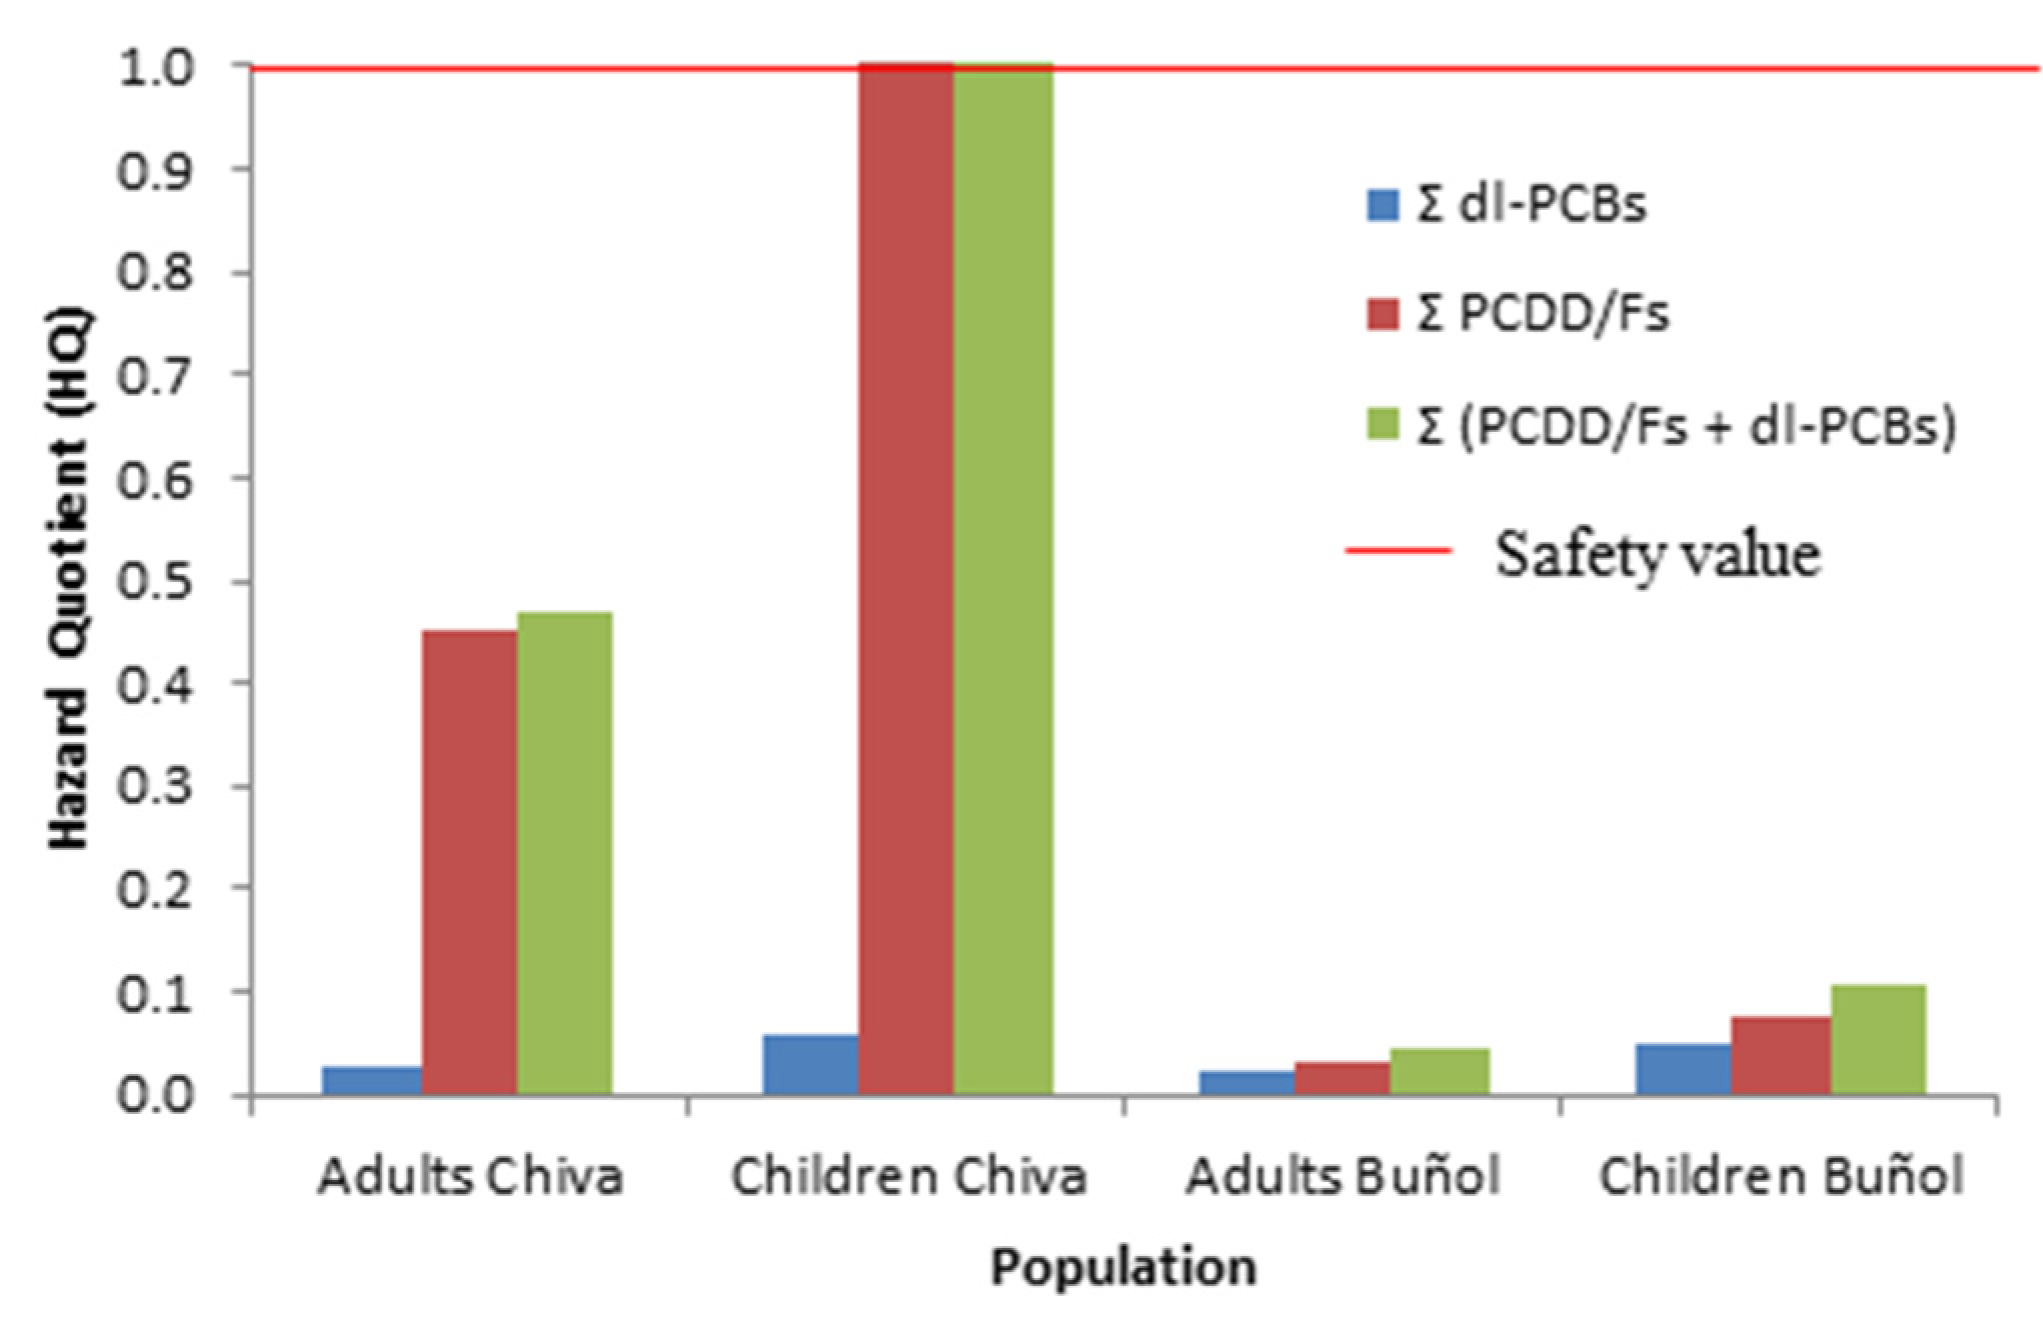
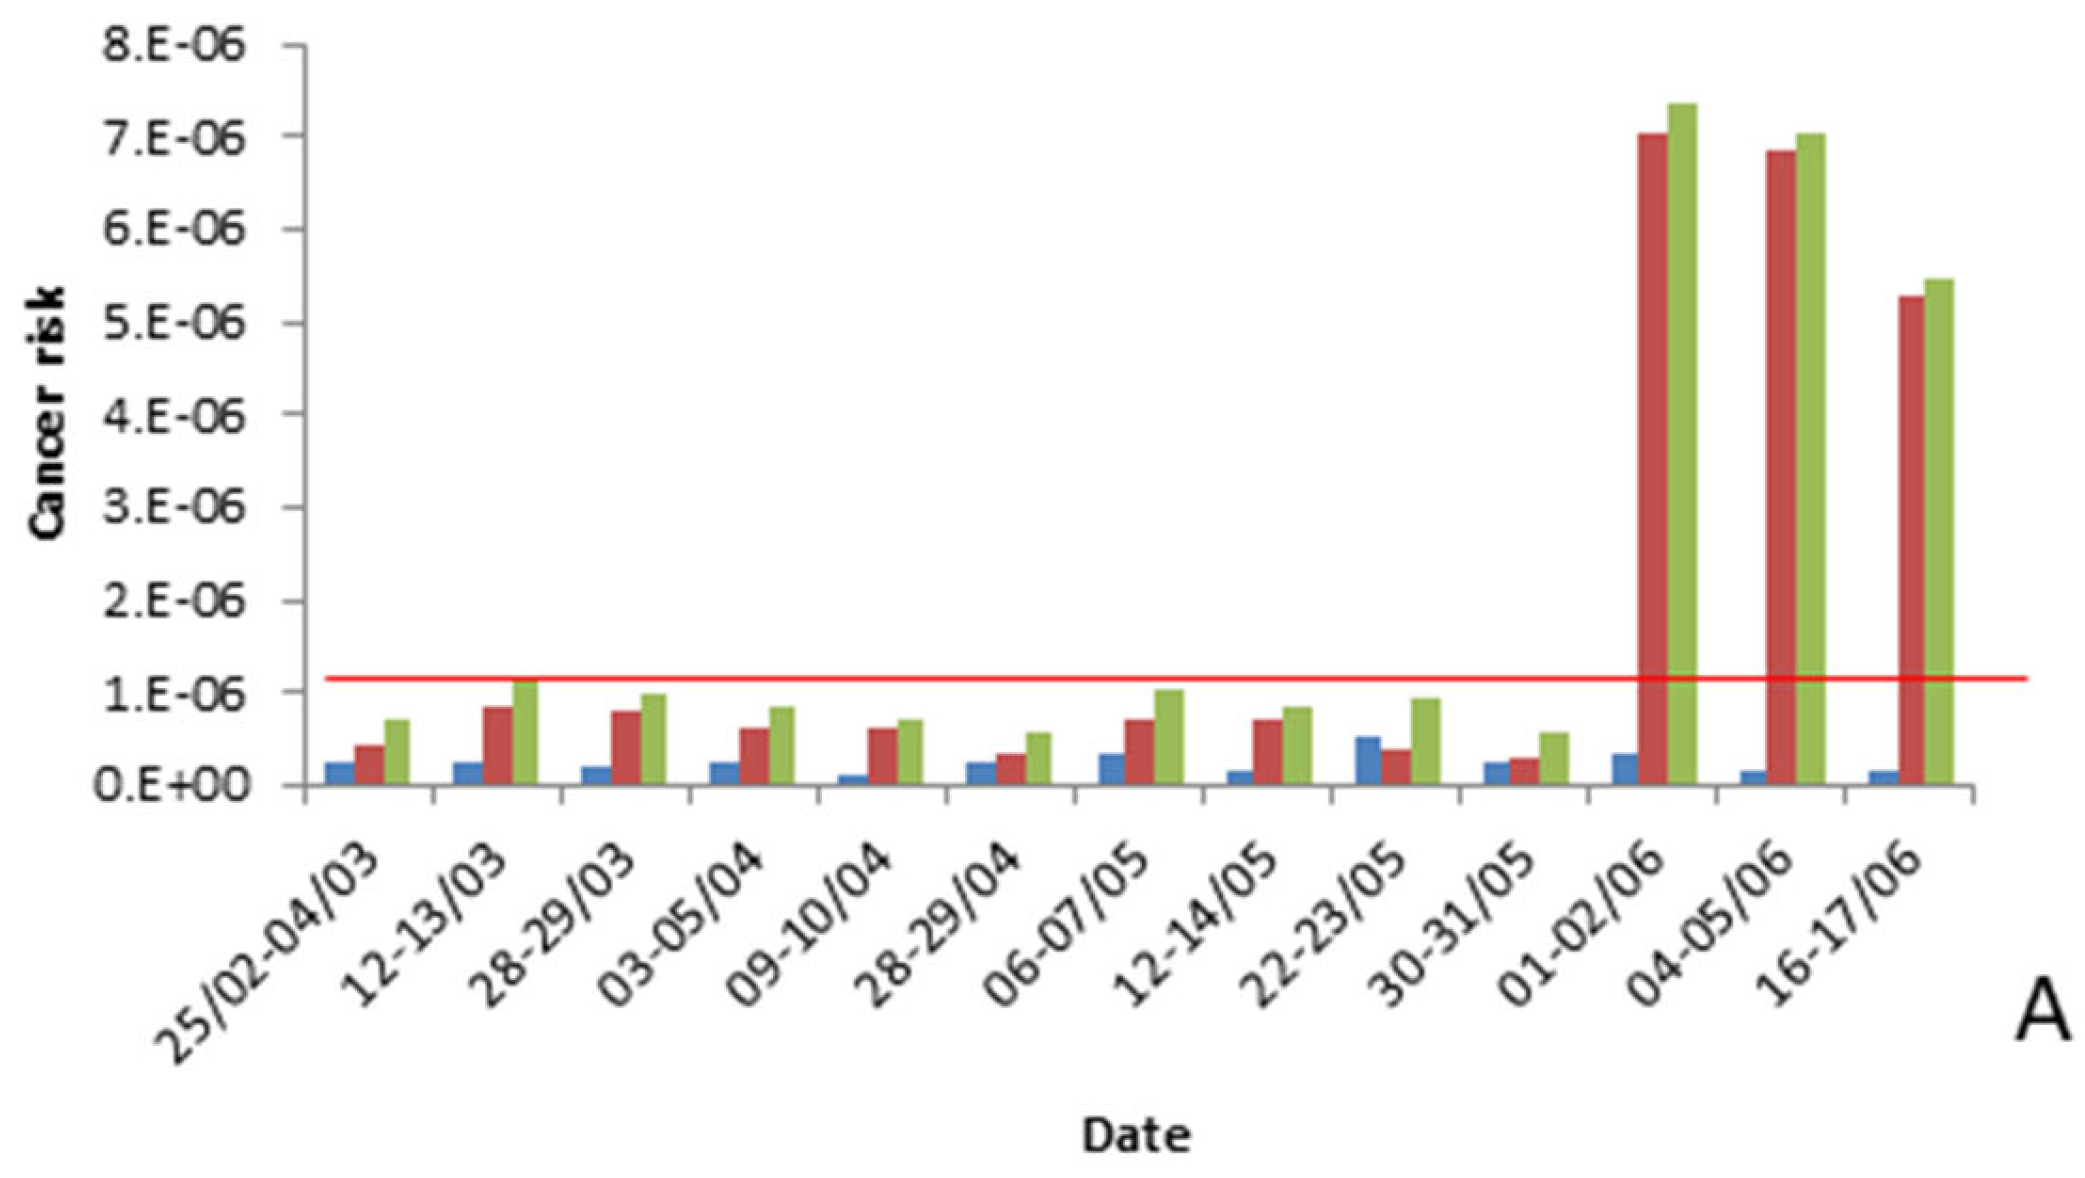
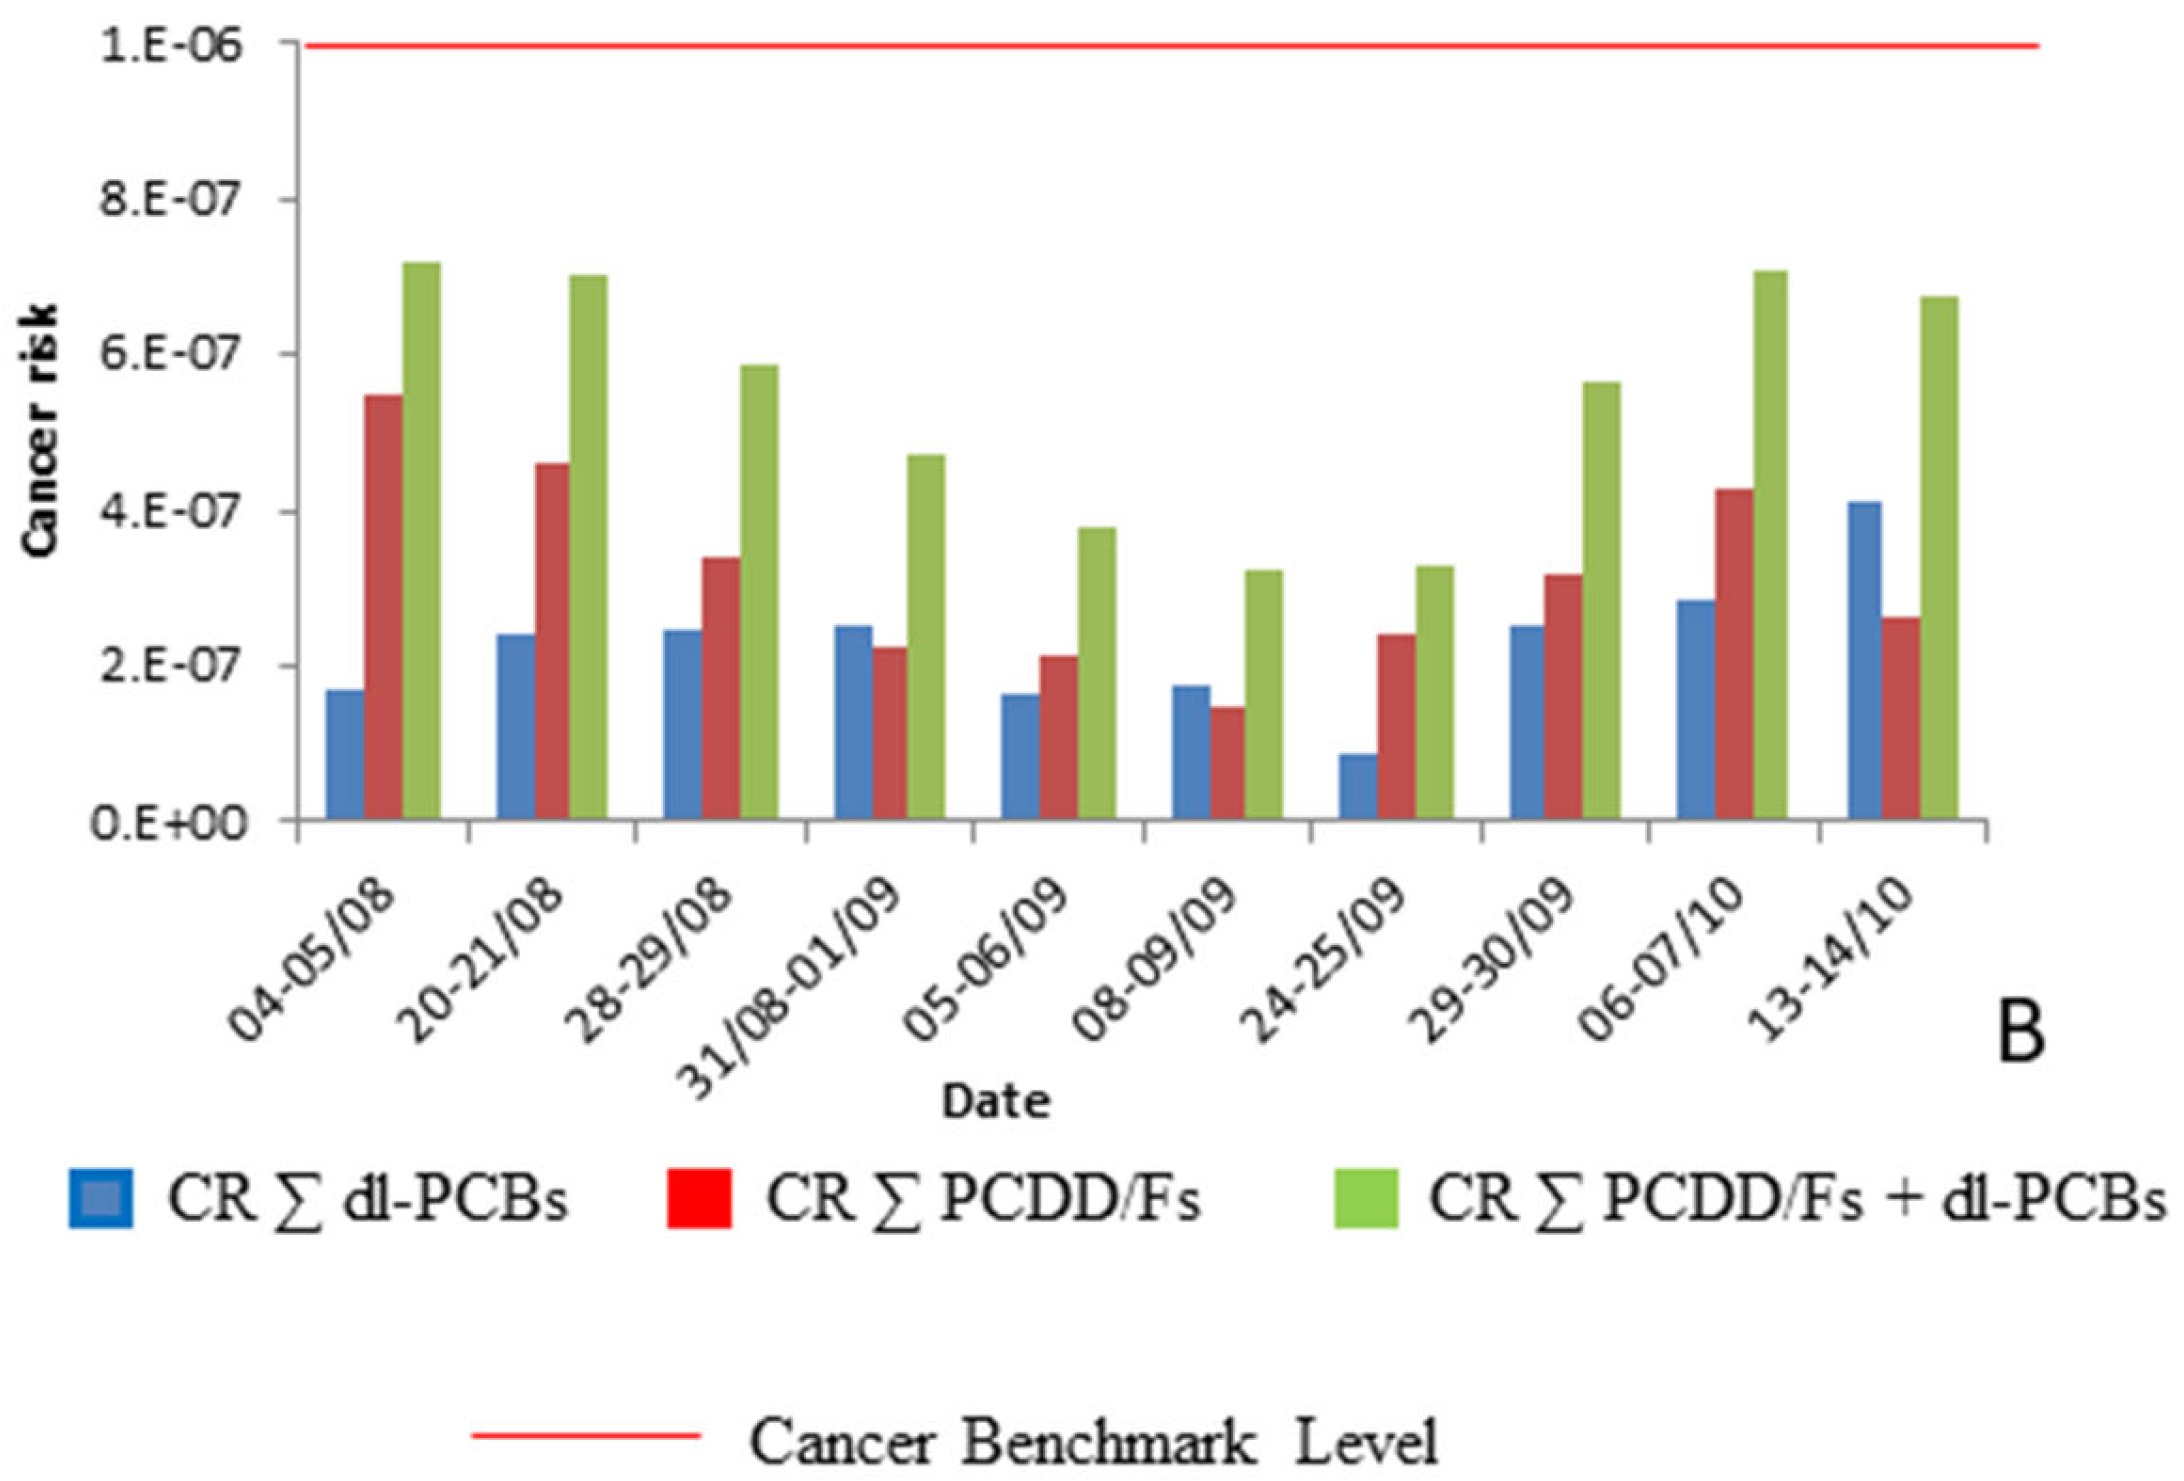
3.3.2. Chronic Exposure

The study assessed the chronic exposure to dioxins, furans, and dl-PCBs by calculating the cancer risk from inhalation at each station over a period of 70 years. The results indicate that certain samples from the Chiva sampling site (Figure 4A) show values higher than 10−6, especially those collected at the beginning of the summer. However, according to the EPA [27], cancer risk levels must be above 10−4 to be considered unacceptable, and chronic exposure levels in the area are lower than those detected in other industrial areas of the Valencian Region. On the other hand, chronic exposure levels at the Buñol station (Figure 4B) were below 10−6 in all samples evaluated, suggesting that the detected concentrations do not pose a long-term risk to the assessed population.

4. Study Limitations

Only the particle phase (PM10) has been collected and analyzed in the present study. Total concentrations including the gaseous phase have been calculated using a mathematical model previously validated by López et al., 2021 [17].

5. Conclusions

The concentrations of airborne dl-PCBs measured in the present study were found to be similar to those obtained in other industrial and urban areas in the assessed region. Regarding the obtained profiles for the analyzed compounds, dl-PCB profiles are identical at all studied sampling stations.
The estimated HQ for daily exposure in adults and children at the assessed sampling sites was less than 1 for dl-PCBs but slightly higher than 1 for PCDD/Fs in one of the investigated areas, indicating possible risk and the need of more-in-depth studies. For chronic exposure, some results at one sampling site have concerning levels. However, none of the obtained results showed exposure levels higher than 1.0 · 10−4; consequently, the adoption of immediate corrective measures is not required.
To our knowledge, this study is the first to assess inhalation risk in the population for dl-PCBs together with PCDDs and PCDFs in the vicinity of cement plants.
Taking into account our results, implementation of future monitoring programs in order to control industrial airborne pollution could be interesting for protecting the public health of the population living in the neighborhood of hotspot locations such as cement plants.

Supplementary Materials

The following supporting information can be downloaded at: https://www.mdpi.com/article/10.3390/toxics11040389/s1, Section S1: Analytical performance parameters and identification criteria; Table S1: Sampling dates of the analyzed filters and total sample volume (m3); Table S2: Inhalation Unit risk (µg/m3)−1 and Slope Factor ( mg kg   day 1 ) 1 ;   Table S3: Concentrations of ΣPCDD/Fs + dl-PCBs, ∑ dl-PCBs, and ∑ PCDD/Fs obtained at Chiva (C) and Buñol (B) stations in fg TEQ/m3; Table S4: Exposure of dioxins and furans in adults in the vicinity of cement plants; Figure S1: Profile of concentrations of dl-PCBs detected at Chiva and Buñol stations using concentrations (fg/m3) and toxic equivalents (TEQ) (fg TEQ/m3); Figure S2: Profile of concentrations of PCDD/Fs detected at Chiva and Buñol stations using concentrations (fg/m3) and toxic equivalents (TEQ) (fg TEQ/m3).

Author Contributions

Conceptualization, V.Y.; methodology, P.R., I.L., A.L. and C.C.; formal analysis, P.R. and A.L.; resources, P.R., I.L. and A.L.; writing—original draft preparation, P.R.; writing—review and editing, A.L., V.Y. and C.C.; visualization, P.R., I.L. and A.L.; supervision, V.Y. and C.C. All authors have read and agreed to the published version of the manuscript.

Funding

These studies have been performed using analytical instruments financed by the European Commission through the European Regional Development Funds (ERDF) Operational Programme of the Valencia Region (2014-2020).

Institutional Review Board Statement

Not applicable.

Informed Consent Statement

Not applicable.

Data Availability Statement

Not applicable.

Acknowledgments

The authors wish to express their gratitude to Consellería d’Agricultura, Medi Ambient, Canvi Climàtic I Desenvolupament Rural, and BSG Ingenieros S.L. for their collaboration during this study.

Conflicts of Interest

The authors declare no conflict of interest.

References

  1. Shen, W.; Liu, Y.; Yan, B.; Wang, J.; He, P.; Zhou, C.; Huo, X.; Whang, W.; Xu, G.; Ding, Q. Cement industry of China: Driving force, environment impact and sustainable development. Renew. Sustain. Energy Rev. 2017, 75, 618–628. [Google Scholar] [CrossRef]
  2. Ruiz, M.L.; Boyé, Á.M.; de la Torre, A.; Rodríguez, B.F. Inventario español de dioxinas: Evaluación de las emisiones de dioxinas y furanos generados en el sector cementero español durante 2000–2003, la influencia del uso de combustibles alternativos. Cem. Hormigón 2005, 873, 60–69. [Google Scholar]
  3. Genon, G.; Brizio, E. Perspectives and limits for cement kilns as a destination for RDF. J. Waste Manag. 2008, 28, 2375–2385. [Google Scholar] [CrossRef]
  4. UN Environment Programme. Persistent Organic Pollutants (POPs). UNEP—UN Environment Programme 2017. Available online: http://www.unep.org/explore-topics/chemicals-waste/what-we-do/persistent-organic-pollutants-pops (accessed on 6 February 2023).
  5. Faiad, W.; Soukkarieh, C.; Murphy, D.J.; Hanano, A. Effects of dioxins on animal spermatogenesis: A state-of-the-art review. Front. Reprod. Health 2022, 4, 1009090. [Google Scholar] [CrossRef]
  6. Bi, C.; Chen, Y.; Zhao, Z.; Li, Q.; Zhou, Q.; Ye, Z.; Ge, X. Characteristics, sources and health risks of toxic species (PCDD/Fs, PAHs and heavy metals) in PM2.5 during fall and winter in an industrial area. Chemosphere 2020, 238, 124620. [Google Scholar] [CrossRef]
  7. Ssebugere, P.; Sillanpää, M.; Matovu, H.; Mubiru, E. Human and environmental exposure to PCDD/Fs and dioxin-like PCBs in Africa: A review. Chemosphere 2019, 223, 483–493. [Google Scholar] [CrossRef] [PubMed]
  8. Rivera-Austrui, J.; Martinez, K.; Marco-Almagro, L.; Abalos, M.; Abad, E. Long-term sampling of dioxin-like substances from a clinker kiln stack using alternative fuels. Sci. Total. Environ. 2014, 485–486, 528–533. [Google Scholar] [CrossRef] [PubMed]
  9. Conesa, J.A.; Ortuño, N.; Abad, E.; Rivera-Austrui, J. Emissions of PCDD/Fs, PBDD/Fs, dioxin like-PCBs and PAHs from a cement plant using a long-term monitoring system. Sci. Total. Environ. 2016, 571, 435–443. [Google Scholar] [CrossRef] [PubMed]
  10. WHO (World Health Organization). Air Quality Guidelines for Europe; WHO: Geneva, Switzerland, 2000; ISBN 0378-2255. [Google Scholar]
  11. Kanan, S.; Samara, F. Dioxins and furans: A review from chemical and environmental perspectives. Trends Environ. Anal. Chem. 2018, 17, 1–13. [Google Scholar] [CrossRef]
  12. Mari, M.; Rovira, J.; Sánchez-Soberón, F.; Nadal, M.; Schuhmacher, M.; Domingo, J.L. Partial replacement of fossil fuels in a cement plant: Assessment of human health risks by metals, metalloids and PCDD/Fs. Environ. Res. 2018, 167, 191–197. [Google Scholar] [CrossRef]
  13. Mari, M.; Rovira, J.; Sánchez-Soberón, F.; Nadal, M.; Schuhmacher, M.; Domingo, J.L. Environmental trends of metals and PCDD/Fs around a cement plant after alternative fuel implementation: Human health risk assessment. Environ. Sci. Process. Impacts 2017, 19, 917–927. [Google Scholar] [CrossRef] [PubMed]
  14. Rovira, J.; Nadal, M.; Schuhmacher, M.; Domingo, J.L. Alternative Fuel Implementation in a Cement Plant: Human Health Risks and Economical Valuation. Arch. Environ. Contam. Toxicol. 2016, 71, 473–484. [Google Scholar] [CrossRef]
  15. Rovira, J.; Flores, J.; Schuhmacher, M.; Nadal, M.; Domingo, J.L. Long-Term Environmental Surveillance and Health Risks of Metals and PCDD/Fs Around a Cement Plant in Catalonia, Spain. Hum. Ecol. Risk Assess. 2015, 21, 514–532. [Google Scholar] [CrossRef]
  16. Quijano, L.; Marín, S.; Millán, E.; Yusà, V.; Font, G.; Pardo, O. Dietary exposure and risk assessment of polychlorinated dibenzo-p-dioxins, polychlorinated dibenzofurans and dioxin-like polychlorinated biphenyls of the population in the Region of Valencia (Spain). Food Addit. Contam. A 2018, 35, 741–750. [Google Scholar] [CrossRef] [PubMed]
  17. López, A.; Coscollà, C.; Hernández, C.S.; Pardo, O.; Yusà, V. Dioxins and dioxin-like PCBs in the ambient air of the Valencian Region (Spain): Levels, human exposure, and risk assessment. Chemosphere 2021, 267, 128902. [Google Scholar] [CrossRef]
  18. EFSA. EFSA Panel on Contaminants in the Food Chain (CONTAM), Risk for Animal and Human Health Related to the Presence of Dioxins and Dioxin-Like PCBs in Feed and Food. EFSA J. 2018, 16, e05333. [Google Scholar] [CrossRef]
  19. Hernández, C.S.; Pardo, O.; Corpas-Burgos, F.; Fernández, S.F.; López, A.; Coscollà, C.; Vento, M.; Yusà, V. Biomonitoring of polychlorinated dibenzo-p-dioxins (PCDDs), polychlorinated dibenzofurans (PCDFs) and dioxin-like polychlorinated biphenyls (dl-PCBs) in human milk: Exposure and risk assessment for lactating mothers and breastfed children from Spain. Sci. Total Environ. 2020, 744, 140710. [Google Scholar] [CrossRef] [PubMed]
  20. Antilla, S.L.; Boffetta, P. Occupational Cancers; Springer: London, UK, 2014. [Google Scholar]
  21. EU. Commission Regulation (EU) 2017/771 of 3 May of 2017 Amending Regulation (EC) No 152/2009 as Regards the Methods for the Determination of the Levels of Dioxins and Polychlorinated Biphenyls. Available online: https://eur-lex.europa.eu/legal-content/EN/TXT/PDF/?uri%C2%BCCELEX:32017R0771&from%C2%BCEN (accessed on 25 January 2023).
  22. USEPA. EPA Method 1613. Tetra-Through Octa-Chlorinated Dioxins and Furans by Isotope Dilution HRGC/HRMS. Available online: https://well-labs.com/docs/epa_method_ (accessed on 22 October 2022).
  23. EURL. Guidance Document on the Estimation of LOD and LOQ for Measurements in the Field of Contaminants in Feed and Food. Available online: http://publications.jrc.ec.europa.eu/repository/bitstream/JRC102946/eur%2028099%20en_lod%20loq%20guidance%20document.pdf (accessed on 10 July 2020).
  24. Harner, T.; Green, N.J.L.; Jones, K.C. Measurements of Octanol−Air Partition Coefficients for PCDD/Fs:  A Tool in Assessing Air−Soil Equilibrium Status. Environ. Sci. Technol. 2000, 34, 3109–3114. [Google Scholar] [CrossRef]
  25. Yusà, V.; Coscollà, C.; Millet, M. New screening approach for risk assessment of pesticides in ambient air. Atmos. Environ. 2014, 96, 322–330. [Google Scholar] [CrossRef]
  26. Harner, T.; Bidleman, T.F. Octanol−Air Partition Coefficient for Describing Particle/Gas Partitioning of Aromatic Compounds in Urban Air. Environ. Sci. Technol. 1998, 32, 1494–1502. [Google Scholar] [CrossRef]
  27. EPA. Human Health Risk Assessment Protocol for Hazardous Waste Combustion Facilities, September 2005. Available online: https://nepis.epa.gov/Exe/ZyPDF.cgi/%20P10067PR.PDF?Dockey%C2%BCP10067PR.PDF (accessed on 22 October 2022).
  28. López, A.; Yusà, V.; Muñoz, A.; Vera, T.; Borràs, E.; Ródenas, M.; Coscollà, C. Risk assessment of airborne pesticides in a Mediterranean region of Spain. Sci. Total. Environ. 2017, 574, 724–734. [Google Scholar] [CrossRef] [PubMed]
  29. WHO (World Health Organization). Assessment of the Health Risk of Dioxins: Reevaluation of the Tolerable Daily Intake (TDI); WHO: Geneva, Switzerland, 1998. [Google Scholar]
  30. Čupr, P.; Flegrová, Z.; Franců, J.; Landlová, L.; Klánová, J. Mineralogical, chemical and toxicological characterization of urban air particles. Environ. Int. 2013, 54, 26–34. [Google Scholar] [CrossRef] [PubMed]
  31. Hu, J.; Wu, J.; Xu, C.; Zha, X.; Hua, Y.; Yang, L.; Jin, J. Preliminary investigation of polychlorinated dibenzo-p-dioxin and dibenzofuran, polychlorinated naphthalene, and dioxin-like polychlorinated biphenyl concentrations in ambient air in an industrial park at the northeastern edge of the Tibet–Qinghai Plateau. Sci. Total. Environ. 2019, 648, 935–942. [Google Scholar] [CrossRef]
  32. Trinh, M.M.; Tsai, C.L.; Hien, T.T.; Thuan, N.T.; Chi, K.H.; Lien, C.G.; Chang, M.B. Atmospheric concentrations and gas-particle partitioning of PCDD/Fs and dioxin-like PCBs around Hochimininh city. Chemosphere 2018, 202, 246–254. [Google Scholar] [CrossRef]
  33. Martínez-Guijarro, K.; Ramadan, A.; Gevao, B. Atmospheric concentration of polychlorinated dibenzo-p-dioxins, polychlorinated dibenzofurans (PCDD/Fs) and dioxin-like polychlorinated biphenyls (dl-PCBs) at Umm-Al Aish oil field Kuwait. Chemosphere 2017, 168, 147–154. [Google Scholar] [CrossRef] [PubMed]
  34. Rovira, J.; Mari, M.; Nadal, M.; Schuhmacher, M.; Domingo, J.L. Levels of metals and PCDD/Fs in the vicinity of a cement plant: Assessment of human health risks. J. Environ. Sci. Health A 2011, 46, 1075–1084. [Google Scholar] [CrossRef]
  35. Ercan, Ö.; Dinçer, F. Atmospheric concentrations of PCDD/Fs, PAHs, and metals in the vicinity of a cement plant in Istanbul. Air Qual. Atmos. Health 2016, 9, 159–172. [Google Scholar] [CrossRef]
  36. Colombo, A.; Benfenati, E.; Bugatti, S.G.; Lodi, M.; Mariani, A.; Musmeci, L.; Rotella, G.; Senese, V.; Ziemacki, G.; Fanelli, R. PCDD/Fs and PCBs in ambient air in a highly industrialized city in Northern Italy. Chemosphere 2013, 90, 2352–2357. [Google Scholar] [CrossRef] [PubMed]
  37. Heo, J.; Kim, D.; Lee, G. Congener Profiles and Source-Wise Phase Partitioning Analysis of PCDDs/Fs and PCBs in Gyeonggi-Do Ambient Air, South Korea. Int. J. Environ. Res. Public Health 2014, 11, 11065–11080. [Google Scholar] [CrossRef]
  38. Luthardt, P.; Mayer, J.; Fuchs, J. Total TEQ emissions (PCDD/F and PCB) from industrial sources. Chemosphere 2002, 46, 1303–1308. [Google Scholar] [CrossRef]
  39. Martínez, K.; Austrui, J.R.; Jover, E.; Ábalos, M.; Rivera, J.; Abad, E. Assessment of the emission of PCDD/Fs and dioxin-like PCBs from an industrial area over a nearby town using a selective wind direction sampling device. Environ. Pollut. 2010, 158, 764–769. [Google Scholar] [CrossRef] [PubMed]
  40. Abad, E.; Martínez, K.; Caixach, J.; Rivera, J. Polychlorinated Dibenzo-p dioxin/Polychlorinated Dibenzofuran Releases into the Atmosphere from the Use of Secondary Fuels in Cement Kilns during Clinker Formation. Environ. Sci. Technol. 2004, 38, 4734–4738. [Google Scholar] [CrossRef] [PubMed]
Figure 1. Location of the evaluated stations (S1 and S2) and cement plant.
Toxics 11 00389 g001
Figure 2. Dioxin and dl-PCB levels detected (fg TEQ/m3) at Chiva (S1) and Buñol (S2) stations.
Toxics 11 00389 g002
Figure 3. Hazard quotient at Chiva and Buñol stations for adults and children.
Toxics 11 00389 g003
Figure 4. Cancer risk at Chiva (A) and Buñol stations (B).
Toxics 11 00389 g004aToxics 11 00389 g004b
Table 1. Overall concentrations (fg TEQ/m3) (particulate and gaseous phase) in ambient air samples at Chiva (n = 13) and Buñol (n = 10).
AnalyteAM 1p50 2p95 3Min 4Max 5
Chiva
∑PCDD/Fs11.754.0739.751.8140.66
∑dl-PCBs1.431.422.330.593.03
∑PCDD/Fs + dl-PCBs13.185.3441.093.2642.53
Buñol
∑PCDD/Fs1.831.682.940.863.16
∑dl-PCBs1.311.412.020.512.36
∑PCDD/Fs + dl-PCBs3.143.324.101.854.14
1 AM = arithmetic mean; 2 p50 = median; 3 p95 = percentile 95; 4 Min = minimum; 5 Max = maximum.
Table 2. PCDD/F air levels in the vicinity of cement plants in fg TEQ/m3.
StudiesYearPlaceAM 1 Min 2–Max 3
Present study2020Valencian Region (Spain)1.830.86–3.16
2020Valencian Region (Spain)11.751.81–40.66
[15]2011Catalonia (Spain)7.04.7–8.6
20127.06.8–8.3
[13]2013Catalonia (Spain)9.08.0–11
20158.05.0–10
[14]2014Catalonia (Spain)30.010.0–50.0
[12]2017Catalonia (Spain)4.03.0–5.0
[34]2008Catalonia (Spain)17.15.9–40.7
March 200813.84.9–29.0
September 200934.216.1–46.8
[35] 2011Istanbul (Turkey)5.430.03–27.99
20122.450.03–7.7
1 AM = arithmetic mean; 2 Min = minimum; 3 Max = maximum.
Table 3. Obtained results per congeners (fg/m3).
AnalyteChivaBuñol
DF 1 * (%)AM 2 **Range **DF 1 * (%)AM 2 **Range **
PCB-813956.7133.51–100.526060.3233.51–100.52
PCB-779261.174.06–100.089049.632.70–78.44
PCB-12369115.635.74–269.658099.8311.47–212.28
PCB-1181001955.221415.87–2507.901001509.26677.81–2899.53
PCB-1143125.8512.83–66.701016.676.42–44.90
PCB-1051001232.27907.59–1805.21100825.81408.92–1476.08
PCB-1262312.274.09–28.642011.054.09–20.46
PCB-1678548.232.26–86.028089.874.53–373.50
PCB-1573117.723.49–59.336049.216.98–177.98
PCB-1569295.873.33–156.6390135.306.66–403.23
PCB-169232.661.38–5.52103.311.38–9.67
PCB-189548.513.03–22.747020.774.55–53.05
2,3,7,8-TCDF392.411.21–6.03501.290.24–2.65
2,3,7,8-TCDD-0.930.93–0.93-0.290.29–0.29
1,2,3,7,8-PCDF6929.300.51–358.51801.760.15–3.57
2,3,4,7,8-PCDF391.760.42–5.83701.190.12–2.50
1,2,3,7,8-PCDD80.580.36–0.71400.470.21–1.21
1,2,3,4,7,8-HxCDF6214.920.23–171.54801.050.07–2.71
1,2,3,6,7,8-HxCDF6928.400.22–191.811001.110.44–2.22
2,3,4,6,7,8-HxCDF9229.060.20–130.631001.090.60–2.59
1,2,3,7,8,9-HxCDF625.730.19–59.97800.590.07–2.61
1,2,3,4,7,8-HxCDD460.420.18–1.82200.190.09–0.55
1,2,3,6,7,8-HxCDD461.070.18–7.32800.410.09–0.88
1,2,3,7,8,9-HxCDD380.810.17–5.86600.290.08–0.69
1,2,3,4,6,7,8-HpCDF9226.660.15–108.091002.871.35–7.51
1,2,3,4,7,8,9-HpCDF625.850.13–59.71800.350.03–1.02
1,2,3,4,6,7,8-HpCDD9215.360.13–60.791002.611.64–5.65
OCDF10015.280.87–64.13901.300.04–4.37
OCDD10030.283.09–89.961007.033.62–12.00
∑PCDD/F 208.8215.76–897.92 23.8815.75–40.00
∑dl-PCBs 3632.112727.57–4999.63 2871.021357.47–5616.43
∑(PCDD/F + dl-PCBs) 3840.942804.19–5551.62 2894.891374.29–5638.16
1 DF = detection frequency; 2 AM = arithmetic mean; * = In the particulate phase; ** = Total concentration (particulate phase plus gaseous phase).
Table 4. Daily inhalation exposure in adults (>12 years) and children (1.5–6 years) at each station in pg WHO TEQ kg−1 b.w. d−1.
AnalyteChivaBuñol
AM 1p95 2AM 1p95 2
Adults (>12 years)
Σ(PCDD/Fs+dl-PCBs)3.75 · 10−31.17 · 10−28.93 · 10−41.17 · 10−3
Σ PCDD/Fs3.34 · 10−31.13 · 10−25.22 · 10−48.35 · 10−4
Σ dl-PCBs4.08 · 10−46.64 · 10−43.72 · 10−45.74 · 10−4
Children (1.5–6 years)
Σ(PCDD/Fs+dl-PCBs)8.44 · 10−32.63 · 10−22.01 · 10−32.63 · 10−3
Σ PCDD/Fs7.52 · 10−32.54 · 10−21.17 · 10−31.88 · 10−3
Σ dl-PCBs9.18 · 10−41.49 · 10−38.36 · 10−41.29 · 10−3
1 AM = arithmetic mean; 2 p95 = percentile 95.
Disclaimer/Publisher’s Note: The statements, opinions and data contained in all publications are solely those of the individual author(s) and contributor(s) and not of MDPI and/or the editor(s). MDPI and/or the editor(s) disclaim responsibility for any injury to people or property resulting from any ideas, methods, instructions or products referred to in the content.

