Prediction of Molecular Initiating Events for Adverse Outcome Pathways Using High-Throughput Identification of Chemical Targets


Abstract
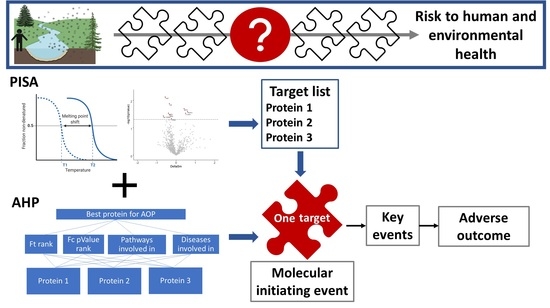
1. Introduction
2. Materials and Methods
2.1. Sample Preparation
2.2. Selection of Test Compound and Concentration
2.3. Two Dimensions Proteome Integral Solubility Alteration (2D PISA) Experiments in HepG2 Cells Protein Extracts
2.4. Filter-Aided Sample Preparation (FASP)
2.5. Nano LC-MS/MS Analysis
2.6. Peptide and Protein Identification and Quantification
2.7. Analysis of 2D PISA Assay
2.8. Protein-Chemical Binding Validation at the Structural Level
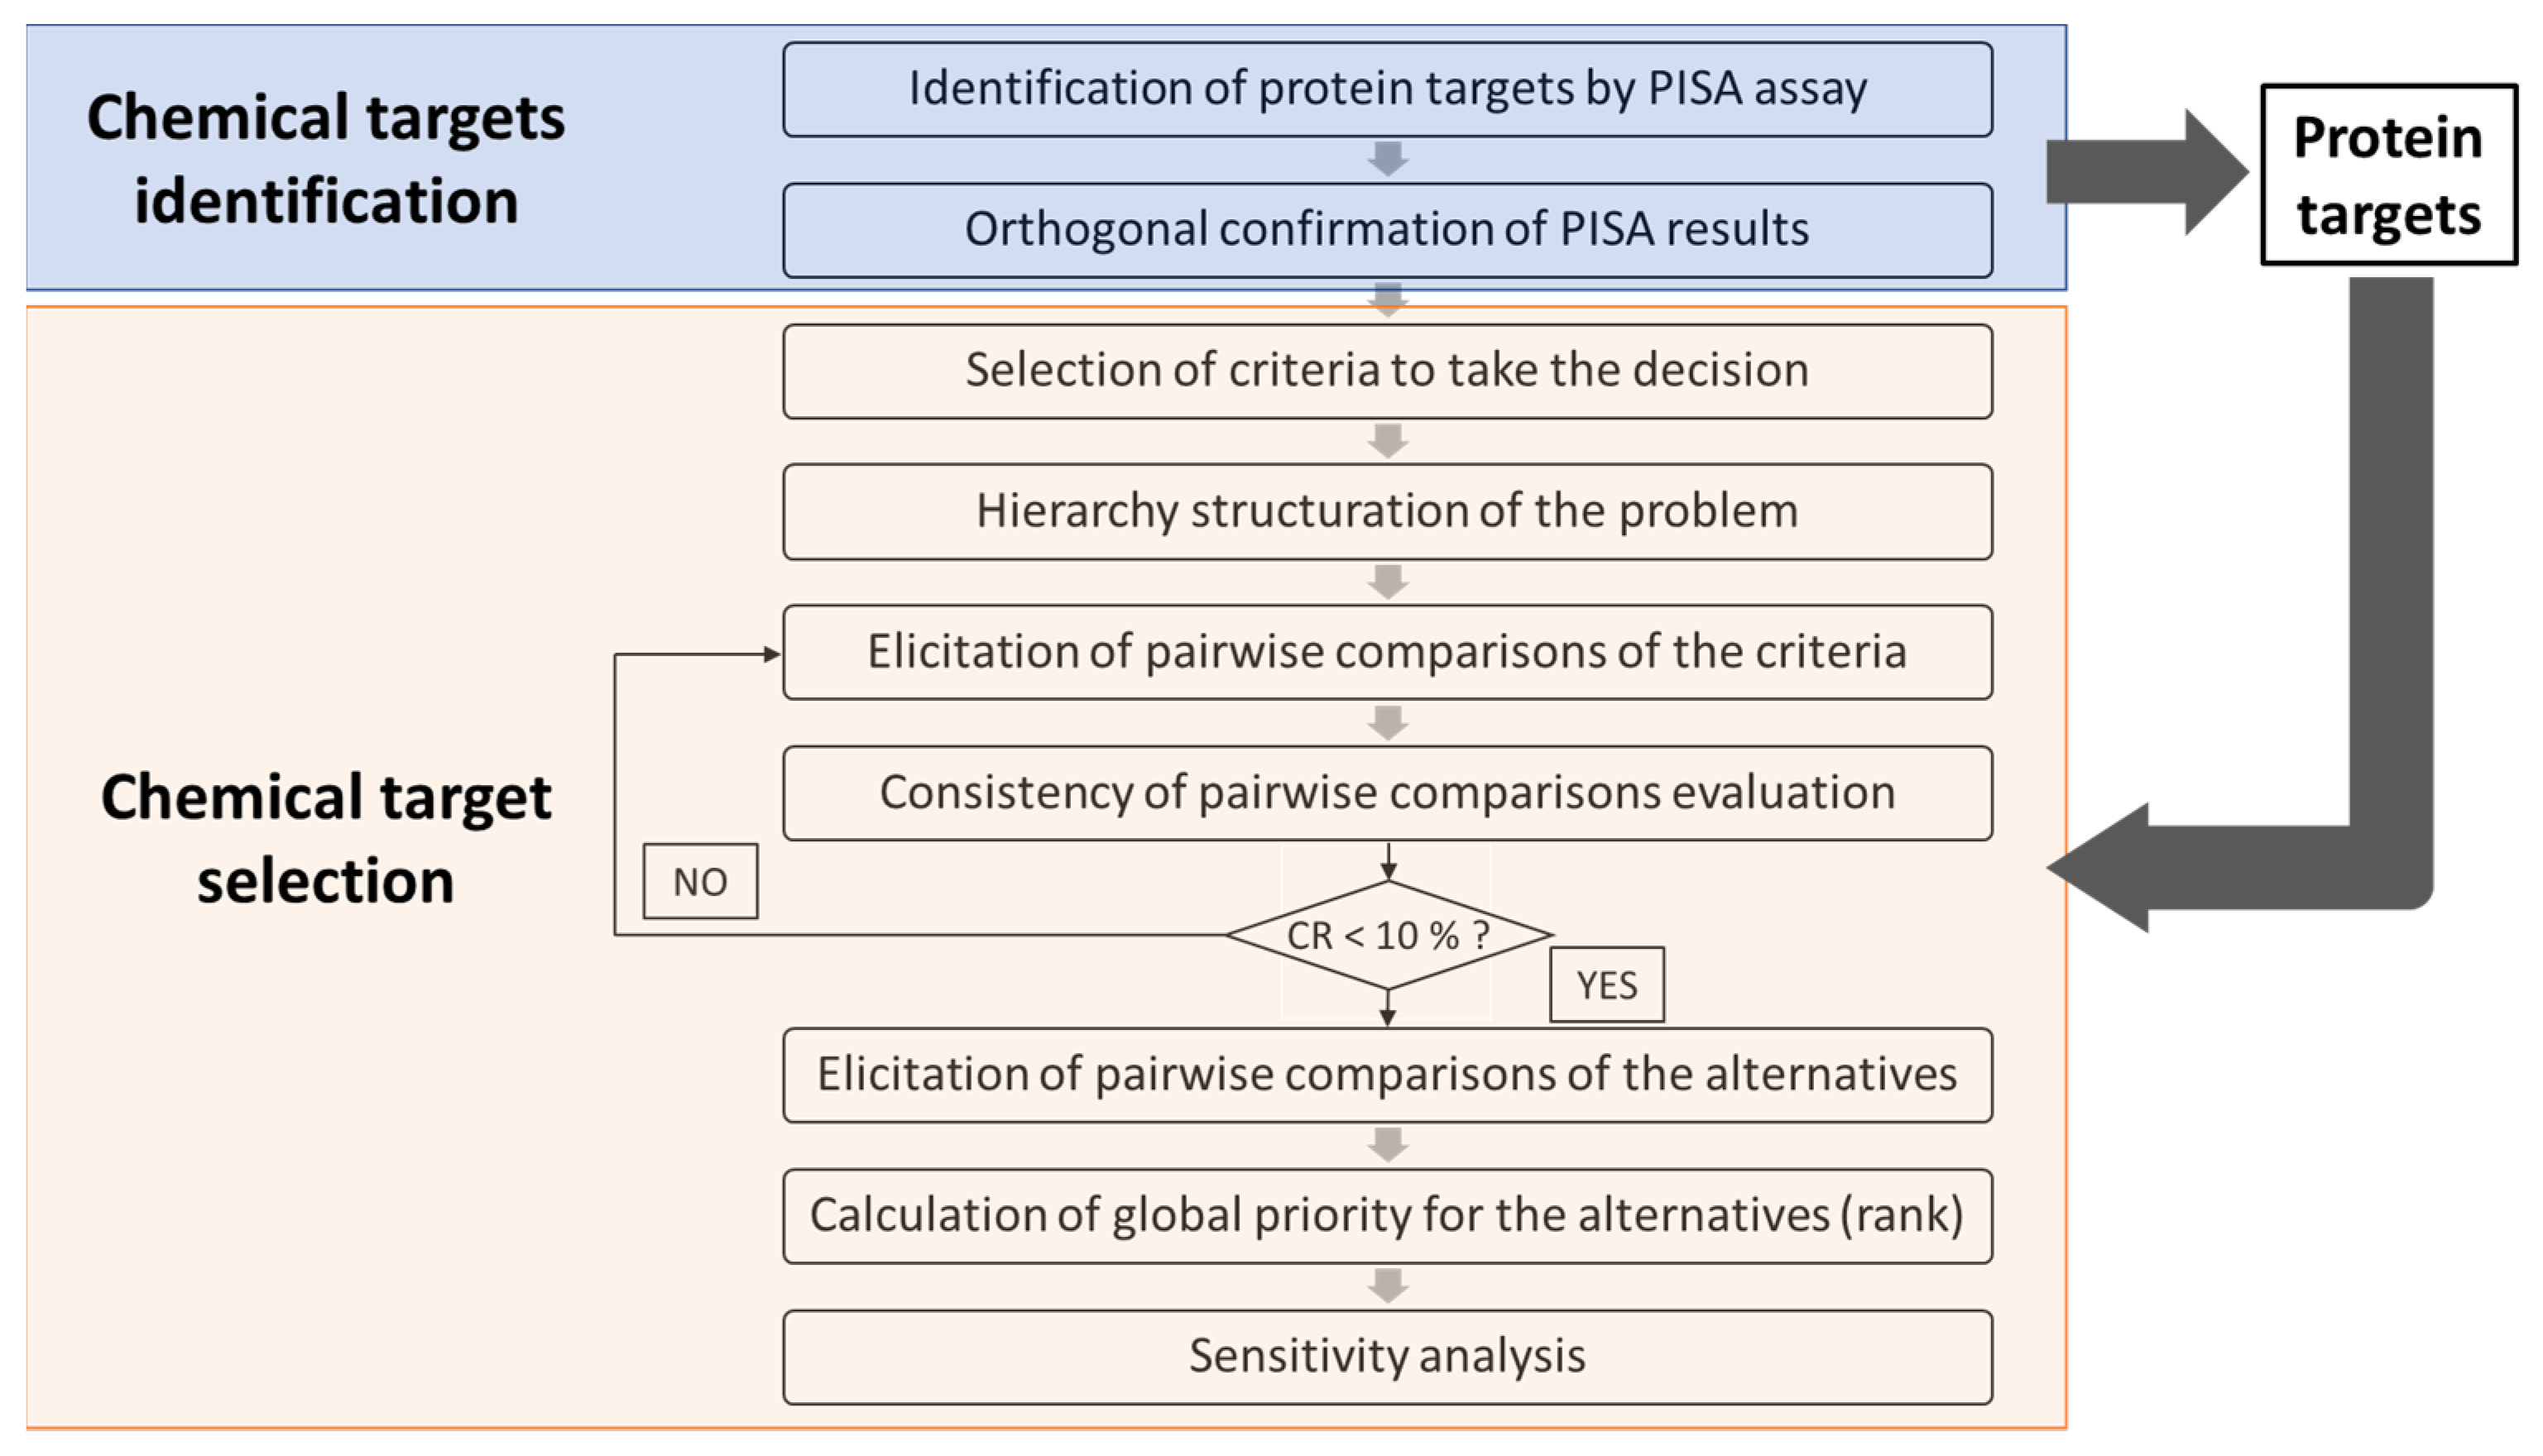
2.9. Selection of Protein Target for New Adverse Outcome Pathways
- Computing the principal eigenvalue (λmax) as in Equation (1)where A is the priority vector, and w are the eigenvalues of the vector A.Aw = λmaxw
- Computing the consistency index (CI) as in Equation (2)where n is the number of criteria
- Calculation of the CR as in Equation (3)where RI corresponds to the appropriate value of the random consistency indices i.e., the CI expected from a matrix of that order. According to Saaty, the value of RI is 0 up to order 2 while for 3 to 10, the random consistency index values are 0.58, 0.90, 1.12, 1.24, 1.32, 1.41, 1.45, and 1.49, respectively. A consistency ratio of up to 10% is considered acceptable [28].

3. Results
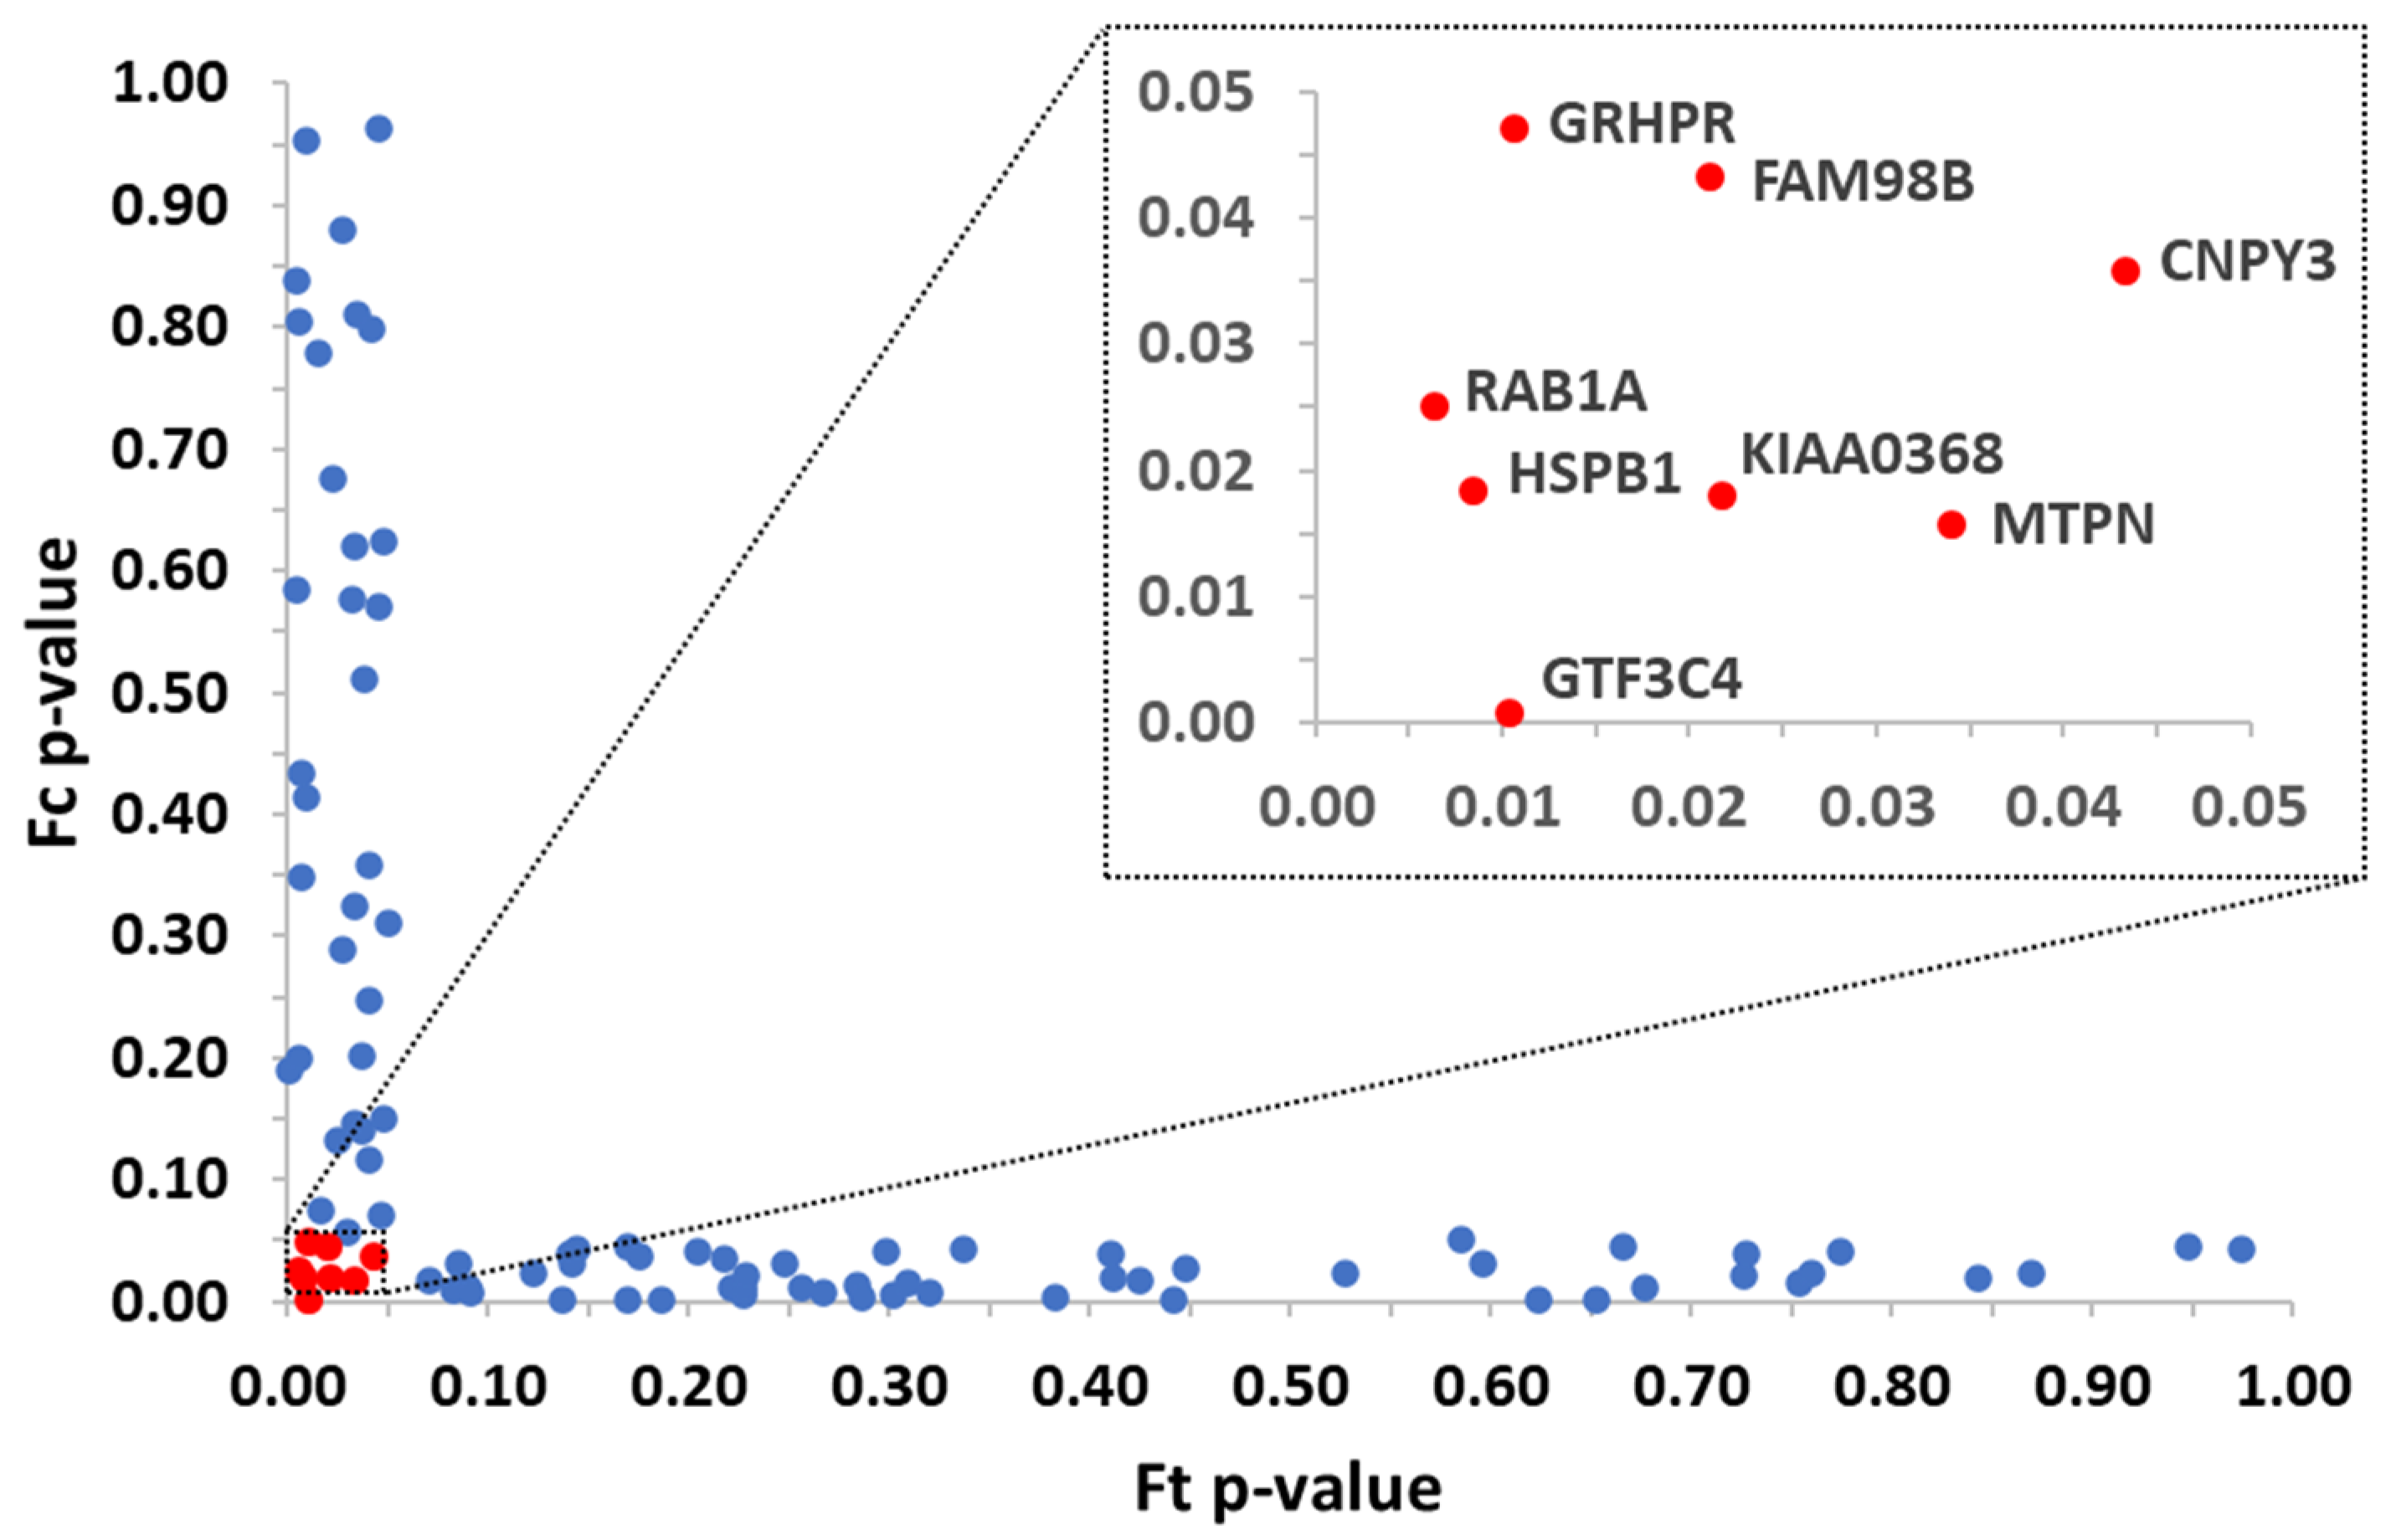
3.1. Identification of Protein Targets from a Single Chemical by Applying 2D PISA Assay
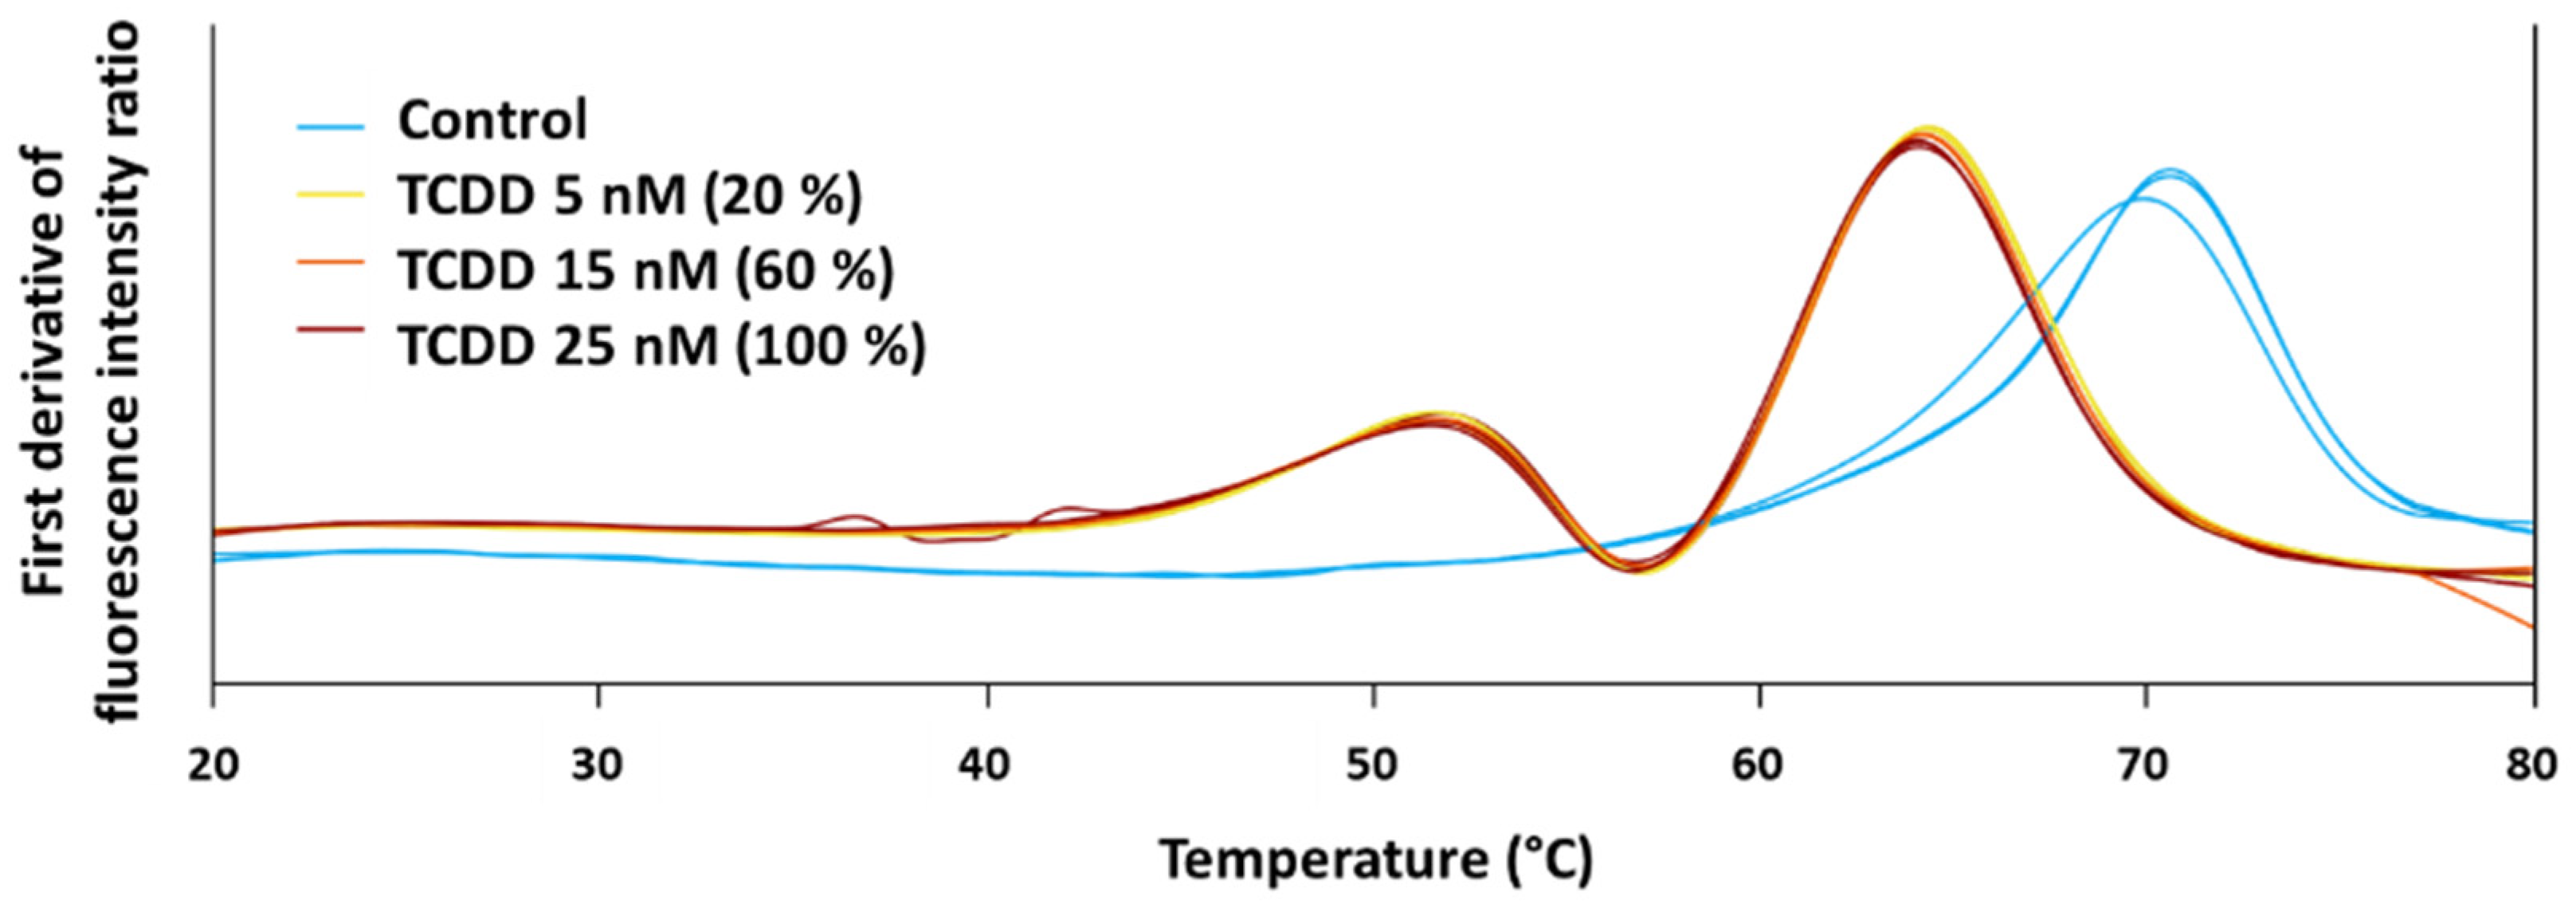
3.2. Orthogonal Protein-Chemical Binding Validation at the Structural Level
3.3. Selection of the Prioritized Target for Developing AOPs
4. Discussion
5. Conclusions
Supplementary Materials
Author Contributions
Funding
Institutional Review Board Statement
Informed Consent Statement
Data Availability Statement
Acknowledgments
Conflicts of Interest
References
- Agency, E.C. Information on Chemicals. European Chemicals Agency. Available online: https://echa.europa.eu/information-on-chemicals/cl-inventory-database/ (accessed on 5 April 2022).
- Vinken, M.; Knapen, D.; Vergauwen, L.; Hengstler, J.G.; Angrish, M.; Whelan, M. Adverse outcome pathways: A concise introduction for toxicologists. Arch. Toxicol. 2017, 91, 3697–3707. [Google Scholar] [CrossRef] [PubMed]
- Ankley, G.T.; Bennett, R.S.; Erickson, R.J.; Hoff, D.J.; Hornung, M.W.; Johnson, R.D.; Mount, D.R.; Nichols, J.W.; Russom, C.L.; Schmieder, P.K.; et al. Adverse outcome pathways: A conceptual framework to support ecotoxicology research and risk assessment. Environ. Toxicol. Chem. 2010, 29, 730–741. [Google Scholar] [CrossRef]
- OECD. Guidance Document for the Use of Adverse Outcome Pathways in Developing Integrated Approaches to Testing and Assessment (IATA) Series on Testing and Assessment; No. 260; OECD Publishing: Paris, France, 2017. [Google Scholar]
- Villeneuve, D.L.; Crump, D.; Garcia-Reyero, N.; Hecker, M.; Hutchinson, T.H.; LaLone, C.A.; Landesmann, B.; Lettieri, T.; Munn, S.; Nepelska, M.; et al. Adverse outcome pathway (AOP) development I: Strategies and principles. Toxicol. Sci. Off. J. Soc. Toxicol. 2014, 142, 312–320. [Google Scholar] [CrossRef]
- Carusi, A.; Davies, M.R.; De Grandis, G.; Escher, B.I.; Hodges, G.; Leung, K.M.Y.; Whelan, M.; Willett, C.; Ankley, G.T. Harvesting the promise of AOPs: An assessment and recommendations. Sci. Total Environ. 2018, 628–629, 1542–1556. [Google Scholar] [CrossRef]
- Schroeder, A.L.; Ankley, G.T.; Houck, K.A.; Villeneuve, D.L. Environmental surveillance and monitoring—The next frontiers for high-throughput toxicology. Environ. Toxicol. Chem. 2016, 35, 513–525. [Google Scholar] [CrossRef]
- Dean, J.L.; Zhao, Q.J.; Lambert, J.C.; Hawkins, B.S.; Thomas, R.S.; Wesselkamper, S.C. Editor’s Highlight: Application of Gene Set Enrichment Analysis for Identification of Chemically Induced, Biologically Relevant Transcriptomic Networks and Potential Utilization in Human Health Risk Assessment. Toxicol. Sci. Off. J. Soc. Toxicol. 2017, 157, 85–99. [Google Scholar] [CrossRef]
- Bundy, J.L.; Judson, R.; Williams, A.J.; Grulke, C.; Shah, I.; Everett, L.J. Predicting molecular initiating events using chemical target annotations and gene expression. BioData Min. 2022, 15, 7. [Google Scholar] [CrossRef] [PubMed]
- Martinez Molina, D.; Jafari, R.; Ignatushchenko, M.; Seki, T.; Larsson, E.A.; Dan, C.; Sreekumar, L.; Cao, Y.; Nordlund, P. Monitoring drug target engagement in cells and tissues using the cellular thermal shift assay. Science 2013, 341, 84–87. [Google Scholar] [CrossRef]
- Savitski, M.M.; Reinhard, F.B.; Franken, H.; Werner, T.; Savitski, M.F.; Eberhard, D.; Martinez Molina, D.; Jafari, R.; Dovega, R.B.; Klaeger, S.; et al. Tracking cancer drugs in living cells by thermal profiling of the proteome. Science 2014, 346, 1255784. [Google Scholar] [CrossRef] [PubMed]
- Gaetani, M.; Sabatier, P.; Saei, A.A.; Beusch, C.M.; Yang, Z.; Lundstrom, S.L.; Zubarev, R.A. Proteome Integral Solubility Alteration: A High-Throughput Proteomics Assay for Target Deconvolution. J. Proteome Res. 2019, 18, 4027–4037. [Google Scholar] [CrossRef]
- Carrasco Del Amor, A.; Freitas, S.; Urbatzka, R.; Fresnedo, O.; Cristobal, S. Application of Bioactive Thermal Proteome Profiling to Decipher the Mechanism of Action of the Lipid Lowering 13(2)-Hydroxy-pheophytin Isolated from a Marine Cyanobacteria. Mar. Drugs 2019, 17, 371. [Google Scholar] [CrossRef]
- Lizano-Fallas, V.; Del Amor, A.C.; Cristobal, S. Systematic analysis of chemical-protein interactions from zebrafish embryo by proteome-wide thermal shift assay, bridging the gap between molecular interactions and toxicity pathways. J. Proteom. 2021, 249, 104382. [Google Scholar] [CrossRef] [PubMed]
- Ishizaka, A.; Nemery, P. Multi-Criteria Decision Analysis. In Methods and Software, 1st ed.; John Wiley & Sons, Incorporated: West Sussex, UK, 2013. [Google Scholar]
- Roy, B. The Optimisation Problem Formulation: Criticism and Overstepping. J. Oper. Res. Soc. 1981, 32, 427–436. [Google Scholar] [CrossRef]
- Saaty, T.L. How to Make a Decision: The Analytic Hierarchy Process. Eur. J. Oper Res. 1990, 48, 9–26. [Google Scholar] [CrossRef]
- Kim, I.; Park, K.; Lee, K.; Park, M.; Lim, H.; Shin, H.; Kim, S.D. Application of various cytotoxic endpoints for the toxicity prioritization of fine dust (PM2.5) sources using a multi-criteria decision-making approach. Environ. Geochem. Health 2020, 42, 1775–1788. [Google Scholar] [CrossRef]
- Oketch-Rabah, H.A.; Hardy, M.L.; Patton, A.P.; Chung, M.; Sarma, N.D.; Yoe, C.; Ayyadurai, V.A.S.; Fox, M.A.; Jordan, S.A.; Mwamburi, M.; et al. Multi-Criteria Decision Analysis Model for Assessing the Risk from Multi-Ingredient Dietary Supplements (MIDS). J. Diet. Suppl. 2021, 18, 293–315. [Google Scholar] [CrossRef]
- Leblanc, A.F.; Attignon, E.A.; Distel, E.; Karakitsios, S.P.; Sarigiannis, D.A.; Bortoli, S.; Barouki, R.; Coumoul, X.; Aggerbeck, M.; Blanc, E.B. A dual mixture of persistent organic pollutants modifies carbohydrate metabolism in the human hepatic cell line HepaRG. Environ. Res. 2019, 178, 108628. [Google Scholar] [CrossRef]
- Smith, P.K.; Krohn, R.I.; Hermanson, G.T.; Mallia, A.K.; Gartner, F.H.; Provenzano, M.D.; Fujimoto, E.K.; Goeke, N.M.; Olson, B.J.; Klenk, D.C. Measurement of Protein Using Bicinchoninic Acid. Anal. Biochem. 1985, 150, 76–85. [Google Scholar] [CrossRef]
- Franken, H.; Mathieson, T.; Childs, D.; Sweetman, G.M.; Werner, T.; Togel, I.; Doce, C.; Gade, S.; Bantscheff, M.; Drewes, G.; et al. Thermal proteome profiling for unbiased identification of direct and indirect drug targets using multiplexed quantitative mass spectrometry. Nat. Protoc. 2015, 10, 1567–1593. [Google Scholar] [CrossRef] [PubMed]
- Perez-Riverol, Y.; Bai, J.; Bandla, C.; Garcia-Seisdedos, D.; Hewapathirana, S.; Kamatchinathan, S.; Kundu, D.J.; Prakash, A.; Frericks-Zipper, A.; Eisenacher, M.; et al. The PRIDE database resources in 2022: A hub for mass spectrometry-based proteomics evidences. Nucleic. Acids. Res. 2022, 50, D543–D552. [Google Scholar] [CrossRef]
- Liu, Y.; Yang, X.; Gan, J.; Chen, S.; Xiao, Z.X.; Cao, Y. CB-Dock2: Improved protein-ligand blind docking by integrating cavity detection, docking and homologous template fitting. Nucleic. Acids. Res. 2022, 50, W159–W164. [Google Scholar] [CrossRef] [PubMed]
- Yeager, R.L.; Reisman, S.A.; Aleksunes, L.M.; Klaassen, C.D. Introducing the “TCDD-inducible AhR-Nrf2 gene battery”. Toxicol. Sci. Off. J. Soc. Toxicol. 2009, 111, 238–246. [Google Scholar] [CrossRef] [PubMed]
- Alexander, C.G.; Wanner, R.; Johnson, C.M.; Breitsprecher, D.; Winter, G.; Duhr, S.; Baaske, P.; Ferguson, N. Novel microscale approaches for easy, rapid determination of protein stability in academic and commercial settings. Biochim. Biophys. Acta 2014, 1844, 2241–2250. [Google Scholar] [CrossRef] [PubMed]
- OECD. Users&apos. In Handbook Supplement to the Guidance Document for Developing and Assessing Adverse Outcome Pathways; OECD Publishing: Paris, France, 2018. [Google Scholar] [CrossRef]
- Karayalcin, I.I. The analytic hierarchy process: Planning, priority setting, resource allocation: Thomas L. SAATY McGraw-Hill, New York, 1980, xiii + 287 pages, £15.65. Eur. J. Oper. Res. 1982, 9, 97–98. [Google Scholar] [CrossRef]
- Yadav, P.; Yadav, S.; Singh, D.; Kapoor, R.M.; Giri, B.S. An analytical hierarchy process based decision support system for the selection of biogas up-gradation technologies. Chemosphere 2022, 302, 134741. [Google Scholar] [CrossRef]
- Larigot, L.; Juricek, L.; Dairou, J.; Coumoul, X. AhR signaling pathways and regulatory functions. Biochim. Open 2018, 7, 1–9. [Google Scholar] [CrossRef]
- Doering, J.; Hecker, M.; Villeneuve, D.; Zhang, X. Aryl Hydrocarbon Receptor Activation Leading to Early Life Stage Mortality, Via Increased COX-2. Available online: https://aopwiki.org/aops/21 (accessed on 10 March 2022).
- Lomenick, B.; Hao, R.; Jonai, N.; Chin, R.M.; Aghajan, M.; Warburton, S.; Wang, J.; Wu, R.P.; Gomez, F.; Loo, J.A.; et al. Target identification using drug affinity responsive target stability (DARTS). Proc. Natl. Acad. Sci. USA 2009, 106, 21984–21989. [Google Scholar] [CrossRef]
- Rogalla, T.; Ehrnsperger, M.; Preville, X.; Kotlyarov, A.; Lutsch, G.; Ducasse, C.; Paul, C.; Wieske, M.; Arrigo, A.P.; Buchner, J.; et al. Regulation of Hsp27 oligomerization, chaperone function, and protective activity against oxidative stress/tumor necrosis factor alpha by phosphorylation. J. Biol. Chem. 1999, 274, 18947–18956. [Google Scholar] [CrossRef]
- Almeida-Souza, L.; Goethals, S.; de Winter, V.; Dierick, I.; Gallardo, R.; Van Durme, J.; Irobi, J.; Gettemans, J.; Rousseau, F.; Schymkowitz, J.; et al. Increased monomerization of mutant HSPB1 leads to protein hyperactivity in Charcot-Marie-Tooth neuropathy. J. Biol. Chem. 2010, 285, 12778–12786. [Google Scholar] [CrossRef]
- Holmgren, A.; Bouhy, D.; De Winter, V.; Asselbergh, B.; Timmermans, J.P.; Irobi, J.; Timmerman, V. Charcot-Marie-Tooth causing HSPB1 mutations increase Cdk5-mediated phosphorylation of neurofilaments. Acta Neuropathol. 2013, 126, 93–108. [Google Scholar] [CrossRef]
- Soh, M.S.; Cheng, X.; Vijayaraghavan, T.; Vernon, A.; Liu, J.; Neumann, B. Disruption of genes associated with Charcot-Marie-Tooth type 2 lead to common behavioural, cellular and molecular defects in Caenorhabditis elegans. PLoS ONE 2020, 15, e0231600. [Google Scholar] [CrossRef]
- Xie, Y.; Lin, Z.; Pakhrin, P.S.; Li, X.; Wang, B.; Liu, L.; Huang, S.; Zhao, H.; Cao, W.; Hu, Z.; et al. Genetic and Clinical Features in 24 Chinese Distal Hereditary Motor Neuropathy Families. Front. Neurol. 2020, 11, 603003. [Google Scholar] [CrossRef] [PubMed]
- Grova, N.; Schroeder, H.; Olivier, J.L.; Turner, J.D. Epigenetic and Neurological Impairments Associated with Early Life Exposure to Persistent Organic Pollutants. Int. J. Genom. 2019, 2019, 2085496. [Google Scholar] [CrossRef] [PubMed]
- Teraoka, H.; Ogawa, A.; Kubota, A.; Stegeman, J.J.; Peterson, R.E.; Hiraga, T. Malformation of certain brain blood vessels caused by TCDD activation of Ahr2/Arnt1 signaling in developing zebrafish. Aquat. Toxicol. 2010, 99, 241–247. [Google Scholar] [CrossRef] [PubMed]
- Antkiewicz, D.S.; Burns, C.G.; Carney, S.A.; Peterson, R.E.; Heideman, W. Heart malformation is an early response to TCDD in embryonic zebrafish. Toxicol. Sci. Off. J. Soc. Toxicol. 2005, 84, 368–377. [Google Scholar] [CrossRef] [PubMed]
- Hofsteen, P.; Plavicki, J.; Johnson, S.D.; Peterson, R.E.; Heideman, W. Sox9b is required for epicardium formation and plays a role in TCDD-induced heart malformation in zebrafish. Mol. Pharmacol. 2013, 84, 353–360. [Google Scholar] [CrossRef]
- Zwierello, W.; Maruszewska, A.; Skorka-Majewicz, M.; Goschorska, M.; Baranowska-Bosiacka, I.; Dec, K.; Styburski, D.; Nowakowska, A.; Gutowska, I. The influence of polyphenols on metabolic disorders caused by compounds released from plastics—Review. Chemosphere 2020, 240, 124901. [Google Scholar] [CrossRef]
- Lam, M.M.; Bulow, R.; Engwall, M.; Giesy, J.P.; Larsson, M. Methylated PACs are more potent than their parent compounds: A study of aryl hydrocarbon receptor-mediated activity, degradability, and mixture interactions in the H4IIE-luc assay. Environ. Toxicol. Chem. 2018, 37, 1409–1419. [Google Scholar] [CrossRef]
- Lille-Langoy, R.; Jorgensen, K.B.; Goksoyr, A.; Pampanin, D.M.; Sydnes, M.O.; Karlsen, O.A. Substituted Two- to Five-Ring Polycyclic Aromatic Compounds Are Potent Agonists of Atlantic Cod (Gadus morhua) Aryl Hydrocarbon Receptors Ahr1a and Ahr2a. Environ. Sci. Technol. 2021, 55, 15123–15135. [Google Scholar] [CrossRef]
- Tomašek, I.; Damby, D.E.; Andronico, D.; Baxter, P.J.; Boonen, I.; Claeys, P.; Denison, M.S.; Horwell, C.J.; Kervyn, M.; Kueppers, U.; et al. Assessing the biological reactivity of organic compounds on volcanic ash: Implications for human health hazard. Bull. Volcanol. 2021, 83, 30. [Google Scholar] [CrossRef]
- Tedesco, B.; Cristofani, R.; Ferrari, V.; Cozzi, M.; Rusmini, P.; Casarotto, E.; Chierichetti, M.; Mina, F.; Galbiati, M.; Piccolella, M.; et al. Insights on Human Small Heat Shock Proteins and Their Alterations in Diseases. Front. Mol. Biosci. 2022, 9, 842149. [Google Scholar] [CrossRef]
- Terra, L.F.; Wailemann, R.A.M.; dos Santos, A.F.; Gomes, V.M.; Silva, R.P.; Laporte, A.; Meotti, F.C.; Terra, W.R.; Palmisano, G.; Lortz, S.; et al. Heat Shock Protein B1 Is a Key Mediator of Prolactin-Induced Beta-Cell Cytoprotection against Oxidative Stress. Free. Radic. Biol. Med. 2019, 134, 394–405. [Google Scholar] [CrossRef]
- Liu, C.; Huang, X.; Wang, P.; Pan, Y.; Cao, D.; Liu, Y.-Y.; Chen, A.-J. Interference of Hsp27 Results in Apoptosis Induced by Photodamage via Regulation of Subcellular Localization of P21 in Immortalized Human Keratinocytes. Med. Sci. Monit. 2019, 25, 7557–7566. [Google Scholar] [CrossRef]
- Doolan, P.; Meleady, P.; Barron, N.; Henry, M.; Gallagher, R.; Gammell, P.; Melville, M.; Sinacore, M.; McCarthy, K.; Leonard, M.; et al. Microarray and Proteomics Expression Profiling Identifies Several Candidates, Including the Valosin-Containing Protein (VCP), Involved in Regulating High Cellular Growth Rate in Production CHO Cell Lines. Biotechnol. Bioeng. 2010, 106, 42–56. [Google Scholar] [CrossRef] [PubMed]
- Wang, Y.; Xiong, Z.; Gong, W.; Zhou, P.; Xie, Q.; Zhou, Z.; Lu, G. Expression of Heat Shock Protein 27 Correlates with Actin Cytoskeletal Dynamics and Contractility of Cultured Human Bladder Smooth Muscle Cells. Exp. Cell Res. 2015, 338, 39–44. [Google Scholar] [CrossRef]
- Picard, B.; Kammoun, M.; Gagaoua, M.; Barboiron, C.; Meunier, B.; Chambon, C.; Cassar-Malek, I. Calcium Homeostasis and Muscle Energy Metabolism Are Modified in HspB1-Null Mice. Proteomes 2016, 4, 17. [Google Scholar] [CrossRef] [PubMed]
- de Thonel, A.; Vandekerckhove, J.; Lanneau, D.; Selvakumar, S.; Courtois, G.; Hazoume, A.; Brunet, M.; Maurel, S.; Hammann, A.; Ribeil, J.A.; et al. HSP27 Controls GATA-1 Protein Level during Erythroid Cell Differentiation. Blood 2010, 116, 85–96. [Google Scholar] [CrossRef]
- Kammoun, M.; Picard, B.; Astruc, T.; Gagaoua, M.; Aubert, D.; Bonnet, M.; Blanquet, V.; Cassar-Malek, I. The Invalidation of HspB1 Gene in Mouse Alters the Ultrastructural Phenotype of Muscles. PLoS ONE 2016, 11, e0158644. [Google Scholar] [CrossRef] [PubMed]
- Homma, Y.; Kinoshita, R.; Kuchitsu, Y.; Wawro, P.S.; Marubashi, S.; Oguchi, M.E.; Ishida, M.; Fujita, N.; Fukuda, M. Comprehensive Knockout Analysis of the Rab Family GTPases in Epithelial Cells. J. Cell Biol. 2019, 218, 2035–2050. [Google Scholar] [CrossRef]
- Hatoyama, Y.; Homma, Y.; Hiragi, S.; Fukuda, M. Establishment and Analysis of Conditional Rab1- and Rab5-Knockout Cells Using the Auxin-Inducible Degron System. J. Cell Sci. 2021, 134, jcs259184. [Google Scholar] [CrossRef]
- Cramer, S.D.; Ferree, P.M.; Lin, K.; Milliner, D.S.; Holmes, R.P. The Gene Encoding Hydroxypyruvate Reductase (GRHPR) Is Mutated in Patients with Primary Hyperoxaluria Type II. Hum. Mol. Genet. 1999, 8, 2063–2069. [Google Scholar] [CrossRef] [PubMed]
- Mutoh, H.; Kato, M.; Akita, T.; Shibata, T.; Wakamoto, H.; Ikeda, H.; Kitaura, H.; Aoto, K.; Nakashima, M.; Wang, T.; et al. Biallelic Variants in CNPY3, Encoding an Endoplasmic Reticulum Chaperone, Cause Early-Onset Epileptic Encephalopathy. Am. J. Hum. Genet. 2018, 102, 321–329. [Google Scholar] [CrossRef] [PubMed]


| Protein | Vina Score (kcal/mol) |
|---|---|
| AHR | −6.6 |
| GTCF3C4 | −7.3 |
| FAM98B | −6.3 |
| HSPB1 | −6.9 |
| RAB1A | −7.2 |
| MTPN | −4.8 |
| KIAA0368 | PDB format not available |
| GRHPR | −6.0 |
| CNPY3 | −6.4 |
| Criteria | Source | Description |
|---|---|---|
| Position in Ft (solubility alteration) ranking | 2D PISA assay | Protein with the highest solubility alteration (the lowest position in the ranking) is more likely to bind the chemical |
| Position in Fc p-value ranking | 2D PISA assay | Protein with the highest significance (the lowest position in the ranking) for solubility alteration is more likely to bind the chemical |
| Number of diseases where it is involved | UniProt | Protein with the highest number of diseases where it is involved has more relevance to be included in an AOP |
| Number of reported negative effects on cells/organs/organisms when their functionality is absent | Literature | Protein with the highest number of reported negative effects on PubMed under the search criteria “lack/absence/knockdown/depletion/knockout of the name of the protein” has more relevance to be included in an AOP |
| Relevance of reported negative effects on cells/organs/organisms when their functionality is absent | Expertise criteria | Negative effects with regulatory significance (accepted protection goal or common apical endpoint in an established regulatory guideline study) are more relevant |
| Number of pathways where it has participation | Reactome/ Metabolic Atlas | Protein with the highest number of pathways where it has participation has more relevance to be included in an AOP |
| Relevance of pathways where it has participation | Expertise criteria | Pathways associated with adverse outcomes are more relevant |
| Number of functional and physical protein associations with other protein targets | STRING | Protein with the highest number of protein associations with other protein targets has more relevance to be included in an AOP |
| Position in Ft (Solubility Alteration) Ranking | Position in Fc p-Value Ranking | Number of Diseases Where It Is Involved | Number of Reported Negative Effects on Cells/Organs/Organisms When Functionality Is Absent | Relevance of Reported Negative Effects on Cells/Organs/Organisms When Functionality Is Absent | Number of Pathways Where It Has Participation | Relevance of Pathways Where It Has Participation | Number of Functional and Physical Protein Associations with Other Protein Targets | Priority Vector | |
|---|---|---|---|---|---|---|---|---|---|
| Position in Ft (solubility alteration) ranking | 1 | 1 | 5 | 5 | 3 | 5 | 3 | 7 | 0.258 |
| Position in Fc p-value ranking | 1 | 1 | 5 | 5 | 3 | 5 | 3 | 7 | 0.258 |
| Number of diseases where it is involved | 1/5 | 1/5 | 1 | 1 | 1/3 | 2 | 1/3 | 5 | 0.060 |
| Number of reported negative effects on cells/organs/organisms when functionality is absent | 1/5 | 1/5 | 1 | 1 | 1/5 | 3 | 1/5 | 5 | 0.061 |
| Relevance of reported negative effects on cells/organs/organisms when functionality is absent | 1/3 | 1/3 | 3 | 5 | 1 | 5 | 3 | 7 | 0.166 |
| Number of pathways where it has participation | 1/5 | 1/5 | 1/2 | 1/3 | 1/5 | 1 | 1/5 | 5 | 0.044 |
| Relevance of pathways where it has participation | 1/3 | 1/3 | 3 | 5 | 1/3 | 5 | 1 | 7 | 0.133 |
| Number of functional and physical protein associations with other protein targets | 1/7 | 1/7 | 1/5 | 1/5 | 1/7 | 1/5 | 1/7 | 1 | 0.021 |
| λmax = 8.831 | CI = 0.119 | RI = 1.41 | CR = 0.084 | ||||||
| Protein | Local Priority | Global Priority | |||||||
|---|---|---|---|---|---|---|---|---|---|
| Position in Ft (Solubility Alteration) Ranking | Position in Fc p-Value Ranking | Number of Diseases Where It Is Involved | Number of Reported Negative Effects on Cells/Organs/Organisms When Functionality Is Absent | Relevance of Reported Negative Effects on Cells/Organs/Organisms When Functionality Is Absent | Number of Pathways Where It Has Participation | Relevance of Pathways Where It Has Participation | Number of Functional and Physical Protein Associations with Other Protein Targets | ||
| 0.258 | 0.258 | 0.060 | 0.061 | 0.166 | 0.044 | 0.133 | 0.021 | ||
| GTF3C4 | 0.093 | 0.130 | 0.006 | 0.006 | 0.016 | 0.004 | 0.008 | 0.002 | 0.265 |
| FAM98B | 0.067 | 0.019 | 0.006 | 0.006 | 0.016 | 0.004 | 0.015 | 0.002 | 0.135 |
| HSPB1 | 0.048 | 0.064 | 0.058 | 0.052 | 0.118 | 0.035 | 0.037 | 0.002 | 0.414 |
| RAB1A | 0.035 | 0.047 | 0.006 | 0.022 | 0.062 | 0.035 | 0.037 | 0.019 | 0.264 |
| MTPN | 0.024 | 0.103 | 0.006 | 0.006 | 0.016 | 0.001 | 0.002 | 0.010 | 0.168 |
| KIAA0368 | 0.016 | 0.082 | 0.006 | 0.011 | 0.016 | 0.000 | 0.001 | 0.010 | 0.142 |
| GRHPR | 0.010 | 0.011 | 0.042 | 0.018 | 0.149 | 0.004 | 0.055 | 0.002 | 0.291 |
| CNPY3 | 0.007 | 0.035 | 0.042 | 0.018 | 0.149 | 0.004 | 0.041 | 0.002 | 0.297 |
| Protein | Global Priority Fluctuation | ||||||||||||||||||
|---|---|---|---|---|---|---|---|---|---|---|---|---|---|---|---|---|---|---|---|
| 0.050 | 0.100 | 0.150 | 0.200 | 0.250 | 0.300 | 0.350 | 0.400 | 0.450 | 0.500 | 0.550 | 0.600 | 0.650 | 0.700 | 0.750 | 0.800 | 0.850 | 0.900 | 0.950 | |
| GTF3C4 | 0.190 | 0.208 | 0.226 | 0.244 | 0.262 | 0.280 | 0.298 | 0.316 | 0.334 | 0.352 | 0.370 | 0.388 | 0.406 | 0.424 | 0.442 | 0.460 | 0.478 | 0.496 | 0.514 |
| FAM98B | 0.081 | 0.094 | 0.107 | 0.120 | 0.133 | 0.146 | 0.159 | 0.172 | 0.185 | 0.198 | 0.211 | 0.224 | 0.237 | 0.249 | 0.262 | 0.275 | 0.288 | 0.301 | 0.314 |
| HSPB1 | 0.375 | 0.385 | 0.394 | 0.403 | 0.413 | 0.422 | 0.431 | 0.441 | 0.450 | 0.460 | 0.469 | 0.478 | 0.488 | 0.497 | 0.506 | 0.516 | 0.525 | 0.535 | 0.544 |
| RAB1A | 0.236 | 0.242 | 0.249 | 0.256 | 0.263 | 0.270 | 0.276 | 0.283 | 0.290 | 0.297 | 0.303 | 0.310 | 0.317 | 0.324 | 0.330 | 0.337 | 0.344 | 0.351 | 0.357 |
| MTPN | 0.149 | 0.154 | 0.158 | 0.163 | 0.167 | 0.172 | 0.177 | 0.181 | 0.186 | 0.190 | 0.195 | 0.200 | 0.204 | 0.209 | 0.213 | 0.218 | 0.223 | 0.227 | 0.232 |
| KIAA0368 | 0.129 | 0.132 | 0.135 | 0.138 | 0.141 | 0.144 | 0.147 | 0.150 | 0.153 | 0.156 | 0.159 | 0.162 | 0.165 | 0.168 | 0.171 | 0.174 | 0.178 | 0.181 | 0.184 |
| GRHPR | 0.283 | 0.285 | 0.287 | 0.289 | 0.291 | 0.293 | 0.294 | 0.296 | 0.298 | 0.300 | 0.302 | 0.304 | 0.306 | 0.308 | 0.310 | 0.312 | 0.314 | 0.316 | 0.318 |
| CNPY3 | 0.292 | 0.293 | 0.294 | 0.296 | 0.297 | 0.298 | 0.300 | 0.301 | 0.302 | 0.304 | 0.305 | 0.306 | 0.307 | 0.309 | 0.310 | 0.311 | 0.313 | 0.314 | 0.315 |
Disclaimer/Publisher’s Note: The statements, opinions and data contained in all publications are solely those of the individual author(s) and contributor(s) and not of MDPI and/or the editor(s). MDPI and/or the editor(s) disclaim responsibility for any injury to people or property resulting from any ideas, methods, instructions or products referred to in the content. |
© 2023 by the authors. Licensee MDPI, Basel, Switzerland. This article is an open access article distributed under the terms and conditions of the Creative Commons Attribution (CC BY) license (https://creativecommons.org/licenses/by/4.0/).
Share and Cite
Lizano-Fallas, V.; Carrasco del Amor, A.; Cristobal, S. Prediction of Molecular Initiating Events for Adverse Outcome Pathways Using High-Throughput Identification of Chemical Targets. Toxics 2023, 11, 189. https://doi.org/10.3390/toxics11020189
Lizano-Fallas V, Carrasco del Amor A, Cristobal S. Prediction of Molecular Initiating Events for Adverse Outcome Pathways Using High-Throughput Identification of Chemical Targets. Toxics. 2023; 11(2):189. https://doi.org/10.3390/toxics11020189
Chicago/Turabian StyleLizano-Fallas, Veronica, Ana Carrasco del Amor, and Susana Cristobal. 2023. "Prediction of Molecular Initiating Events for Adverse Outcome Pathways Using High-Throughput Identification of Chemical Targets" Toxics 11, no. 2: 189. https://doi.org/10.3390/toxics11020189
APA StyleLizano-Fallas, V., Carrasco del Amor, A., & Cristobal, S. (2023). Prediction of Molecular Initiating Events for Adverse Outcome Pathways Using High-Throughput Identification of Chemical Targets. Toxics, 11(2), 189. https://doi.org/10.3390/toxics11020189