


Substantial Changes in Selected Volatile Organic Compounds (VOCs) and Associations with Health Risk Assessments in Industrial Areas during the COVID-19 Pandemic
 , ,
, ,  ,
, 
Abstract
:1. Introduction
2. Methodology
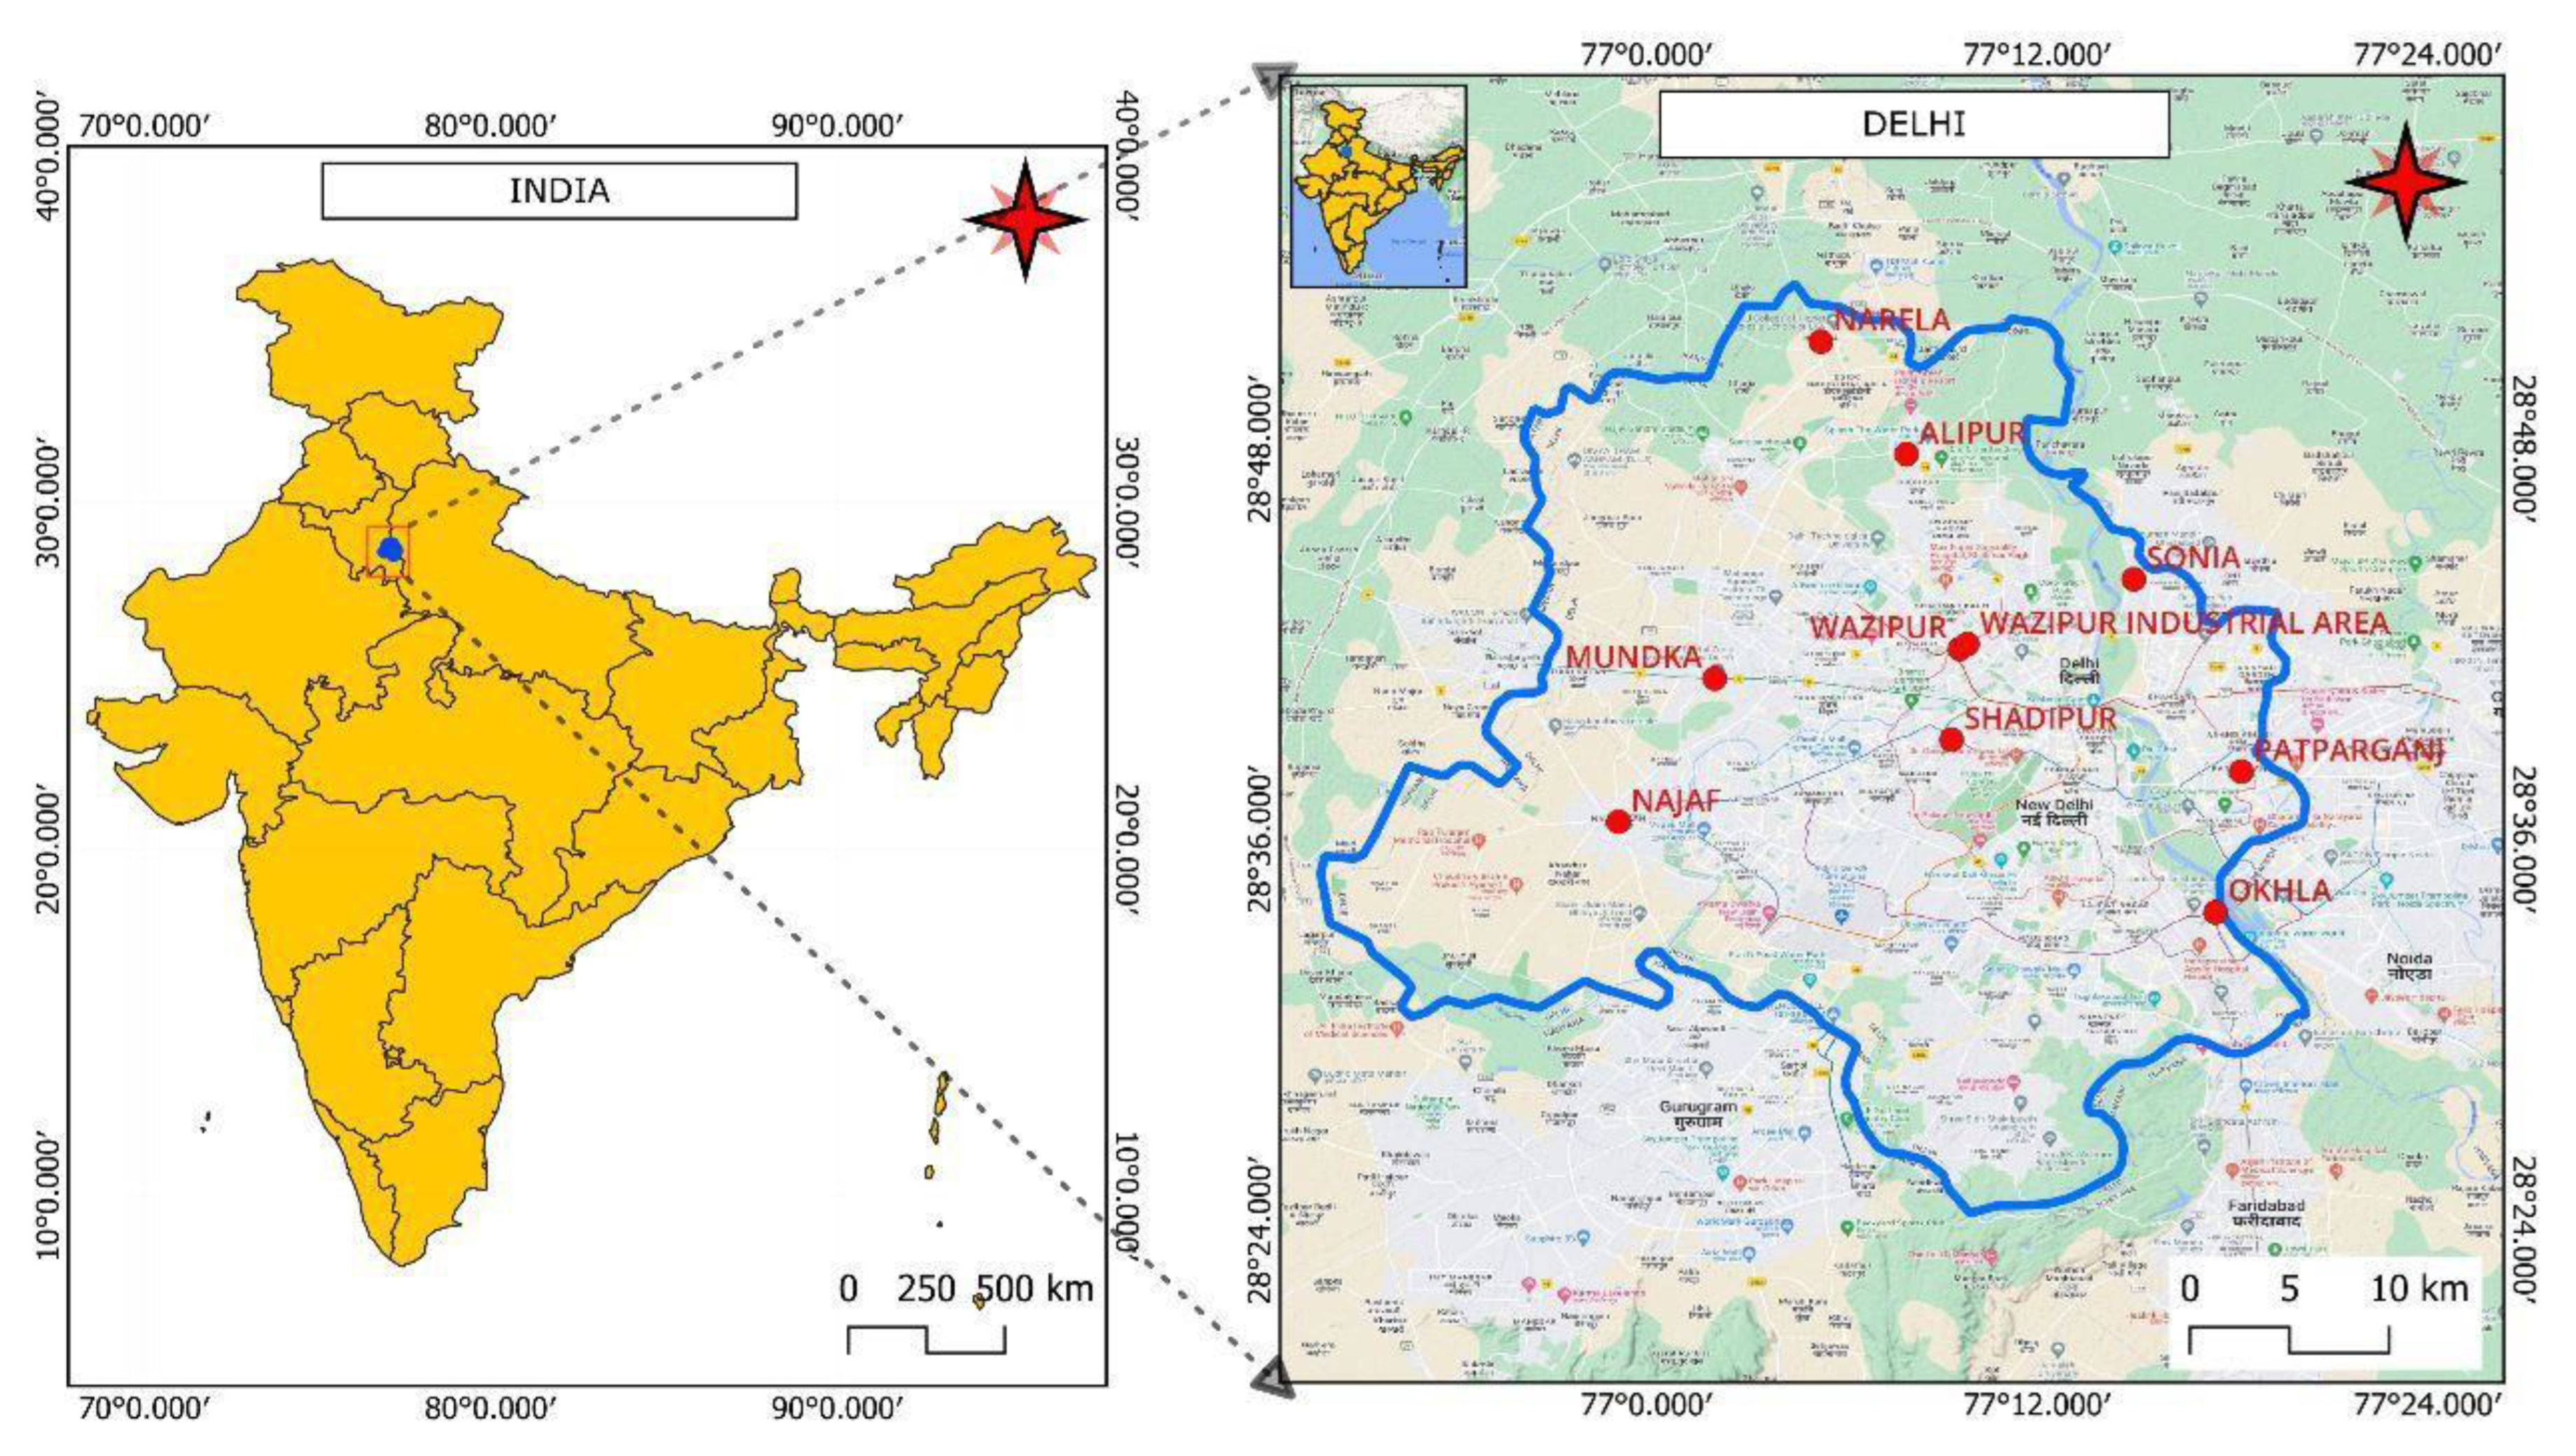
Study Area
3. Data and Sources
4. Human Health Risk Assessment
4.1. Hazard Identification
4.2. Exposure Assessment
5. Results and Discussion
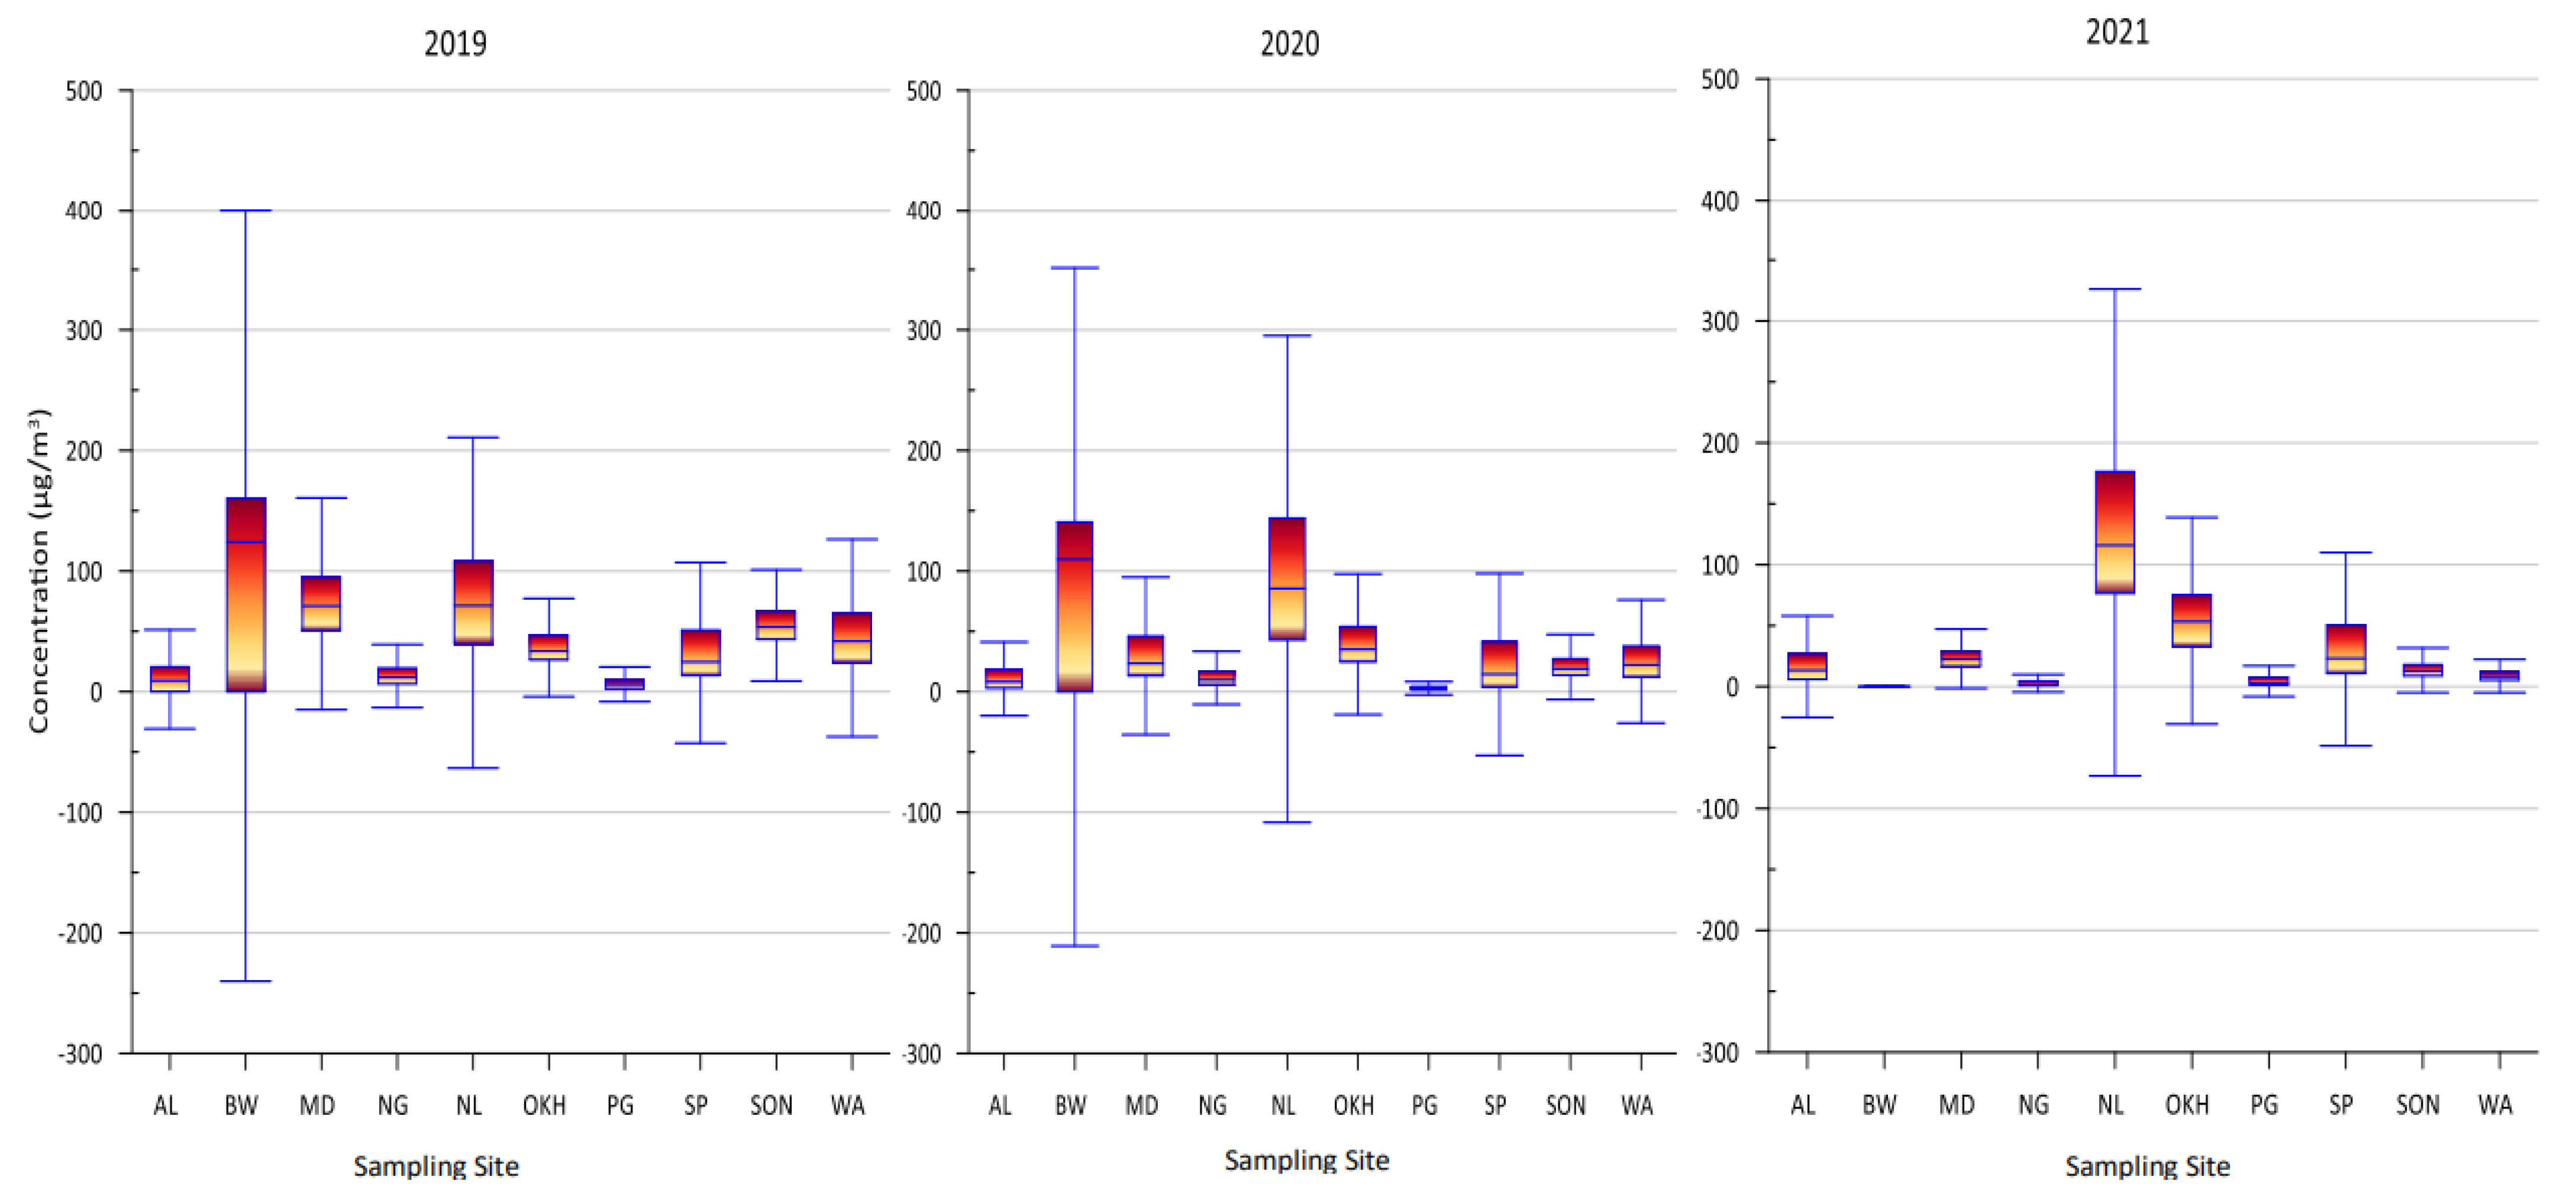
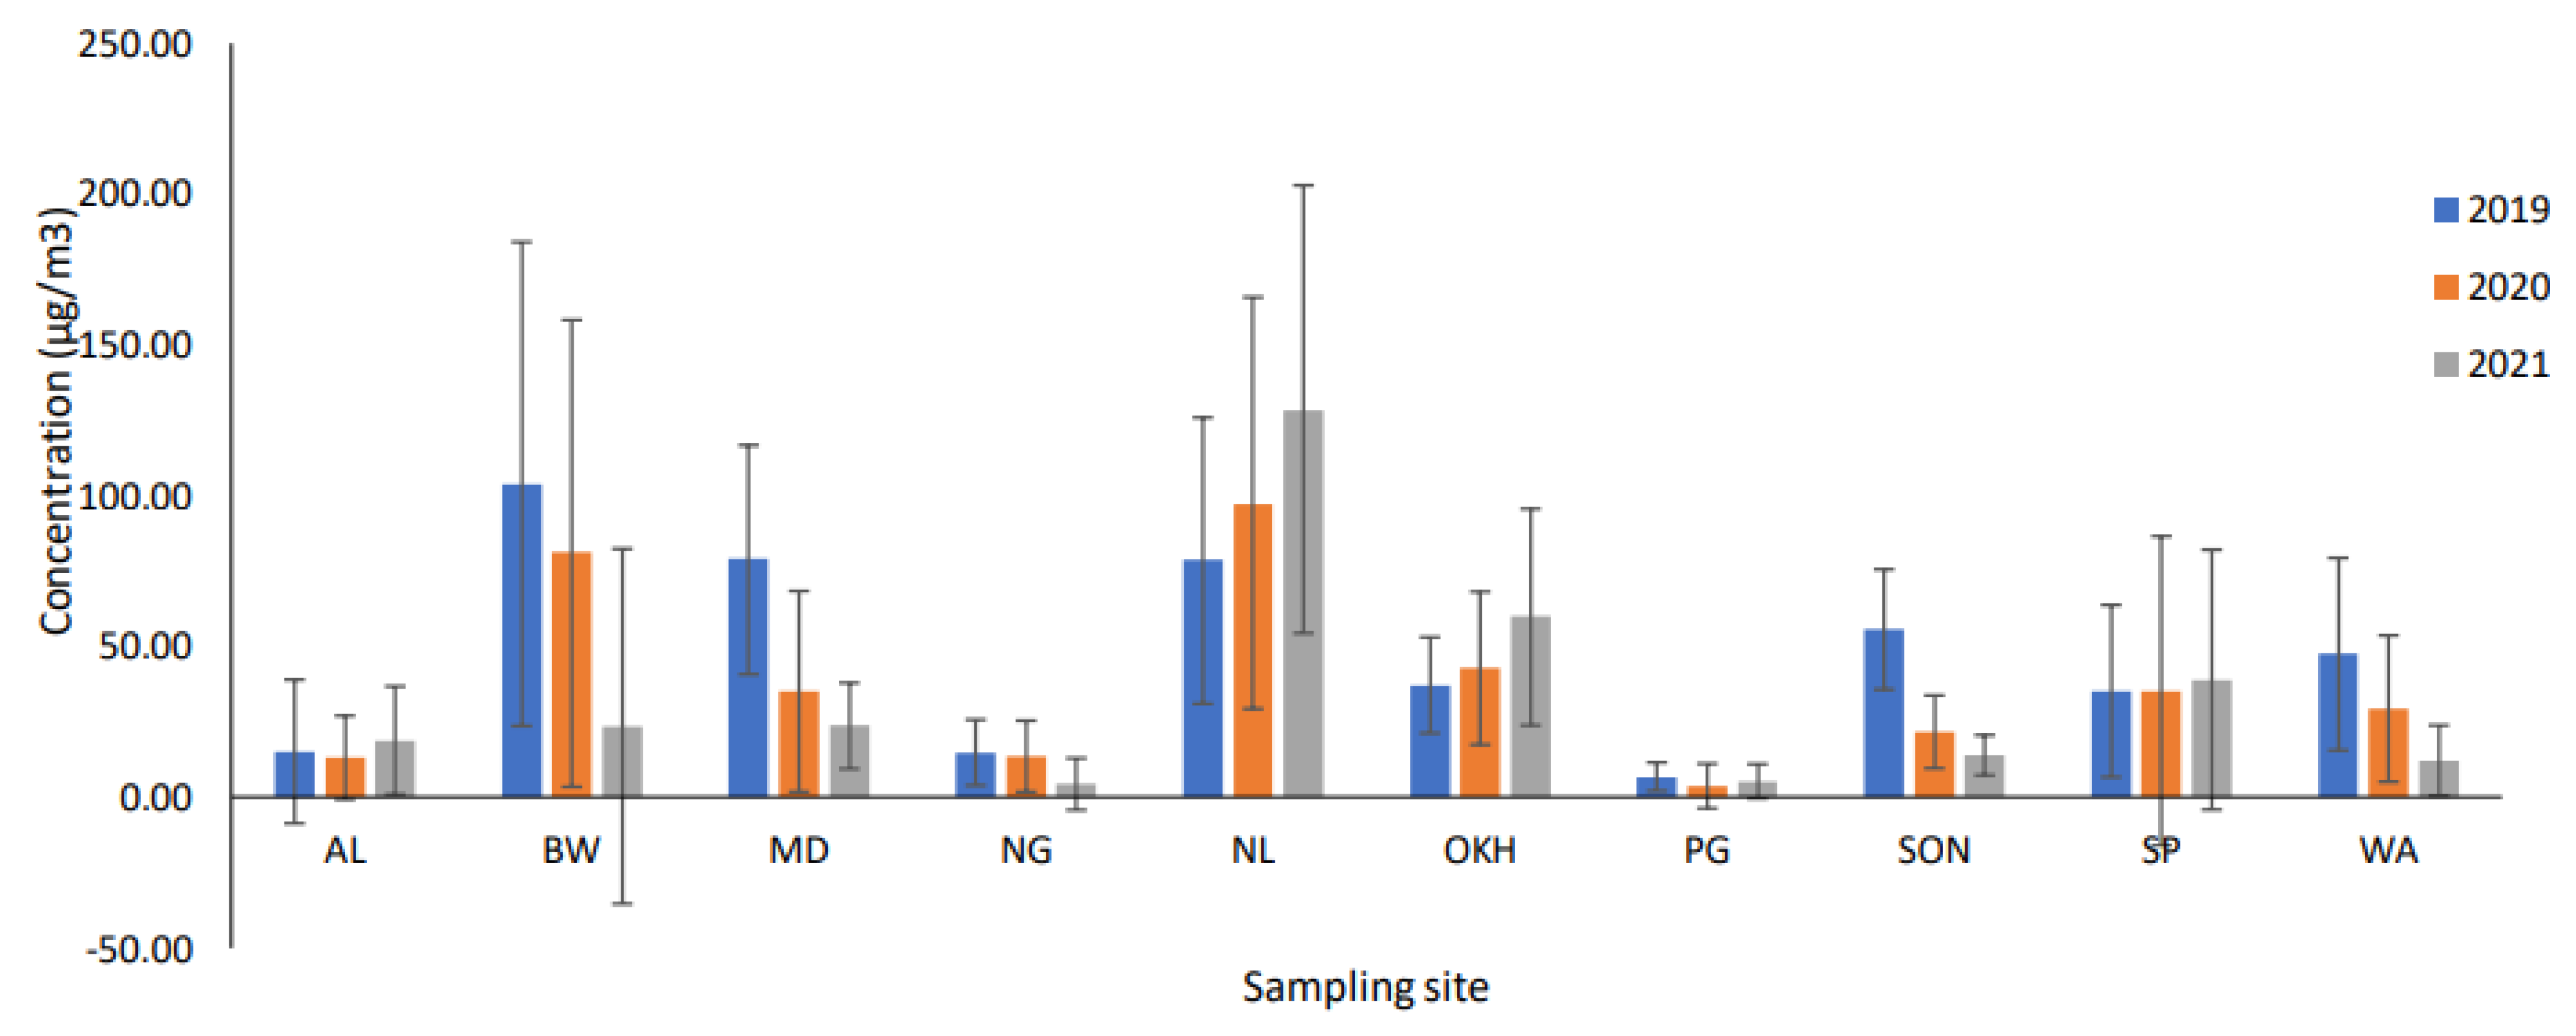
5.1. Total VOC Levels for 2019–2021
5.2. Identification of VOC Characteristic Pollutants for 2019
5.3. Identification of VOC Characteristic Pollutants for 2020
5.4. Identification of VOC Characteristic Pollutants for 2021
5.5. Comparative Analysis of Pre-Pandemic, Pandemic, and Post-Pandemic Periods
5.6. Source Identification
5.7. Correlations among the Monitoring Stations
5.8. Correlations between the TVOC Levels and Meteorological Parameters
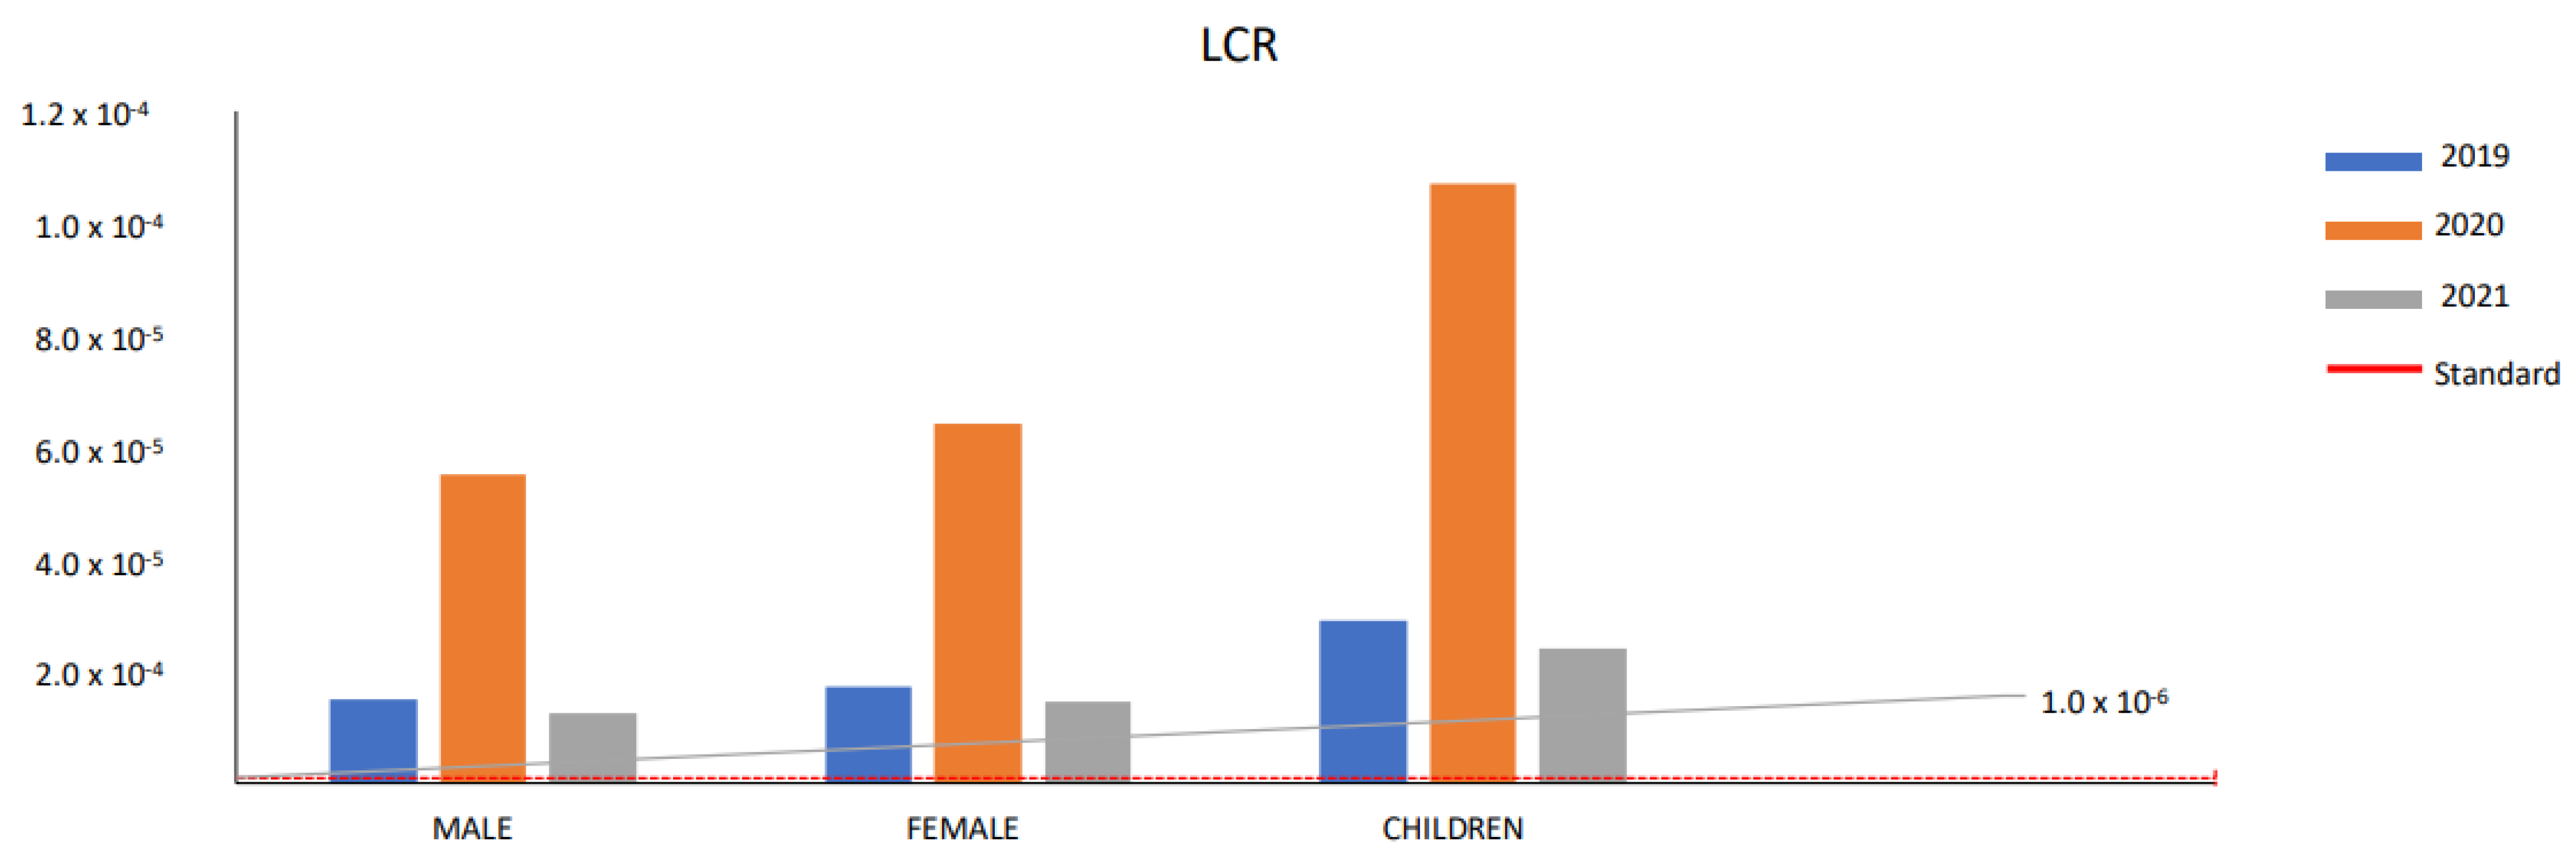
5.9. Health Risk Assessment
Hazard Quotient (HQ)
6. Conclusions
Author Contributions
Funding
Institutional Review Board Statement
Informed Consent Statement
Data Availability Statement
Conflicts of Interest
References
- Martelletti, L.; Martelletti, P. Air pollution and the novel COVID-19 disease: A putative disease risk factor. SN Compr. Clin. Med. 2020, 2, 383–387. [Google Scholar] [CrossRef] [PubMed]
- World Health Organisation. World Health Organization Coronavirus Disease (COVID-19) Pandemic, WHO. 2020. Available online: https://www.who.int/emergencies/diseases/novel-coronavirus-2019 (accessed on 31 March 2020).
- World Health Organisation. World Health Organization, Coronavirus Disease. (COVID-19) India Situation Report-1. 2020. Available online: https://www.who.int/docs/default-source/wrindia/india-situation-report-1.pdf?sfvrsn5ca2a672_0 (accessed on 31 January 2020).
- World Metros. 2022. Available online: https://www.worldometers.info/coronavirus/ (accessed on 5 January 2021).
- Gorai, A.K.; Tchounwou, P.B.; Mitra, G. Spatial variation of ground level ozone concentrations and its health impacts in an urban area in India. Aerosol Air Qual. Res. 2017, 17, 951–964. [Google Scholar] [CrossRef] [PubMed]
- Li, H.; Xu, X.-L.; Dai, D.-W.; Huang, Z.-Y.; Ma, Z.; Guan, Y.-J. Air pollution and temperature are associated with increased COVID-19 incidence: A time series study. Int. J. Infect. Dis. 2020, 97, 278–282. [Google Scholar] [CrossRef] [PubMed]
- Ogen, Y. Assessing nitrogen dioxide (NO2) levels as a contributing factor to the coronavirus (COVID-19) fatality rate. Sci. Total Environ. 2020, 726, 138605. [Google Scholar] [CrossRef]
- Wu, X.; Nethery, R.C.; Sabath, B.M.; Braun, D.; Al, E. Exposure to air pollution and COVID-19 mortality in the United States. medRxiv 2020. [Google Scholar] [CrossRef]
- Zhu, Y.; Xie, J.; Huang, F.; Cao, L. Association between short-term exposure to air pollution and COVID-19 infection: Evidence from China. Sci. Total Environ. 2020, 727, 138704. [Google Scholar] [CrossRef] [PubMed]
- Singh, B.P.; Kumar, P. Spatio-temporal variation in fine particulate matter and effect on air quality during the COVID-19 in New Delhi, India. Urban Clim. 2021, 40, 101013. [Google Scholar] [CrossRef]
- Brandt, E.; Beck, A.; Mersha, T. Air pollution, racial disparities and COVID-19 mortality. J. Allergy Clin. Immunol. 2020, 146, 61–63. [Google Scholar] [CrossRef]
- Comunian, S.; Dongo, D.; Milani, C.; Palestini, P. Air pollution and COVID-19: The role of particulate matter in the spread and Increase of COVID-19′s morbidity and mortality. Int. J. Environ. Res. Public Health 2020, 17, 4487. [Google Scholar] [CrossRef]
- Paital, B.; Agrawal, P.K. Air pollution by NO2 and PM2.5 explains COVID-19 infection severity by overexpression of angiotensin-converting enzyme 2 in respiratory cells: A review. Environ. Chem. Lett. 2020, 19, 25–42. [Google Scholar] [CrossRef]
- Pozzer, A.; Dominici, F.; Haines, A.; Witt, C.; Münzel, T.; Lelieveld, J. Regional and global contributions of air pollution to risk of death from COVID-19. Cardiovasc. Res. 2020, 116, 2247–2253. [Google Scholar] [CrossRef] [PubMed]
- Kumar, A.; Singh, B.P.; Punia, M.; Singh, D.; Kumar, K.; Jain, V.K. Assessment of indoor air concentrations of VOCs and their associated health risks in the library of Jawaharlal Nehru University, New Delhi. Environ. Sci. Pollut. Res. 2014, 21, 2240–2248. [Google Scholar] [CrossRef] [PubMed]
- Kumar, A.; Singh, B.P.; Punia, M.; Singh, D.; Kumar, K.; Jain, V.K. Determination of volatile organic compounds and associated health risk assessment in residential homes and hostels within an academic institute, New Delhi. Indoor Air 2014, 24, 474–483. [Google Scholar] [CrossRef] [PubMed]
- Kumar, A.; Singh, D.; Singh, B.P.; Singh, M.; Anandam, K.; Kumar, K.; Jain, V.K. Spatial and temporal variability of surface ozone and nitrogen oxides in urban and rural ambient air of Delhi-NCR, India. Air Qual. Atmos. Health 2015, 8, 391–399. [Google Scholar] [CrossRef]
- Pandey, N.; Singh, B.P.; Singh, M.; Tyagi, S. Diurnal Variation of Ozone Levels in Academic Hostel in Delhi-A Case Study of JNU campus. Int. J. Appl. Environ. Sci. 2017, 12, 6. [Google Scholar]
- Shuai, J.; Kim, S.; Ryu, H.; Park, J.; Lee, C.K.; Kim, G.B.; Ultra, V.U.; Yang, W. Health risk assessment of volatile organic compounds exposure near Daegu dyeing industrial complex in South Korea. BMC Public Health 2018, 18, 528. [Google Scholar] [CrossRef]
- Singh, B.P.; Zughaibi, T.A.; Alharthy, S.A.; Al-Asmari, A.I.; Rahman, S. Statistical analysis, source apportionment, and toxicity of particulate- and gaseous-phase PAHs in the urban atmosphere. Front. Public Health 2023, 10, 1070663. [Google Scholar] [CrossRef]
- Singh, H.; Meraj, G.; Singh, S.; Shrivastava, V.; Sharma, V.; Farooq, M.; Kanga, S.; Singh, S.K.; Kumar, P. Status of Air Pollution during COVID-19-Induced Lockdown in Delhi, India. Atmosphere 2022, 13, 2090. [Google Scholar] [CrossRef]
- Chen, K.; Wang, M.; Huang, C.; Kinney, P.L.; Anastas, P.T. Air pollution reduction and mortality benefit during the COVID-19 outbreak in China. Lancet Planet. Health 2020, 4, E210–E212. [Google Scholar] [CrossRef]
- Dutheil, F.; Baker, J.S.; Navel, V. COVID-19 as a factor influencing air pollution? Environ. Pollut. 2020, 263, 114466. [Google Scholar] [CrossRef]
- Singh, B.P.; Rana, P.; Mittal, N.; Kumar, S.; Athar, M.; Abduljaleel, Z.; Rahman, S. Variations in the Yamuna River Water Quality During the COVID-19 Lockdowns. Front. Environ. Sci. 2022, 10, 940640. [Google Scholar] [CrossRef]
- Singh, B.P.; Kumar, K.; Jain, V.K. Source identification and health risk assessment associated with particulate- and gaseous-phase PAHs at residential sites in Delhi, India. Air Qual. Atmos. Health 2021, 14, 1505–1521. [Google Scholar] [CrossRef]
- Singh, B.P.; Kumar, K.; Jain, V.K. Distribution of ring PAHs in particulate/gaseous phase in the urban city of Delhi, India: Seasonal variation and cancer risk assessment. Urban Clim. 2021, 40, 101010. [Google Scholar] [CrossRef]
- Pollack, I.B.; Ryerson, T.B.; Trainer, M.; Parrish, D.D.; Andrews, A.E.; Atlas, E.L.; Blake, D.R.; Brown, S.S.; Commane, R.; Daube, B.C.; et al. Airborne and ground-based observations of a weekend effect in ozone, precursors, and oxidation products in the California South Coast Air Basin. J. Geophys. Res. 2012, 117, D00V05. [Google Scholar] [CrossRef]
- Singh, D.; Kumar, A.; Kumar, K.; Singh, B.; Mina, U.; Singh, B.B.; Jain, V.K. Statistical modeling of O3, NOx, CO, PM2.5, VOCs and noise levels in commercial complex and associated health risk assessment in an academic institution. Sci. Total Environ. 2016, 572, 586–594. [Google Scholar] [CrossRef] [PubMed]
- Luecken, D.; Napelenok, S.; Strum, M.; Scheffe, R.; Phillips, S. Sensitivity of ambient atmospheric formaldehyde and ozone to precursor species and source types across the United States. Environ. Sci. Technol. 2018, 52, 4668–4675. [Google Scholar] [CrossRef] [PubMed]
- Pakkattil, A.; Muhsin, M.; Varma, M.K.R. COVID-19 lockdown: Effects on selected volatile organic compound (VOC) emissions over the major Indian metro cities. Urban Clim. 2021, 37, 100838. [Google Scholar] [CrossRef]
- Allahabady, A.; Yousefi, Z.; Tahamtan RA, M.; Sharif, Z.P. Measurement of BTEX (benzene, toluene, ethylbenzene and xylene) concentration at gas stations. Environ. Health Eng. Manag. 2022, 9, 23–31. [Google Scholar] [CrossRef]
- Molekoa, M.D.; Kumar, P.; Choudhary, B.K.; Yunus, A.P.; Kharrazi, A.; Khedher, K.M.; Alshayeb, M.J.; Singh, B.P.; Minh, H.V.T.; Kurniawan, T.A.; et al. Spatio-temporal variations in the water quality of the Doorndraai Dam, South Africa: An assessment of sustainable water resource management. Curr. Res. Environ. Sustain. 2022, 4, 100187. [Google Scholar] [CrossRef]
- Subali, A.D.; Wiyono, L.; Yusuf, M.; Zaky, M.F.A. The potential of volatile organic compounds-based breath analysis for COVID-19 screening: A systematic review & meta-analysis. Diagn. Microbiol. Infect. Dis. 2022, 102, 115589. [Google Scholar] [CrossRef]
- Singh, B.P.; Kumari, S.; Nair, A.; Kumari, S.; Wabaidur, S.M.; Avtar, R.; Rahman, S. Temporary reduction in VOCs associated with health risk during and after COVID-19 in Maharashtra, India. J. Atmos. Chem. 2022, 17, 1–24. [Google Scholar] [CrossRef] [PubMed]
- Sahu, V.; Gurjar, B.R. Spatial and seasonal variation of air quality in different microenvironments of a technical university in India. Build. Environ. 2020, 185, 107310. [Google Scholar] [CrossRef]
- Ghaffari, H.R.; Kamari, Z.; Hassanvand, M.S.; Fazlzadeh, M.; Heidari, M. Level of air BTEX in urban, rural and industrial regions of Bandar Abbas, Iran; indoor-outdoor relationships and probabilistic health risk assessment. Environ. Res. 2021, 200, 111745. [Google Scholar] [CrossRef] [PubMed]
- Yousefian, F.; Mahvi, A.H.; Yunesian, M.; Hassanvand, M.S.; Kashani, H.; Amini, H. Long-term exposure to ambient air pollution and autism spectrum disorder in children: A case-control study in Tehran, Iran. Sci. Total Environ. 2018, 643, 1216–1222. [Google Scholar] [CrossRef] [PubMed]
- Cerón-Bretón, J.G.; Cerón-Bretón, R.M.; Kahl, J.D.W.; Ramírez-Lara, E.; Guarnaccia, C.; Aguilar-Ucán, C.A.; López-Chuken, U.; Montalvo-Romero, C.; Anguebes-Franseschi, F. Diurnal and seasonal variation of BTEX in the air of Monterrey, Mexico: Preliminary study of sources and photochemical ozone pollution. Air Qual. Atmos. Health 2015, 8, 469–482. [Google Scholar] [CrossRef]
- Paterson, C.A.; Sharpe, R.A.; Taylor, T.; Morrissey, K. Indoor PM2.5, VOCs and asthma outcomes: A systematic review in adults and their home environments. Environ. Res. 2021, 202, 111631. [Google Scholar] [CrossRef]
- Alford, K.L.; Kumar, N. Pulmonary Health Effects of Indoor Volatile Organic Compounds—A Meta-Analysis. Int. J. Environ. Res. Public Health 2021, 18, 1578. [Google Scholar] [CrossRef]
- Baker, E.L.; Smith, T.J.; Landrigan, P.J. The neurotoxicity of industrial solvents: A review of the literature. Am. J. Ind. Med. 1985, 8, 207–217. [Google Scholar] [CrossRef]
- Hazrati, S.; Rostami, R.; Farjaminezhad, M.; Fazlzadeh, M. Preliminary assessment of BTEX concentrations in indoor air of residential buildings and atmospheric ambient air in Ardabil, Iran. Atmos. Environ. 2016, 132, 91–97. [Google Scholar] [CrossRef]
- Tiwari, S.; Srivastava, A.K.; Bisht, D.S.; Parmita, P.; Srivastava, M.K.; Attri, S.D. Diurnal and seasonal variations of black carbon and PM2.5 over NewDelhi, India: Influence of meteorology. Atmos. Res. 2013, 125, 50–62. [Google Scholar] [CrossRef]
- Srivastava, A.; Jain, V.K.; Srivastava, A. SEM EDX analysis of various sizes aerosols in Delhi India. Environ. Monit. Assess. 2009, 150, 405–416. [Google Scholar] [CrossRef] [PubMed]
- Central Pollution Control Board (CPCB). Central Pollution Control Board (CPCB), Ministry of Environment, Forest and Climate Change. New Delhi: Government of India. 2022. Available online: https://app.cpcbccr.com/ccr/#/caaqm-dashboard-all/caaqm-landing (accessed on 5 January 2022).
- Zhang, H.; Li, H.; Zhang, Q.; Zhang, Y.; Zhang, W.; Wang, X.; Bi, F.; Chai, F.; Gao, J.; Meng, L.; et al. Atmospheric volatile organic compounds in a typical urban area of Beijing: Pollution characterization, health risk. Atmosphere 2017, 8, 61. [Google Scholar] [CrossRef]
- Zhang, Z.; Xu, J.; Ye, T.; Chen, L.; Chen, H.; Yao, J. Distributions and temporal changes of benzene, toluene, ethylbenzene, and xylene concentrations in newly decorated rooms in southeastern China, and the health risks posed. Atmos. Environ. 2020, 246, 118071. [Google Scholar] [CrossRef]
- Srivastava, A.; Gupta, S.; Jain, V.K. Source apportionment of total suspended particulate matter in coarse and fine ranges over Delhi. Aerosol. Air Qual. Res. 2008, 8, 188–200. [Google Scholar] [CrossRef]
- Sahu, L.K.; Saxena, P. High time and mass resolved PTR-TOF-MS measurements of VOCs at an urban site of India during winter: Role of anthropogenic, biomass burning, biogenic and photochemical sources. Atmos. Res. 2015, 164–165, 84–94. [Google Scholar] [CrossRef]
- Raysoni, A.U.; Stock, T.H.; Sarnat, J.A.; Chavez, M.C.; Sarnat, S.E.; Montoya, T.; Holguin, F.; Li, W.W. Evaluation of VOC concentrations in indoor and outdoor microenvironments at near-road schools. Environ. Pollut. 2017, 231, 681–693. [Google Scholar] [CrossRef]
- Akoglu, H. User’s guide to the correlation coefficient. Turk. J. Emerg. Med. 2018, 18, 91–93. [Google Scholar] [CrossRef]
- Punia, M.; Nain, S.; Kumar, A.; Singh, B.P.; Prakash, A.; Kumar, K.; Jain, V.K. Analysis of temperature variability over north-west part of India for the period 1970–2000. Nat. Hazards 2015, 75, 935–952. [Google Scholar] [CrossRef]
- Bhardwaj, P.; Singh, B.P.; Pandey, A.K.; Jain, V.K.; Kumar, K. Characterization and Morphological Analysis of Summer and Wintertime PM 2.5 Aerosols Over Urban-Rural Locations in Delhi-NCR. Int. J. Appl. Environ. Sci. 2017, 12, 5. [Google Scholar]
- Singh, B.P.; Singh, D.; Kumar, K.; Jain, V.K. Study of seasonal variation of PM2.5 concentration associated with meteorological parameters at residential sites in Delhi, India. J. Atmos. Chem. 2021, 78, 161–176. [Google Scholar] [CrossRef]
- Su, F.C.; Jia, C.; Batterman, S. Extreme value analyses of VOC exposures and risks: A comparison of RIOPA and NHANES datasets. Atmos. Environ. 2012, 62, 97–106. [Google Scholar] [CrossRef] [PubMed]
- Alsbou, E.M.; Omari, K.W. BTEX indoor air characteristic values in rural areas of Jordan: Heaters and health risk assessment consequences in winter season. Environ. Pollut. 2020, 267, 115464. [Google Scholar] [CrossRef] [PubMed]
- Kim, H.; Lim, Y.; Shin, D.; Sohn, J.R.; Yang, J. Risk Assessment of Volatile Organic Compounds (VOCs) and Formaldehyde in Korean Public Facilities: Derivation of Health Protection Criteria Levels. Asian J. Atmos. Environ. 2011, 5, 121–133. [Google Scholar] [CrossRef]
- Pinthong, N.; Thepanondh, S.; Kondo, A. Source Identification of VOCs and their Environmental Health Risk in a Petrochemical Industrial Area. Aerosol Air Qual. Res. 2022, 22, 210064. [Google Scholar] [CrossRef]
- Yousefian, F.; Sadegh, M.; Nabizadeh, R. The concentration of BTEX compounds and health risk assessment in municipal solid waste facilities and urban areas. Environ. Res. 2020, 191, 110068. [Google Scholar] [CrossRef] [PubMed]
- Baberi, Z.; Azhdarpoor, A.; Hoseini, M.; Baghapour, M. Monitoring Benzene, Toluene, Ethylbenzene, and Xylene (BTEX) Levels in Mixed-Use Residential-Commercial Buildings in Shiraz, Iran: Assessing the Carcinogenicity and Non-Carcinogenicity Risk of Their Inhabitants. Int. J. Environ. Res. Public Health 2022, 19, 723. [Google Scholar] [CrossRef]
- Qin, N.; Zhu, Y.; Zhong, Y.; Tian, J.; Li, J.; Chen, L.; Fan, R.; Wei, F. External Exposure to BTEX, Internal Biomarker Response, and Health Risk Assessment of Nonoccupational Populations near a Coking Plant in Southwest China. Int. J. Environ. Res. Pub. Health 2022, 19, 847. [Google Scholar] [CrossRef]
- Ramírez, N.; Cuadras, A.; Rovira, E.; Borrull, F.; Marcé, R.M. Chronic risk assessment of exposure to volatile organic compounds in the atmosphere near the largest Mediterranean industrial site. Environ. Int. 2012, 39, 200–209. [Google Scholar] [CrossRef]


| S. No. | Monitoring Stations | Latitude (0 E) | Longitude (0 N) | Population Density (2021 Census) (Km−2) |
|---|---|---|---|---|
| 1. | Alipur (AL) | 77.1331 | 28.7972 | 6369 |
| 2 | Bawana (BW) | 77.0483 | 28.7932 | 6660 |
| 3 | Mundaka (MD) | 77.0349 | 28.6823 | 10,275 |
| 4 | Najafgarh (NG) | 76.9855 | 28.6090 | 5213 |
| 5 | Narela (NL) | 77.0892 | 28.8549 | 3071 |
| 6 | Okhala (OKH) | 77.2914 | 28.5626 | 31,087 |
| 7 | Patparganj (PG) | 77.3046 | 28.6347 | 22,088 |
| 8 | Shadipur (SP) | 77.1582 | 28.6516 | 23,942 |
| 9 | SoniaVihar (SON) | 77.2496 | 28.7332 | 5662 |
| 10 | Wazirpur (WA) | 77.1604 | 28.6975 | 24,908 |
| AL | BW | MD | NG | NL | OKH | PG | SP | SON | WA | |
|---|---|---|---|---|---|---|---|---|---|---|
| AL | 1 | |||||||||
| BW | 0.003 | 1 | ||||||||
| MW | 0.306 ** | 0.306 ** | 1 | |||||||
| NG | 0.234 ** | 0.302 ** | 0.734 ** | 1 | ||||||
| NL | −0.006 | 0.434 ** | 0.286 ** | 0.448 ** | 1 | |||||
| OKH | 0.062 | 0.153 ** | 0.296 ** | 0.351 ** | 0.178 ** | 1 | ||||
| PG | −0.140 ** | 0.081 | 0.116 * | 0.019 | 0.116 * | 0.094 | 1 | |||
| SP | 0.192 ** | 0.206 ** | 0.441 ** | 0.317 ** | 0.325 ** | 0.139 ** | 0.310 ** | 1 | ||
| SON | 0.227 ** | 0.148 ** | 0.545 ** | 0.337 ** | 0.036 | 0.167 ** | 0.222 ** | 0.106 * | 1 | |
| WA | −0.081 | 0.044 | −0.005 | −0.207 ** | 0.022 | −0.109 * | 0.236 ** | 0.301 ** | 0.048 | 1 |
| AL | BW | MW | NG | NL | OKH | PG | SP | SON | WA | |
|---|---|---|---|---|---|---|---|---|---|---|
| AL | 1 | |||||||||
| BW | 0.255 ** | 1 | ||||||||
| MW | 0.300 ** | 0.360 ** | 1 | |||||||
| NG | 0.343 ** | 0.440 ** | 0.575 ** | 1 | ||||||
| NL | 0.454 ** | 0.499 ** | 0.413 ** | 0.665 ** | 1 | |||||
| OKH | 0.554 ** | 0.343 ** | 0.373 ** | 0.598 ** | 0.628 ** | 1 | ||||
| PG | 0.141 ** | 0.107 * | 0.129 * | 0.139 ** | 0.066 | 0.092 | 1 | |||
| SP | 0.736 ** | 0.340 ** | 0.422 ** | 0.550 ** | 0.547 ** | 0.619 ** | 0.173 ** | 1 | ||
| SON | 0.468 ** | 0.356 ** | 0.515 ** | 0.536 ** | 0.347 ** | 0.434 ** | 0.194 ** | 0.530 ** | 1 | |
| WA | 0.080 | 0.187 ** | 0.096 | −0.013 | 0.077 | 0.023 | −0.067 | 0.041 | −0.038 | 1 |
| AL | BW | MW | NG | NL | OKH | PG | SP | SON | WA | |
|---|---|---|---|---|---|---|---|---|---|---|
| AL | 1 | |||||||||
| BW | 0.497 ** | 1 | ||||||||
| MW | −0.021 | −0.076 | 1 | |||||||
| NG | 0.349 ** | 0.646 ** | 0.021 | 1 | ||||||
| NL | 0.130 * | 0.157 ** | 0.119 * | 0.273 ** | 1 | |||||
| OKH | 0.219 ** | 0.176 ** | 0.197 ** | 0.309 ** | 0.571 ** | 1 | ||||
| PG | 0.240 ** | −0.004 | 0.094 | 0.094 | 0.354 ** | 0.725 ** | 1 | |||
| SP | 0.654 ** | 0.553 ** | 0.027 | 0.426 ** | 0.254 ** | 0.287 ** | 0.292 ** | 1 | ||
| SON | 0.565 ** | 0.513 ** | 0.054 | 0.546 ** | 0.377 ** | 0.612 ** | 0.534 ** | 0.617 ** | 1 | |
| WA | 0.572 ** | 0.813 ** | 0.016 | 0.648 ** | 0.112 * | 0.255 ** | 0.105 * | 0.587 ** | 0.618 ** | 1 |
| Parameters | TVOCs | SR | BP | AT | RF | WS | WD |
|---|---|---|---|---|---|---|---|
| TVOCs | 1 | ||||||
| SR | 0.034 | 1 | |||||
| BP | 0.118 | −0.176 | 1 | ||||
| AT | −0.168 | 0.146 | 0.169 | 1 | |||
| RF | 0.012 | 0.059 | −0.992 ** | −0.070 | 1 | ||
| WS | −0.150 | 0.123 | 0.077 | −0.137 | −0.047 | 1 | |
| WD | 0.007 | −0.355 | 0.102 | 0.100 | −0.061 | −0.308 | 1 |
Disclaimer/Publisher’s Note: The statements, opinions and data contained in all publications are solely those of the individual author(s) and contributor(s) and not of MDPI and/or the editor(s). MDPI and/or the editor(s) disclaim responsibility for any injury to people or property resulting from any ideas, methods, instructions or products referred to in the content. |
© 2023 by the authors. Licensee MDPI, Basel, Switzerland. This article is an open access article distributed under the terms and conditions of the Creative Commons Attribution (CC BY) license (https://creativecommons.org/licenses/by/4.0/).
Share and Cite
Singh, B.P.; Sohrab, S.S.; Athar, M.; Alandijany, T.A.; Kumari, S.; Nair, A.; Kumari, S.; Mehra, K.; Chowdhary, K.; Rahman, S.; et al. Substantial Changes in Selected Volatile Organic Compounds (VOCs) and Associations with Health Risk Assessments in Industrial Areas during the COVID-19 Pandemic. Toxics 2023, 11, 165. https://doi.org/10.3390/toxics11020165
Singh BP, Sohrab SS, Athar M, Alandijany TA, Kumari S, Nair A, Kumari S, Mehra K, Chowdhary K, Rahman S, et al. Substantial Changes in Selected Volatile Organic Compounds (VOCs) and Associations with Health Risk Assessments in Industrial Areas during the COVID-19 Pandemic. Toxics. 2023; 11(2):165. https://doi.org/10.3390/toxics11020165
Chicago/Turabian StyleSingh, Bhupendra Pratap, Sayed Sartaj Sohrab, Mohammad Athar, Thamir A. Alandijany, Saumya Kumari, Arathi Nair, Sweety Kumari, Kriti Mehra, Khyati Chowdhary, Shakilur Rahman, and et al. 2023. "Substantial Changes in Selected Volatile Organic Compounds (VOCs) and Associations with Health Risk Assessments in Industrial Areas during the COVID-19 Pandemic" Toxics 11, no. 2: 165. https://doi.org/10.3390/toxics11020165
APA StyleSingh, B. P., Sohrab, S. S., Athar, M., Alandijany, T. A., Kumari, S., Nair, A., Kumari, S., Mehra, K., Chowdhary, K., Rahman, S., & Azhar, E. I. (2023). Substantial Changes in Selected Volatile Organic Compounds (VOCs) and Associations with Health Risk Assessments in Industrial Areas during the COVID-19 Pandemic. Toxics, 11(2), 165. https://doi.org/10.3390/toxics11020165