Article

Photo-Fenton Degradation Process of Styrene in Nitrogen-Sealed Storage Tank

1
College of Environmental and Safety Engineering, Qingdao University of Science and Technology, Qingdao 266042, China
2
Shandong Furixuanwei New Materials Technology Co., Ltd., Weifang 261000, China
3
College of Mechanical and Electrical Engineering, Hohai University, Changzhou 213022, China
*
Authors to whom correspondence should be addressed.
Toxics 2023, 11(1), 26; https://doi.org/10.3390/toxics11010026
Submission received: 27 November 2022 / Revised: 23 December 2022 / Accepted: 25 December 2022 / Published: 27 December 2022
(This article belongs to the Section Toxicity Reduction and Environmental Remediation)

Abstract

:
Using styrene as a proxy for VOCs, a new method was developed to remove styrene gas in nitrogen atmospheres. The effect on the styrene removal efficiency was explored by varying parameters within the continuum dynamic experimental setup, such as ferrous ion concentration, hydrogen peroxide concentration, and pH values. The by-products are quantized by a TOC analyzer. The optimal process conditions were hydrogen peroxide at 20 mmol/L, ferrous ions at 0.3 mmol/L and pH 3, resulting in an average styrene removal efficiency of 96.23%. In addition, in this study, we construct a BAS-BP neural network model with experimental data as a sample training set, which boosts the goodness-of-fit of the BP neural network and is able to tentatively predict styrene gas residuals for different front-end conditions.

1. Introduction

VOCs are the most toxic and react photochemically with airborne nitrogen oxides under light exposure to produce photochemical fumes that pose a hazard to human health and crop growth [1]. VOCs originate from a wide range of sources, including industrial production, automobile exhaust, and numerous others. The management of VOCs has received considerable attention in recent years [2,3].
China’s styrene industry has entered a period of rapid growth. It is the world’s fastest-growing country in styrene consumption and the world’s largest producer and consumer of styrene. Styrene gas is treated by combustion and activated carbon adsorption methods commonly used in industry [4,5,6]. Styrene needs to be stored in nitrogen-sealed tanks, and there is a high safety hazard if styrene gas is degraded by combustion in the tank area and increased economic costs if styrene gas is delivered to distant locations [7,8]; if the adsorption method is adopted to adsorb styrene gas, the internal structure of activated carbon will be clogged due to the self-polymerization effect of styrene, thereby reducing the adsorption efficiency and also the risk of autoignition [8]. Therefore, there is literature about different methods to degrade styrene gas, such as the biodegradation method and advanced oxidation method etc. [5,9]. Heitz et al. employed two nutritional forms of ammonia and nitrate to exclusively degrade styrene at low concentrations [5], and Kamila Koci et al., employed UV light combined with ozone/hydrogen peroxide to degrade 87% of styrene gas [9]. However, in the approach adopted by Kamila Koci et al., ozone was applied, and the scenario applied in this study was canned. In order to reduce the probability of a hazardous accident, this study will reduce the concentration of oxygen content during the reaction.
In this study, a novel UV/Fenton process for the degradation of styrene gas emitted from the breathing of a nitrogen-sealed tank size. In the laboratory, the high-purity nitrogen was used to blow off a washing cylinder containing styrene liquid. The concentration of the exhaust gas is controlled by changing the volume of styrene in the wash cylinder, and then the nitrogen flow containing styrene is introduced into the reaction for oxidation, i.e., the degradation of styrene with an elevated concentration (2000 mg/m3) by the UV/Fenton method was carried out under the nitrogen atmosphere. This technique used Fe2+ as the catalyst to decompose H2O2 to produce (•OH) [10], where the addition of ultraviolet light (UV) decreased the amount of Fe2+ and reduced the generation of iron sludge [11]. The Fenton reaction principle is as follows:
H 2 O 2 + Fe 2 + OH + OH + Fe 3 +
Fe 3 + + H 2 O 2 Fe 2 + + H + + HOO
Fe 3 + OH 2 +   hv   Fe 2 + + OH
The application of Fenton technology in the wastewater field has been more mature [12], but there are few studies on the treatment of VOC gasses by UV/Fenton technology, and no relevant literature on styrene degradation using UV/Fenton under nitrogen atmosphere has been found at present. Yoshinori Kawase et al. used UV/Fenton technology to degrade toluene gas and provided a promising path for the treatment of the volatile organic matter in waste gasses [10]. Lu í s M. Madeira et al. employed the Fenton process for up to 18 h degradation of toluene exhaust gas, which also removes by-products in the liquid phase while removing toluene in the gas stream [13]. Xiaolian Hu et al. compared the effect of Fenton’s reagent on COD in waste leachate with or without UV light irradiation and proved that the effect of UV/Fenton was stronger than that of Fenton [14]. In this study, a nitrogen gas stream containing styrene gas was formulated by blowing styrene with elevated purity nitrogen gas and bubbling in the liquid through the continuous air intake to study the effect of the UV/Fenton technique on styrene degradation under a nitrogen atmosphere. This study examined the effects of H2O2 concentration, Fe2+ concentration, pH and the optimal conditions [10]. Moreover, the possible degenerate products were analyzed. Finally, the obtained experimental data are taken as the sample set, and the BP neural network is improved by using the Longniushu algorithm to establish the BAS-BP neural network for the analysis of styrene gas degradation under different front conditions [15]. The BAS-BP optimization speed is higher than that of the BP neural network. The BP neural network was proposed by Rumelhard and McCleiand in 1986. It is a classical multilayer forward neural network. It consists mainly of two processes: forward propagation of the signal and backward propagation of the error. The forward propagating signal is processed by the neurons and then transmitted to the output layer. If the predicted value does not satisfy the accuracy requirement, the error is propagated. In this process, the error is assigned to each neuron, and the weights and thresholds are adjusted along the direction of the fastest downward adjustment of the error function until the output accuracy meets the requirements. Compared to the traditional machine learning (ML) algorithms, the BP neural networks have strong nonlinear mapping capabilities and are highly self-learning and adaptive. The Artificial Neural Network (ANN) used by Regina et al. trained the ML model to predict the ZnO optical band gap from experimental time and temperature conditions [16]. The best ML models they obtained were KRR and RR with quadratic features. The performance of these models is comparable to that of the effective mass models, and they generalize well to other datasets, thus preventing the effect of insufficient datasets on the simulation results. However, the training set of these models only includes two variables: time and temperature. The variables in this study are time, H2O2, Fe2+ and pH, and the accuracy of the model may not be guaranteed using traditional (ML) methods. This requires models to have a wider learning ability. In addition, the initial weight of traditional methods is randomly assigned, which may lead to the loss of model robustness, thus affecting the accuracy of the model. Therefore, we use BAS-BP models to find the weight corresponding to the global minimum of the loss function and update it iteratively on this basis. The BAS-BP neural network model in this study can judge the concentration of hydrogen peroxide in the solution from the simulation results as a judgment of the timing of the RE addition of hydrogen peroxide. It is also able to provide for the possibility of instrument failure inside the device when the actual results differ considerably from the simulated ones, with a view to providing a fresh pathway for the degradation of waste gas from the canning area.

2. Materials and Methods

2.1. Chemicals

In this experiment, styrene (99.5%), ferrous sulfate (FeSO4·7H2O), potassium permanganate (0.01 mol/L) and sulfuric acid (98%) were all from McLean. Hydrogen peroxide (30% w/v) comes from Longda Chemical.

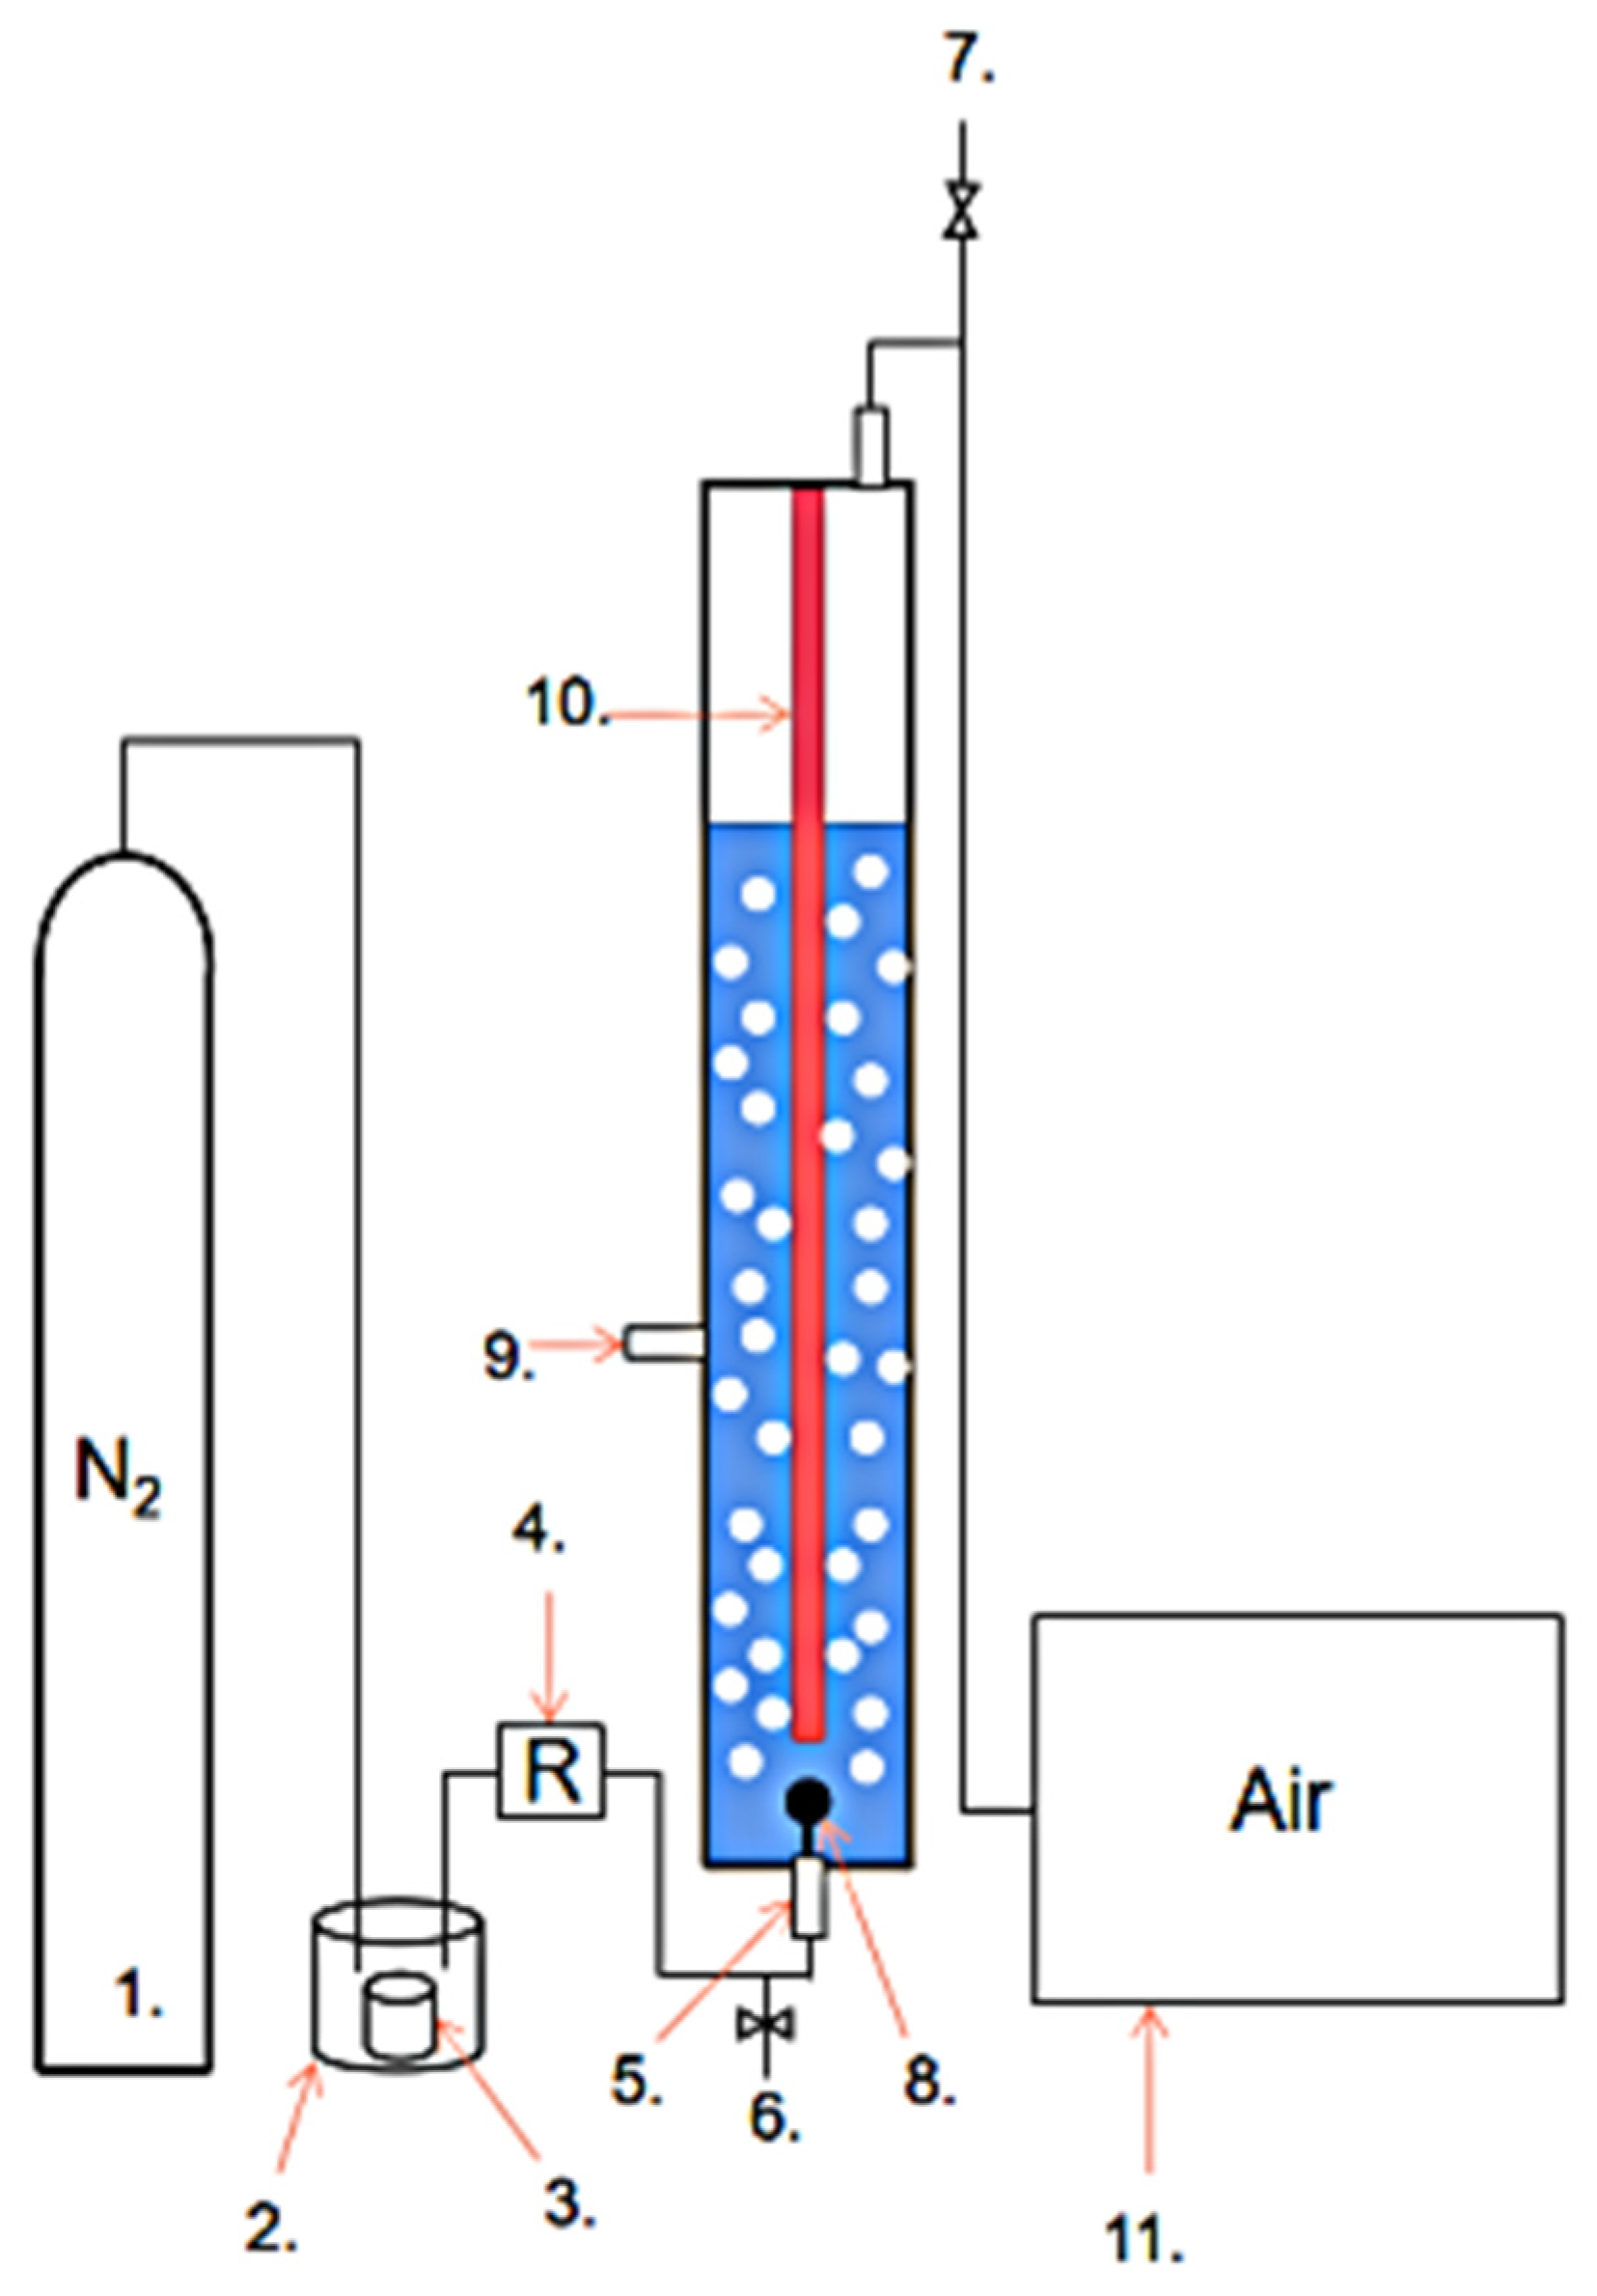
2.2. Experimental Procedures

The experimental setup flow is shown in Figure 1. and elevated-purity nitrogen gas purged the styrene through a gas cylinder [17]. The concentration of styrene is adjusted by the height of the liquid level in the inner vessel of the wash cylinder. The reactor intake front is equipped with a gas flow meter, which is continuously supplied by varying the pressure of the nitrogen cylinder to control the gas flow rate at 3 L/min. The reactor was 1.4 m in height with an inner diameter of 10 cm and was made of quartz glass, which was equipped inside with a diving UV lamp of 40 W with one calyx [14]. The gas is continuously fed into the interior of the reactor through aerated stones.

2.3. Experimental Conditions

The control gas flow rate was kept constant at 3 L/min, the volume of solution in the reactor was 6 L, and the UV light intensity was 40 W. We explored the effect of different initial pH values (3.0, 5.0, 7.0), Fe2+ concentrations (0, 0.1, 0.3, 0.6 mmol/L), H2O2 concentrations (0, 10, 20, 30 mmol/L) on the degradation of styrene (2000 mg/L) gas [18]. In order to reduce experimental errors, two sets of parallel trials were performed at the same level for each influence factor. Due to the elevated contaminant concentration in this study, the experiment was terminated when the solution efficiency for styrene removal decreased to 50%.

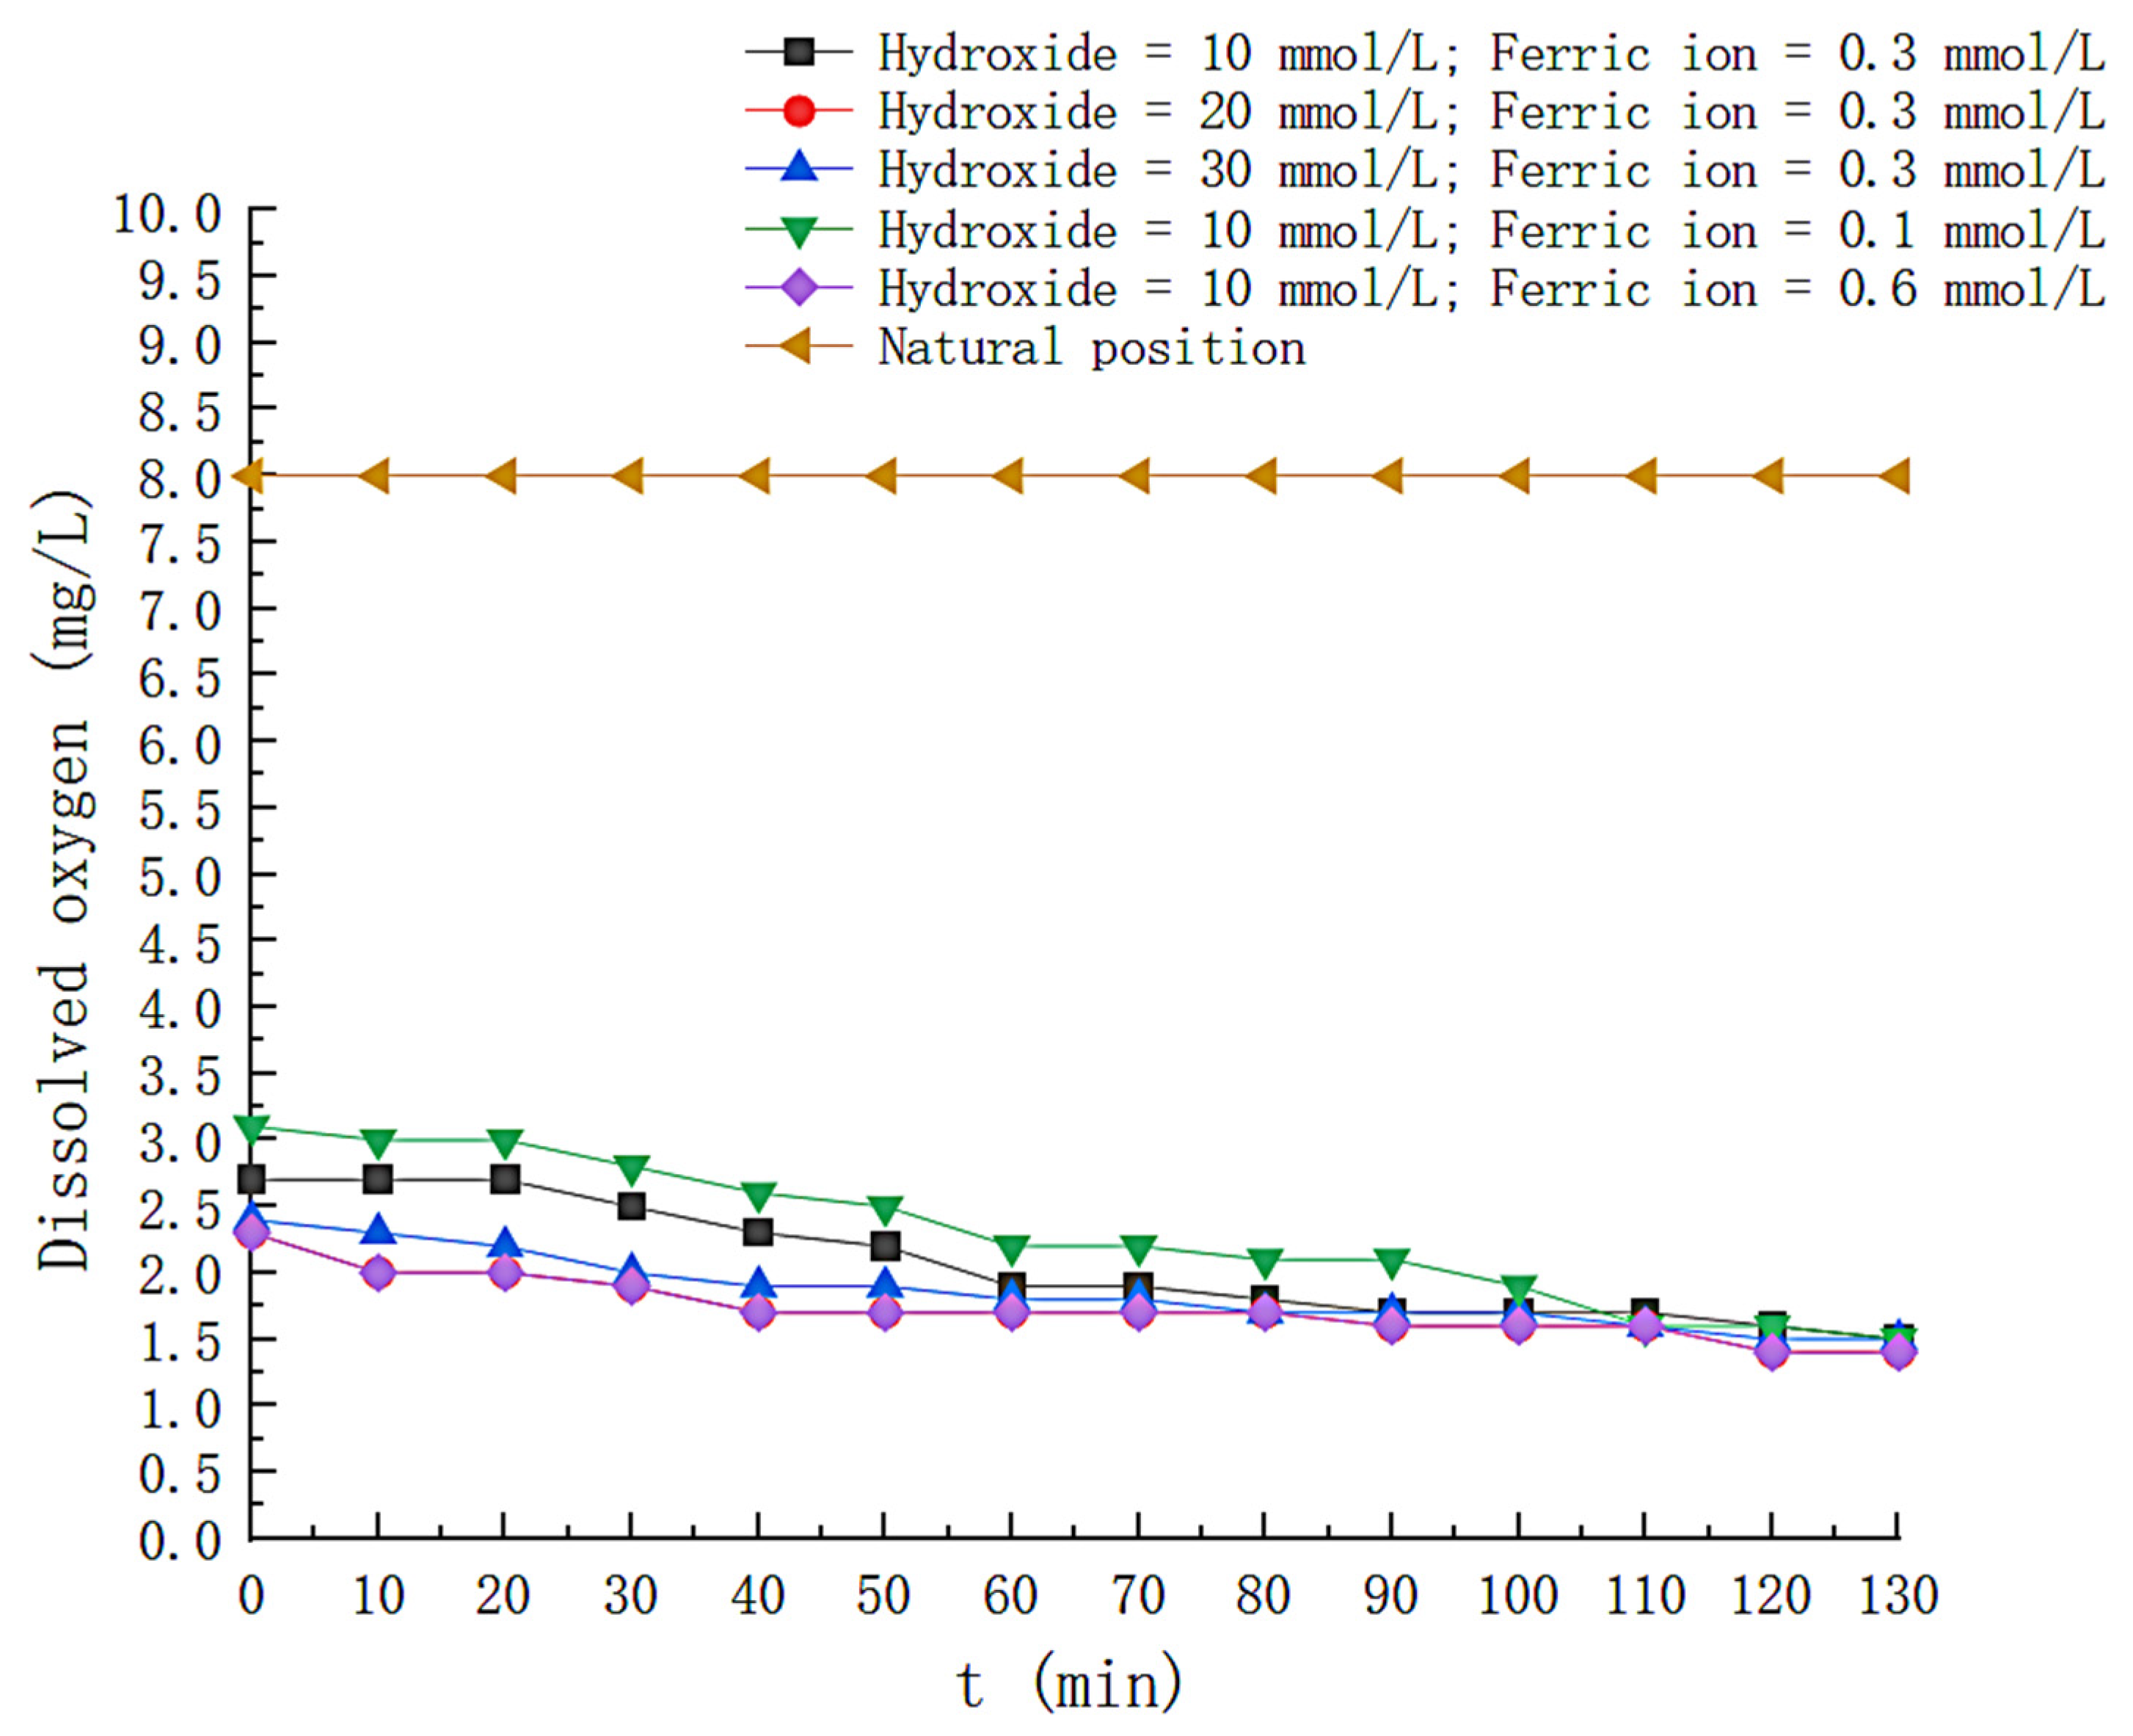
2.4. Detection of DIOXYGEN Concentration

The hydrogen peroxide concentration was determined by potassium permanganate titration. A 25 mL sample of H2O2 was pipetted, placed in a conical flask, and 5 mL H2SO4 at a concentration of 3 mol/L was added, and the solution was titrated to light pink color with a standard titration solution of C (1/5 KMnO4) = 0.01 mol/L KMnO4, keeping it nonfading for 30 s.
The hydrogen peroxide concentration was calculated as follows:
C H 2 O 2 = C 1 × V × 5 ÷ 2 25 = V
Where—the concentration (0.5 mol/L) of C (1/5 KMnO4), V—the volume (ML) used for the titration
C H 2 O 2 —hydrogen peroxide concentration (mmol/L)

2.5. Determination of Styrene Concentration (Determination of Treatment Efficiency)

Styrene concentrations before and after the reaction were determined using an East–West analytical GC-4000A meteorological chromatograph with a column box temperature of 90 °C, an injection port temperature of 150 °C, a detector temperature of 150 °C, a carrier gas of nitrogen, and an injection volume of 1 ml. It was obtained from a shift calculation of the xylene concentration in the gas phase before and after the reaction, i.e.,:
η = [ 1 C o u t / C i n ] × 100 %
In Formula η for xylene removal rate, C i n and C o u t are the concentration of xylene in the inlet and outlet gases, mg/m3, respectively.

2.6. Determination of Liquid Phase By-Products TOC

The determination of total organic carbon was performed by combustion catalytic oxidation method at 680 °C with combustion oven temperature up to 700 °C. Experimental instruments included the use of a Tsushima TOC-V analyzer.

2.7. Characterization of Liquid Phase By-Products

Liquid by-products were measured with the Shimadzu GCMS-QP2020NX GC-MS/MS instrument. The splitless injection was used with a total flow of 30 mL/min, column flow of 1.08 mL/min, purge volume of 5.0 mL/min, and injection of 1 μL.

3. Results and Discussion

3.1. Determination of Optimal System

In order to explore the efficiency of styrene removal by different systems in nitrogen atmospheres, the time-dependent variation of styrene removal efficiency was examined for UV, Fe, H2O2, UV + H2O2, Fenton, and UV+Fenton conditions, respectively. The time-dependent profiles of the styrene gas removal efficiency for different conditions are shown in Figure 2. It can be seen that when only H2O, UV, Fe2+ and H2O2 are available, the styrene removal rate is the highest at the initial stage of the reaction and then decreases rapidly with time. The removal efficiency almost vanishes at around 60 min, suggesting that styrene is not yet degraded in the above system, and the reason for its removal is attributed to the adsorption of styrene gas by the liquid phase. The maximum removal efficiency of styrene gas by simple Fenton solution is 67%, which decreases to 17.5% at 50 min. The effect was not obvious because sufficient (•OH) for styrene degradation could not be generated under the condition of lower Fe2+ concentration. H2O2 can remove up to 86.6% styrene gas under the irradiation of UV light, and 40% styrene can still be removed at 130th min, because UV light could decompose H2O2 in tiny amounts, but the lack of catalyst in the solution led to the slow decomposition of hydrogen peroxide, and the degradation of styrene did not achieve the desired effect. Finally, the UV/Fenton system was employed to degrade styrene, and the solution exhibited an average removal efficiency of more than 90% for styrene within 70 min from the beginning of the reaction because the addition of UV light promoted the conversion between Fe2+ and Fe2+ and then increased the generation rate of (•OH) [10]. In summary, the UV/Fenton system shows the most significant effect on the degradation of styrene gas in nitrogen atmospheres, so the optimal operating parameters based on this system will be investigated.

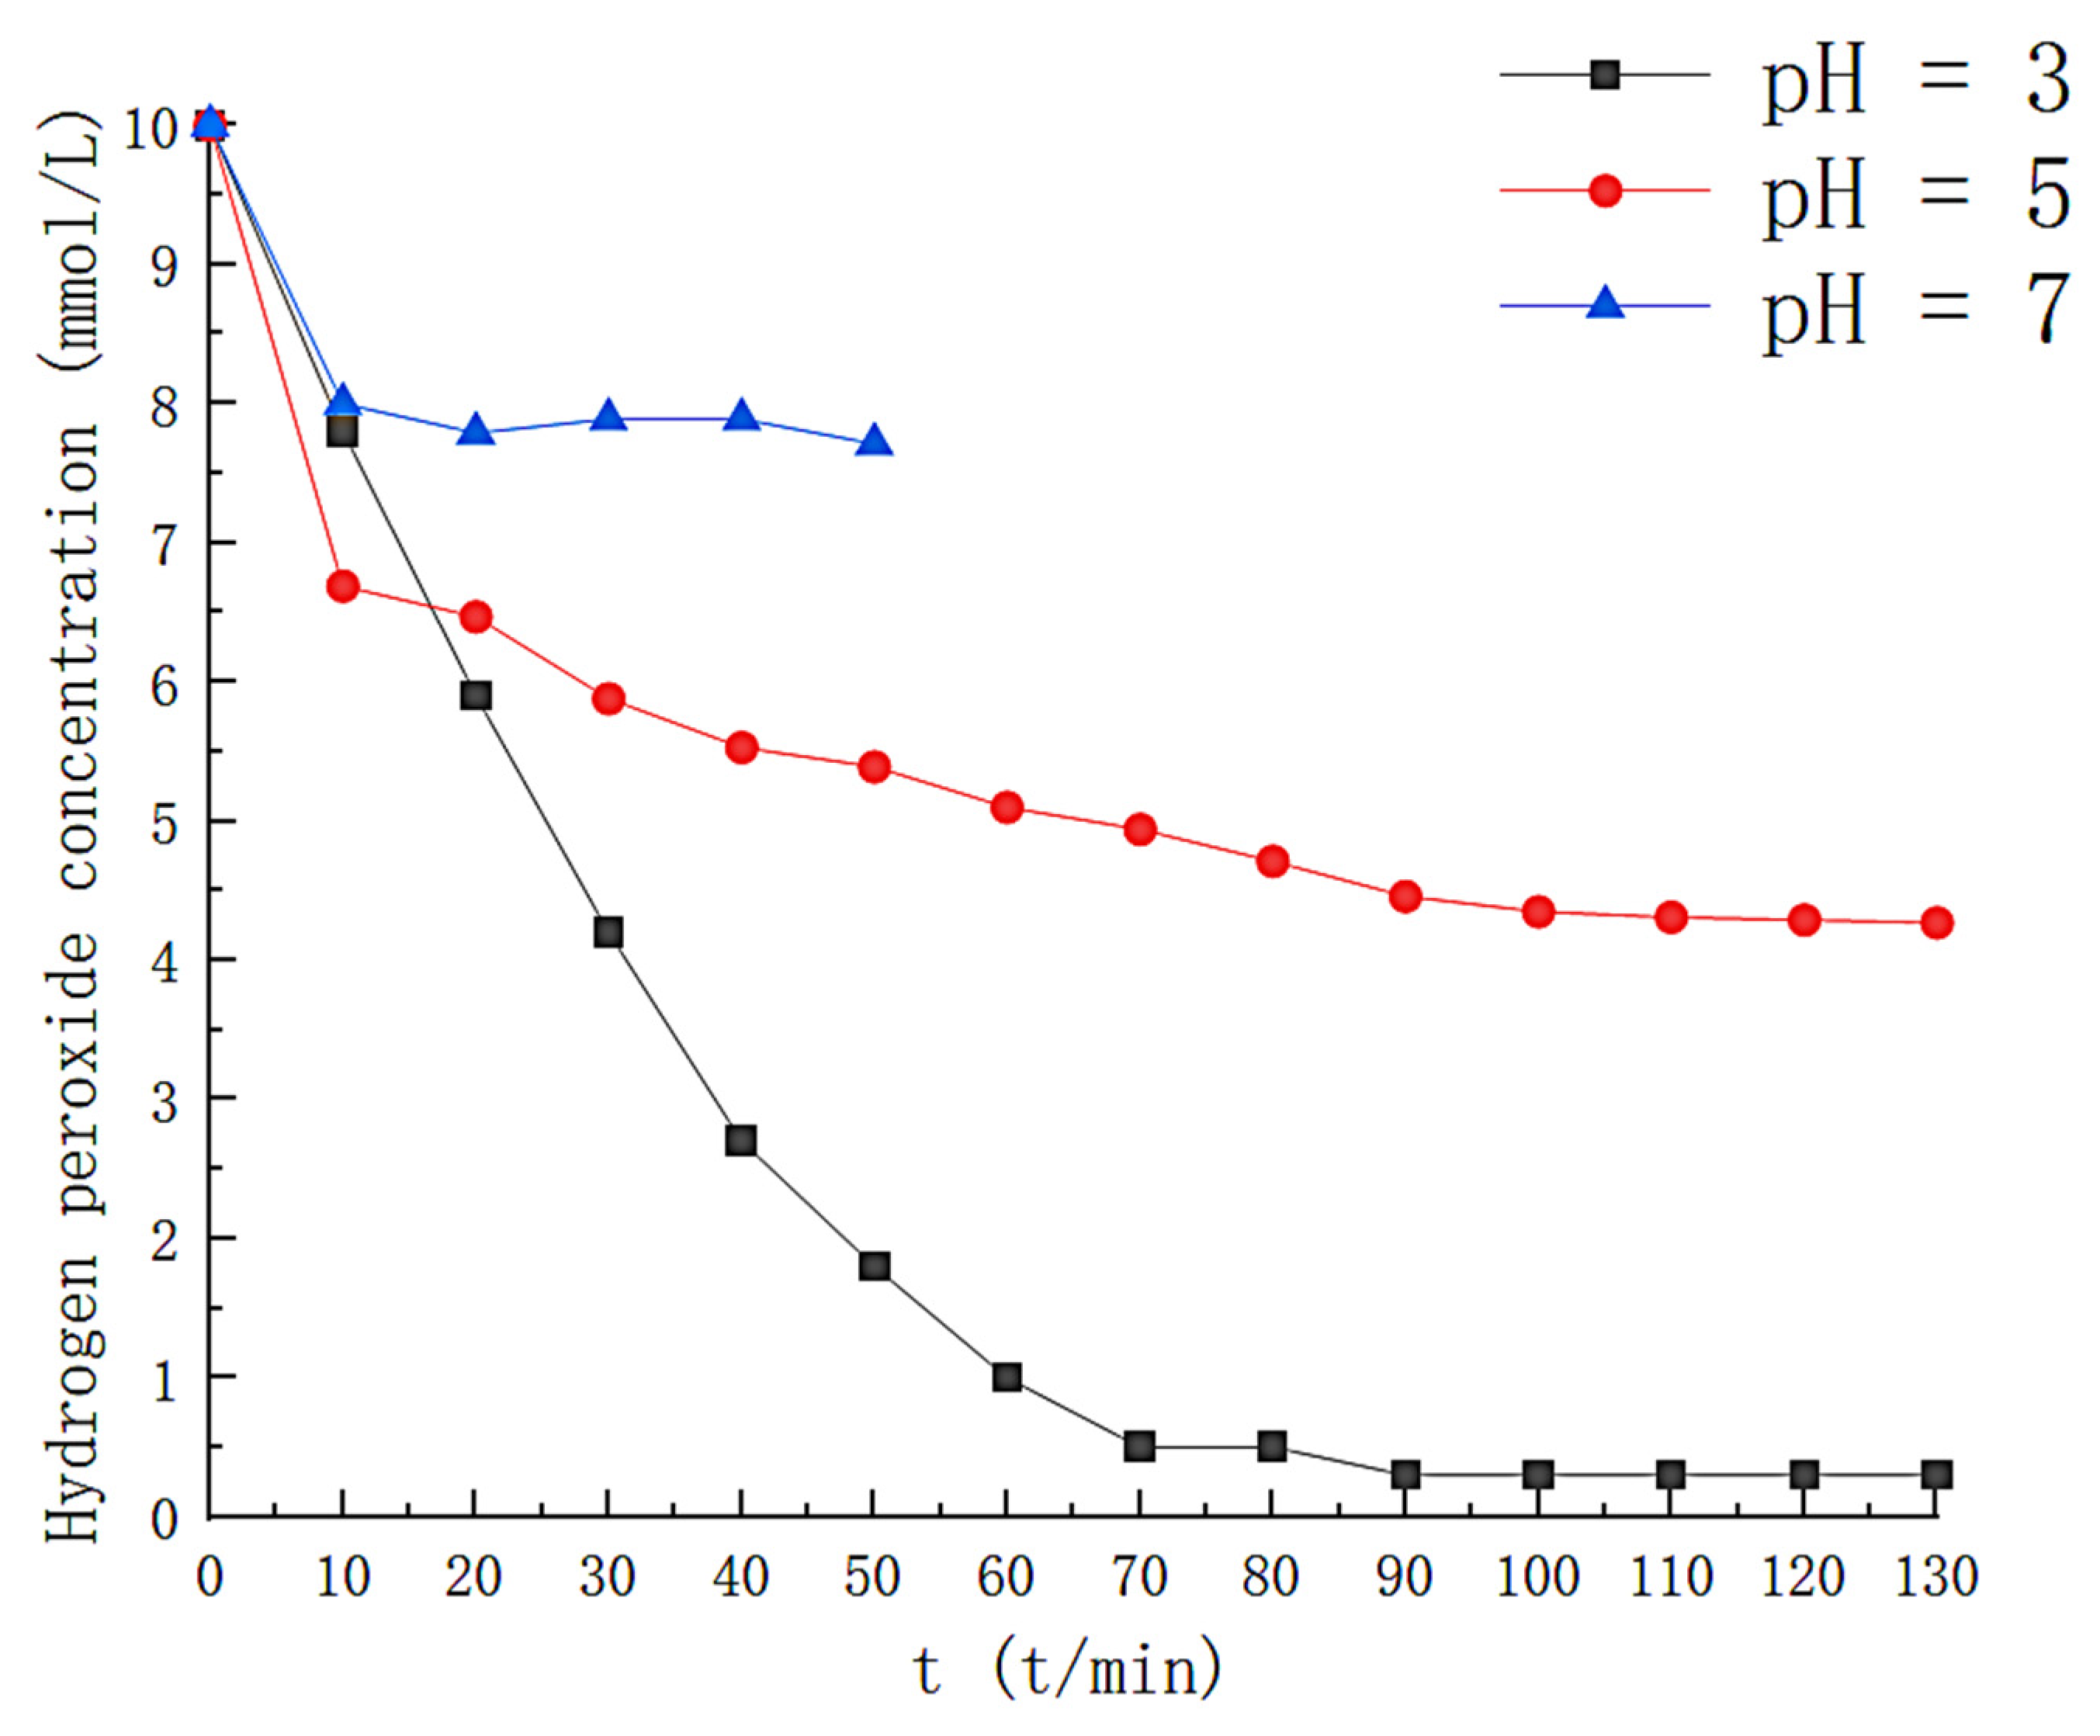
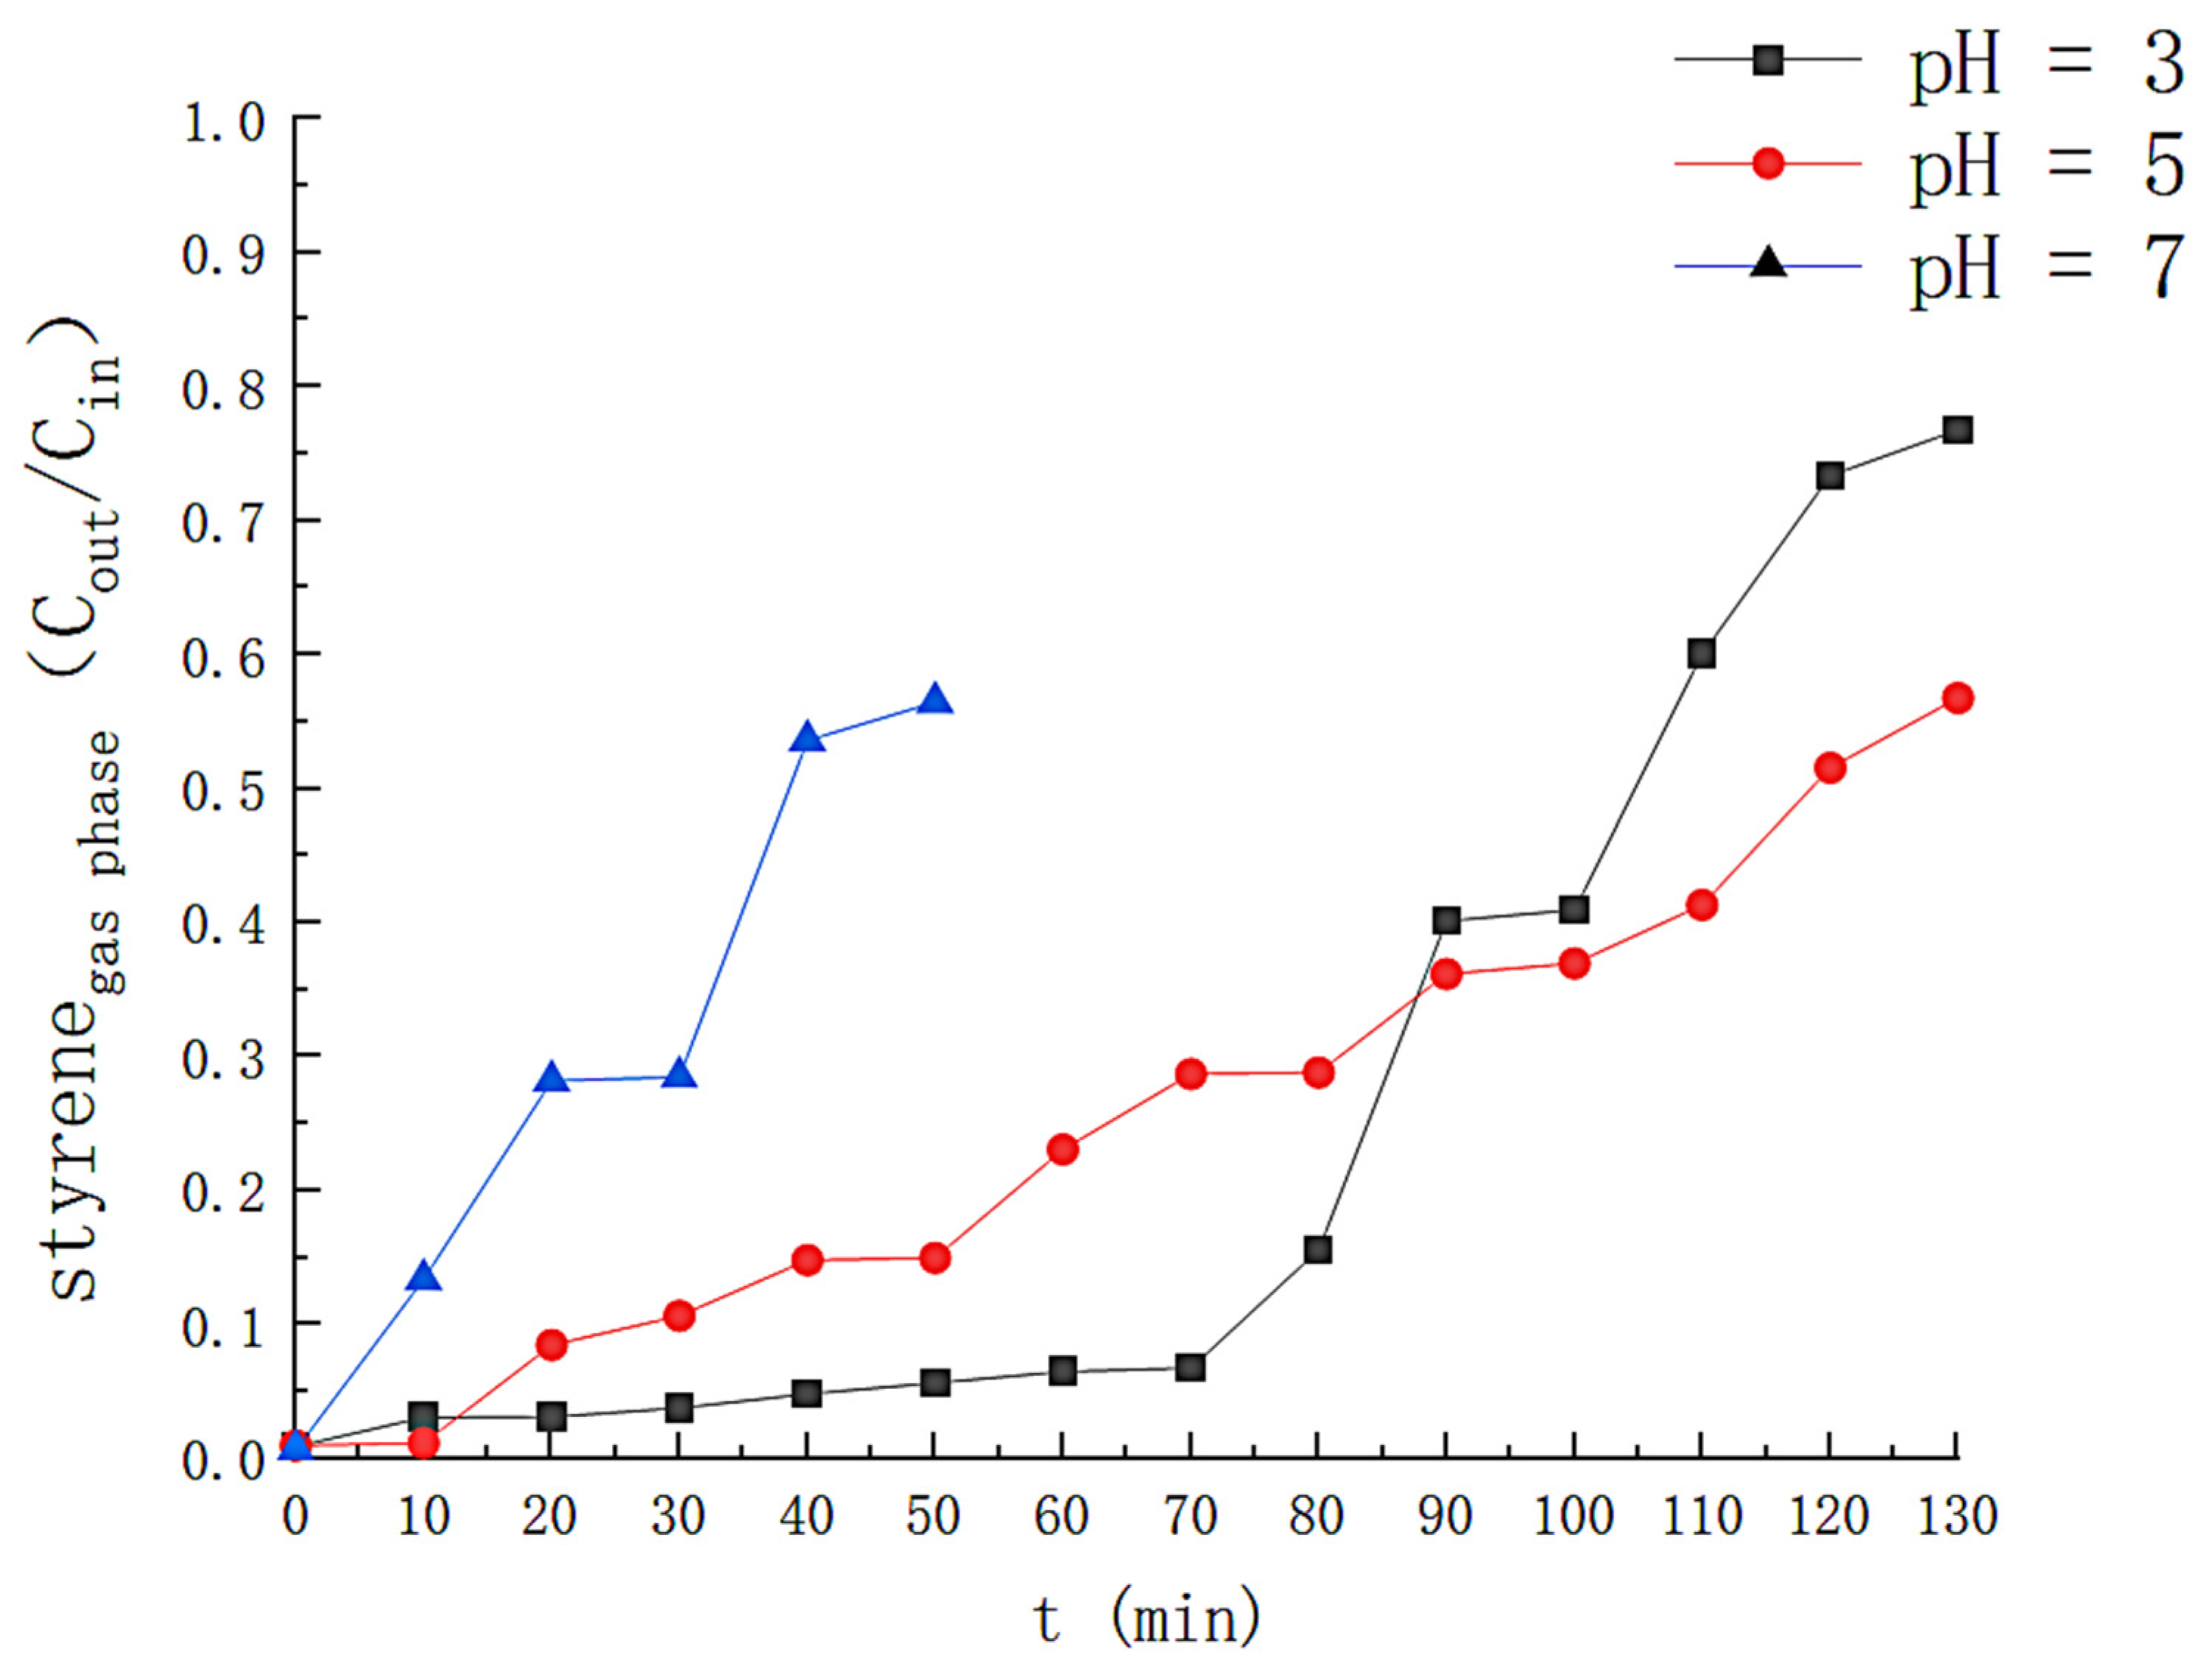
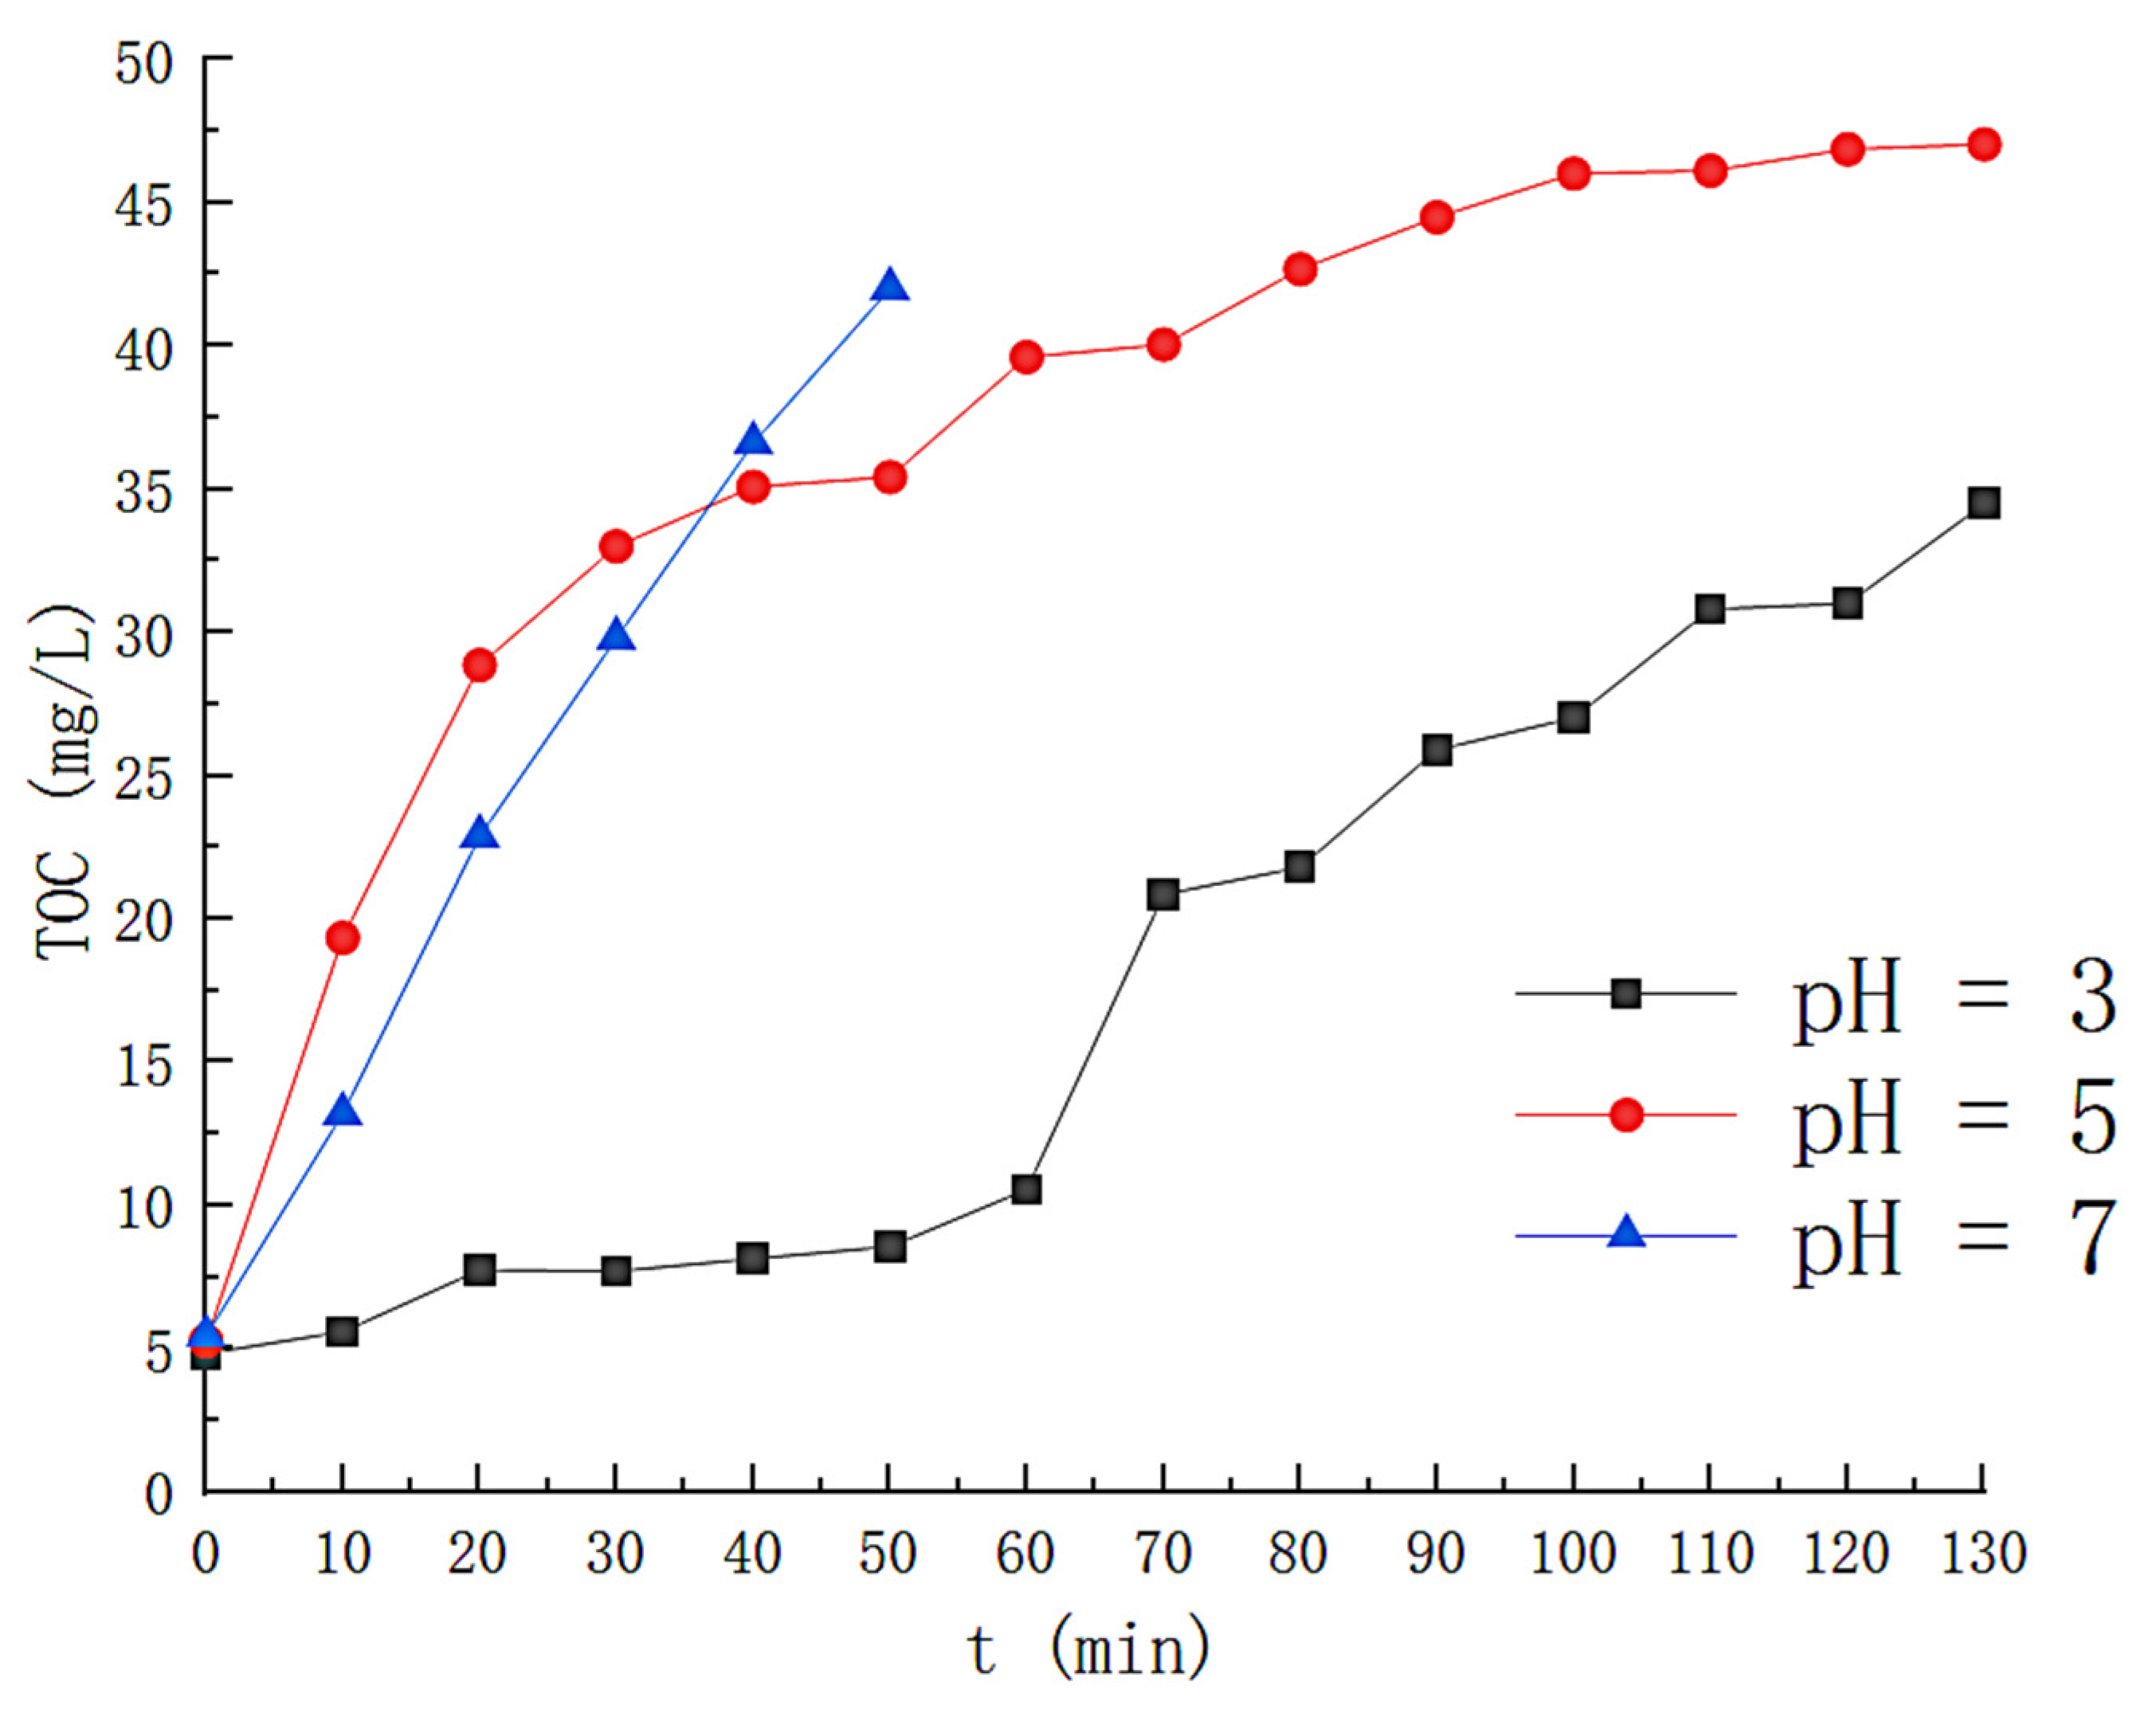
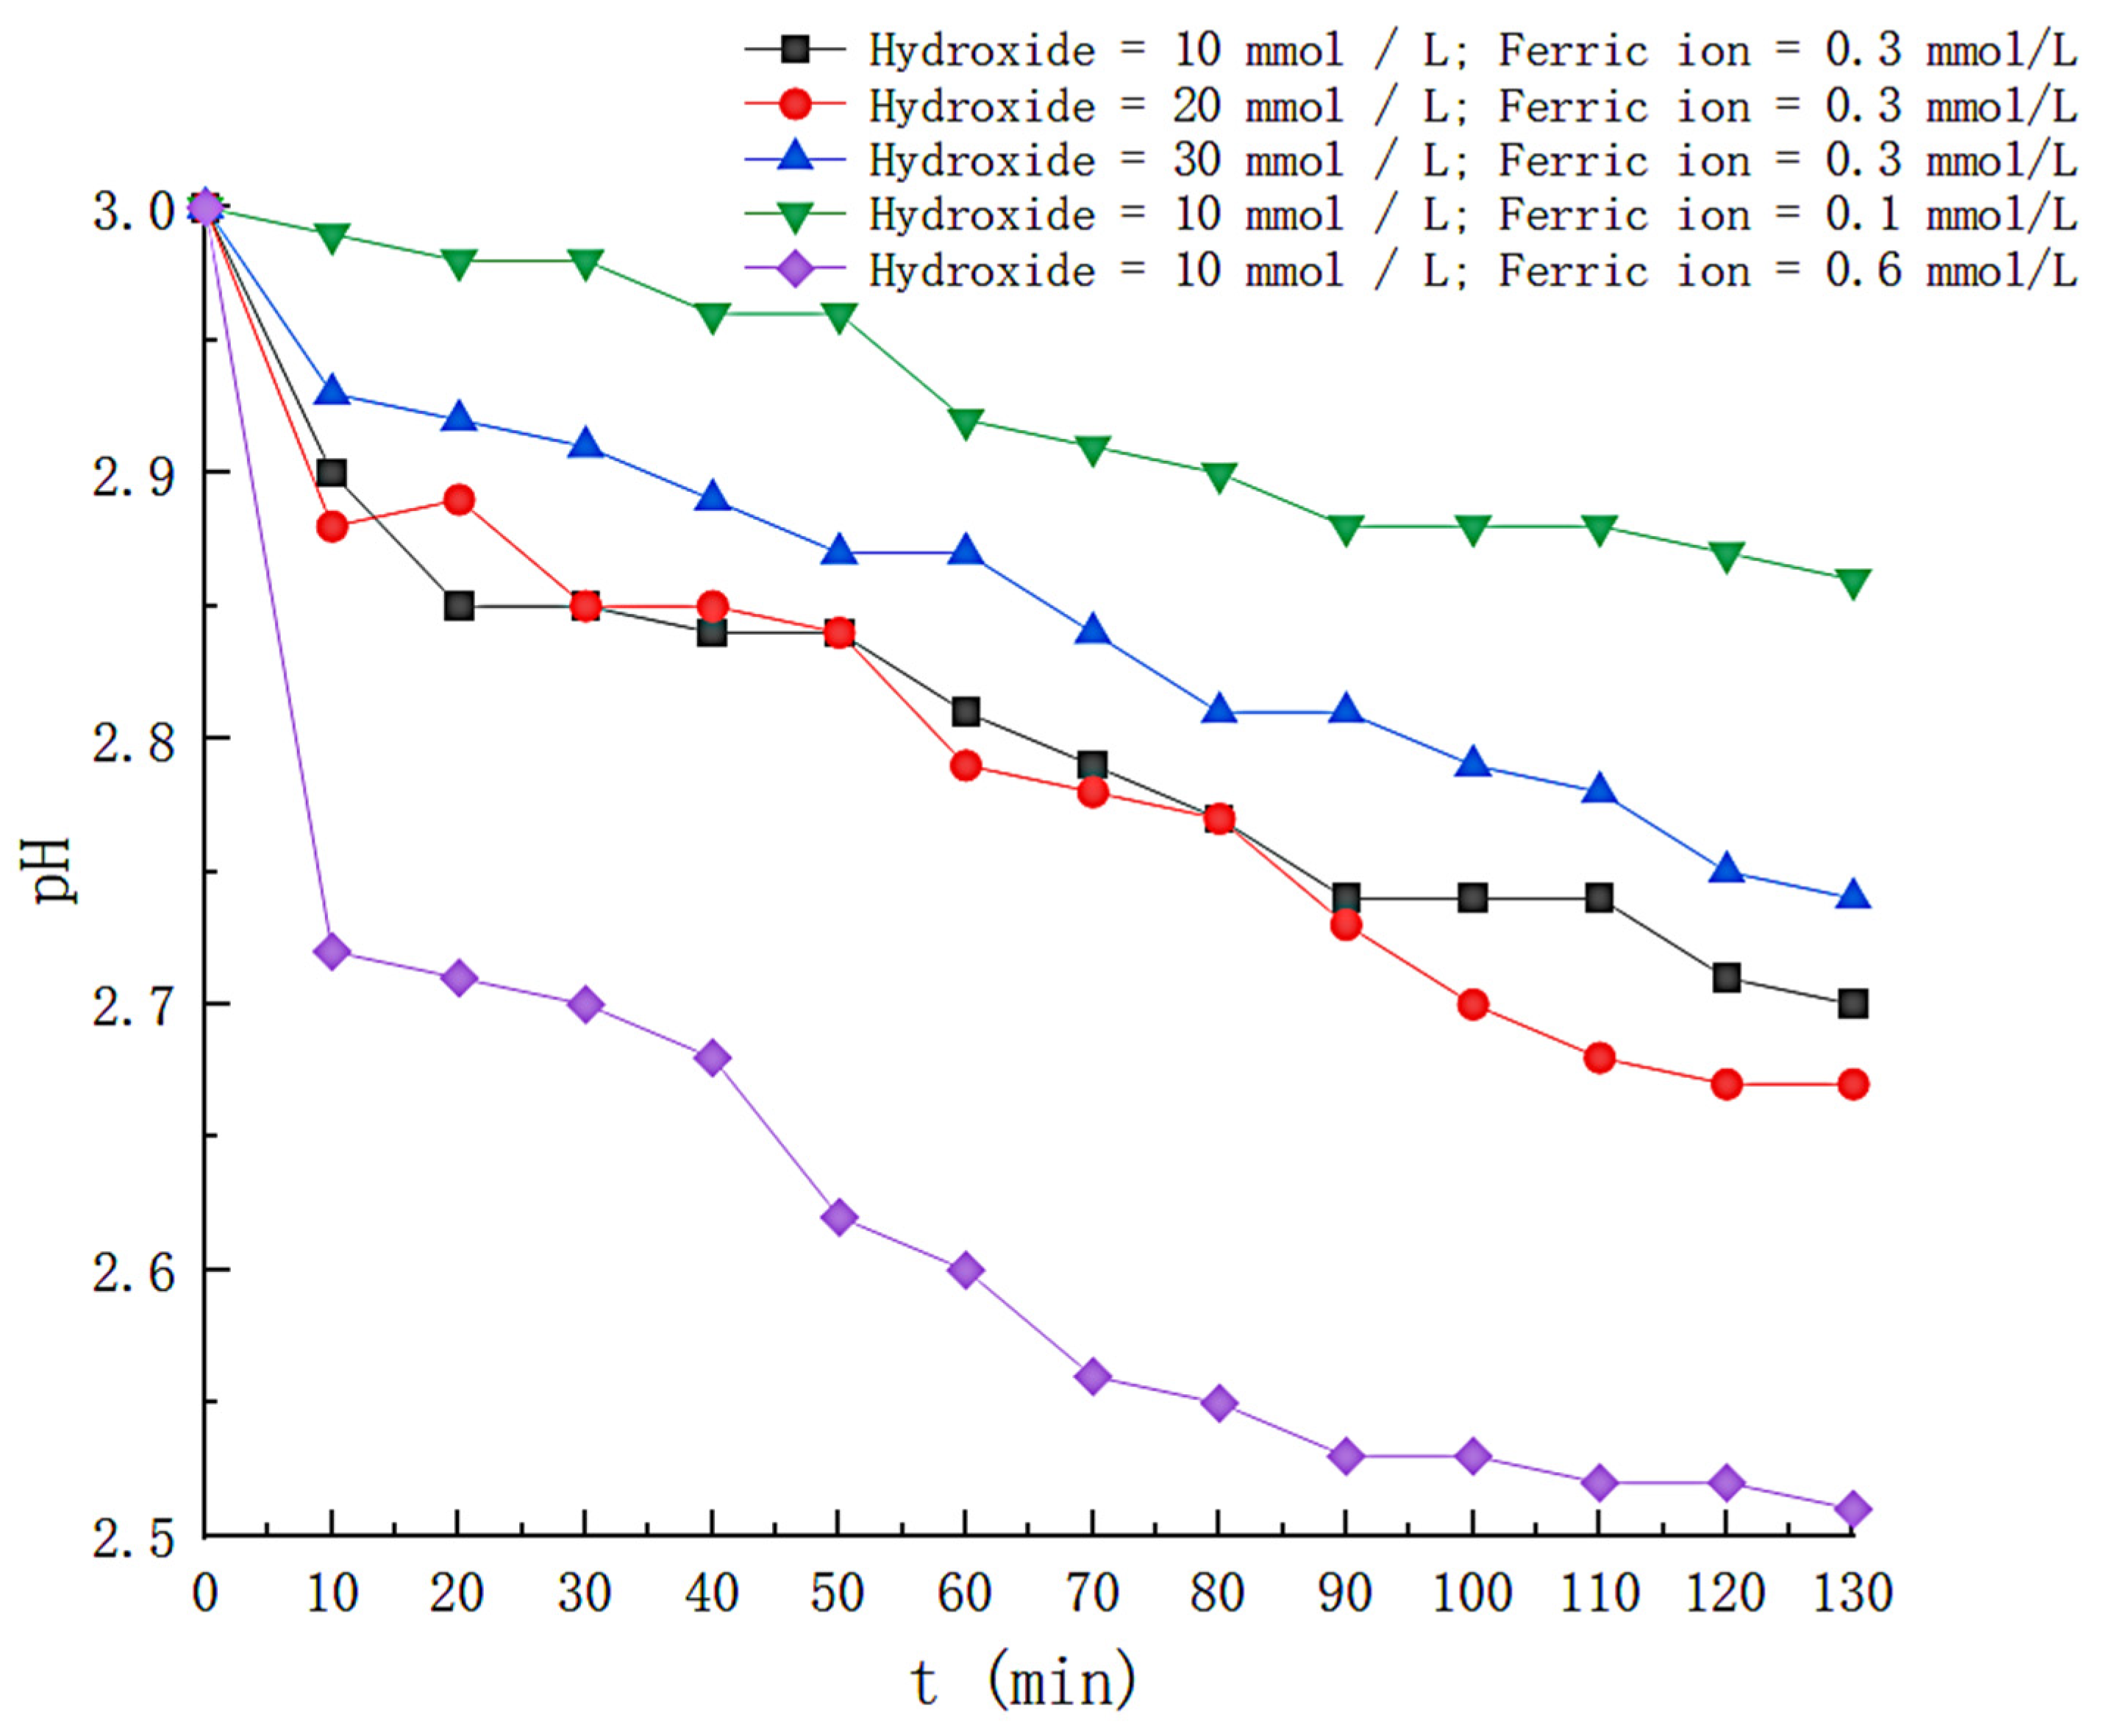
3.2. Effect of Initial Solution pH on the Degradation of Styrene Gas by the Photo-Fenton Reaction

The solution pH can control the state of Fe2+ in solution and control hence the rate of hydroxyl radical production. The effect of pH on the results was tested under the following operating conditions: H2O2 = 10 mmol/L; Fe2+ = 0.3 mmol/L; UV = 40 W; gas flow rate = 3 L/min, and the solution volume = 6 L. The initial pH values were 3.0, 5.0, and 7.0, respectively (natural conditions).
The effect of pH on H2O2 is shown in Figure 3, where at pH = 3.0, about 95% of H2O2 is consumed within 130 min, indicating elevated hydroxyl radical production in the solution. At pH values of 5.0 and 7.0, the maximum consumption of H2O2 was 57% and 23%, respectively, at times when the removal efficiency was higher than 50%. This is because the rise in pH increases the concentration of OH in the solution, which is unfavorable for the redox between Fe2+ and Fe3+, reducing the decomposition of H2O2. Figure 4 reflects the effect of pH on styrene degradation. For a pH of 3.0, the styrene removal efficiency is above 90% for the first 75 min and above 50% for 100 min; at a pH of 5.0, the styrene removal efficiency is higher than 90% in the first 20 minutes; at pH 7, the degradation effect of the solution on the styrene gas is significantly reduced, and the removal efficiency drops below 50% in about 35 min. At the same time, we also monitored the generation of intermediate products during the degradation process, and the results are shown in Figure 5. At pH 3.0, the TOC concentration in the solution rose slowly to 22.45 mg/L at 140 min after the reaction was initiated; at pH 5.0, the TOC concentration in the solution was 48.87 at the 120th min of the reaction, and at pH 7.0, the TOC concentration in the solution was 42.01. This is because the precipitation of iron with increasing pH was generated in the form of Fe[OH]3. The hydroxyl radicals that can participate in the degradation in the solution are reduced. Reducing the efficiency of styrene gas removal also increases TOC generation. Therefore, the optimal initial pH should be controlled at around 3.

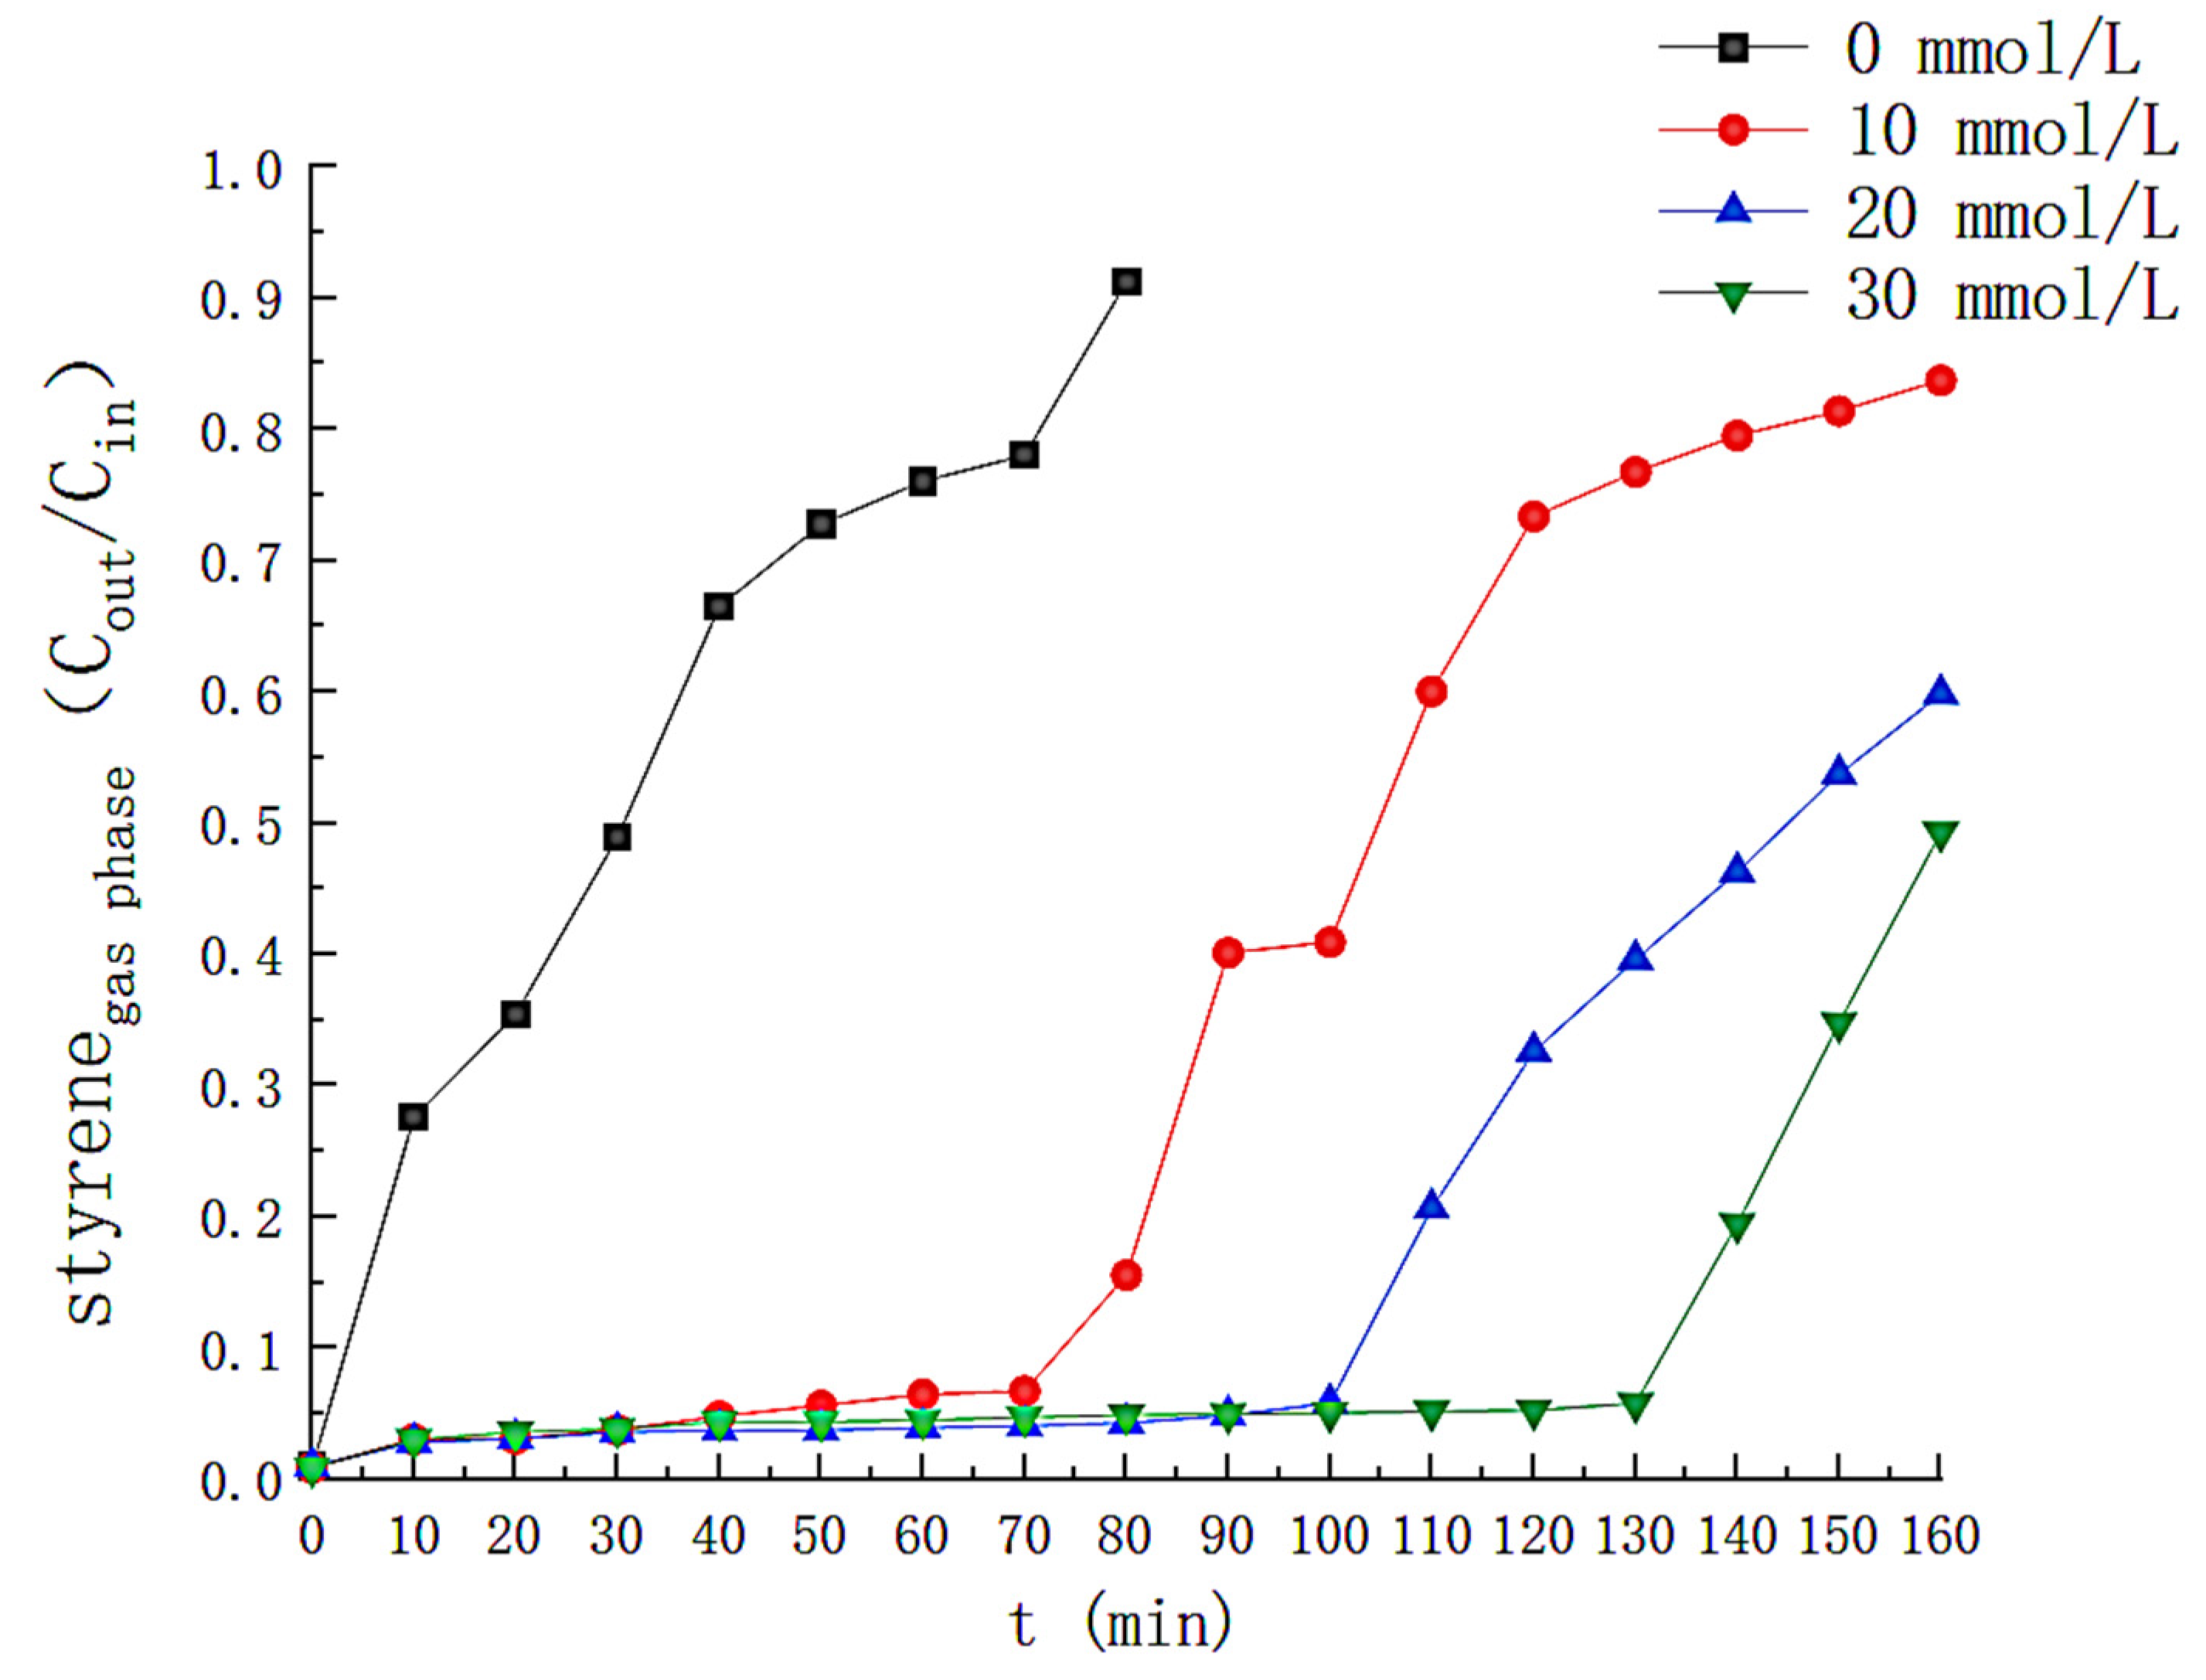
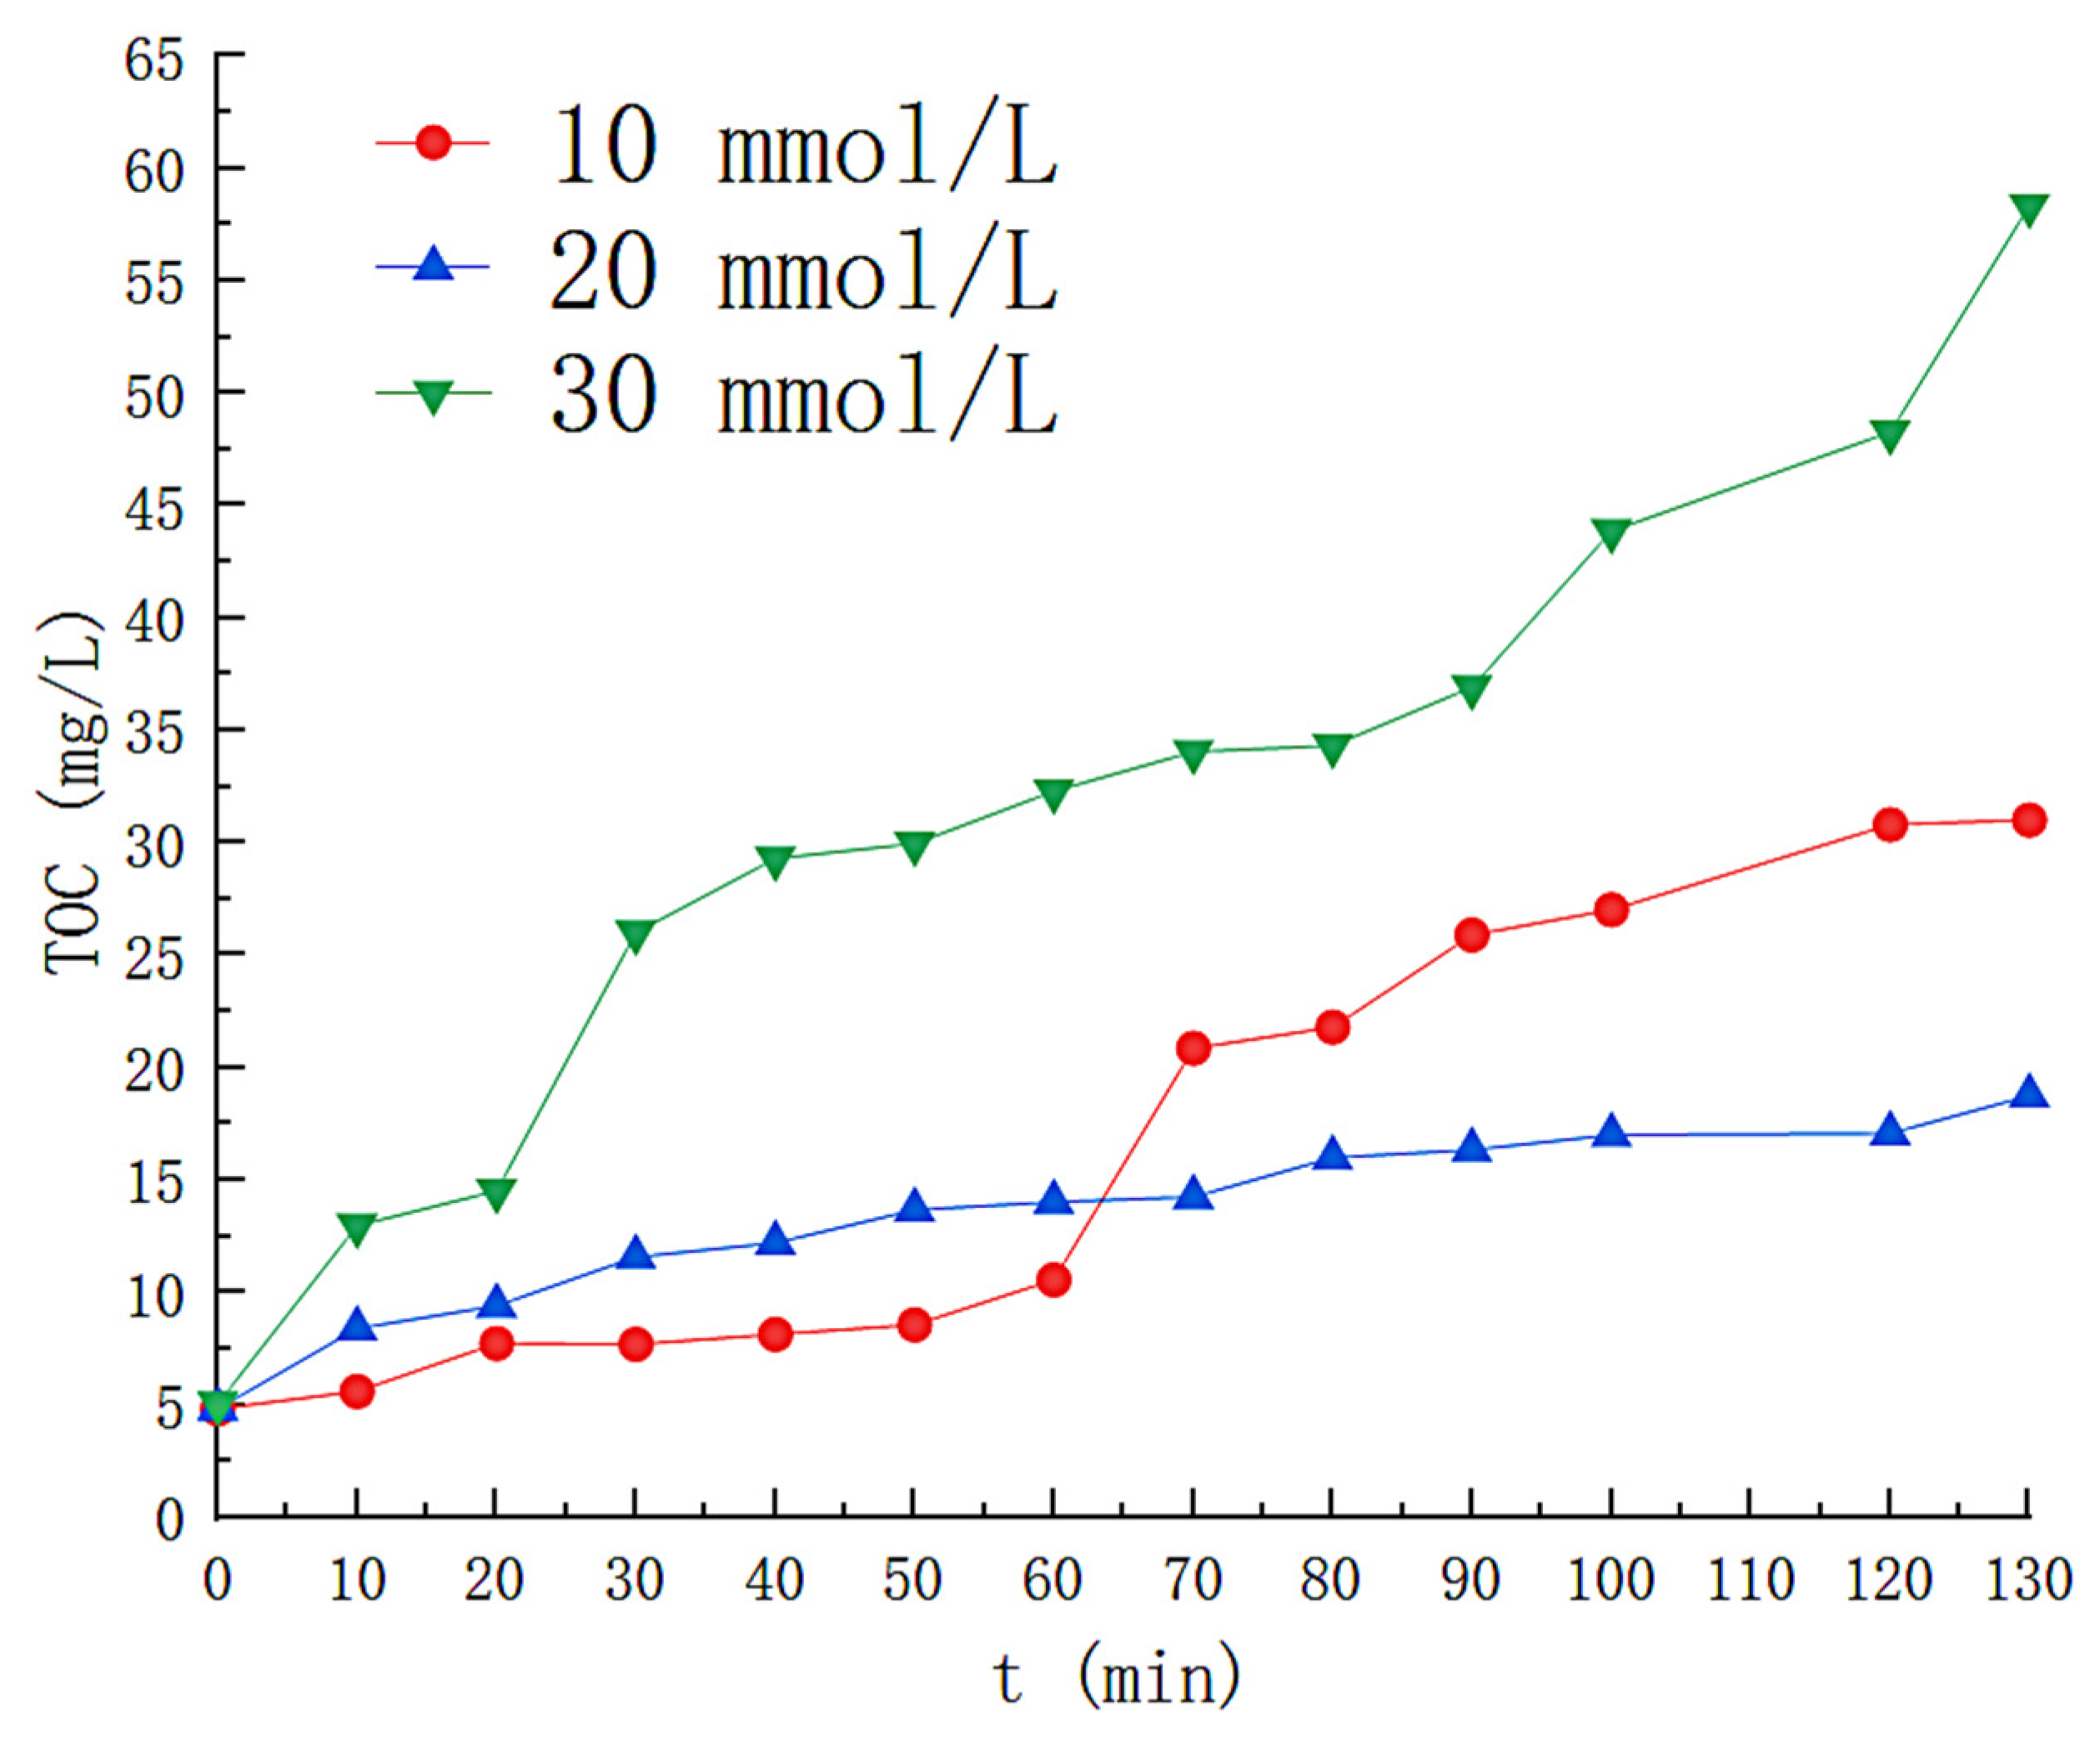
3.3. Effect of Fe2 + Concentration on Styrene Degradation

The iron ions act as catalysts in the Fenton reaction, and the concentration of Fe2+ in the solution is varied by adjusting the concentration of iron salts from 0 to 0.6 mmol /L. The additional operating conditions were as follows: H2O2 = 10 mmol/L; pH = 3; UV = 40 W, and Gas flow rate = 3 L/min; solution volume = 6 L.
The effect of Fe2+ concentration on H2O2 is shown in Figure 6. The hydrogen peroxide consumption was slower without the addition of Fe2+, i.e., only a slight decomposition of H2O2 in the solution could not be quickly generated (•OH). The H2O2 in the solution failed to be fully consumed at Fe2+ concentrations of 0.1 mmol/L and at Fe2+ concentrations of 0.3 mmol/L and 0.6 mmol/L, respectively, with no significant difference in the rate of H2O2 consumption. The effect of Fe2+ concentration on the removal efficiency is shown in Figure 7, where the removal efficiency of styrene gas by solution increases with increasing Fe2+ concentration until Fe2+ concentration increases to 0.3 mmol/L. When the Fe2+ concentration was 0.3 mmol/L, the removal efficiency of styrene gas was above 90% in the first 74 min. The H2O2 concentration in the solution decreased rapidly during this period (shown in Figure 6), and H2O2 was nearly entirely consumed (about 95%) at the 70th min. After that, the Fe2+ concentration increased again, and the styrene removal efficiency did not alter significantly. After the 70th minute, because of the low concentration of hydrogen peroxide in the solution, Fe2+ could not continue to catalyze H2O2 production (•OH), resulting in a rapid decline in removal efficiency.
Under the front-end condition of Fe2+ concentration of 0.1 mmol/L, the efficiency of styrene removal by solution drops below 90% at the 20th min. The solution removed styrene with less than 40% efficiency when the reaction lasted for 110 min. This is because the catalyst concentration is not sufficient to fully decompose H2O2 under these conditions, thus reducing the removal efficiency. Figure 8 reflects the variation in the concentration of solution by-products. The lowest TOC concentration was produced in solution at a concentration of 0.3 milligrams per liter of Fe2+, which increased to 34.49 milligrams per liter when the reaction was continued for 130 min. The highest concentration of solution by-products was obtained at a Fe2+ concentration of 0.6 mmol/L, and the TOC concentration in the solution was as high as 70.41 mg/L as the reaction continued until 120 min. This is because the increase of Fe2+ promoted the generation of iron organic compounds. A large number of free radicals could not be produced to mineralize the reaction by-products when the concentration of Fe2+ was 0.1 mmol/L. Therefore, Fe2+ = 0.3 mmol/L is the best operating condition.

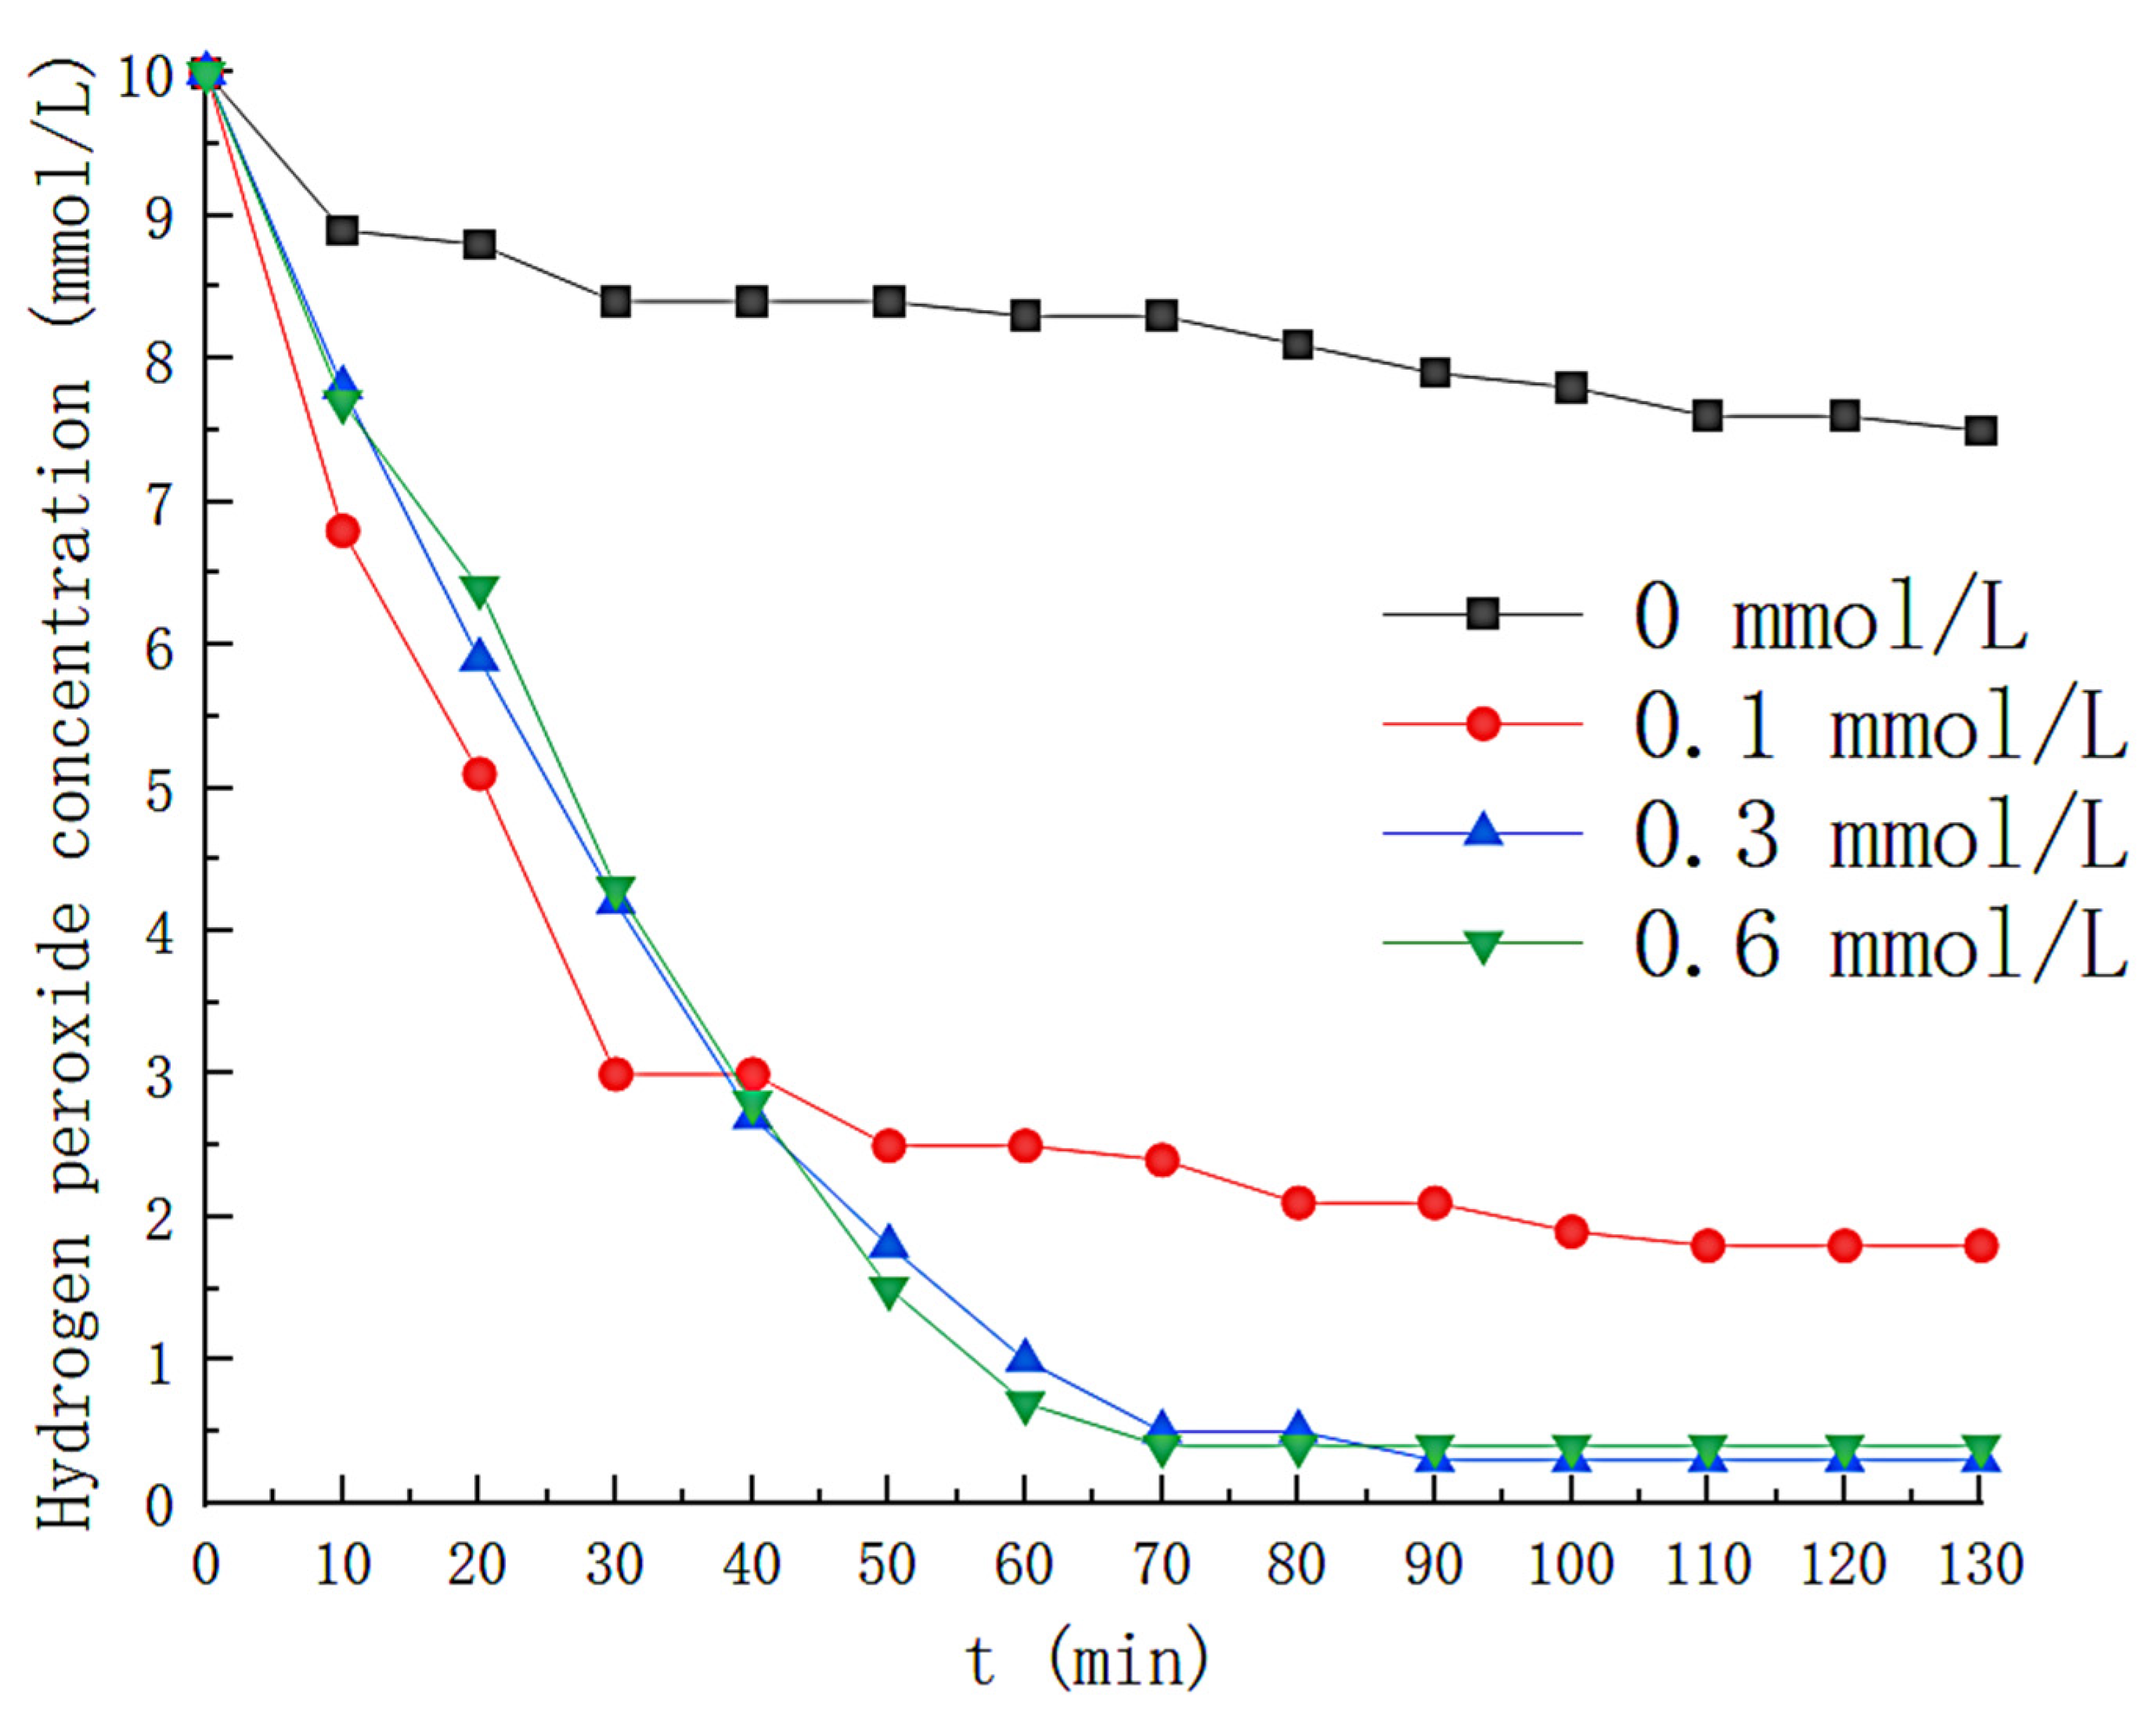
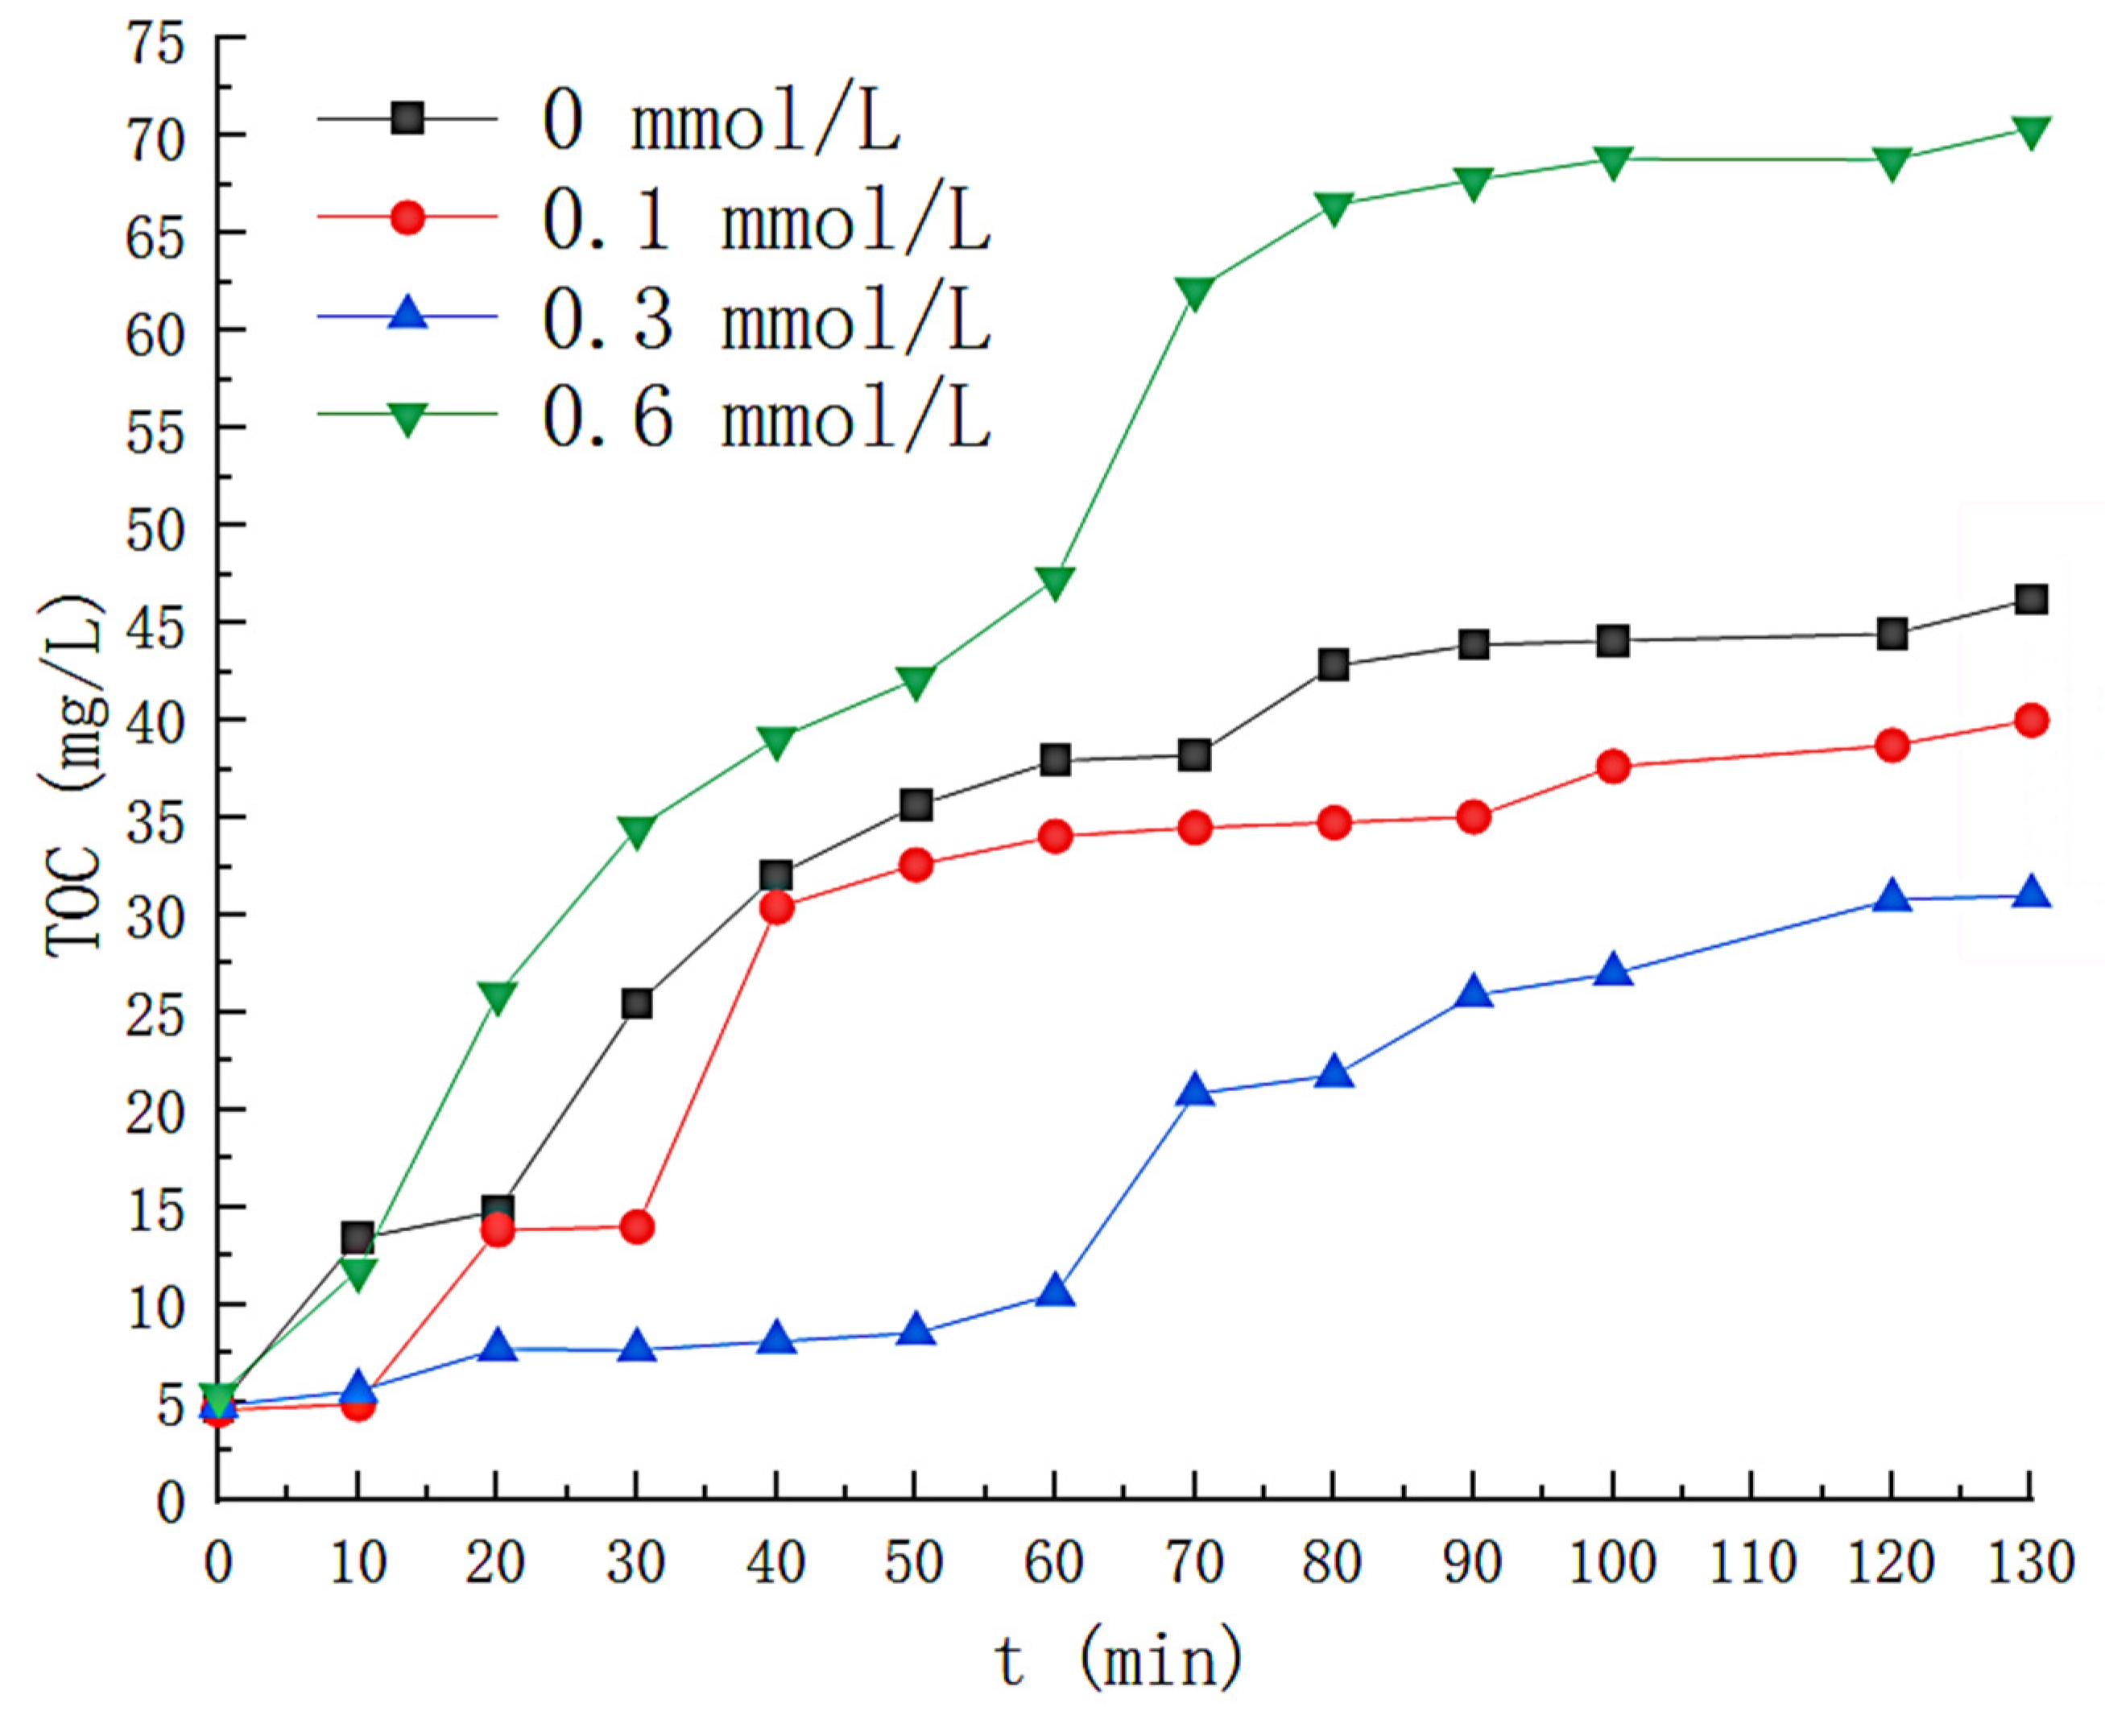
3.4. Effect of Hydrogen Peroxide Concentration

Additional operating parameters were determined as follows: Fe2+ = 0.3 mmol/L; PH = 3; UV = 40 W, and gas flow rate = 3 L/min. The solution volume = 6 L. Hydrogen peroxide varies from 0 to 30 mmol/L. H2O2 is a source of (•OH), so H2O2 concentration affects (•OH) generation [11]. The variation of the H2O2 concentration with time is shown in Figure 9, where the concentration of H2O2 in the solution decreases rapidly for the first 70 min when the H2O2 concentration is 10 mmol/L, after which the H2O2 is almost entirely consumed(close to 0 mmol/L at 100th min). When the H2O2 concentration increased to 30 mmol/L, the time that the liquid phase contained H2O2 increased to 130 min. The effect of the H2O2 concentration on the styrene effect of the solution is illustrated in Figure 10. With H2O2 at concentration 0, the outgassing styrene content increases rapidly to near the front-end level. As the concentration of H2O2 increases, we find that it has a minor effect on the optimal removal efficiency but prolongs the removal time for styrene. When H2O2 was 10 mmol/L, the styrene removed by the solution remained above 90% for the first 75 min from the beginning of the reaction. The removal efficiency decreased rapidly thereafter, dropping to 14% at 160 min. When the H2O2 concentration was 20 mmol/L, the average styrene removal efficiency reached up to 96.2% within 105 min after the reaction started, and the outlet gas styrene concentration began to increase significantly at about 105 min and finally decreased below 50% at about 140th min. As the H2O2 concentration is increased to 30 mmol/L, its average removal efficiency for styrene is as high as 95.7% within 130 min. Figure 9 and Figure 10 reflect the effect of H2O2 in the UV/Fenton system, with the degradation effect rapidly decreasing as H2O2 is fully depleted. The variation in the concentration of the by-products in the solution is shown in Figure 11. The TOC content in the solution was the highest at the H2O2 concentration of 30 mmol/L and as high as 88.79 mg/L at 130 min. When the concentration of the H2O2 was 10 mmol/L, the first 60 min TOC content was less than that of the solution with the H2O2 concentration of 20 mmol/L, but thereafter the TOC content in the solution with the H2O2 concentration of 20 mmol/L grew slowly. The final H2O2 concentration of 20 mmol/L solution showed a TOC of 22.45 mg/L at 140th min, less than 34.49 mg/L of 10 mmol/L. The efficiency of removal of styrene gas by different concentrations of H2O2 in this study is less varied. The effective removal time of the solution for styrene (removal efficiency greater than 90%) was not exponentially prolonged as the H2O2 exponentially increased. An H2O2 concentration of 20 mmol/L was chosen as the optimal concentration for photo-Fenton degradation of styrene gas by H2O2 in a nitrogen atmosphere, taking into account industrial economic benefits and by-product production.

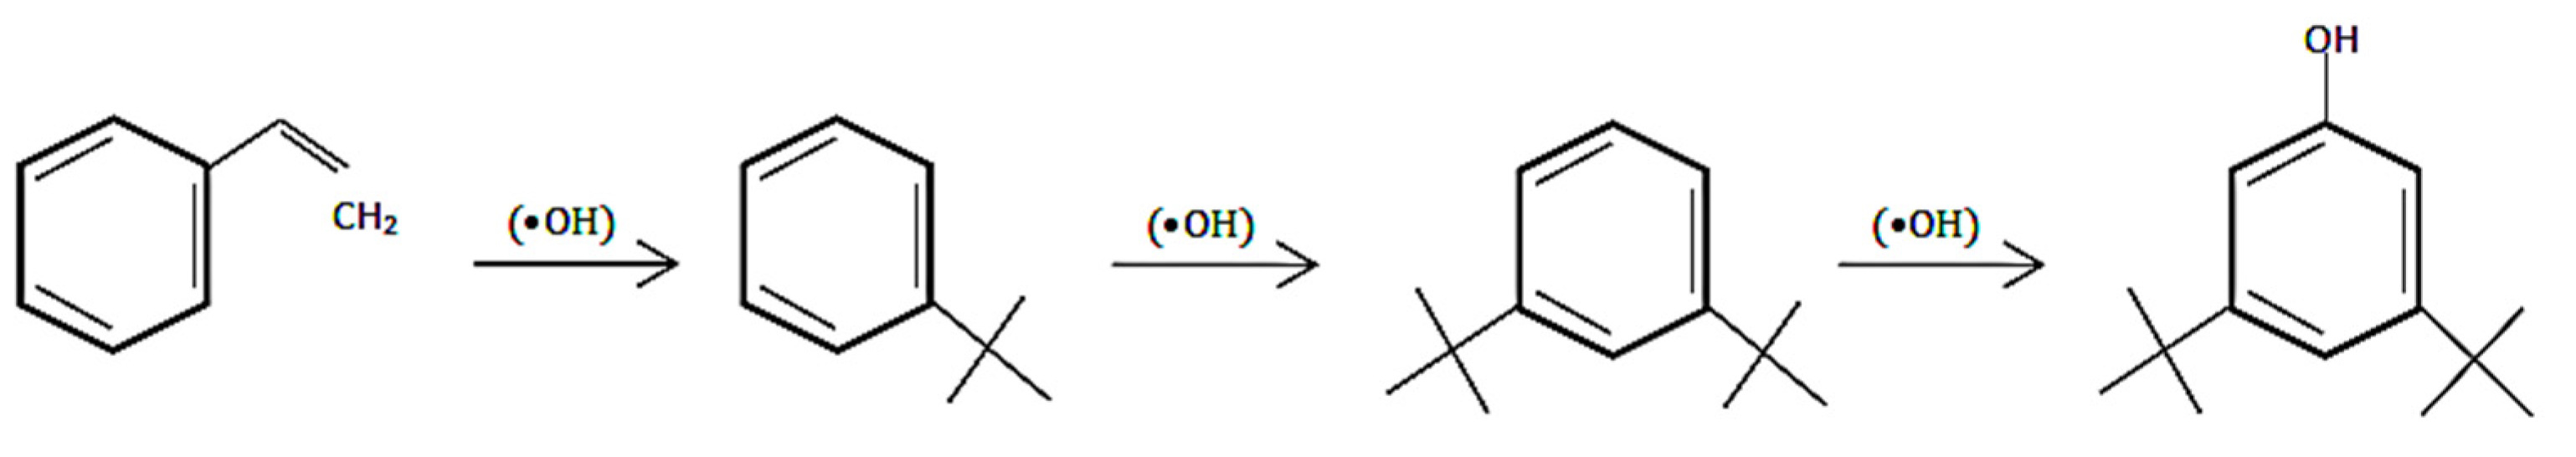
4. Mechanistic Analysis

The shift of the pH value during the experiment is monitored, as shown in Figure 12. The pH values of the solutions under different conditions all show a decreasing trend with time. Luis M. Madeira et al. mentioned in the literature that this is because some organic acids (maleic acid, pyruvic acid and oxalic acid) are contained in the reaction by-products [19]. In order to distinguish nitrogen gas bubbling from air bubbling, the time-dependent shift of the dissolved oxygen content in the solution was recorded, and the results are shown in Figure 13. Nitrogen as a carrier gas decreases the concentration of oxygen in the solution, and the concentration of dissolved oxygen during the experiment was floating at 2.0 mg/L, considerably less than 9 mg/L in normal water.
Qualitative analysis of the final liquid phase by-products was carried out by gas chromatography-mass spectrometry. It was observed that there were many carbon long-chain organics in the liquid phase, among which 3,5-di-tert-butylphenol was the most abundant. The reaction mechanism of styrene forming by-products under the action of (•OH) is shown in Figure 14.

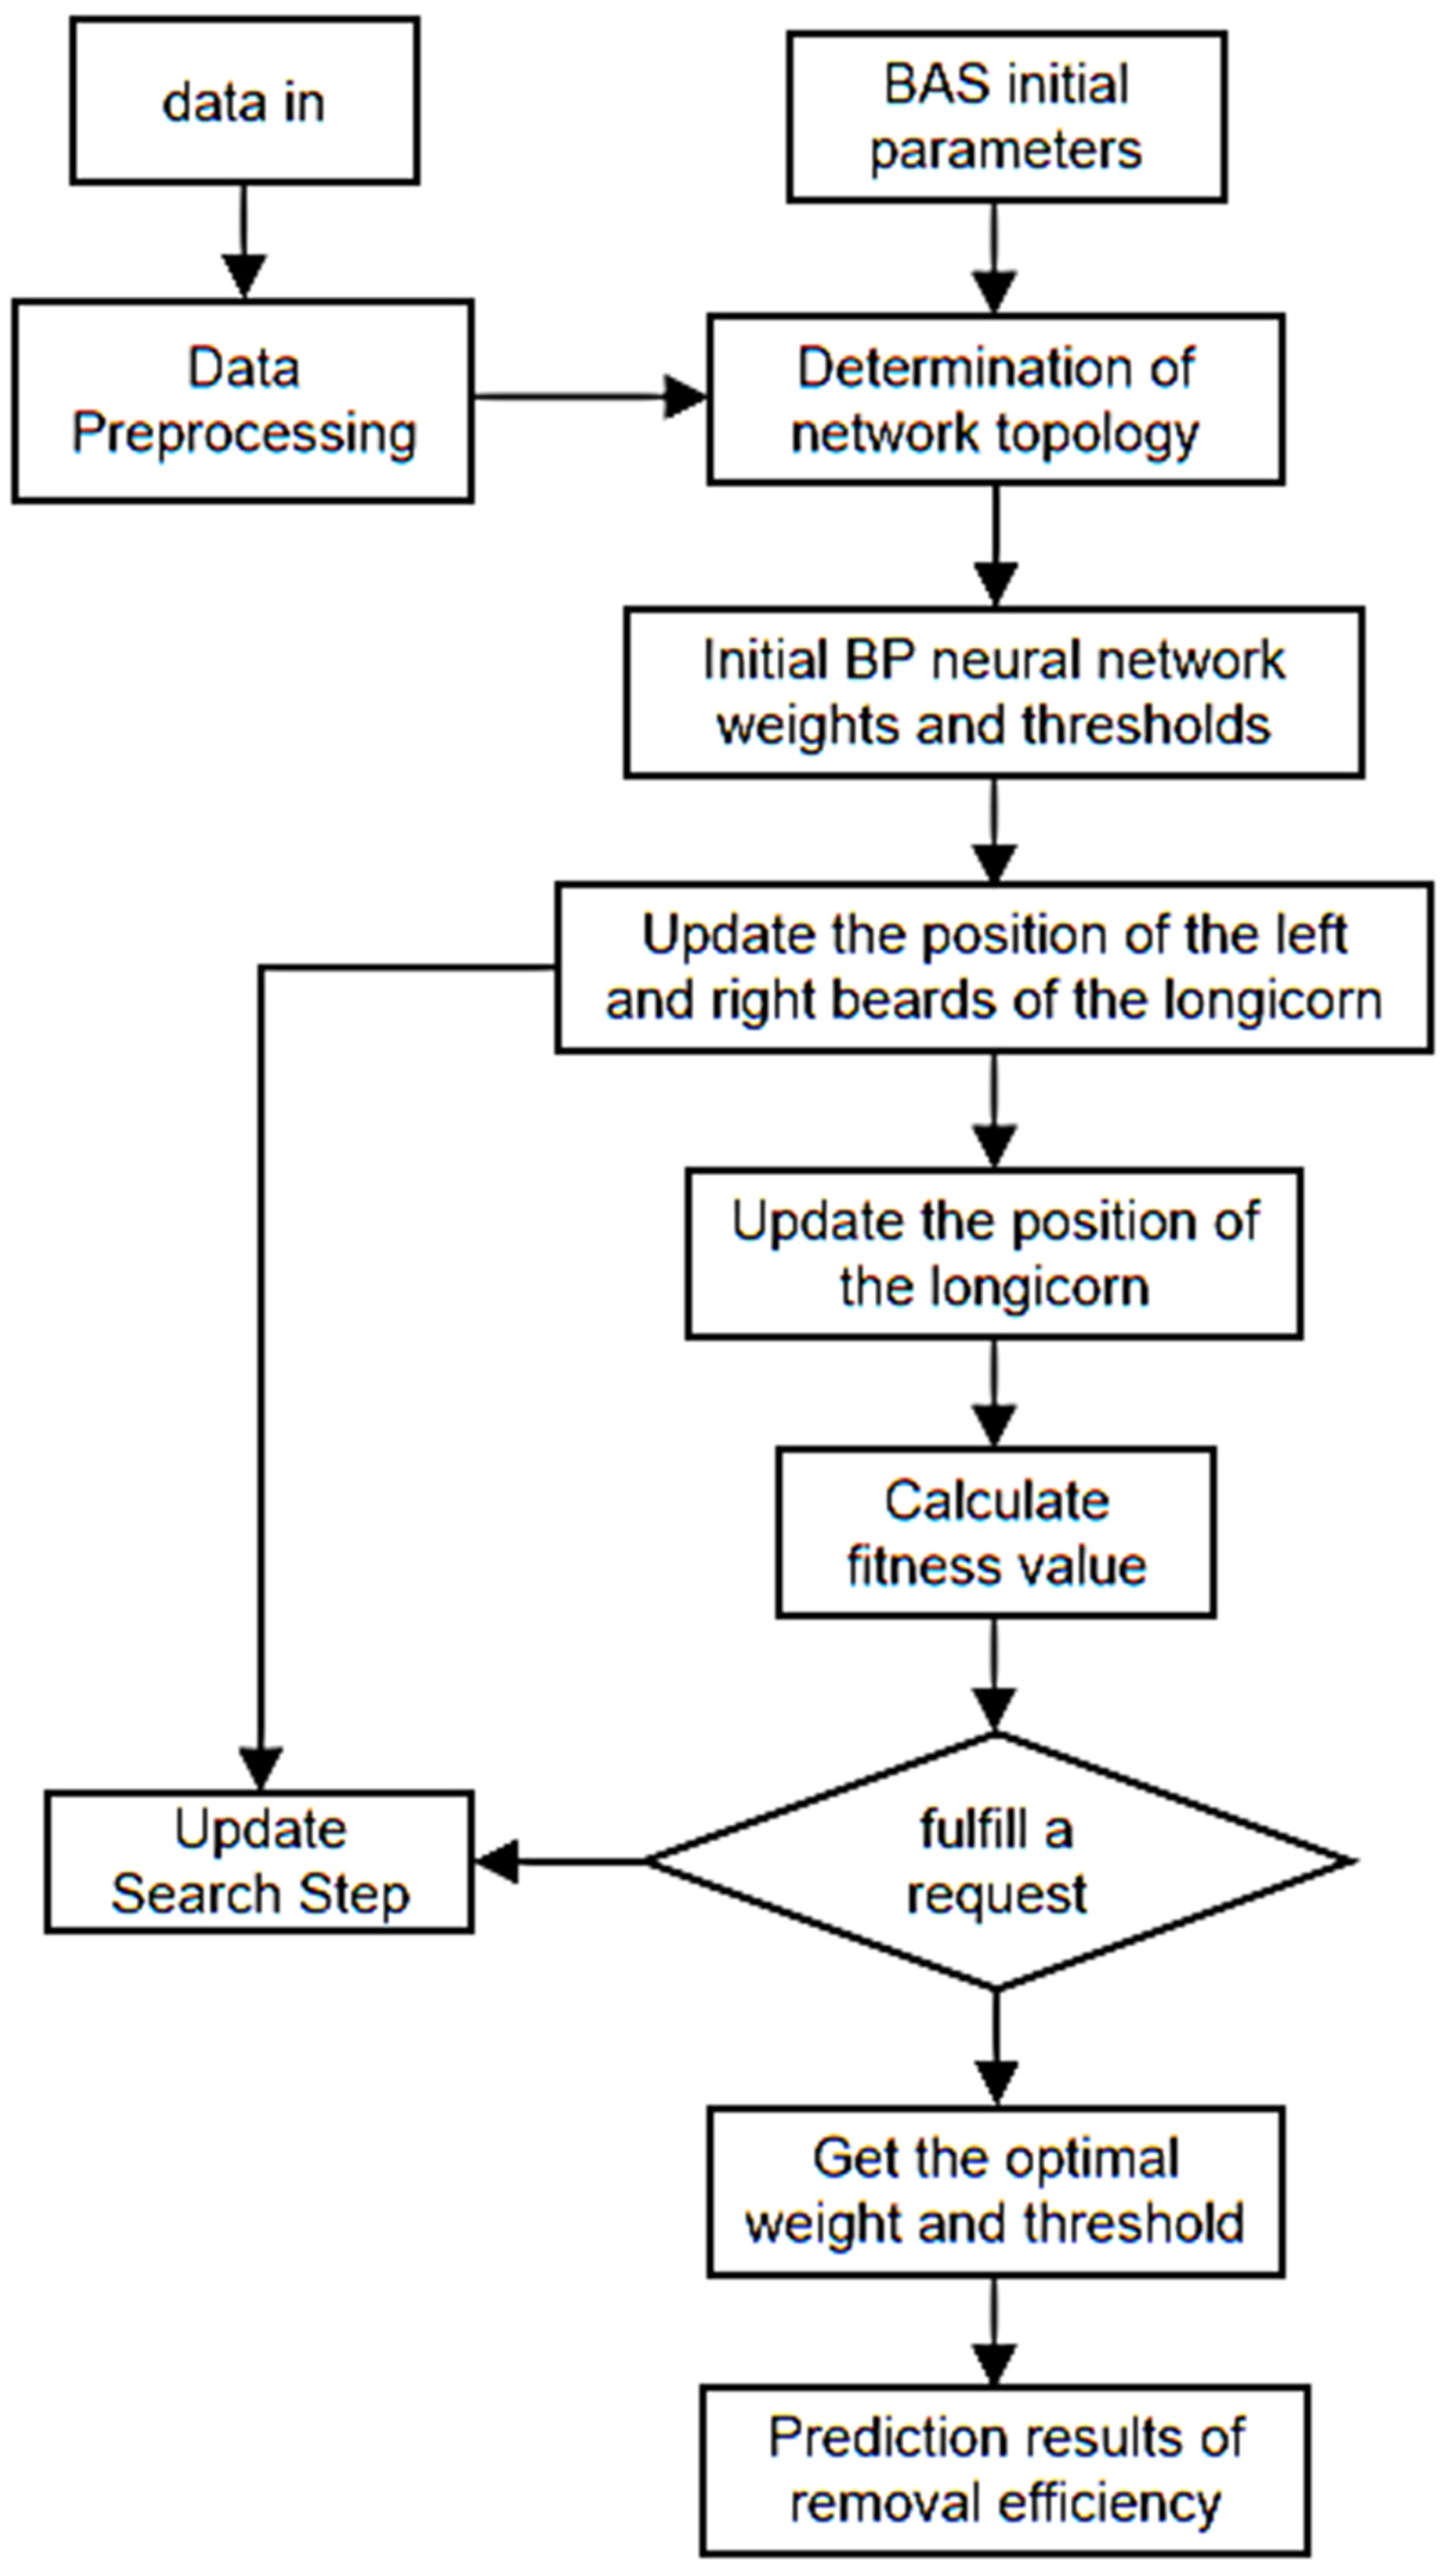
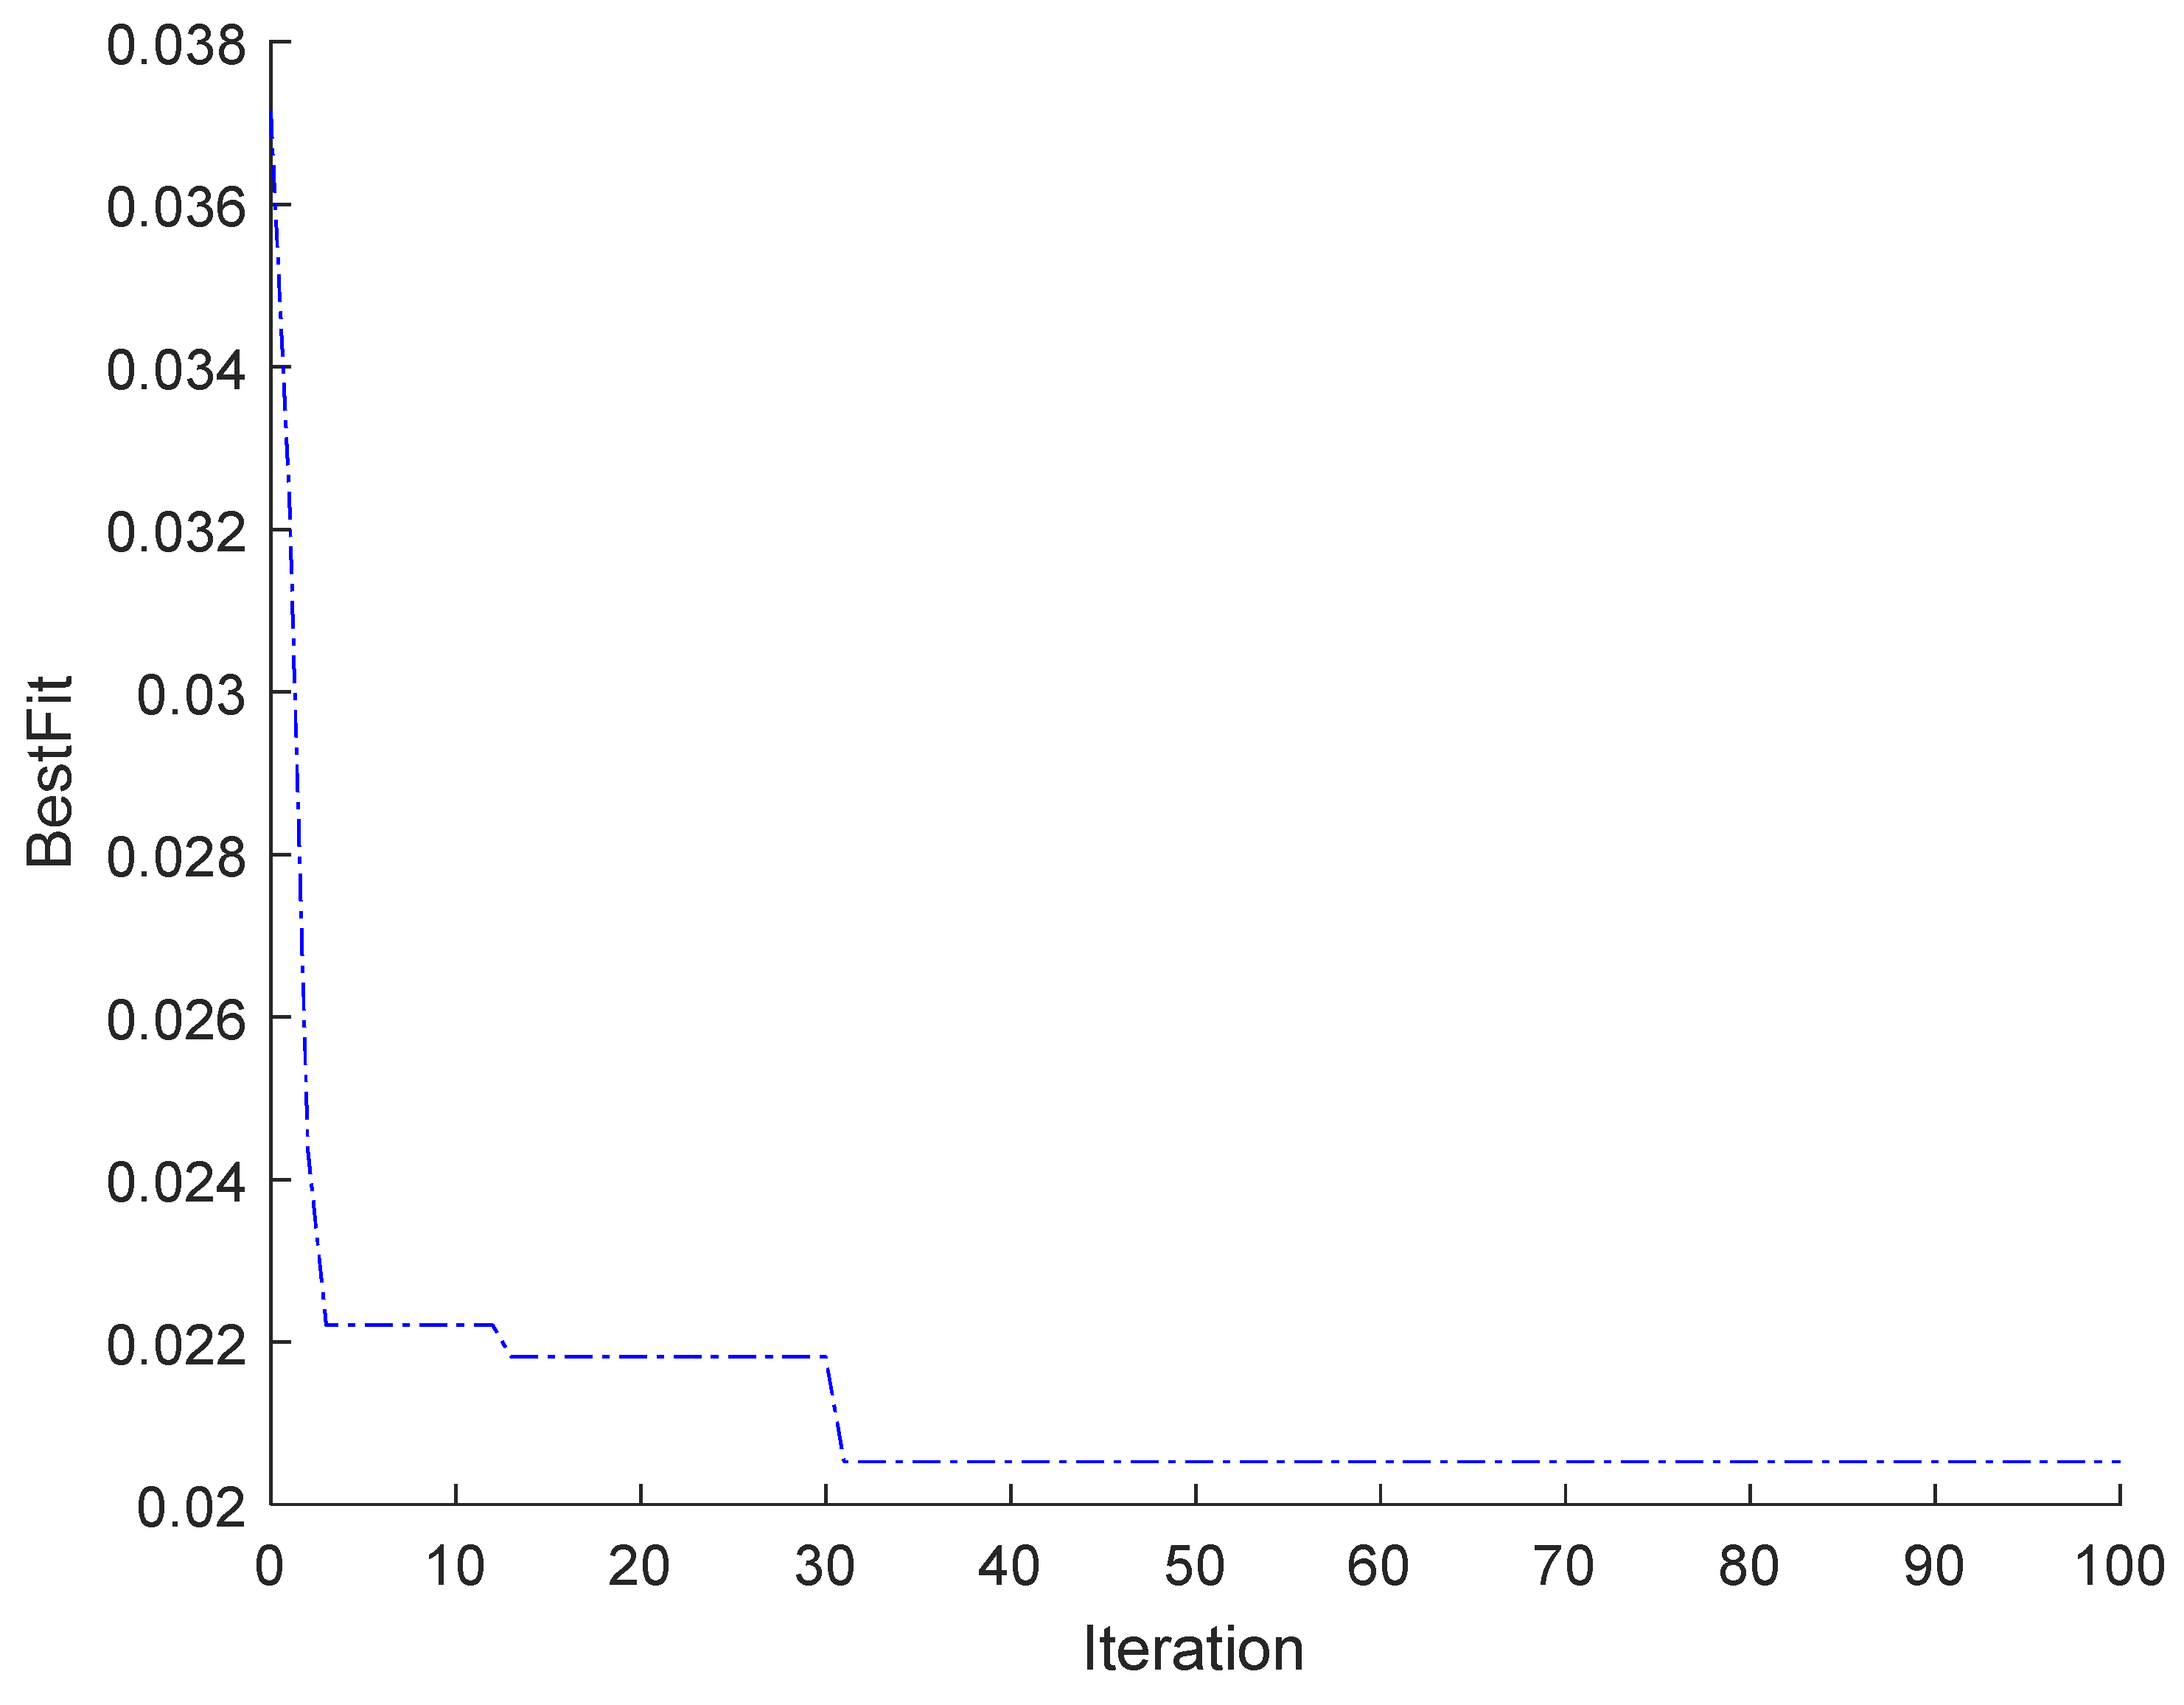
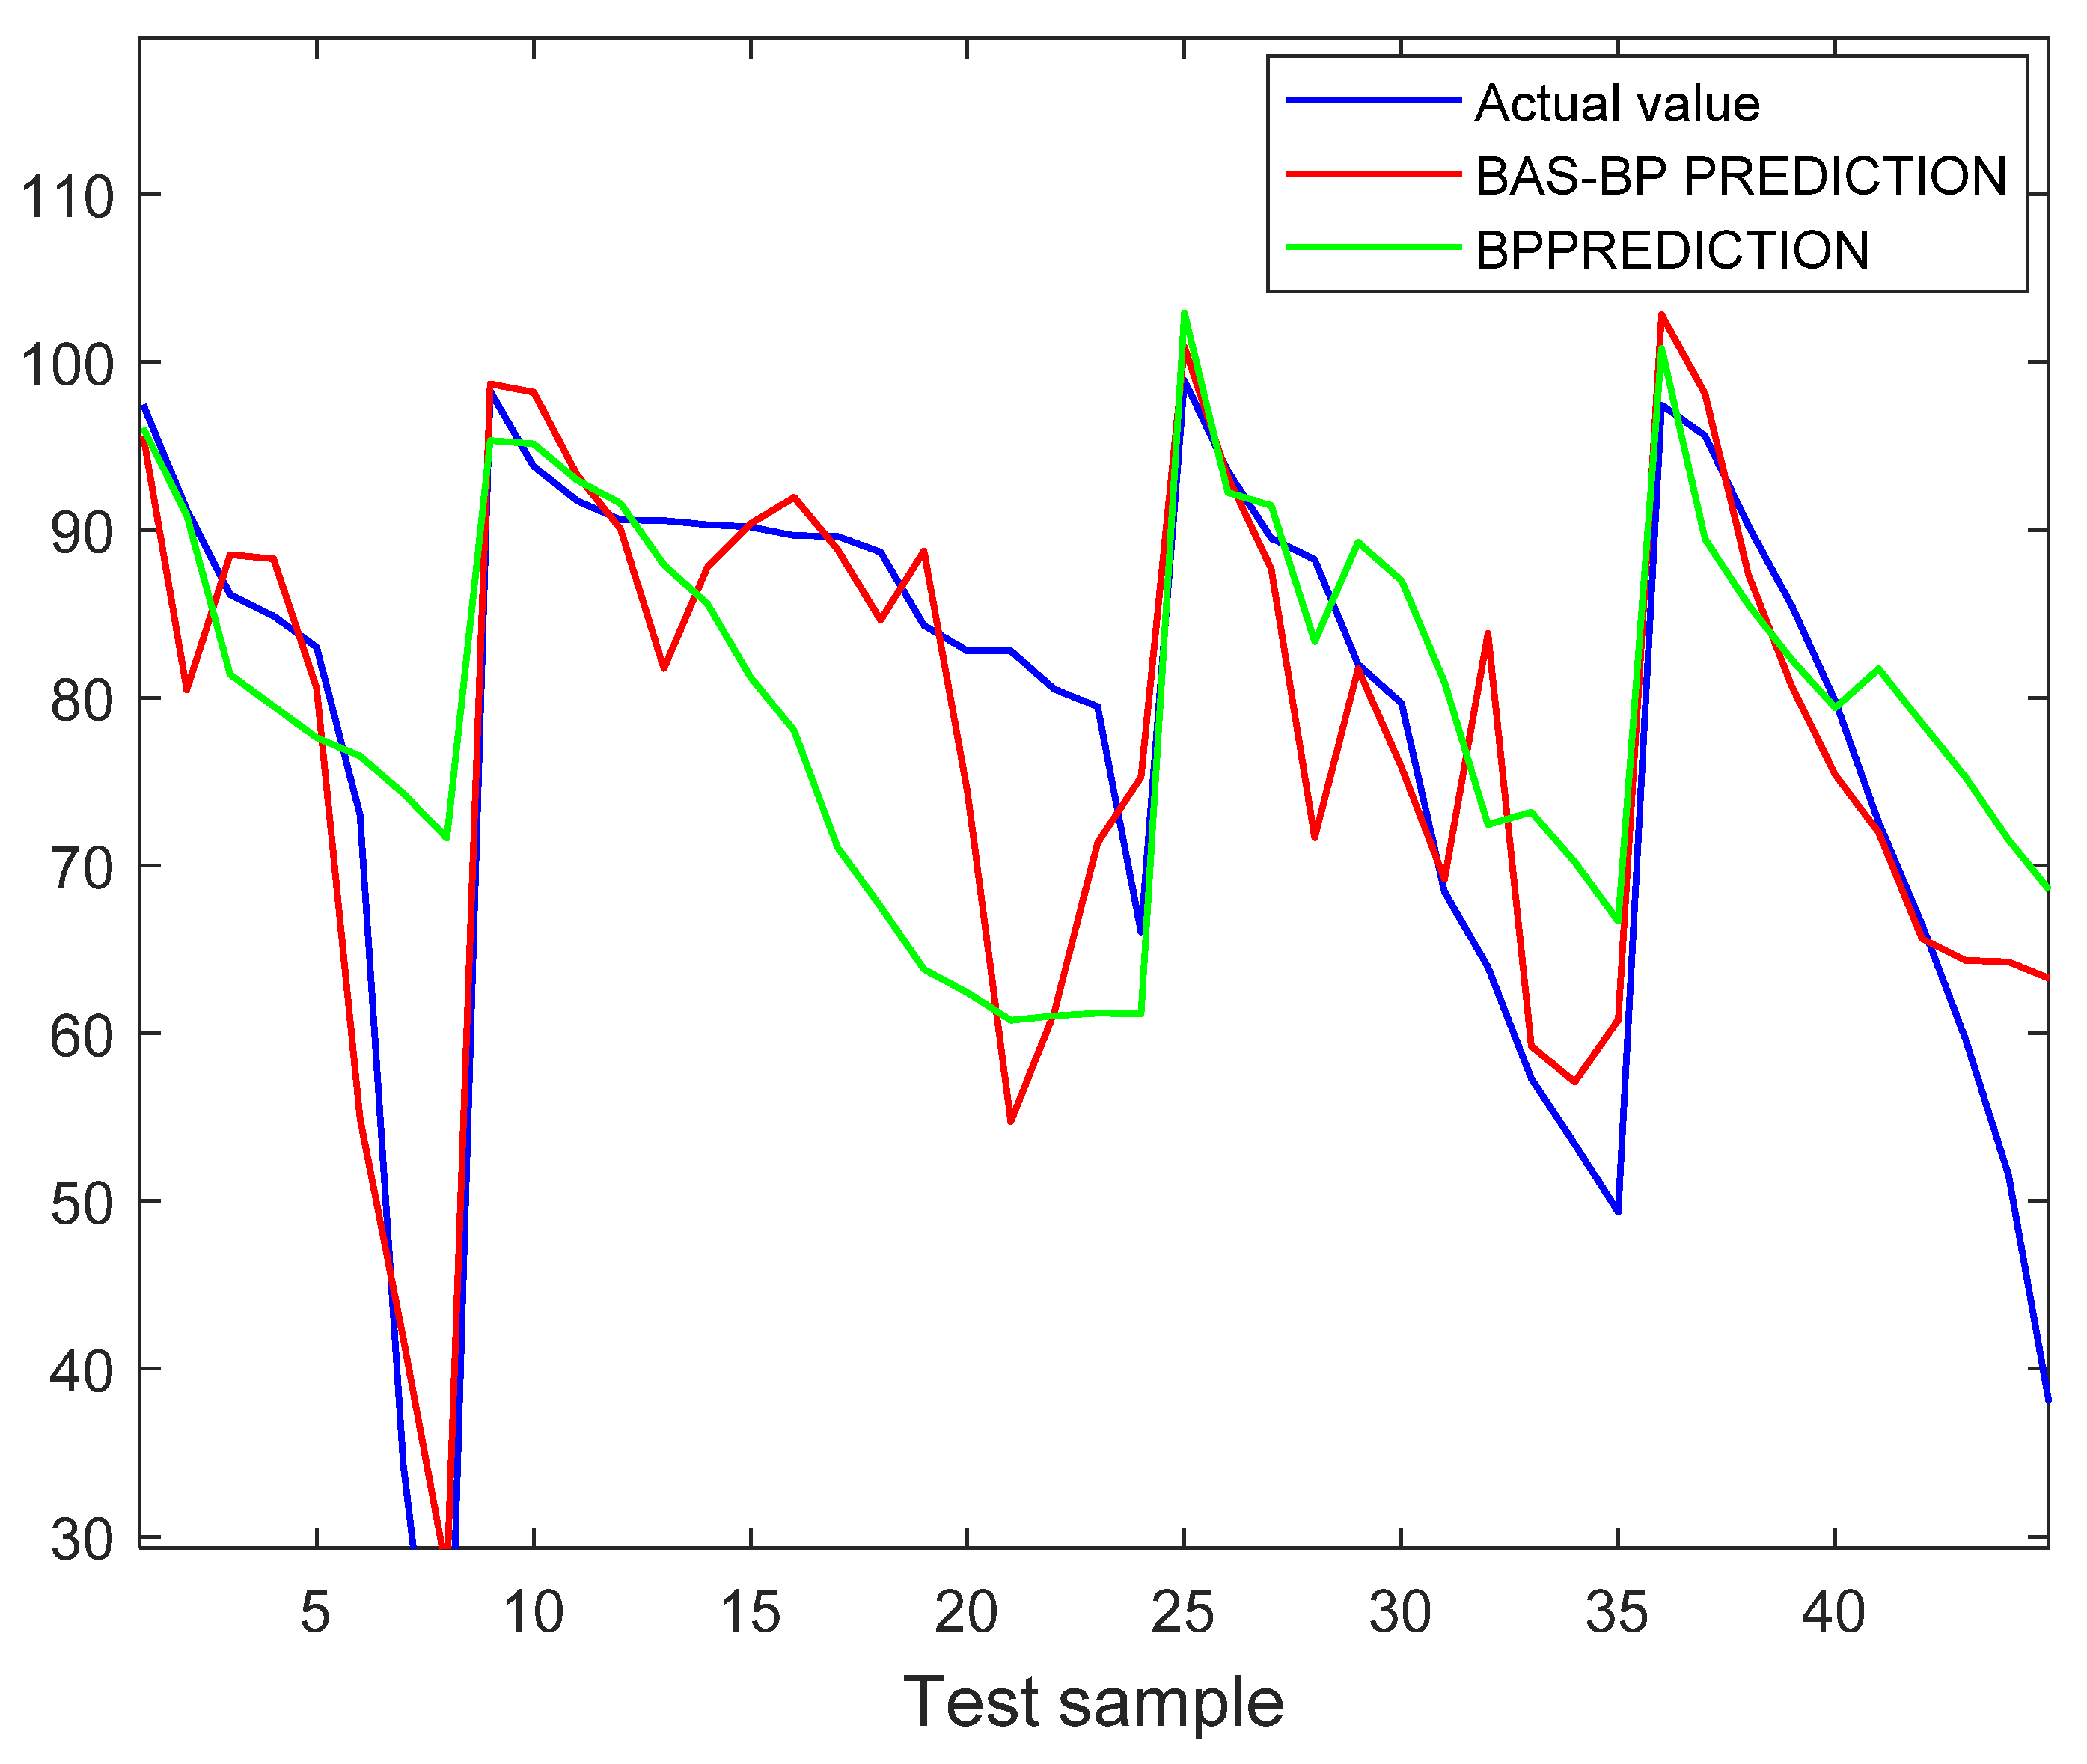
5. BAS-BP Neural Network Model

The beetle antennae search (BAS), also called the crustacean algorithm, is a novel algorithm inspired by the foraging principle of the cow [15]. According to the biological rationale, when the longhorn beetle is foraging, it doesn’t know where the food is, but it focuses on the food by its smell. The longhorn beetle has two antennae, and when the left antenna collects an odor stronger than its right, it flies to the left and vice versa. According to this method, the cows can quickly find food. The advantages of BAS are that only a single individual with a single function needs to be found, an automated optimization process can be achieved without specific functions, and a reduced number of iterations leads to a significant improvement in the speed of optimization [20].

5.1. BAS-BP Neural Network Model Building

The right-hand side and threshold values of the BP neural network are optimized using BAS, which is modeled with the following specific steps:
(1) Normalization was performed on the random vector of calf whiskers:
b = r a n d s ( k , 1 ) r a n d s ( k , 1 )
Where b is a random variable with the day cow whisker orientation; rands () as random function; K represents the spatial dimension.
(2) Creating apart left and right whisker spatial coordinates:
x r t = x t + d 0 × b / 2 x l t = x t d 0 × b / 2
Where x r t is the position coordinate of the day bovine left whisker at iteration t ; x l t is the position coordinate of the day bovine right whisker at iteration t ; x t is the coordinate of the center of mass at the iteration of day bovine t , and d 0 represents the distance between the two whiskers of the day cow.
(3) The odor intensities of the left and right whiskers of day cattle, i.e., the intensities of f ( x r ) and f ( x l ) , were expressed according to the adaptation function f ( ) .
(4) The direction of movement of the position of the cow was judged according to the odor intensity:
x t + 1 = x t δ t × s i g n ( f ( x r t ) f ( x l t ) )
where δ t represents the step factor at the t st iteration; s i g n ( ) as a symbolic function.
(5) Let the step factor be given. Due to its ability to control the area searchability of the calf’s whisker, a step factor as large as possible was chosen so that it covered the search area sufficiently to not get trapped in a local minimum:
δ t + 1 = δ t × e t a t = ( 0 , 1 , 2 n )
(6) The root means the square error M E S of the test sample is taken as the fitness evaluation function:
f i t n e s s = M E S = 1 N i = 1 N ( t s i m ( i ) y i ) 2
where f i t n e s s is the fitness evaluation function value; N is the number of training set samples; t s i m ( i ) is the i th sample model output value, and y i is the actual value of the i th sample. The minimum of M E S at the iteration stop is the optimal solution we want.
(7) Calf position was initialized. The initial position of the cow was then given and saved in b e s t X .
(8) Fitness functions were calculated for the initial positions and saved in b e s t Y .
(9) Update the calf left and right whisker position coordinates according to Formula (2).
(10) Values of f ( x r ) and f ( x l ) were taken on the basis of the position of the left and right whiskers in the cows. Update the fitness function value according to Equation (3) after comparing the intensities, and update b e s t X and b e s t Y if the value f ( ) is better than b e s t Y .
(11) The algorithm ends the run when the number of iterations reaches 100.
(12) The solution b e s t X when stopping the iteration is the trained optimal solution. That is, the optimal right and threshold value of the BP neural network: after it is taken into the neural network, the BAS-BP neural network model is finally generated. The neural network structure model was built according to the above conditions. The results are shown in Figure 15:

5.2. Results and Discussion

In this paper, a total of 17 sets of experimental data are selected as the total sample, using the previously mentioned experimental data as the training set, varying the front-end conditions, and four sets of calibration tests are used as the test set, using MATLAB 2021b as the platform.
Figure 16 shows the iterative results of the optimization of the bas algorithm. It is known from the figure that approximately 31 iterations are close to convergence, at which point the result is the closest to the best fit. That is, the optimal solution is 0.0205259 and 31. Figure 17 shows the results of the fitting of the BAS-BP with the BP training set, and it can be seen from the figure that the predicted results and the curve trends of the optimized BAS model are close to the true values.
To realize the optimization effect of BAS on BP, Table 1 lists the mean square error (MSE), root mean square error (RMSE) and mean absolute error (MAPE) as evaluation indicators for model prediction [18], and the results are shown in Table 1: the BAS-BP decreased by 64.22%, 40.19% and 54.21%, respectively, compared with the BP indicators. The above results indicate that the BP neural network after BAS optimization has a more pronounced improvement in terms of convergence rate or accuracy.

6. Consequent

The degradation of styrene in a nitrogen atmosphere by Fenton’s reagent in a bubbling reactor was investigated. Parametric studies were carried out, and the following conclusions were obtained: The UV/Fenton process showed a favorable effect on styrene degradation under the nitrogen atmosphere. The styrene effective removal time increased with the increase of H2O2 concentration, and when H2O2 in the solution was fully consumed, the styrene removal efficiency showed an obvious decrease. The optimum conditions for styrene degradation were obtained at the H2O2 concentration of 20 mmol/L, a Fe2+ concentration of 0.3 mmol/L, and a pH of 3, which could degrade styrene gas at a concentration of 2000 mg/L with 96.2% efficiency within 100 min and a final by-product (TOC) concentration of 22.45 mg/L. In addition, the established BAS-BP neural network model performs better than BP neural network and can be evaluated for styrene removal efficiency with different parameters. This model can provide a series of valuable data under some front-end conditions that are difficult to operate. The reference provides real-time data for certain difficult-to-monitor quantities such as hydrogen peroxide content, TOC concentration, etc. The oxidant content in the reactor can also be back extrapolated by simulation results, which guarantees that the device can operate for a lengthy time. It is capable of alerting the operator to the presence of instrument damage within the reactor in some cases where the actual and simulated data do not correspond.

Author Contributions

Conceptualization, J.C. and M.L.; methodology, Y.Z.; software, C.L.; validation, X.X., Y.Z. and Z.W.; formal analysis, Y.Z.; investigation, X.X.; resources, M.L.; data curation, Y.Z.; writing—original draft preparation, Y.Z.; writing—review and editing, Y.Z., M.L. and J.C.; visualization, X.X.; supervision, S.L.; project administration, D.W. and W.Q.; funding acquisition, S.L. All authors have read and agreed to the published version of the manuscript.

Funding

Shandong Provincial Major Science and Technology Innovation Program (2022CXGC020401).

Institutional Review Board Statement

The study was conducted in accordance with the Declaration.

Informed Consent Statement

Not applicable.

Data Availability Statement

Data sharing is not applicable; no new data were created or analyzed.

Conflicts of Interest

The authors declare no conflict of interest.

References

  1. Sun, J.; Wu, F.; Hu, B.; Tang, G.; Zhang, J.; Wang, Y. VOC characteristics, emissions and contributions to SOA formation during hazy episodes. Atmos. Environ. 2016, 141, 560–570. [Google Scholar] [CrossRef]
  2. Kansal, A. Sources and reactivity of NMHCs and VOCs in the atmosphere: A review. J. Hazard. Mater. 2009, 166, 17–26. [Google Scholar] [CrossRef]
  3. Liu, Z.; Li, N.; Wang, N. Characterization and source identification of ambient VOCs in Jinan, China. Air Qual. Atmos. Health 2016, 9, 285–291. [Google Scholar] [CrossRef]
  4. Filip, M.R.; Pop, A.; Perhaiţa, I.; Moldovan, M.; Truşcă, R. Investigation of thermal and catalytic degradation of polystyrene waste into styrene monomer over natural volcanic tuff and Florisil catalysts. Open Chem. 2013, 11, 725–735. [Google Scholar] [CrossRef]
  5. Jorio, H.; Bibeau, L.; Heitz, M. Biofiltration of Air Contaminated by Styrene: Effect of Nitrogen Supply, Gas Flow Rate, and Inlet Concentration. Environ. Sci. Technol. 2000, 34, 1764–1771. [Google Scholar] [CrossRef]
  6. Washington, M.D.; Larsen, D.W.; Manahan, S.E. Analytical Characterization of an Industrial Waste Treated by Gasification. Environ. Sci. Technol. 1999, 33, 1263–1268. [Google Scholar] [CrossRef]
  7. Zhang, M.; Dou, Z.; Liu, L.; Jiang, J.; Mebarki, A.; Ni, L. Study of optimal layout based on integrated probabilistic framework (IPF): Case of a crude oil tank farm. J. Loss Prev. Process. Ind. 2017, 48, 305–311. [Google Scholar] [CrossRef]
  8. Tauseef, S.M.; Abbasi, T.; Pompapathi, V.; Abbasi, S. Case studies of 28 major accidents of fires/explosions in storage tank farms in the backdrop of available codes/standards/models for safely configuring such tank farms. Process. Saf. Environ. Prot. 2018, 120, 331–338. [Google Scholar] [CrossRef]
  9. Kočí, K.; Reli, M.; Troppová, I.; Prostějovský, T.; Žebrák, R. Degradation of styrene from waste gas stream by advanced oxidation processes. CLEAN–Soil Air Water 2019, 47, 1900126. [Google Scholar] [CrossRef]
  10. Handa, M.; Lee, Y.; Shibusawa, M.; Tokumura, M.; Kawase, Y. Removal of VOCs in waste gas by the photo-Fenton reaction: Effects of dosage of Fenton reagents on degradation of toluene gas in a bubble column. J. Chem. Technol. Biotechnol. 2013, 88, 88–97. [Google Scholar] [CrossRef]
  11. Liu, G.; Ji, J.; Huang, H.; Xie, R.; Feng, Q.; Shu, Y.; Zhan, Y.; Fang, R.; He, M.; Liu, S.; et al. UV/H2O2: An efficient aqueous advanced oxidation process for VOCs removal. Chem. Eng. J. 2017, 324, 44–50. [Google Scholar] [CrossRef]
  12. Bautista, P.; Mohedano, A.F.; Casas, J.A.; Zazo, J.A.; Rodriguez, J.J. An overview of the application of Fenton oxidation to industrial wastewaters treatment. J. Chem. Technol. Biotechnol. 2008, 83, 1323–1338. [Google Scholar] [CrossRef]
  13. Lima, V.N.; Rodrigues, C.S.; Madeira, L.M. Sequential gas-liquid treatment for gaseous toluene degradation by Fenton’s oxidation in bubble reactors. J. Environ. Chem. Eng. 2020, 8, 103796. [Google Scholar] [CrossRef]
  14. Hu, X.; Wang, X.; Ban, Y.; Ren, B. A comparative study of UV–Fenton, UV–H2O2 and Fenton reaction treatment of landfill leachate. Environ. Technol. 2011, 32, 945–951. [Google Scholar] [CrossRef] [PubMed]
  15. Tang, X.; Ma, J.; Zhou, S.; Shan, T. Parking Demand Prediction Method of Urban Commercial-Office Complex Buildings Based on the MRA-BAS-BP Algorithm. J. Adv. Transp. 2022, 2022, 2529912. [Google Scholar] [CrossRef]
  16. Regonia, P.R.; Pelicano, C.M.; Tani, R.; Ishizumi, A.; Yanagi, H.; Ikeda, K. Predicting the band gap of ZnO quantum dots via supervised machine learning models. Optik 2020, 207, 164469. [Google Scholar] [CrossRef]
  17. Lima, V.N.; Rodrigues, C.; Madeira, L.M. Simultaneous treatment of toluene-containing gas waste and industrial wastewater by the Fenton process. Sci. Total Environ. 2020, 749, 141497. [Google Scholar] [CrossRef] [PubMed]
  18. Li, Z.; Zhu, B.; Dai, Y.; Zhu, W.; Wang, Q.; Wang, B. Research on Thermal Error Modeling of Motorized Spindle Based on BP Neural Network Optimized by Beetle Antennae Search Algorithm. Machines 2021, 9, 286. [Google Scholar] [CrossRef]
  19. Lima, V.N.; Rodrigues, C.S.D.; Madeira, L.M. Application of the Fenton’s process in a bubble column reactor for hydroquinone degradation. Environ. Sci. Pollut. Res. 2018, 25, 34851–34862. [Google Scholar] [CrossRef] [PubMed]
  20. Qian, J.; Wang, P.; Pu, C.; Chen, G. Joint application of multi-object beetle antennae search algorithm and BAS-BP fuel cost forecast network on optimal active power dispatch problems. Knowl.-Based Syst. 2021, 226, 107149. [Google Scholar] [CrossRef]
Figure 1. Device flow chart. 1. Nitrogen gas bottle 2. Wash bottle 3. Styrene vessel 4. Electron flowmeter 5. Air inlet 6. Front gas sampling port; 7. Back-end gas sampling port 8. Aerated stone 9. Liquid sampling port 10. Diving UV lamp 11. Gas chromatograph detector.
Toxics 11 00026 g001
Figure 2. Experimental comparison of different reaction systems.
Toxics 11 00026 g002
Figure 3. Effect of different pH on hydrogen peroxide.
Toxics 11 00026 g003
Figure 4. Effect of different pH on the removal efficiency of styrene.
Toxics 11 00026 g004
Figure 5. Effect of different pH on TOC concentration.
Toxics 11 00026 g005
Figure 6. Effect of Fe2+ concentration on hydrogen peroxide concentration.
Toxics 11 00026 g006
Figure 7. Effect of Fe2+ concentration on removal efficiency of styrene.
Toxics 11 00026 g007
Figure 8. Effect of Fe2+ concentration on TOC concentration.
Toxics 11 00026 g008
Figure 9. Change of hydrogen peroxide concentration with time.
Toxics 11 00026 g009
Figure 10. Effect of hydrogen peroxide concentration on removal efficiency of styrene.
Toxics 11 00026 g010
Figure 11. Effect of hydrogen peroxide concentration on TOC concentration.
Toxics 11 00026 g011
Figure 12. Variation of pH under different conditions.
Toxics 11 00026 g012
Figure 13. Variation of dissolved oxygen under different conditions.
Toxics 11 00026 g013
Figure 14. Reaction mechanism of styrene.
Toxics 11 00026 g014
Figure 15. BAS optimization process of BP neural network.
Toxics 11 00026 g015
Figure 16. Fitness curve of BAS-BP neural network.
Toxics 11 00026 g016
Figure 17. Fitting results of the training set of BAS-BP neural network.
Toxics 11 00026 g017
Table 1. Effect comparison of different models.
Algorithm NameMSERMSEMAPE
BAS-BP90.64999.52111.8578
BP253.377715.917825.8973
Disclaimer/Publisher’s Note: The statements, opinions and data contained in all publications are solely those of the individual author(s) and contributor(s) and not of MDPI and/or the editor(s). MDPI and/or the editor(s) disclaim responsibility for any injury to people or property resulting from any ideas, methods, instructions or products referred to in the content.

