
Do Neighborhood Factors Modify the Effects of Lead Exposure on Child Behavior?

 , ,
, , 
Abstract
:1. Introduction
2. Materials and Methods
2.1. Sample Recruitment and Analytical Samples
2.2. Measures
2.2.1. Behavior Problem Measures in the Cross-Sectional Study
2.2.2. Behavior Measures in the Longitudinal Study
2.2.3. Clinical Measures: BLL, Hemoglobin and Body Mass Index (BMI)
2.2.4. Caregiver Questionnaire
2.2.5. HOME Inventory Score
2.2.6. Neighborhood Measures
2.3. Statistical Analysis: Cross-Sectional Study
2.3.1. Selection Effects
2.3.2. Missing Data
2.3.3. Multilevel Analysis
2.4. Statistical Analysis: Longitudinal Study
3. Results
3.1. Cross-Sectional Sample

| Effect Modifier: Neighborhood Disadvantage | Effect Modifier: NDVI | Effect Modifier: Nearest Greenspace (Deciles) | ||||
|---|---|---|---|---|---|---|
| Behavior Problem Scale Model Variables | Direct Effects Model | Interaction Term Model | Direct Effects Model | Interaction Term Model | Direct Effects Model | Interaction Term Model |
| β (CI) | β (CI) | β (CI) | β (CI) | β (CI) | β (CI) | |
| BRIEF Planning/Org. Problems | ||||||
| Blood Lead ≥ 2 µg/dL | 3.5 (0.75, 6.31) * | 1.74 (−2.69, 6.17) | 3.52 (0.74, 6.30) ± | 5.37 (−6.14, 16.88) | 3.76 (0.96, 6.55) * | 8.24 (2.77, 13.71) * |
| Neighborhood Disadvantage | 0.26 (−1.56, 2.08) | −0.32 (−2.47, 1.83) | − | − | − | − |
| Blood Lead * Neighborhood Dis. | − | 1.11 (−1.02, 3.23) | − | − | − | − |
| NDVI (x100) | − | − | 0.03 (−0.16, 0.23) | 0.06 (−0.20, 0.32) | − | − |
| Blood Lead * NDVI | − | − | − | −0.06 (−0.39, 0.28) | − | − |
| Nearest Greenspace (deciles) | − | − | − | − | 0.34 (−0.17, 0.84) | 0.75 (0.02, 1.5) * |
| Blood Lead * Greenspace | − | − | − | − | − | −0.90 (−1.8, 0.05) ± |
| BRIEF Inhibitory Control Problems | ||||||
| Blood Lead ≥ 2 µg/dL | 2.83 (0.68, 4.98) * | 4.00 (0.48, 7.52) * | 2.85 (0.69, 5.01) * | −3.67 (−12.68, 5.32) | 2.72 (0.56, 4.88) * | 4.47 (0.15, 8.80) |
| Neighborhood Disadvantage | −0.53 (−2.24, 1.17) | −0.17 (−2.09, 1.75) | − | − | − | − |
| Blood Lead * Neighborhood Dis. | − | −0.68 (−2.32, 0.96) | − | − | − | − |
| NDVI (x100) | − | − | −0.03 (−0.19, 0.13) | −0.13 (−0.34, 0.07) | − | − |
| Blood Lead * NDVI | − | − | − | 0.19 (−0.07, 0.46) | − | − |
| Nearest Greenspace (deciles) | − | − | − | − | −0.19 (−0.58, 0.21) | −0.01 (−0.56, 0.55) |
| Blood Lead * Greenspace | − | − | − | − | − | −0.33 (−1.05, 0.38) |
| CTRS−R:S Oppositional Behavior | ||||||
| Blood Lead ≥ 2 µg/dL | 2.08 (−0.51, 4.67) | 3.72 (−0.32, 7.77) | 2.12 (−0.48, 4.71) | 3.29 (−13.56, 6.97) | 2.00 (−0.59, 4.59) | 6.38 (1.27, 11.48) * |
| Neighborhood Disadvantage | 0.48 (−1.55, 2.51) | 0.07 (−2.24, 2.39) | − | − | − | − |
| Blood Lead * Neighborhood Dis. | − | −0.20 (−2.11, 1.71) | − | − | − | − |
| NDVI (x100) | − | − | −0.04 (−0.23, 0.14) | −0.09 (−0.33, 0.14) | − | − |
| Blood Lead * NDVI | − | − | − | 0.20 (−0.10, 0.49) | − | − |
| Nearest Greenspace (deciles) | − | − | − | − | −0.23 (−0.69, 0.23) | 0.29 (−0.41, 0.98) |
| Blood Lead * Greenspace | − | − | − | − | − | −0.84 (−1.69, 0.01) ± |
| CTRS−R:S Cognitive Problems | ||||||
| Blood Lead ≥ 2 µg/dL | 2.9 (0.03, 5.70) * | 3.67 (−0.55, 7.89) | 3.11 (0.58, 5.65) * | −1.58 (−12.22, 9.06) | 3.29 (0.74, 5.83) * | 7.87 (2.82, 12.92) * |
| Neighborhood Disadvantage | −0.1 (−1.70, 1.46) | 0.30 (−1.83, 2.42) | − | − | − | − |
| Blood Lead * Neighborhood Dis. | − | −0.30 (−2.36, 1.76) | − | − | − | − |
| NDVI (x100) | − | − | 0.08 (−0.09, 0.25) | 0.00 (−0.25, 0.25) | − | − |
| Blood Lead * NDVI | − | − | 0.14 (−0.17, 0.44) | − | − | |
| Nearest Greenspace (deciles) | − | − | − | − | 0.24 (−0.21, 0.69) | 0.78 (0.10, 1.47) * |
| Blood Lead * Greenspace | − | − | − | − | − | −0.88 (−1.73, −0.03) * |
| CTRS−R:S Hyperactivity | ||||||
| Blood Lead ≥ 2 µg/dL | 2.93 (0.31, 5.55) * | 4.3 (−0.51, 9.14) | 2.91 (0.29, 5.53) * | −5.17 (−16.40, 6.06) | 2.94 (0.31, 5.56) * | 7.63 (2.40, 12.87) * |
| Neighborhood Disadvantage | 0.09 (−1.59, 1.78) | 0.4 (−2.19, 3.07) | − | − | − | − |
| Blood Lead * Neighborhood Dis. | − | −0.8 (−2.84, 1.33) | − | − | − | − |
| NDVI (x100) | − | − | 0.02 (−0.16, 0.20) | −0.11 (−0.37, 0.15) | − | − |
| Blood Lead * NDVI | − | − | − | 0.24 (−0.08, 0.56) | − | − |
| Nearest Greenspace (deciles) | − | − | − | − | 0.00 (−0.46, 0.46) | 0.57 (−0.13, 1.27) |
| Blood Lead * Greenspace | − | − | − | − | − | −0.91 (−1.79, −0.03) * |
| CTRS−R:S ADHD | ||||||
| Blood Lead ≥ 2 µg/dL | 3.38 (0.94, 5.81) * | 3.72 (−0.29, 7.73) ± | 3.36 (0.92, 5.80) * | −3.29 (−13.67, 7.08) | 3.38 (0.94, 5.82) * | 7.51 (2.65, 12.38) * |
| Neighborhood Disadvantage | −0.06 (−1.59, 1.48) | 0.07 (−1.91, 2.06) | − | − | − | − |
| Blood Lead * Neighborhood Dis. | − | −0.20 (−2.14, 1.74) | − | − | − | − |
| NDVI (x100) | − | − | 0.02 (−0.15, 0.18) | −0.09 (−0.33, 0.14) | − | − |
| Blood Lead * NDVI | − | − | − | 0.20 (−0.10, 0.49) | − | − |
| Nearest Greenspace (deciles) | − | − | − | − | 0.01 (−0.42, 0.44) | 0.51 (−0.14, 1.16) |
| Blood Lead * Greenspace | − | − | − | − | − | −0.80 (−1.61, 0.02) ± |
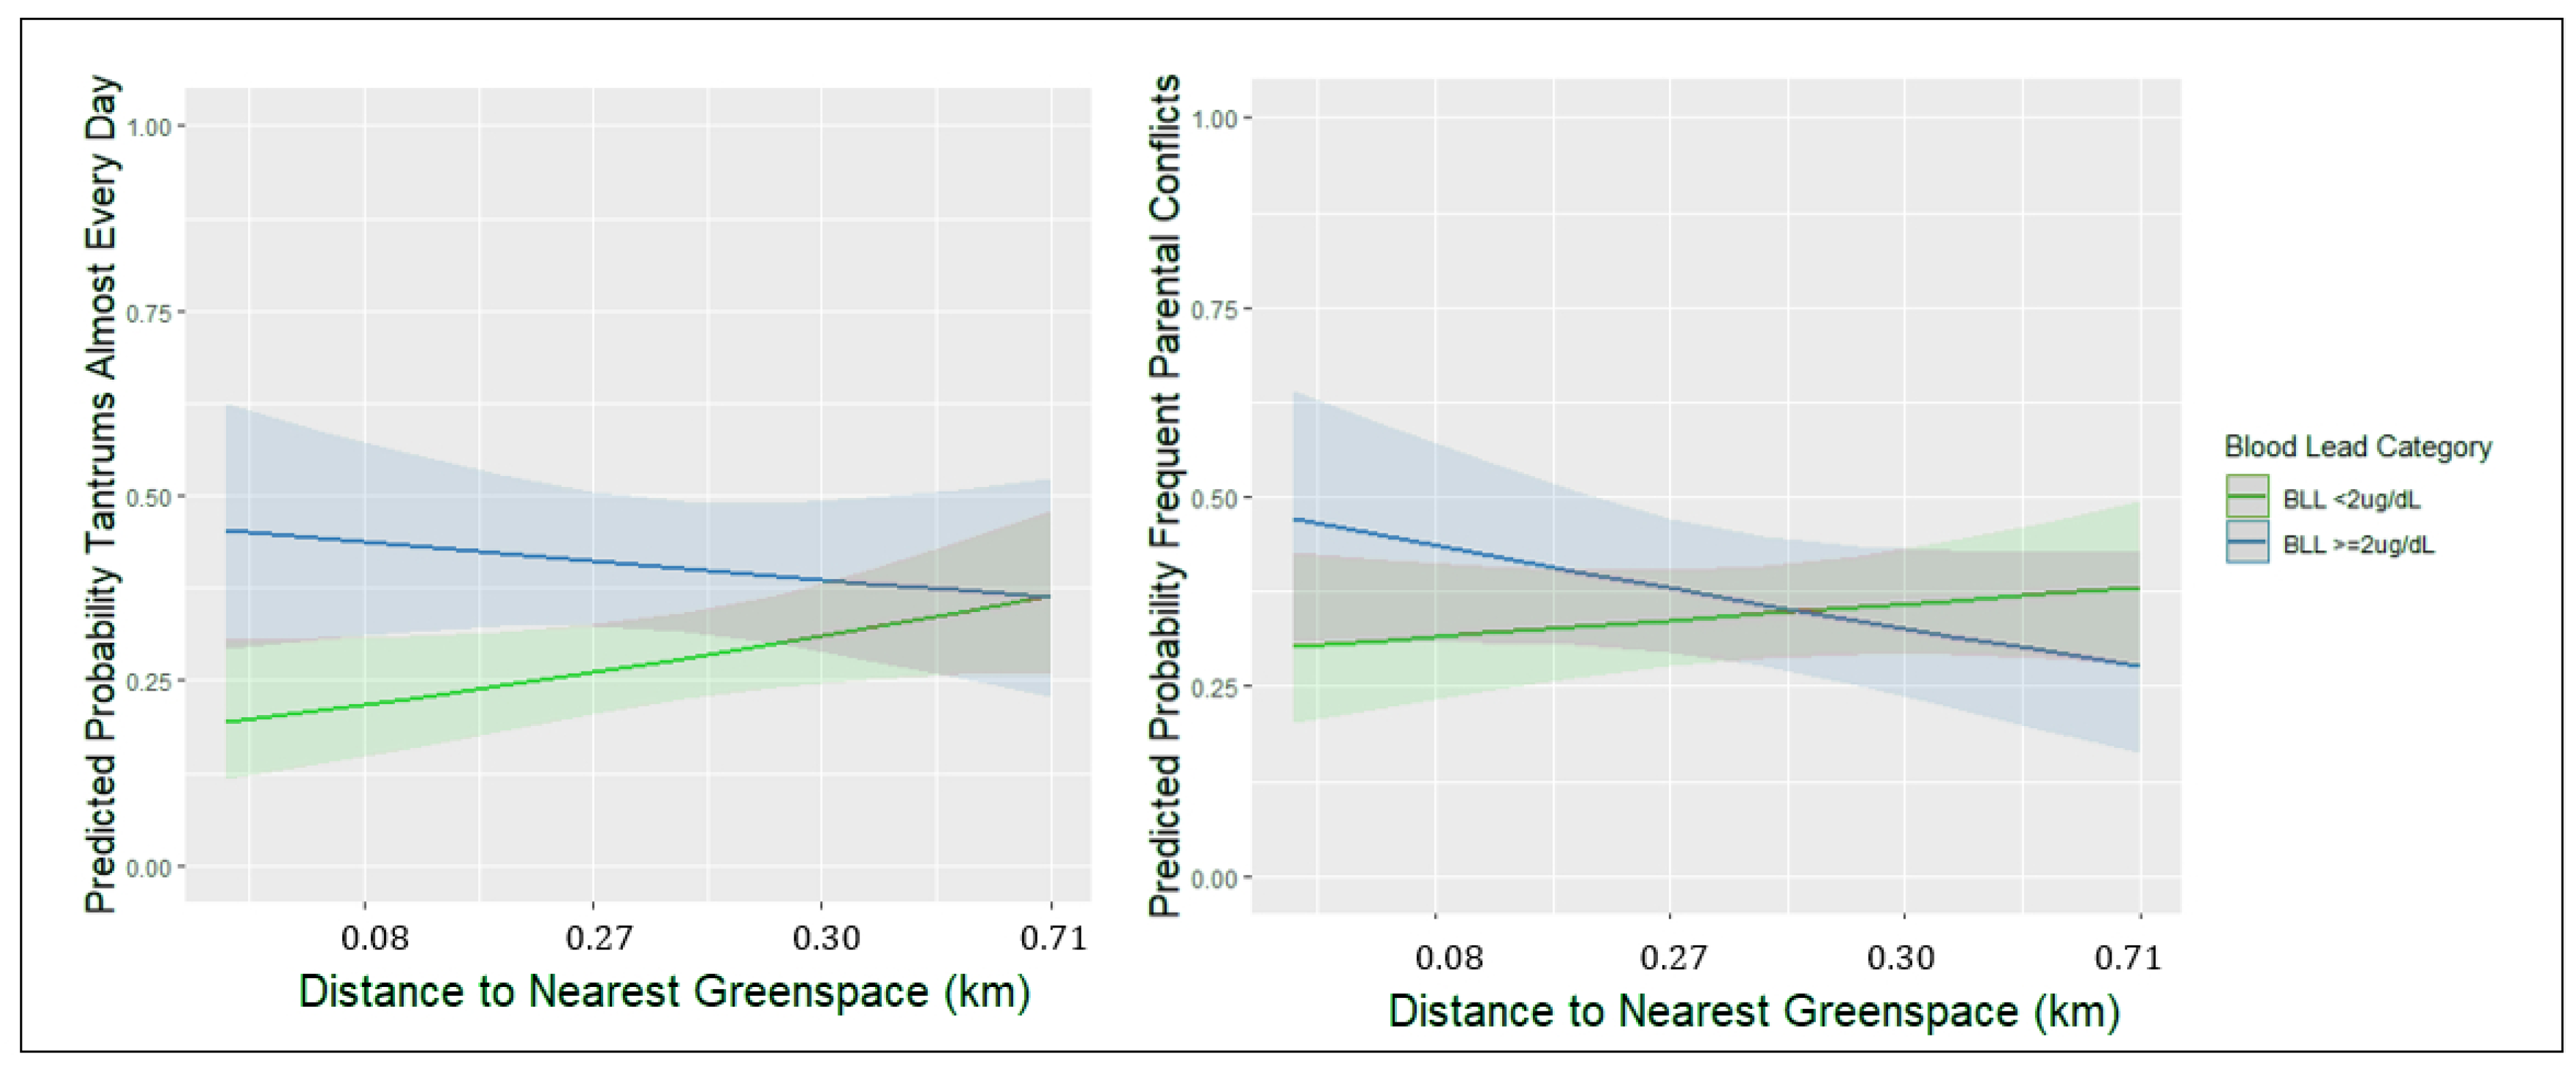
3.2. Longitudinal Sample
4. Discussion
4.1. Associations of Lead Exposure and Child Behavior
4.2. Associations of Neighborhood Factors and Child Behavior
4.3. Effect Modification by Neighborhood Factors
4.4. Strengths and Limitations
Author Contributions
Funding
Institutional Review Board Statement
Informed Consent Statement
Data Availability Statement
Conflicts of Interest
References
- Egan, K.B.; Cornwell, C.R.; Courtney, J.G.; Ettinger, A.S. Blood Lead Levels in US Children Ages 1–11 Years, 1976–2016. Environ. Health Perspect. 2021, 129, 037003. [Google Scholar] [CrossRef] [PubMed]
- Centers for Disease Control and Prevention. CDC Updates Blood Lead Reference Value for Children. Available online: https://www.cdc.gov/media/releases/2021/p1028-blood-lead.html (accessed on 3 November 2021).
- Bellinger, D.C. Lead neurotoxicity in children: Decomposing the variability in dose–effect relationships. Am. J. Ind. Med. 2007, 50, 720–728. [Google Scholar] [CrossRef] [PubMed]
- Sampson, R.J.; Winter, A.S. Poisoned development: Assessing childhood lead exposure as a cause of crime in a birth cohort followed through adolescence. Criminology 2018, 56, 269–301. [Google Scholar] [CrossRef]
- Muller, C.; Sampson, R.J.; Winter, A.S. Environmental Inequality: The Social Causes and Consequences of Lead Exposure. Annu. Rev. Sociol. 2018, 44, 263–282. [Google Scholar] [CrossRef]
- Barg, G.; Daleiro, M.; Queirolo, E.I.; Ravenscroft, J.; Mañay, N.; Peregalli, F.; Kordas, K. Association of low lead levels with behavioral problems and executive function deficits in schoolers from Montevideo, Uruguay. Int. J. Environ. Res. Public Health 2018, 15, 2735. [Google Scholar] [CrossRef]
- Barg, G.; Queirolo, E.I.; Mañay, N.; Peregalli, F.; Kordas, K. Blood lead, iron deficiency and attentional ADHD symptoms in Uruguayan first-graders. FASEB J. 2017, 31, 649.12. [Google Scholar]
- Wasserman, G.A.; Staghezza-Jaramillo, B.; Shrout, P.; Popovac, D.; Graziano, J. The effect of lead exposure on behavior problems in preschool children. Am. J. Public Health 1998, 88, 481–486. [Google Scholar] [CrossRef]
- Sciarillo, W.G.; Alexander, G.; Farrell, K.P. Lead exposure and child behavior. Am. J. Public Health 1992, 82, 1356–1360. [Google Scholar] [CrossRef]
- Chen, A.; Cai, B.; Dietrich, K.N.; Radcliffe, J.; Rogan, W.J. Lead exposure, IQ, and behavior in urban 5-to 7-year-olds: Does lead affect behavior only by lowering IQ? Pediatrics 2007, 119, e650–e658. [Google Scholar] [CrossRef]
- Mendelsohn, A.L.; Dreyer, B.P.; Fierman, A.H.; Rosen, C.M.; Legano, L.A.; Kruger, H.A.; Lim, S.W.; Courtlandt, C.D. Low-level lead exposure and behavior in early childhood. Pediatrics 1998, 101, e10. [Google Scholar] [CrossRef]
- Boucher, O.; Jacobson, S.W.; Plusquellec, P.; Dewailly, É.; Ayotte, P.; Forget-Dubois, N.; Jacobson, J.L.; Muckle, G. Prenatal methylmercury, postnatal lead exposure, and evidence of attention deficit/hyperactivity disorder among Inuit children in Arctic Quebec. Environ. Health Perspect. 2012, 120, 1456–1461. [Google Scholar] [CrossRef] [Green Version]
- Chandramouli, K.; Steer, C.D.; Ellis, M.; Emond, A.M. Effects of early childhood lead exposure on academic performance and behaviour of school age children. Arch. Dis. Child. 2009, 94, 844–848. [Google Scholar] [CrossRef] [PubMed]
- Liu, J.; Xu, X.; Wu, K.; Piao, Z.; Huang, J.; Guo, Y.; Li, W.; Zhang, Y.; Chen, A.; Huo, X. Association between lead exposure from electronic waste recycling and child temperament alterations. Neurotoxicology 2011, 32, 458–464. [Google Scholar] [CrossRef]
- Flouri, E.; Midouhas, E.; Joshi, H. The role of urban neighbourhood green space in children’s emotional and behavioural resilience. J. Environ. Psychol. 2014, 40, 179–186. [Google Scholar] [CrossRef]
- Andrusaityte, S.; Grazuleviciene, R.; Dedele, A.; Balseviciene, B. The effect of residential greenness and city park visiting habits on preschool Children’s mental and general health in Lithuania: A cross-sectional study. Int. J. Hydrogen Environ. Health 2020, 223, 142–150. [Google Scholar] [CrossRef] [PubMed]
- Putra, I.G.N.E.; Astell-Burt, T.; Cliff, D.P.; Vella, S.A.; Feng, X. Do physical activity, social interaction, and mental health mediate the association between green space quality and child prosocial behaviour? Urban For. Urban Green. 2021, 64, 127264. [Google Scholar] [CrossRef]
- Caughy, M.O.B.; O’Campo, P.J.; Muntaner, C. When being alone might be better: Neighborhood poverty, social capital, and child mental health. Soc. Sci. Med. 2003, 57, 227–237. [Google Scholar] [CrossRef]
- Farrell, A.D.; Bruce, S.E. Impact of exposure to community violence on violent behavior and emotional distress among urban adolescents. J. Clin. Child Psychol. 1997, 26, 2–14. [Google Scholar] [CrossRef]
- Vivier, P.M.; Hauptman, M.; Weitzen, S.H.; Bell, S.; Quilliam, D.N.; Logan, J.R. The important health impact of where a child lives: Neighborhood characteristics and the burden of lead poisoning. Matern. Child Health J. 2011, 15, 1195–1202. [Google Scholar] [CrossRef]
- Kohen, D.E.; Leventhal, T.; Dahinten, V.S.; McIntosh, C.N. Neighborhood disadvantage: Pathways of effects for young children. Child Dev. 2008, 79, 156–169. [Google Scholar] [CrossRef]
- Winslow, E.B.; Shaw, D.S. Impact of neighborhood disadvantage on overt behavior problems during early childhood. Aggress. Behav. Off. J. Int. Soc. Res. Aggress. 2007, 33, 207–219. [Google Scholar] [CrossRef] [PubMed]
- Lanphear, B.P.; Weitzman, M.; Eberly, S. Racial differences in Urban children’s environmental exposures to lead. Am. J. Public Health 1996, 86, 1460–1463. [Google Scholar] [CrossRef] [PubMed]
- Oyana, T.J.; Margai, F.M. Geographic analysis of health risks of pediatric lead exposure: A golden opportunity to promote healthy neighborhoods. Arch. Environ. Occup. Health 2007, 62, 93–104. [Google Scholar] [CrossRef]
- Boutwell, B.B.; Nelson, E.J.; Emo, B.; Vaughn, M.G.; Schootman, M.; Rosenfeld, R.; Lewis, R. The intersection of aggregate-level lead exposure and crime. Environ. Res. 2016, 148, 79–85. [Google Scholar] [CrossRef] [PubMed]
- Bellinger, D.C. Lead neurotoxicity and socioeconomic status: Conceptual and analytical issues. Neurotoxicology 2008, 29, 828–832. [Google Scholar] [CrossRef]
- Peterson, R.D.; Krivo, L.J.; Harris, M.A. Disadvantage and neighborhood violent crime: Do local institutions matter? J. Res. Crime Delinq. 2000, 37, 31–63. [Google Scholar] [CrossRef]
- Vliegenthart, J.; Noppe, G.; Van Rossum, E.; Koper, J.; Raat, H.; Van den Akker, E. Socioeconomic status in children is associated with hair cortisol levels as a biological measure of chronic stress. Psychoneuroendocrinology 2016, 65, 9–14. [Google Scholar] [CrossRef]
- Marshall, A.T.; Betts, S.; Kan, E.C.; McConnell, R.; Lanphear, B.P.; Sowell, E.R. Association of lead-exposure risk and family income with childhood brain outcomes. Nat. Med. 2020, 26, 91–97. [Google Scholar] [CrossRef]
- Tong, S.; McMichael, A.J.; Baghurst, P.A. Interactions between environmental lead exposure and sociodemographic factors on cognitive development. Arch. Environ. Health Int. J. 2000, 55, 330–335. [Google Scholar] [CrossRef]
- Bellinger, D.; Leviton, A.; Waternaux, C.; Needleman, H.; Rabinowitz, M. Low-level lead exposure, social class, and infant development. Neurotoxicology Teratol. 1988, 10, 497–503. [Google Scholar] [CrossRef]
- Ris, M.D.; Dietrich, K.N.; Succop, P.A.; Berger, O.G.; Bornschein, R.L. Early exposure to lead and neuropsychological outcome in adolescence. J. Int. Neuropsychol. Soc. 2004, 10, 261–270. [Google Scholar] [CrossRef] [PubMed]
- Cory-Slechta, D.A.; Virgolini, M.B.; Thiruchelvam, M.; Weston, D.D.; Bauter, M.R. Maternal stress modulates the effects of developmental lead exposure. Environ. Health Perspect. 2004, 112, 717–730. [Google Scholar] [CrossRef] [PubMed]
- Virgolini, M.B.; Chen, K.; Weston, D.D.; Bauter, M.R.; Cory-Slechta, D.A. Interactions of chronic lead exposure and intermittent stress: Consequences for brain catecholamine systems and associated behaviors and HPA axis function. Toxicol. Sci. 2005, 87, 469–482. [Google Scholar] [CrossRef] [PubMed]
- McCormick, R. Does access to green space impact the mental well-being of children: A systematic review. J. Pediatric Nurs. 2017, 37, 3–7. [Google Scholar] [CrossRef]
- Markevych, I.; Tiesler, C.M.; Fuertes, E.; Romanos, M.; Dadvand, P.; Nieuwenhuijsen, M.J.; Berdel, D.; Koletzko, S.; Heinrich, J. Access to urban green spaces and behavioural problems in children: Results from the GINIplus and LISAplus studies. Environ. Int. 2014, 71, 29–35. [Google Scholar] [CrossRef]
- Richardson, E.A.; Pearce, J.; Shortt, N.K.; Mitchell, R. The role of public and private natural space in children’s social, emotional and behavioural development in Scotland: A longitudinal study. Environ. Res. 2017, 158, 729–736. [Google Scholar] [CrossRef]
- Schneider, J.S.; Lee, M.H.; Anderson, D.W.; Zuck, L.; Lidsky, T.I. Enriched environment during development is protective against lead-induced neurotoxicity. Brain Res. 2001, 896, 48–55. [Google Scholar] [CrossRef]
- Cao, X.; Huang, S.; Ruan, D. Enriched environment restores impaired hippocampal long-term potentiation and water maze performance induced by developmental lead exposure in rats. Dev. Psychobiol. 2008, 50, 307–313. [Google Scholar] [CrossRef]
- Guilarte, T.R.; Toscano, C.D.; McGlothan, J.L.; Weaver, S.A. Environmental enrichment reverses cognitive and molecular deficits induced by developmental lead exposure. Ann. Neurol. Off. J. Am. Neurol. Assoc. Child Neurol. Soc. 2003, 53, 50–56. [Google Scholar] [CrossRef]
- Kordas, K.; Queirolo, E.I.; Ettinger, A.S.; Wright, R.O.; Stoltzfus, R.J. Prevalence and predictors of exposure to multiple metals in preschool children from Montevideo, Uruguay. Sci. Total Environ. 2010, 408, 4488–4494. [Google Scholar] [CrossRef]
- Queirolo, E.I.; Ettinger, A.S.; Stoltzfus, R.J.; Kordas, K. Association of anemia, child and family characteristics with elevated blood lead concentrations in preschool children from Montevideo, Uruguay. Arch. Environ. Occup. Health 2010, 65, 94–100. [Google Scholar] [CrossRef] [PubMed]
- Conners, C.K. Conners’ Teacher Rating Scale—Revised (L); Multi-Health Systems: North Tonawanda, NY, USA, 1997. [Google Scholar]
- Gurley, J.R. Conners’ Teacher Rating Scales: Revised. In Encyclopedia of Child Behavior and Development; Goldstein, S., Naglieri, J.A., Eds.; Springer: Boston, MA, USA, 2011; pp. 405–406. [Google Scholar]
- Gioia, G.A.; Isquith, P.K. Behavior Rating Inventory for Executive Functions; Springer: Berlin/Heidelberg, Germany, 2011. [Google Scholar]
- Frndak, S.; Gallo, Y.; Queirolo, E.I.; Barg, G.; Mañay, N.; Kordas, K. A mixed methods study examining neighborhood disadvantage and childhood behavior problems in Montevideo, Uruguay. Int. J. Hydrogen Environ. Health 2021, 235, 113753. [Google Scholar] [CrossRef] [PubMed]
- Roy, A.; Queirolo, E.; Peregalli, F.; Mañay, N.; Martínez, G.; Kordas, K. Association of blood lead levels with urinary F₂-8α isoprostane and 8-hydroxy-2-deoxy-guanosine concentrations in first-grade Uruguayan children. Environ. Res. 2015, 140, 127–135. [Google Scholar] [CrossRef]
- Bradley, R.H.; Caldwell, B.M.; Corwyn, R.F. The Child Care HOME Inventories: Assessing the quality of family child care homes. Early Child. Res. Q. 2003, 18, 294–309. [Google Scholar] [CrossRef]
- Sugland, B.W.; Zaslow, M.; Smith, J.R.; Brooks-Gunn, J.; Coates, D.; Blumenthal, C.; Moore, K.A.; Griffin, T.; Bradley, R. The Early Childhood HOME Inventory and HOME-Short Form in Differing Racial/Ethnic Groups: Are There Differences in Underlying Structure, Internal Consistency of Subscales, and Patterns of Prediction? J. Fam. Issues 1995, 16, 632–663. [Google Scholar] [CrossRef]
- Huang, S.; Tang, L.; Hupy, J.P.; Wang, Y.; Shao, G. A commentary review on the use of normalized difference vegetation index (NDVI) in the era of popular remote sensing. J. For. Res. 2021, 32, 1–6. [Google Scholar] [CrossRef]
- Marta, S. Planet Imagery Product Specifications; Planet Labs: San Francisco, CA, USA, 2018; p. 91. [Google Scholar]
- Sun, J.; Wang, X.; Chen, A.; Ma, Y.; Cui, M.; Piao, S. NDVI indicated characteristics of vegetation cover change in China’s metropolises over the last three decades. Environ. Monit. Assess. 2011, 179, 1–14. [Google Scholar] [CrossRef] [PubMed]
- Intendencia de Montevideo Servicio de Geomática (IMSG). Sistema de Información Geográfica. Available online: https://sig.montevideo.gub.uy/ (accessed on 22 January 2022).
- Bivand, R.; Rundel, C. Rgeos: Interface to Geometry Engine-Open Source (‘GEOS’). 2021. Available online: https://www.semanticscholar.org/paper/Interface-to-Geometry-Engine-Open-Source-(GEOS)-Bivand-Rundel/7e48bc3394a9138a446447f523d71babfef8d96d#paper-header (accessed on 28 July 2022).
- Stekhoven, D.J. missForest: Nonparametric Missing Value Imputation Using Random Forest. R Package Version 1.5. 2022. Available online: https://rdrr.io/cran/missForest/#:~:text=The%20function%20%27missForest%27%20in%20this%20package%20is%20used,categorical%20data%20including%20complex%20interactions%20and%20non-linear%20relations (accessed on 28 July 2022).
- Stekhoven, D.J. Using the missForest Package. R Package. 2011, pp. 1–11. Available online: https://stat.ethz.ch/education/semesters/ss2012/ams/paper/missForest_1.2.pdf (accessed on 28 July 2022).
- Wucherpfennig, F.; Rubel, J.A.; Hofmann, S.G.; Lutz, W. Processes of change after a sudden gain and relation to treatment outcome—Evidence for an upward spiral. J. Consult. Clin. Psychol. 2017, 85, 1199. [Google Scholar] [CrossRef]
- Iddi, S.; Kadengye, D.T.; Kiwuwa-Muyingo, S.; Mutua, M.K.; Asiki, G. Associated factors of pregnancy loss in two urban slums of Nairobi: A generalized estimation equations approach. Glob. Epidemiol. 2020, 2, 100030. [Google Scholar] [CrossRef]
- van Bronswijk, S.C.; Lemmens, L.H.J.M.; Keefe, J.R.; Huibers, M.J.H.; DeRubeis, R.J.; Peeters, F.P.M.L. A prognostic index for long-term outcome after successful acute phase cognitive therapy and interpersonal psychotherapy for major depressive disorder. Depress. Anxiety 2019, 36, 252–261. [Google Scholar] [CrossRef]
- Hemerijckx, L.-M.; Emelen, S.V.; Rymenants, J.; Davis, J.; Verburg, P.H.; Lwasa, S.; Rompaey, A.V. Upscaling household survey data using remote sensing to map socioeconomic groups in kampala, Uganda. Remote Sens. 2020, 12, 3468. [Google Scholar] [CrossRef]
- Bates, D.; Sarkar, D.; Bates, M.D.; Matrix, L. The lme4 package. R Package Version 2007, 2, 74. [Google Scholar]
- Raykov, T.; Marcoulides, G.A. Intraclass correlation coefficients in hierarchical design studies with discrete response variables: A note on a direct interval estimation procedure. Educ. Psychol. Meas. 2015, 75, 1063–1070. [Google Scholar] [CrossRef] [PubMed]
- Pihlakoski, L.; Sourander, A.; Aromaa, M.; Rautava, P.; Helenius, H.; Sillanpää, M. The continuity of psychopathology from early childhood to preadolescence: A prospective cohort study of 3-12-year-old children. Eur. Child. Adolesc. Psychiatry 2006, 15, 409–417. [Google Scholar] [CrossRef]
- Reef, J.; Diamantopoulou, S.; van Meurs, I.; Verhulst, F.C.; van der Ende, J. Developmental trajectories of child to adolescent externalizing behavior and adult DSM-IV disorder: Results of a 24-year longitudinal study. Soc. Psychiatry Psychiatr. Epidemiol. 2011, 46, 1233–1241. [Google Scholar] [CrossRef]
- Searight, H.R.; Rottnek, F.; Abby, S. Conduct disorder: Diagnosis and treatment in primary care. Am. Fam. Physician 2001, 63, 1579. [Google Scholar]
- Frick, P.J.; Nigg, J.T. Current Issues in the Diagnosis of Attention Deficit Hyperactivity Disorder, Oppositional Defiant Disorder, and Conduct Disorder. Annu. Rev. Clin. Psychol. 2012, 8, 77–107. [Google Scholar] [CrossRef]
- Moffitt, T.E.; Caspi, A.; Rutter, M.; Silva, P.A. Sex Differences in Antisocial Behaviour: Conduct Disorder, Delinquency, and Violence in the Dunedin Longitudinal Study; Cambridge University Press: Cambridge, UK, 2001. [Google Scholar]
- Pagani, L.S.; Fitzpatrick, C.; Archambault, I.; Janosz, M. School readiness and later achievement: A French Canadian replication and extension. Dev. Psychol. 2010, 46, 984–994. [Google Scholar] [CrossRef]
- Feiss, R.; Dolinger, S.B.; Merritt, M.; Reiche, E.; Martin, K.; Yanes, J.A.; Thomas, C.M.; Pangelinan, M. A Systematic Review and Meta-Analysis of School-Based Stress, Anxiety, and Depression Prevention Programs for Adolescents. J. Youth Adolesc. 2019, 48, 1668–1685. [Google Scholar] [CrossRef]
- Sisterhen, L.L.; Wy, P.A.W. Temper Tantrums. [Updated 27 June 2022]. In StatPearls; StatPearls Publishing: Treasure Island, FL, USA, 2022. Available online: https://www.ncbi.nlm.nih.gov/books/NBK544286/ (accessed on 28 July 2022).
- Österman, K.; Björkqvist, K. A cross-sectional study of onset, cessation, frequency, and duration of children’s temper tantrums in a nonclinical sample. Psychol. Rep. 2010, 106, 448–454. [Google Scholar] [CrossRef]
- Granero, R.; Louwaars, L.; Ezpeleta, L. Socioeconomic status and oppositional defiant disorder in preschoolers: Parenting practices and executive functioning as mediating variables. Front. Psychol. 2015, 6, 1412. [Google Scholar] [CrossRef] [PubMed]
- Travis, S.C.; Aga, D.S.; Queirolo, E.I.; Olson, J.R.; Daleiro, M.; Kordas, K. Catching flame retardants and pesticides in silicone wristbands: Evidence of exposure to current and legacy pollutants in Uruguayan children. Sci. Total Environ. 2020, 740, 140136. [Google Scholar] [CrossRef] [PubMed]
- Vuong, A.M.; Yolton, K.; Dietrich, K.N.; Braun, J.M.; Lanphear, B.P.; Chen, A. Exposure to polybrominated diphenyl ethers (PBDEs) and child behavior: Current findings and future directions. Horm. Behav. 2018, 101, 94–104. [Google Scholar] [CrossRef] [PubMed]
- Ingoldsby, E.M.; Shaw, D.S. Neighborhood Contextual Factors and Early-Starting Antisocial Pathways. Clin. Child Fam. Psychol. Rev. 2002, 5, 21–55. [Google Scholar] [CrossRef] [PubMed]
- Rakesh, D.; Seguin, C.; Zalesky, A.; Cropley, V.; Whittle, S. Associations Between Neighborhood Disadvantage, Resting-State Functional Connectivity, and Behavior in the Adolescent Brain Cognitive Development Study: The Moderating Role of Positive Family and School Environments. Biol. Psychiatry Cogn. Neurosci. Neuroimaging 2021, 6, 877–886. [Google Scholar] [CrossRef]
- Vazsonyi, A.T.; Cleveland, H.H.; Wiebe, R.P. Does the effect of impulsivity on delinquency vary by level of neighborhood disadvantage? Crim. Justice Behav. 2006, 33, 511–541. [Google Scholar] [CrossRef]
- Madzia, J.; Ryan, P.; Yolton, K.; Percy, Z.; Newman, N.; LeMasters, G.; Brokamp, C. Residential Greenspace Association with Childhood Behavioral Outcomes. J. Pediatrics 2019, 207, 233–240. [Google Scholar] [CrossRef]
- McEachan, R.R.; Yang, T.C.; Roberts, H.; Pickett, K.E.; Arseneau-Powell, D.; Gidlow, C.J.; Wright, J.; Nieuwenhuijsen, M. Availability, use of, and satisfaction with green space, and children’s mental wellbeing at age 4 years in a multicultural, deprived, urban area: Results from the Born in Bradford cohort study. Lancet Planet. Health 2018, 2, e244–e254. [Google Scholar] [CrossRef]
- Lee, M.; Kim, S.; Ha, M. Community greenness and neurobehavioral health in children and adolescents. Sci. Total Environ. 2019, 672, 381–388. [Google Scholar] [CrossRef]
- Roubinov, D.S.; Boyce, W.T. Parenting and SES: Relative values or enduring principles? Curr. Opin. Psychol. 2017, 15, 162–167. [Google Scholar] [CrossRef]
- Cory-Slechta, D.A.; Virgolini, M.B.; Rossi-George, A.; Thiruchelvam, M.; Lisek, R.; Weston, D. Lifetime Consequences of Combined Maternal Lead and Stress. Basic Clin. Pharmacol. Toxicol. 2008, 102, 218–227. [Google Scholar] [CrossRef] [PubMed]
- Navarrete, M.; Austin, A. Capital Murder: 2019 Homicide Rates in Latin America’s Capital Cities. InSight Crime 2020. Available online: https://insightcrime.org/news/analysis/2019-homicides-latin-america-capital/ (accessed on 28 July 2022).
- Mels, C.; Lagoa, L.; Cuevasanta, D. Exploring exposure to intertwined community violence among Uruguayan adolescents using a mixed-method approach. J. Community Psychol. 2022, 50, 1155–1172. [Google Scholar] [CrossRef] [PubMed]
- Gatzke-Kopp, L.M.; Warkentien, S.; Willoughby, M.; Fowler, C.; Folch, D.C.; Blair, C. Proximity to sources of airborne lead is associated with reductions in Children’s executive function in the first four years of life. Health Place 2021, 68, 102517. [Google Scholar] [CrossRef] [PubMed]
- Leslie, E.; Sugiyama, T.; Ierodiaconou, D.; Kremer, P. Perceived and objectively measured greenness of neighbourhoods: Are they measuring the same thing? Landsc. Urban Plan. 2010, 95, 28–33. [Google Scholar] [CrossRef]
- Song, H.; Lane, K.J.; Kim, H.; Kim, H.; Byun, G.; Le, M.; Choi, Y.; Park, C.R.; Lee, J.-T. Association between urban greenness and depressive symptoms: Evaluation of greenness using various indicators. Int. J. Environ. Res. Public Health 2019, 16, 173. [Google Scholar] [CrossRef]
- Chambers, T.; Pearson, A.; Kawachi, I.; Rzotkiewicz, Z.; Stanley, J.; Smith, M.; Mhurchu, C.N.; Signal, L. Kids in space: Measuring children’s residential neighborhoods and other destinations using activity space GPS and wearable camera data. Soc. Sci. Med. 2017, 193, 41–50. [Google Scholar] [CrossRef]
- Yin, L.; Raja, S.; Li, X.; Lai, Y.; Epstein, L.; Roemmich, J. Neighbourhood for Playing: Using GPS, GIS and Accelerometry to Delineate Areas within which Youth are Physically Active. Urban Stud. 2013, 50, 2922–2939. [Google Scholar] [CrossRef]

| Variables | BRIEF Analytical Sample | BRIEF Non-Selected Participants | CTRS-R:S Analytical Sample | CTRS-R:S Non-Selected Participants | ||||||
|---|---|---|---|---|---|---|---|---|---|---|
| Covariates | Statistic | n | Statistic | n | Standard Difference | n | n | Standard Difference | ||
| % Male | 55.1% | 448 | 49.0% | 237 | phi = 0.06 | 53.9% | 362 | 52.0% | 323 | phi = 0.02 |
| Age in Months, Mean (SD) | 81.7 (6.08) ** | 448 | 83.2 (6.02) | 236 | d = 0.25 | 81.4 (6.18) *** | 362 | 83.1 (5.88) | 322 | d = 0.28 |
| Maternal Education in Years, Mean (SD) | 8.6 (2.52) | 442 | 8.2 (2.40) | 228 | d = 0.16 | 8.7 (2.49) ** | 356 | 8.2 (2.47) | 314 | d = 0.20 |
| Number of Possessions of Wealth, Mean (SD) | 2.9 (1.34) * | 427 | 2.7 (1.26) | 223 | d = 0.15 | 3.0 (1.36) * | 341 | 2.7 (1.27) | 309 | d = 0.23 |
| HOME Inventory Score, Mean (SD) | 41.7 (9.31) ** | 379 | 38.9 (11.15) | 201 | d = 0.27 | 42.1 (8.88) *** | 298 | 39.3 (11.02) | 282 | d = 0.28 |
| Mother Employed (% Yes) | 62.7% | 394 | 57.6% | 203 | phi = 0.05 | 64.6% | 316 | 56.9% | 281 | phi = 0.08 |
| Either Caregiver Smokes (% Yes) | 60.2% | 425 | 63.9% | 227 | phi = 0.04 | 58.1% | 339 | 65.2% | 313 | phi = 0.07 |
| Hemoglobin (g/dL), Mean (SD) | 13.2 (0.95) | 447 | 13.2 (0.88) | 234 | d = 0.00 | 13.2 (1.00) | 360 | 13.2 (0.86) | 321 | d = 0.0 |
| Body Mass Index, Mean (SD) | 16.8 (2.66) | 444 | 16.8 (2.60) | 234 | d = 0.00 | 16.7 (2.54) | 360 | 16.9 (2.75) | 318 | d = 0.08 |
| Population in Census Segment, Mean (SD) | 2240.5 (1412.2) | 448 | 2097.4 (1412.2) | 237 | d = 0.10 | 2282.2 (1132.2) * | 362 | 2088.7 (1339.6) | 323 | d = 0.16 |
| Primary Exposure | ||||||||||
| % Blood Lead ≥ 2 µg/dL | 52.0% | 448 | 44.7% | 237 | phi = 0.07 | 60.2%*** | 362 | 37.5% | 323 | phi = 0.23 |
| Effect Modifiers | ||||||||||
| Neighborhood Dis., Mean (SD) | 1.66 (1.19) *** | 448 | 1.10 (0.93) | 237 | d = 0.52 | 1.64 (1.19) *** | 362 | 1.28 (1.04) | 323 | d = 0.32 |
| Nearest Greenspace (km), Mean (SD) | 0.22 (0.19) *** | 448 | 0.29 (0.22) | 237 | d = 0.34 | 0.21 (0.20) *** | 362 | 0.27 (0.21) | 323 | d = 0.29 |
| NDVI 150 Meter Buffer, Mean (SD) | 0.34 (0.08) | 448 | 0.33 (0.08) | 237 | d = 0.0 | 0.34 (0.08) * | 362 | 0.32 (0.08) | 323 | d = 0.25 |
| Outcome | ||||||||||
| BREIF Inhibitory Control Problems, Mean (SD) | 56.8 (14.88) | 448 | - | - | - | - | - | |||
| BRIEF Planning/Org. Problems, Mean (SD) | 52.7 (12.04) | 448 | - | - | - | - | - | |||
| CTRS-R:S Oppositional Behavior, Mean (SD) | - | - | - | 53.4 (13.10) | - | - | ||||
| CTRS-R:S Cognitive Problems, Mean (SD) | - | - | - | 54.0 (12.81) | - | - | ||||
| CTRS-R:S Hyperactivity, Mean (SD) | - | - | - | 53.8 (12.28) | - | - | ||||
| CTRS-R:S ADHD Index, Mean (SD) | - | - | - | 54.1 (11.79) | - | - | ||||
| Variables | Caregiver Child Behavior Report Analytical Sample | Caregiver Child Behavior Report Non-Selected Participants | |||
|---|---|---|---|---|---|
| Covariates | Statistic | n | Statistic | n | Standard Difference |
| % Male | 49.5% | 380 | 55.8% | 52 | phi = 0.04 |
| Age in Months, Mean (SD) | 82.94 (5.74) | 380 | 84.39 (6.02) | 51 | d = 0.25 |
| Maternal Education in Years, Mean (SD) | 8.07 (2.32) | 375 | 7.78 (2.40) | 49 | d = 0.12 |
| Number of Possessions of Wealth, Mean (SD) | 2.53 (1.30) | 377 | 2.76 (1.05) | 42 | d = 0.19 |
| HOME Inventory Score, Mean (SD) | 37.79 (10.29) | 314 | 39.70 (1.45) | 47 | d = 0.26 |
| Mother Employed (% Yes) | 55.5% | 312 | 54.4% | 46 | phi = 0.01 |
| Either Caregiver Smokes (% Yes) | 66.3% | 380 | 55.8% | 43 | phi = 0.07 |
| Hemoglobin (g/dL), Mean (SD) | 13.30 (0.79) | 379 | 13.14 (0.90) | 50 | d = 0.24 |
| Body Mass Index, Mean (SD) | 16.81 (2.72) | 376 | 16.78 (2.25) | 50 | d = 0.01 |
| Population in Census Segment, Mean (SD) | 2369.30 (1433.55) ** | 380 | 1694.98 (871.98) | 52 | d = 0.57 |
| Primary Exposure | |||||
| % Blood Lead ≥ 2 µg/dL | 34.0% | 380 | 23.1% | 52 | phi = 0.08 |
| Effect Modifiers | |||||
| Neighborhood Dis., Mean (SD) | 1.20 (1.00) | 380 | 1.49 (1.10) | 52 | d = 0.28 |
| Nearest Greenspace (km), Mean (SD) | 0.26 (0.20) | 380 | 0.29 (0.26) | 52 | d = 0.13 |
| NDVI 150 Meter Buffer, Mean (SD) | 0.33 (0.08) | 380 | 0.34 (0.09) | 52 | d = 0.12 |
| Outcome | |||||
| % Tantrums Almost Every Day | 32.9% | 380 | - | - | - |
| % Parental Conflicts Frequently | 35.5% | 380 | - | - | - |
| Effect Modifier: Neighborhood Disadvantage | Effect Modifier: NDVI | Effect Modifier: Nearest Greenspace (Deciles) | ||||
|---|---|---|---|---|---|---|
| Caregiver Report Follow-Up Model Variables | Direct Effects Model | Interaction Term Model | Direct Effects Model | Interaction Term Model | Direct Effects Model | Interaction Term Model |
| OR (CI) | OR (CI) | OR (CI) | OR (CI) | OR (CI) | OR (CI) | |
| Tantrums Almost Every Day | ||||||
| Blood Lead ≥ 2 µg/dL | 1.7 (1.1, 2.8) ± | 1.8 (0.85, 4.01) | 1.8 (1.1, 2.8) * | 0.4 (0.06, 3.41) | 1.7 (1.10, 2.80) * | 3.96 (1.37, 11.45) * |
| Neighborhood Disadvantage | 1.0 (0.79, 1.21) | 1.0 (0.76, 1.31) | - | - | - | - |
| Blood Lead * Neighborhood Dis. | - | 1.0 (0.63, 1.44) | - | - | - | - |
| NDVI (x100) | - | - | 1.03 (1.0, 1.06) * | 1.0 (0.98, 1.05) | - | - |
| Blood Lead * NDVI | - | - | - | 1.0 (0.98, 1.11) | - | - |
| Nearest Greenspace (deciles) | - | - | - | - | 1.04 (0.96, 1.13) | 1.1 (1.01, 1.23) * |
| Blood Lead * Greenspace | - | - | - | - | - | 0.87 (0.74, 1.02) ± |
| Parental Conflicts Frequently | ||||||
| Blood Lead ≥ 2 µg/dL | 1.0 (0.88, 1.20) | 0.9 (0.44, 1.94) | 1.1 (0.69, 1.75) | 1.1 (0.17, 7.60) | 1.1 (0.68, 1.72) | 2.33 (0.84, 6.43) |
| Neighborhood Disadvantage | 0.8 (0.64, 0.98) * | 0.8 (0.59, 0.99) * | - | - | - | - |
| Blood Lead * Neighborhood Dis. | - | 1.1 (0.73, 1.68) | - | - | - | - |
| NDVI (x100) | - | - | 1.02 (0.99, 1.05) | 1.02 (0.99, 1.06) | - | - |
| Blood Lead * NDVI | - | - | - | 1.0 (0.94, 1.06) | - | - |
| Nearest Greenspace (deciles) | - | - | - | - | 1.0 (0.92, 1.10) | 1.0 (0.95, 1.14) |
| Blood Lead * Greenspace | - | - | - | - | - | 0.9 (0.75, 1.03) ± |
Publisher’s Note: MDPI stays neutral with regard to jurisdictional claims in published maps and institutional affiliations. |
© 2022 by the authors. Licensee MDPI, Basel, Switzerland. This article is an open access article distributed under the terms and conditions of the Creative Commons Attribution (CC BY) license (https://creativecommons.org/licenses/by/4.0/).
Share and Cite
Frndak, S.; Barg, G.; Queirolo, E.I.; Mañay, N.; Colder, C.; Yu, G.; Ahmed, Z.; Kordas, K. Do Neighborhood Factors Modify the Effects of Lead Exposure on Child Behavior? Toxics 2022, 10, 517. https://doi.org/10.3390/toxics10090517
Frndak S, Barg G, Queirolo EI, Mañay N, Colder C, Yu G, Ahmed Z, Kordas K. Do Neighborhood Factors Modify the Effects of Lead Exposure on Child Behavior? Toxics. 2022; 10(9):517. https://doi.org/10.3390/toxics10090517
Chicago/Turabian StyleFrndak, Seth, Gabriel Barg, Elena I. Queirolo, Nelly Mañay, Craig Colder, Guan Yu, Zia Ahmed, and Katarzyna Kordas. 2022. "Do Neighborhood Factors Modify the Effects of Lead Exposure on Child Behavior?" Toxics 10, no. 9: 517. https://doi.org/10.3390/toxics10090517
APA StyleFrndak, S., Barg, G., Queirolo, E. I., Mañay, N., Colder, C., Yu, G., Ahmed, Z., & Kordas, K. (2022). Do Neighborhood Factors Modify the Effects of Lead Exposure on Child Behavior? Toxics, 10(9), 517. https://doi.org/10.3390/toxics10090517