Article

Indoor Air Quality Monitoring and Characterization of Airborne Workstations Pollutants within Detergent Production Plant

by
John Stephen Gushit
1,
Salamatu Uba Mohammed
1,2 and
Haruna Musa Moda
3,*
1
Department of Chemistry, University of Jos, Jos 930001, Nigeria
2
NASCO Household Products Limited, 44 Yakubu Gowon Way, Jos 930001, Nigeria
3
Department of Health Professions, Manchester Metropolitan University, Manchester M15 6BG, UK
*
Author to whom correspondence should be addressed.
Toxics 2022, 10(8), 419; https://doi.org/10.3390/toxics10080419
Submission received: 4 July 2022 / Revised: 19 July 2022 / Accepted: 21 July 2022 / Published: 26 July 2022

Abstract

:
The indoor air quality (IAQ) of five workstations within a detergent production unit was monitored. Particulate matter (PM) was measured using a gravitational settlement method, and later characterized. To ascertain the quality of indoor air within the workstations, which could directly or indirectly affect the health and performance of the workers, a physical inspection of the plant premises was undertaken. The mean value of the following air-quality parameters; particulate matter(PM2.5), particulate matter (PM10), formaldehyde (HCHO), volatile organic compounds (VOCs), carbon dioxide (CO2), temperature (T) and percent relative humidity (%RH) were obtained within the range of 24.5–48.5 µg/m3, 26.75–61.75 µg/m3, 0.0–0.012 mg/m3, 0.09–1.35 mg/m3, 1137–1265 ppm, 25.65–28.15 °C and 20.13–23.8%, respectively. Of the particulate matter components characterized, sodium oxide (Na2O)—25.30 mg/m3, aluminum oxide (Al2O3)—22.93 mg/m3, silicon dioxide (SiO2)—34.17 mg/m3, sulfur trioxide (SO3)—41.57 mg/m3, calcium oxide (CaO)—10.94 mg/m3 and iron III oxide (Fe2O3)—19.23 mg/m3, were of significance. These results, compared with international standards for industrial indoor air quality, suggest that indoor air contamination emanating from the chemicals used in production workstations is traced to the design of the plant structures and the activities carried out within the workstations.

1. Introduction

Indoor air quality (IAQ) is a measure of how clean the air is inside the buildings in which we work, live, or play. This is influenced by factors that include building material types and furniture, the building’s ventilation system, the chemicals that are used and created by the activities carried out within the building, etc. [1]. According to the United States Environmental Protection Agency (USEPA) [2], the indoor air we breathe can put us at risk for health-related problems, since most of our time is spent indoors. Previous studies have reported that industrial exposure to surfactants and detergents is associated with asthma and other adverse health effects [3,4,5]. Health risks such as irritation to the eye, nose, and throat, coughing, asthma and cancer, are based on short- and long-term exposures to pollutants in the indoor air, as well as the physiological health status of the population at risk, and the thermal conditions within the environment. In extreme cases, exposure to indoor air pollutants (IAPs) can even cause death [6,7]. Aside from inhalation, these IAPs can enter the body through hand-to-mouth contact and dermal exposure [7].
Past studies have reviewed the harmful effects of exposure to some IAPs; particulate matter (PM) pollutants such as suspended dust and reactive products from industrial chemicals were found to have association with work-related respiratory incidences such as pneumonia and bronchitis [8]. Heavy metals associated with PM can be cumulative in nature, causing hepatic cell destruction and lung inflammation [9]. Biological pollutants such as molds, viruses and bacteria which grow in damp and warm environments have caused sneezing, coughs, and shortness of breath, and triggered allergic reactions such as rhinitis [10]. Building materials, furniture, cleaning products and personal care products are some indoor sources of VOCs such as benzene, limonene and trihalomethanes. Some of these VOCs are known or suspected to cause cancer in humans [7,11]. Carbonyl compounds, as described by Diodu et al. [12], affect human health as primary irritants of the mucous membranes of the eyes, the upper respiratory tract, and the skin. This also occurs indoors as secondary emissions from pesticides, consumer products and building materials [7]. Similarly, carbon monoxide (CO) is found indoors in fumes because of incomplete combustion from burning fuels in small engines, gas ranges and furnaces. Common symptoms of CO poisoning are headache, dizziness, weakness, and chest pain. It is an odorless, colorless gas that can kill [8]. On the other hand, carbon dioxide (CO2) gas is not considered to pose serious health challenges to occupants at elevated concentrations. However, it can cause drowsiness, lethargy and gives a general sense that the air is stale. The indoor sources of CO2 are associated with human respiration and combustion activities [7,13]. Other IAPs include ozone, explosive gases such as methane, nitrogenous compounds, radioactive particles, and other gases [14,15].
The present study was undertaken after numerous complaints from employees of the detergent plant received by the health, safety, and environment (HSE) committee, due to inhalation of suspected substances present in the indoor air that led to workers experiencing irritation of the nose, throat, and eyes, leading to sneezing, coughs and difficulty breathing. This was especially prevalent after a prolonged stay in the workstations where raw materials associated with detergent production were handled, with resultant releases of gases, vapor, and particulate matter (PM) into the immediate and extended environments, which acts as primary source of IAPs. Research works on indoor air quality concerning detergent industries are very sparse in Nigeria, if available at all; as such, the study monitored and characterized the indoor air of workstations within a detergent plant to ascertain the air quality.

2. Materials and Methods

Study Design and Measurements

The study area is the detergent unit of NASCO Household Products Limited (NHPL) Jos, located in the Jos South Local Government Area of Plateau State, Nigeria (Figure 1) [16]. It is geographically enclosed within latitude 9°52′27″ N and longitude 8°52′24″ E [17]. NHPL is one of the several distinct business divisions of the NASCO Group of Companies. It was established in 1973 as the detergent, soap, and cosmetic unit of the Group, manufacturing a variety of products as well as industrial chemicals, providing employment and livelihood to hundreds of employees across Nigeria [18,19]. The plant is located 80 m from a busy road, with heavy carriage of assorted vehicles and 2 km from a major stream, which is the water source for irrigation and other agricultural purposes (Figure 2).
The workstations were labeled the bulk pack area (BPA), bulk oversize area (BOA), first floor area (FFA), small pack area (SPA) and batch slurry process (BSP), according to the activities carried out within them. These workstations, which house a minimum of 59 and maximum of 137 workers (Table 1 and Table 2), are enclosures, each within a larger hall of not less than 800 m2 in area. The hall housing the BPA, BOA and FFA shares a wall lengthwise to the hall housing the SPA, while the hall housing the SPA is parallel to that housing the BSP. The FFA occupies an area of 200 m2 on the first floor of the building, directly above the BPA and BOA as stated in Table 1. These workstations are naturally ventilated via vent openings on the lengthwise sides, doors, and large gate, as shown in Figure 3. The plant has assorted brands of products such as Brytex, Bonus and Action (detergents) formulated from chemical substances such as linear alkyl benzene sulfonate, sodium salts, zeolites, speckles, sodium carboxy methyl cellulose, perfumes of interest (mostly citrus based), copolymers, enzymes, and optical brighteners. The criteria used to assign the workstations hinged upon the functionality of the workstations at the time of the research and the involvement of two or more persons at each workstation during normal operations. Selection and measurements were carried out following the Occupational Safety Health Administration (OSHA) guidelines on indoor air quality investigation [20] and that of the National Environmental Standards Regulations Enforcement Agency (NESREA) (schedule XI regulation 18(3)) of Nigeria [21]. Measurements were carried out between 8 of October and 9 November 2018, which was within the peak period of production in the industry. An eight (8)-hour sampling period was adopted (schedule VI regulations 14, 19) between the hours of 9:00 a.m. and 5:00 p.m. which are the peak office hours. The natural ventilation makeup of the plant was considered sufficient and adequate for supplying fresh air to dilute pollutants for acceptable IAQ [20]. For this reason, air flow rates/infiltration rates through the workstations were not measured in this study.
Spot measurements for IAQ parameters were taken using a calibrated real-time air-monitoring device (Air Master AM7) [22]. To simulate the average human breathing zone, the monitoring device was positioned at a height of 1.7 m close to each monitored workstation where activities are undertaken (Figure 3). Surrogate measurements were carried out at a four time slots [21] and obtained values were recorded.
A modified method of gravitational settlement was used to collect PM for characterization, bearing in mind that PM concentration is affected by meteorological, physical, and chemical factors [23]. The test and re-test of reliability measurements were carried out prior to sampling to ascertain the reliability and validity of the method [24]. In this method, a high-grade Whatman 542 hardened ashless filter paper of 124 mm diameter was put into a 200 mL volume, 155 mm diameter porcelain crucible after preconditioning for 24 h. These were suspended on a platform about 1.2 m from the floor, corresponding to the breathing zone level of the workforce [21]. The sampling frequency was thrice a week for each sampling site. At the end of each 8 h, the filter paper containing settled PMs was collected and kept in labeled envelopes, sealed, and stored in a plastic carrier. PMs collected for each site were stored separately in sterile bags [23] and maintained at room temperature prior to the characterization using Energy Dispersive X-ray Fluorescence (ED-XRF Model X-Supreme 8000), a multi-sample bench analyzer. The equipment was calibrated using standard references for each element supplied by the National Institute of Standards and Technology (NIST) to obtain the X-ray intensity for each element of interest. It functions on the principle of excitation at an atomic level. As the elements return to their initial state, they emit characteristic X-ray photons, which can be detected and quantified. A calibration line is achieved and used to perform quantitative analysis [25].
A mineral analysis method covering a data series of the element’s sodium to Chlorine, within the X-ray energy range of 22 KV was used. About 15 g of each sample was taken into a 40 mm diameter plastic sample cup and covered with plastic support films to ensure a flat homogeneous surface. These “compact” sample cups were placed into the sample carousel of the instrument and allowed to run for 5 min. Calculated results were displayed on the monitor and the precision was calculated from repeated measurements of the NIST standards [25,26,27].

3. Statistical Analysis

The Statistical Package for Social Scientist (SPSS, Version 21) was used in the analysis of the data obtained, which provided both descriptive and inferential meaning to the study. The decision p < 0.05 was considered significant at 95% confidence level. Pearson moment correlation analysis was also performed within and between the variables at a significant level of 0.01.

4. Results

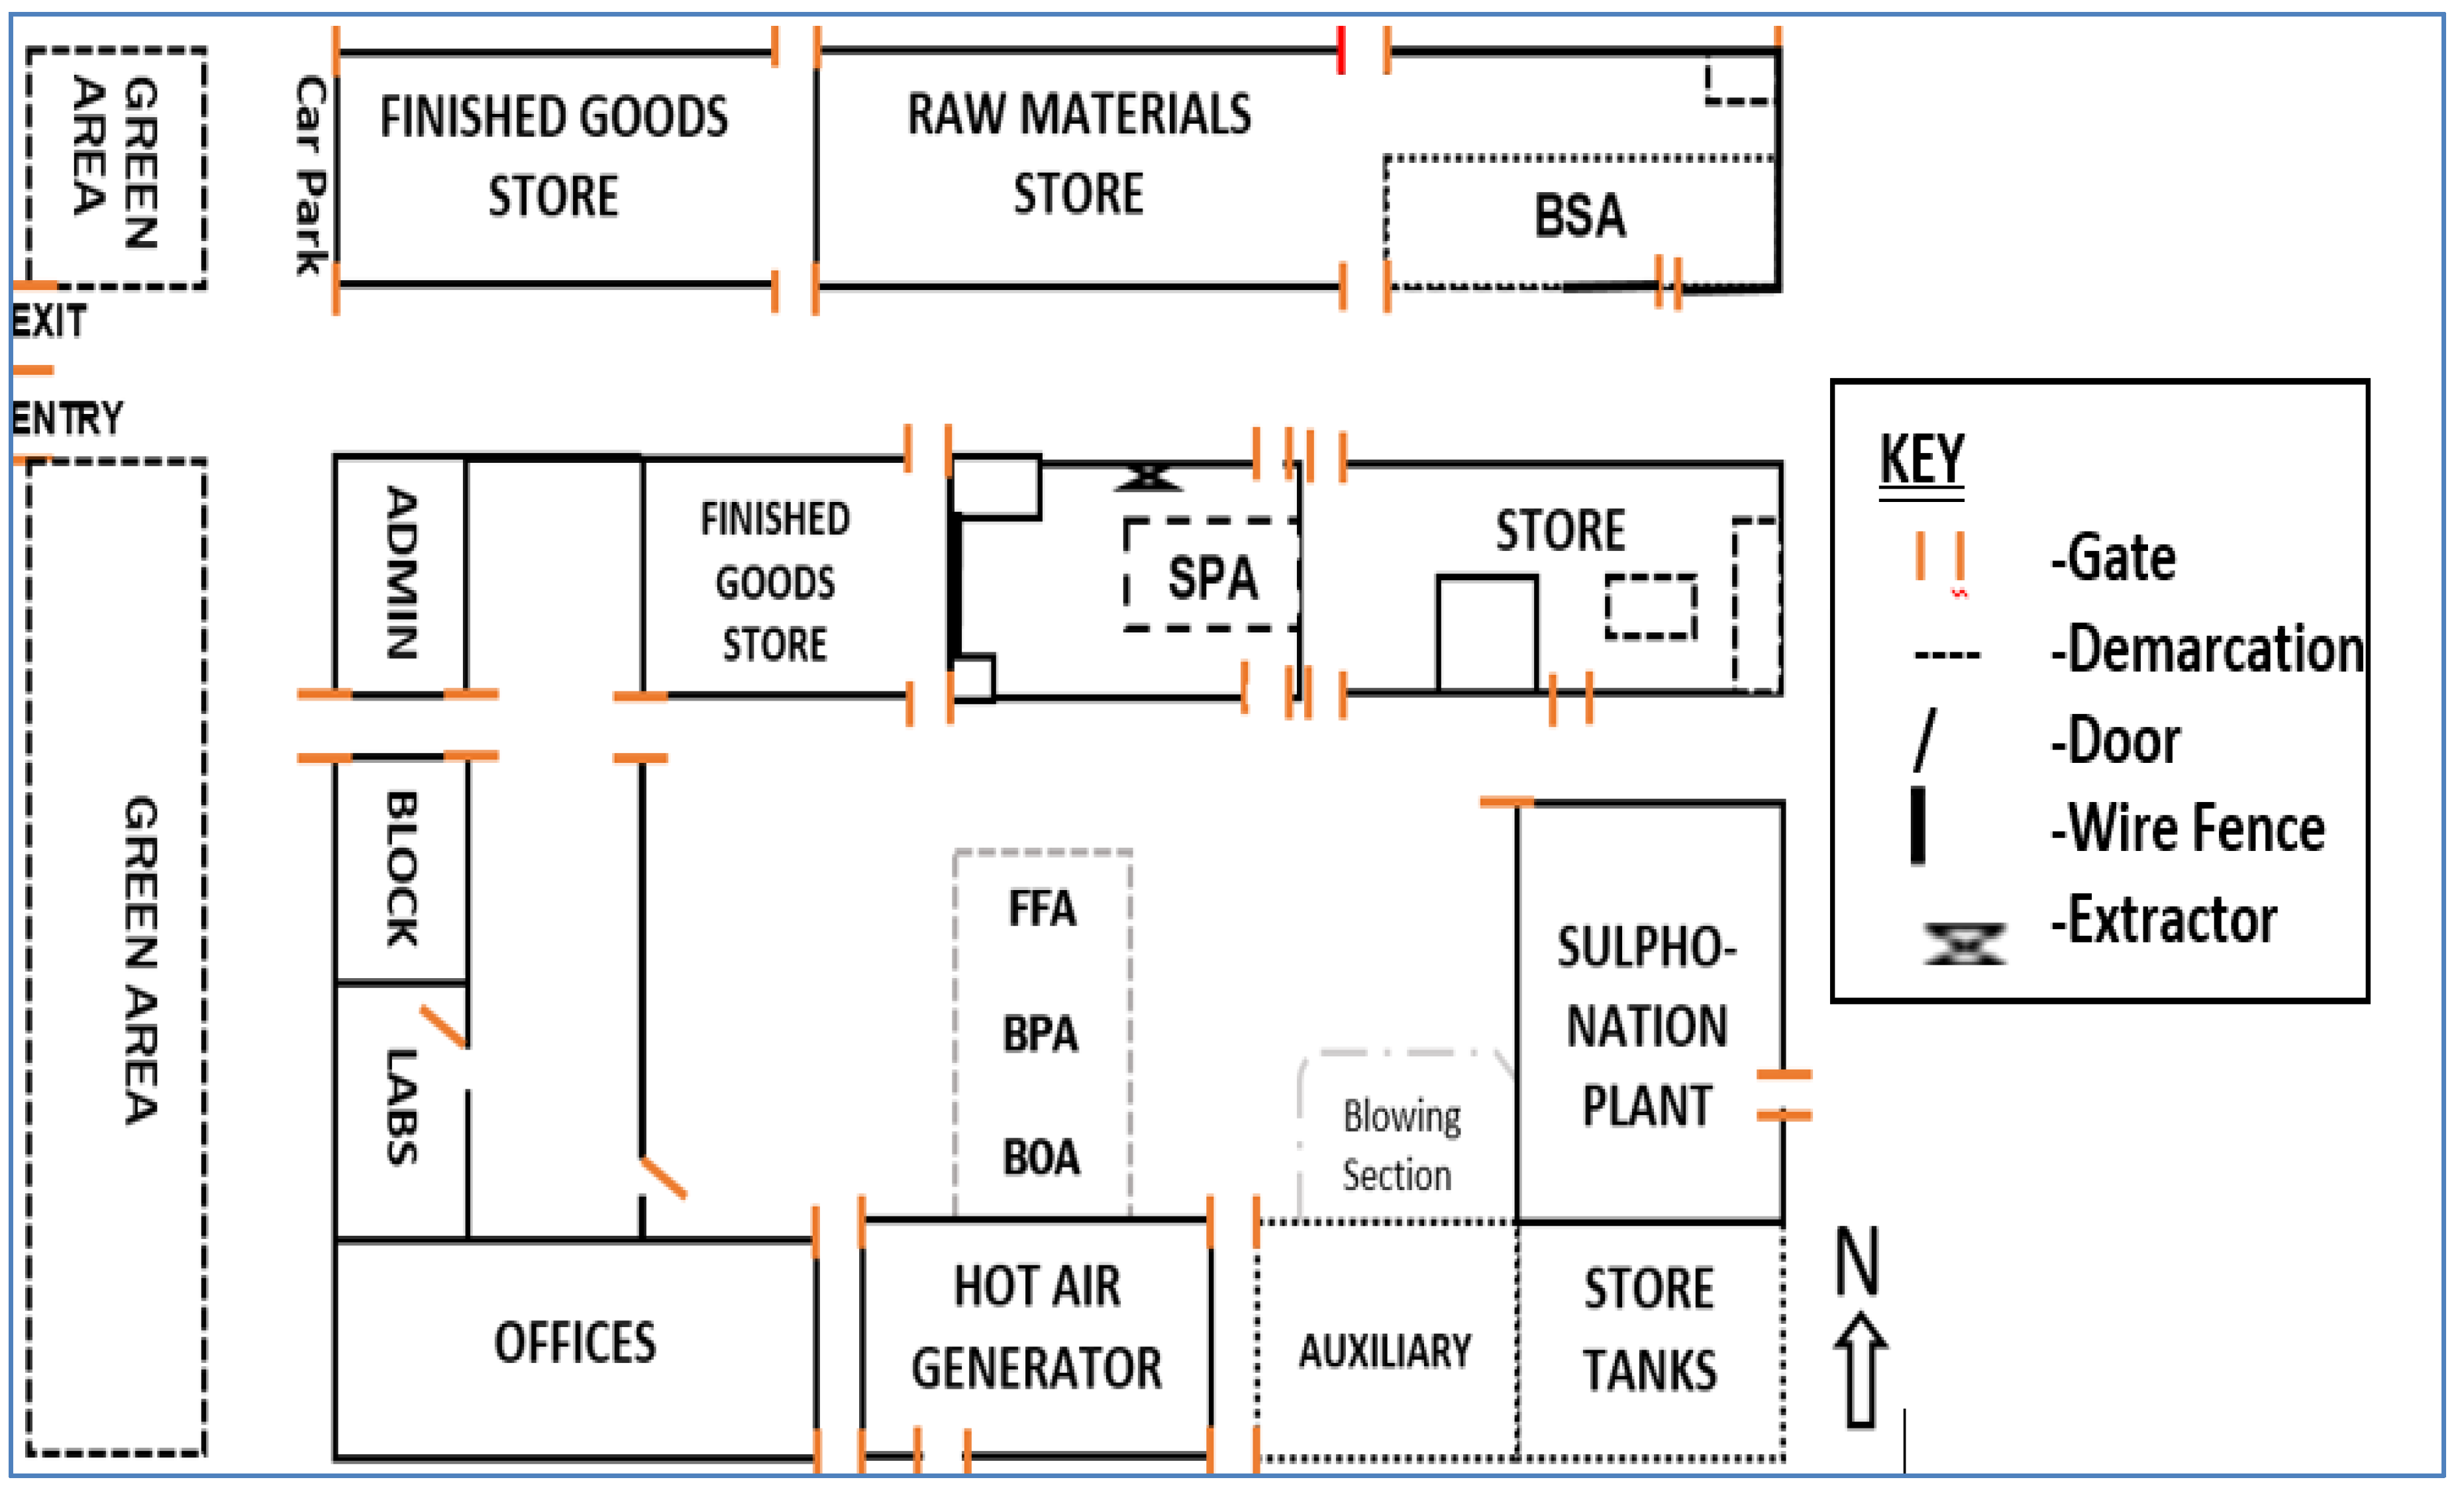
4.1. Visual Assessment of Workstation

Based on the physical observation undertaken, several staff were observed using recommended PPE inappropriately at some point, thereby increasing the exposure likelihood of fugitive pollutant arising from apparatus during use, either due to faulty equipment, leakage, or other unforeseen mishaps. In addition, existing ventilation equipment were in operation, although it was observed that a mobile LEV is needed to cater for certain activities, such as measurement and emptying of bulk materials to minimize dispersal of escaped materials into the immediate work environment.

4.2. PM2.5, PM10, Formaldehyde and Temperature—The FFA

From Table 3, the FFA presented the highest concentrations for PM2.5, PM10, formaldehyde (HCHO) and temperature (T) as 48.5 ± 6.25 µg/m3, 61.75 ± 9.53 µg/m3, 0.0125 ± 0.00 mg/m3 and 28.15 ± 0.1 °C, respectively. The characteristic of the sampling point area is that it is closest to corrugated zinc roofing, which is in direct contact with the sun’s rays. This platform is separated from the auxiliary section beside it by large vents, in which alkaline sodium silicate is being dissolved at a high temperature (1200 °C) in an autoclave and stored in high-volume tanks for use. The platform also holds varieties of perfumed powders. These activities create steam, heat, mist, and dust [22,24], which informs the highest PM concentrations and temperature recorded. PMs have been found to increase the prevalence and incidences of bronchitis, cough, and deficiency in lung function; PM2.5 can penetrate deeply into the alveolar region of the lungs [28]. The International Agency for Research on cancer has classified PMs as carcinogenic to humans [29]. Concentrations of PM2.5 for the workstations were thus: FFA (48.50 µg/m3) > BPA (44.00 µg/m3) > BSP (38.25 µg/m3) > SPA (28.75 µg/m3) > BOA (24.50 µg/m3). Meanwhile, the concentrations for PM10 followed a similar trend for PM2.5, indicating the concentrations of 61.75 µg/m3 > 54.00 µg/m3 > 45.25 µg/m3 > 33.75 µg/m3 > 26.75 µg/m3 for FFA, BPA, BSP, SPA and BOA, respectively (Table 3). In addition to the BPA, which had the next large concentrations of PMs and formaldehyde after the FFA, is the BOA located to the south of the area, which is separated only by pillars. Large-particle-sized (unscented) detergent with high moisture content directly from the drying tower, with a dropping temperature as high as 60 °C, is collected into bulk packaging for recycling. To the south, the BOA is separated by a vented wall from the hot air generator (HAG) house. The hot, moist, unscented large detergent particles may have resulted in the lowest levels of PM2.5 and PM10 for 24.50 µg/m3 and 26.75 µg/m3, respectively, recorded for the BOA workstation. The high temperature of the BOA, similar to that of FFA, contributes to the combustion of products of hydrocarbons in the detergent and the fuel from the HAG. Based on an 8 h time-weighted average (TWA), the PM concentrations of all the work stations lie within permissible exposure limits (PELs) of the Occupational Safety and Health Administration (OSHA) [29] reported concentration of PM2.5 for 50 µg/m3 and PM10 for 150 µg/m3 and that of NESREA [21] with 180 µg/m3 for PM10 only, as presented in Table 4. Statistical analysis of PM2.5 and PM10 showed a strong correlation, which indicated that a rise in the value of one led to a corresponding rise in the value of the other.
Formaldehyde (HCHO) is a combustion byproduct of unvented furnaces and water heaters [30] such as the autoclave and the drying tower. Research has shown that the emission of HCHO from materials is positively related to temperature and humidity, which must have informed its out-gassing from synthetic perfumes that likely contain terpenes, limonene, and the like [28,30] constituted in the powders. However, the humidity of the FFA was not the highest of the workstations. Exposure to HCHO vapors can produce short-term symptoms such as headaches, itchy and/or burning eyes and nose, asthma, respiratory difficulties, depression, insomnia, and mental confusion. People with asthma and hyper-reactive airways are more susceptible to formaldehyde [28]. HCHO was not detected in the SPA, which demonstrated that it had no significant effect on the IAQ of the investigated workstations. In all the workstations, PELs for formaldehyde of OSHA (0.75 mg/m3) [31] and NESREA (0.10 mg/m3) [21] were not exceeded. The values were well below 50% of the PELs (Table 4).
The body temperature rises with increasing radiance temperature from surfaces involved in the release of heat within an environment [32]. This is the case when following the characteristics of the FFA, as stated above. In addition to this, human body exchanges heat with the environment through convection, radiation, evaporation, and respiration, which could be a contributory factor to the higher temperatures recorded for all the workstations with FFA (28.15 °C) > BOA (27.60 °C) > BSP (27.55 °C) >SPA (26.95 °C) > BPA (25.65 °C). Higher temperatures than what is considered moderate (22–25.50 °C) have been found to have profound effects on thermal comfort in an indoor environment, leading to heat exhaustion, changes in heartbeat rates, accuracy in brain functions and response time to stimuli. Advanced levels of temperature difference could lead to death [21,32,33]. Temperature levels of all the workstations exceeded the PEL of OSHA (25.50 °C) [34] and NESREA (24.44 °C) [21]. Providing thermal balance, though not necessary (as it differs from person to person due to age, sex, body mass index (BMI), etc.), may help improve the performance of indoor employees [32,33].

4.3. Volatile Organic Compounds (VOCs)

In this research, specific VOCs were not targeted. The values of VOCs obtained followed the trend BPA > BOA > FFA > SPA > BSP, corresponding to concentrations of 1.35, 0.98, 0.93, 0.27 and 0.09 mg/m3, respectively. The BPA with the highest value of VOCs holds a minimum of nine persons at any time of shift. VOCs concentration of 1.35 mg/m3 is high when compared with the Australian National Health and Medical Research Council maximum recommended indoor limit for VOCs of 0.500 mg/m3 [35]. The BPA is where the products are packed into the bags almost directly from the drying tower, during which the volatile compounds are emitted into the workstation. The effect is reflected in the high number of complaints associated with VOCs exposure (Table 2). This goes on to provide indication of future health impacts to workers health and wellbeing aligning with a report that exposure to low levels of VOCs is associated with higher levels of asthma, cancer, and other adverse health effects [36,37,38]. As described earlier, to the south of the area of the BPA is the BOA, and above these two workstations is the FFA. The detection levels for BPA, BOA and FFA were in abundance, with over 37% of the PELs of both OSHA [28] and NESREA [21] of 0.75 and 0.60 mg/m3, respectively. However, the values from this research were found to be lower than those recorded in an earlier finding by Mukurarinda [11], who reported that indoor VOCs concentrations are generally found in higher levels than the ambient outdoor levels and are majorly emitted from building materials, combustion processes, consumer products and personal care products. According to the European Environment Agency, the main sectors involved in high VOCs emissions for the EU-27 are solvent and product use with 41%, followed by the chemical industries (such as NHPL) with 22% as seen in Figure 4. As a household cleaning agent, detergent powder releases VOCs into the indoor environment even in storage, majorly from the constituted perfumes. The extent of the health effects of VOCs depends on factors such as the level of exposure and length of time of exposure; however, immediate symptoms soon after exposure include eye and respiratory tract irritation, headaches, dizziness, visual disorder, and memory impairment [39]. Source removal, source control and natural ventilation in buildings are some of the appropriate approaches that can reduce the risk of hazardous exposure to air pollutants found indoors [28].

4.4. Carbon Dioxide (CO2) and Relative Humidity (RH)

The highest concentration of CO2 was recorded for the BOA of 1265 ± 55.82 mg/m3 with RH of 22.55 ± 0.20%, while the lowest CO2 concentration was recorded for the BSP of 1137 ± 2.00 mg/m3, with the highest value RH of 23.8 ± 0.52%. From the former, it could be deduced that there is a small degree of correlation between the CO2 concentration and the %RH of the workstations, as seen in Figure 5. As the RH concentration increased, the CO2 concentration decreased for the stations.
From this behavior, it can be inferred as the RH of the workstations increased towards the acceptable limits between 60% and 70%, it is likely to impact the concentration of CO2 from low concentrations to concentrations in which the perceived air quality acceptability does not significantly change, as described [40]. This behavior was attributed to the natural ventilation available to each of the stations, as described earlier (Table 1 and Figure 3). The concentrations of CO2, being a byproduct of complete combustion and human metabolism, are often used to indicate if adequate air is being supplied to a building or not. Moderate to high levels (350–1000 ppm) can cause headaches and fatigue, and higher concentrations (1000–2000 ppm) can produce nausea, dizziness, and vomiting. Difficulty breathing, sweating, tiredness, increased heart rate and loss of consciousness can occur at extremely high concentrations (2000–5000 ppm or more) [41]. In this study, CO2 concentrations were found to be well below the PEL of the regulatory bodies of 5000 mg/m3 by OSHA [42] and 10,000 mg/m3 by NESREA [21]. The RH for all sampled workstations was around 39% lower than the lowest PEL; that is, 60.00% for OSHA [32] and 70.00% for NESREA [21]. It was concluded the low RH was also attributed to the season in which the sampling was performed (October–November), which is usually cool and dry for Jos and its environs [43]. Though the relationship between health, indoor air humidity and pollution is complex and challenging, several studies in the office environment have shown associations between low RH (5–30%), with increasingly prevalent complaints about perceived dry and stuffy air, and sensory irritation of the eyes and upper airways [44,45,46]. In a study of 484 office workers and 21 greenhouse employees in normal and well-ventilated office buildings, though dependent on psychosocial and environmental factors, low RH produced a few percentage reductions in visual acquisition for certain office tasks among young students that were exposed for 4 h, an effect that was expected to be more pronounced among the elderly. This could be a likely scenario in the case of this study.

4.5. Particulate Matter Characterization

Particulate matter characterization, as shown in Table 5, revealed fifteen (15) components comprising of Na2O, MgO, Al2O3, SiO2, P2O5, SO3, Cl−2, K2O, CaO, TiO2, Cr2O3, Mn2O3, Fe2O3, ZnO and SrO. These values are weight percent concentrations based on three days (each day for 8 h). The concentrations in milligrams per meter cube (mg/m3) obtained for an 8 h TWA for each particulate matter [47,48,49] are provided in Table 5, and the values obtained are compared with OSHA PEL [50] as total dust, metal, or fumes. There are particulates which are neither regulated nor established, for which OSHA has provided a single 8 h TWA PEL of 15 mg/m3 measured as total particulate [50]. From Table 6, MgO, P2O5, Cl, K2O, TiO2, Cr2O3, Mn2O3, ZnO and SrO are of insignificant concentrations when compared to their OSHA PEL. The remaining Na2O, Al2O3, SiO2, SO3, CaO and Fe2O3 (Figure 6) are of significance and are discussed.

4.6. Sodium Oxide (Na2O)

The FFA contained the highest value for Na2O, with 25.30 mg/m3 > BOA (24.59 mg/m3) > SPA (23.62 mg/m3) > BPA (22.46 mg/m3) > BSP (21.54 mg/m3), in that order. It is observed that the concentrations of Na2O in all the workstations exceeded the OSHA PEL [50] of 15 mg/m3. Na2O mostly originates from the dissolved alkaline silicate and other aluminosilicate materials that are added to improve detergent performance. The FFA holds warm (>50 °C) detergent slurry crutchers stirring at high speed. It also holds all the varieties of powder, and its proximity to the silicate-dissolving section makes it prone to having the highest concentration of Na2O. Na2O causes a sore throat, cough, a burning sensation, and shortness of breath on inhalation. It also causes redness, pain and burns to the eyes and skin [51]. It is contacted via all routes of exposure and reacts violently with water to produce sodium hydroxide (NaOH) [51,52]. When in contact with the moist environment of the respiratory and digestive systems, the NaOH formed—in sufficient amounts—can hydrolyze proteins in the tissue, causing burns and leading to tissue injuries. This can cause accumulation of fluid in the lungs, which could lead to perforation of the gastrointestinal tract. Upper airway obstruction may occur on exposure to it [52].

4.7. Aluminum Oxide (Al2O3)

Preparation of all detergent brands begins at the BSP. There is delivery of needed raw materials such as the aluminosilicate materials in larger quantities for bulk pack powders. This was the scenario as at the time of sampling; hence, the highest concentration of Al2O3 was recorded at the BSP of 22.93 mg/m3 which is above the OSHA PEL of 15 mg/m3 [50]. All the other workstations recorded less than 15 mg/m3. Aluminum oxide (Al2O3) dust causes irritation to the eyes and skin on contact. It is absorbed into the body by inhalation of its aerosol, causing nose, throat, and lung irritation. In addition, it also causes coughing, wheezing and shortness of breath. Long-term or repeated exposure causes lung damage and may have an effect on the central nervous system [53,54].

4.8. Silicon Dioxide (SiO2)

The results for SiO2 measured for each workstation revealed different concentrations, where BPA (34.17 mg/m3) > BOA (33.35 mg/m3) > FFA (21.45 mg/m3) > BSP(21.12 mg/m3) > SPA (20.70 mg/m3), respectively (Table 6). Based on physical examination of activity types taking place at each workstation, BPA, and BOA higher concentrations of silica correlate with the formulation (bulk pack production) process taking place at these sites, as it is often supported by a higher dose of silicate compared to those for small packs. The FFA and BSP experienced a slight rise in concentrations above the OSHA PEL [50] of 21.06 mg/m3, while that of the SPA is within the limit. OSHA [55] classified silica as a human lung carcinogen. Breathing crystalline silica dust causes formation of scar tissue upon entering the lungs, which affects lung functions and makes a person more susceptible to other lung infections such as tuberculosis. The lung disease silicosis is caused by breathing in silica dust, and its symptoms include shortness of breath, fatigue, and chest pain. Long-term exposures lead to weight loss. In acute form, it leads to respiratory failure, which often results in death [55].

4.9. Sulfur Trioxide (SO3)

Sulfur trioxide is less likely to be found in air, but for a short period. It is formed slowly in the air from sulfur dioxide (SO2) and rapidly takes up water (moisture) to form sulfuric acid (H2SO4) once inhaled. The latter causes nose irritation, and on entering the respiratory tract, it affects the tract, tissues, eyes, and the gastrointestinal tract [56]. Concentrations of SO3 in the workstations are: FFA (41.57 mg/m3) > SPA (34.68 mg/m3) > BPA (19.67 mg/m3) > BOA (15.52 mg/m3) > BSP (10.48 mg/m3) (Table 6). Inspection of the plant layout revealed, a sulfonation plant was stationed within the hall housing the BPA, BOA, FFA and SPA (Figure 3). The SPA is only enclosed by a wall (not complete to the roof) within the main hall housing of the workstation. The sulfonation plant uses sulfur, which is melted in oxygen to produce SO3 before further reactions to form the sulfonic acid. The results recorded for the BSP (10.48 mg/m3) which is about 45 m in parallel away from the sulfonation process, suggests leakages around the sulfur melter, converter and the reacting vessels, leading to the escape of SO2/SO3 gases. Apart from the BSP, all the other workstations within the hall housing the sulfonation plant have higher concentration values than the PEL of 15 mg/m3 by OSHA [50].

4.10. Calcium Oxide (CaO)

As in the case of Al2O3, high values of CaO were recorded at the BSP (10.94 mg/m3), followed by the BOA (7.10 mg/m3) then, the BPA (4.90 mg/m3) as a result of the aluminosilicates added to bulk production for improved performance. From the OSHA [50] PEL, the BPA concentration is at the brink of falling over PEL, while the BSP and BOA concentrations have exceeded the PEL of 5 mg/m3. Calcium oxide is contacted via all routes of exposure, causing a burning sensation, cough and shortness of breath, sore throat, skin redness and blurred vision. It causes abdominal cramps, vomiting and diarrhea. Prolonged or repeated contact and inhalation may cause skin dermatitis, nasal ulceration, and perforation of the nasal septum [57].

4.11. Iron (iii) Oxide (Fe2O3)

Result for Fe2O3 measured within the SPA plant area was 19.23 mg/m3. This value when compared with OSHA standards, was found to have exceeded the PEL for Fe2O3 fumes (10 mg/m3) [48]. This result is not surprising, as it is an area with large detergent holding tanks, some of which are made of the iron metal. In addition, small pack detergents are packed at the SPA, and the tanks are agitated vigorously to deliver their detergent powders from time to time. No categorical statements have been made on the carcinogenicity of iron oxides in humans. OSHA agrees that any occupational exposure that causes foreign substance to lodge in the body tissues is undesirable. Iron oxides are poorly soluble; however, it cannot be excluded that small amounts of soluble iron (ii) or Iron (iii) are also present in the lungs after inhalation. These can trigger genotoxic and carcinogenic changes due to simultaneous exposure to other toxic compounds [58,59].
Findings from the research recommend that extractors be installed at various workstations to eliminate these pollutants to help keep the workforce safe. In addition, the workstations should be remodeled to allow for adequate cross ventilation. Based on the existing building design, there is a need for installation of further ventilation technology to accommodate the need within each work environment without necessarily tampering with the architecture of the plants. Considering the lack of national standards in Nigeria for IAQs, there is a need to adopt international reference IAQ standards that should guide the of monitoring air quality within the work environment to minimize work-related illness and enhance productivity with the organization. To the best of our knowledge, this is the first study that considers the indoor air quality within detergent manufacturing plants in Nigeria, as such data contained herein have helped to highlight the likely impact of indoor air quality on employees’ health and wellbeing in similar work environments throughout the country. In addition, the work further draws attention of regulatory bodies to oversights regarding their responsibilities around safety and wellbeing. It will ensure that adequate monitoring of indoor air quality is maintained across industries in the country, while ensuring health surveillance records are maintained, local exhaust ventilation (LEV) is serviced and maintained when due and employees are trained in the use of available LEV to minimize exposure at work.

5. Conclusions

The IAQ of five workstations within NHPL was investigated, monitored, and measured. The major IAQ pollutants affecting the workstations are VOCs, temperature, and relative humidity. Meanwhile, for particulate matter, they are Na2O, Al2O3, SiO2, SO3, CaO and Fe2O3. This is so because the IAQ pollutants affecting the workstations have exceeded one or two PELs (especially VOCs and temperature) and are below the expected PELs, as in the case of the %RH of all the workstations. From this study, it is evident from Figure 3 that natural ventilation in buildings is important to supply fresh air to occupants, and to dilute and exhaust pollutants to provide acceptable IAQ. From the structures and activities of the workstations, source control/removal would be the most effective way to reduce indoor air (IA) pollutants, as agreed by another research study [27].
Based on the outcome of the study and related health effects associated with identified IA pollutants in the work environment, it was concluded that workplace health and safety measures that include the enforcement of personal protective equipment use, especially during handling of sensitizing compounds; health screening and periodic surveillance programs; as well as substitution of hazardous pollutants with safer compounds where possible should be encouraged as part of workplace safety and health management systems within the organization.

Author Contributions

Conceptualization, J.S.G. and S.U.M.; methodology, J.S.G. and H.M.M.; validation, J.S.G. and H.M.M.; formal analysis, S.U.M.; investigation, S.U.M.; resources, J.S.G. and S.U.M.; data curation, J.S.G.; writing—original draft preparation, J.S.G. and S.U.M.; writing—review and editing, H.M.M.; visualization, H.M.M.; supervision, J.S.G.; project administration, J.S.G. All authors have read and agreed to the published version of the manuscript.

Funding

This research received no external funding.

Informed Consent Statement

Informed consent was obtained from all subjects involved in the study.

Data Availability Statement

Data is contained within the article.

Acknowledgments

The authors express their gratitude to the management of NASCO group of companies, especially the unit head of NHPL, Rajendrah Butola Singh for their magnanimity and confidence in giving clearance to undertake this research within the factory. Gratitude also goes to the technical department of NHPL for the construction works and to the Assistant Quality Assurance Manager for their time, encouragement, and use of the lab and some apparatus for conducting the sampling.

Conflicts of Interest

The authors declare no conflict of interest.

References

  1. UCSF Institute for Health & Aging; UC Berkeley Center for Environmental Research and Children’s Health; Informed Green Solutions; California Department of Pesticide Regulation. Green Cleaning, Sanitizing, and Disinfecting: A Toolkit for Early Care and Education; University of California, San Francisco School of Nursing: San Francisco, CA, USA, 2013; Available online: https://cerch.berkeley.edu/sites/default/files/green_cleaning_toolkit.pdf (accessed on 14 June 2021).
  2. EPA402-08/008; Care for Your Air: A Guide to Indoor Air Quality. United Stated Environmental Protection Agency [USEPA] : Washington, DC, USA, 2008. Available online: https://www.epa.gov/report-environment/indoor-air-quality (accessed on 20 June 2022).
  3. Basketter, D.; Berg, N.; Kruszewski, F.H.; Sarlo, K.; Concoby, B. Relevance of sensitization to occupational allergy and asthma in the detergent industry. J. Immunotoxicol. 2012, 9, 314–319. [Google Scholar] [CrossRef]
  4. Flindt, M.L. Biological miracles and misadventures: Identification of sensitization and asthma in enzyme detergent workers. Am. J. Ind. Med. 1996, 29, 99–110. [Google Scholar] [CrossRef]
  5. Zachariae, H.; Høech-Thomsen, J.; Witmeur, O.; Wide, L. Detergent enzymes and occupational safety: Observations on sensitization during Esperase production. Allergy 1981, 36, 513–516. [Google Scholar] [CrossRef] [PubMed]
  6. Massachusetts Department of Environmental Protection [MDEP]. Health and Environmental Effects of Air Pollution; Massachusetts Department of Environmental Protection [MDEP]: Boston, MA, USA, 2013. Available online: https://www.mass.gov/doc/2013-annual-air-quality-report/download (accessed on 12 May 2022).
  7. Phillips, T.J. Protecting Commercial Buildings from Outdoor Pollutants: School Office and Multifamily Buildings; ROCIS Initiative: Pittsburgh, PA, USA, 2014. [Google Scholar]
  8. Agency for Toxic Substances and Disease Registry [ATSDR]. Case Study in Environmental Medicine: Taking an Exposure History; Agency for Toxic Substances and Disease Registry [ATSDR]: Atlanta, GA, USA, 2015. [Google Scholar]
  9. Omrane, F.; Gargouri, J.; Khadhraoui, M.; Elleuch, B.; Navier, D.Z. Risk assessment of occupational exposure to heavy metal mixtures: A study protocol. J. Bio. Med. Cent. Public Health 2018, 18, 314. [Google Scholar] [CrossRef] [PubMed] [Green Version]
  10. United State Environmental Protection Agency (USEPA). Biological Pollutants’ Impact on Indoor Air Quality; United State Environmental Protection Agency (USEPA): Washington, DC, USA, 2017. Available online: https://www.epa.gov/indoor-air-quality-iaq/biological-pollutants-impact-indoor-air-quality (accessed on 12 December 2021).
  11. Mukurarinda, J. Characterization of Industrial Volatile Organic Compounds Emission in Rwanda and Bio Filtration of Acetone, Dimethyl Sulphide and Hexane. Master’s Thesis, Ghent University, Ghent, Belgium, 2016. [Google Scholar]
  12. Diodu, R.; Bucur, E.; Galaon, T.; Pascu, L.F. Indoor air exposure to aldehydes and ketones in rooms with new and old furniture of a new office building. J. Environ. Prot. Ecol. 2015, 16, 832–838. [Google Scholar]
  13. Szczurek, A.; Maciejewska, A.; Poloczanski, R.; Teuerle, M.; Wylomanska, A. Dynamics of carbon dioxide concentration in indoor air. J. Stoch. Environ. Res. Risk Manag. 2014, 29, 2193. [Google Scholar] [CrossRef] [Green Version]
  14. Wu, J.; Laurent, O.; Li, L.; Hu, J.; Kleeman, M. Adverse Reproductive Health Outcomes and Exposure to Gaseous and Particulate-Matter Air Pollution in Pregnant Women. Res. Rep. Health Eff. Inst. 2016, 2016, 1–58. [Google Scholar]
  15. Zhang, N.; Lu, H.; Zhang, R.; Sun, X. Protective effects of methane-rich saline on mice with allergic asthma by inhibiting inflammatory response, oxidative stress and apoptosis. J. Zhejiang Univ.-Sci. B 2019, 20, 828–837. [Google Scholar] [CrossRef]
  16. Agida, G.O.; Forcados, G.E.; Usman, Y.; Muraina, I.; Ottor, M.; Samuel, A.L.; Usman, A.S.; Makoshi, M.S.; Atiku, A.; Gotep, J.G.; et al. Proximate, Antinutritional And Mineral Composition of Some Pasture Plants Growing In Vom, Nigeria. Res. J. Agric. 2017, 4, 1–8. Available online: https://researchjournali.com/view.php? id=3600 (accessed on 19 March 2020).
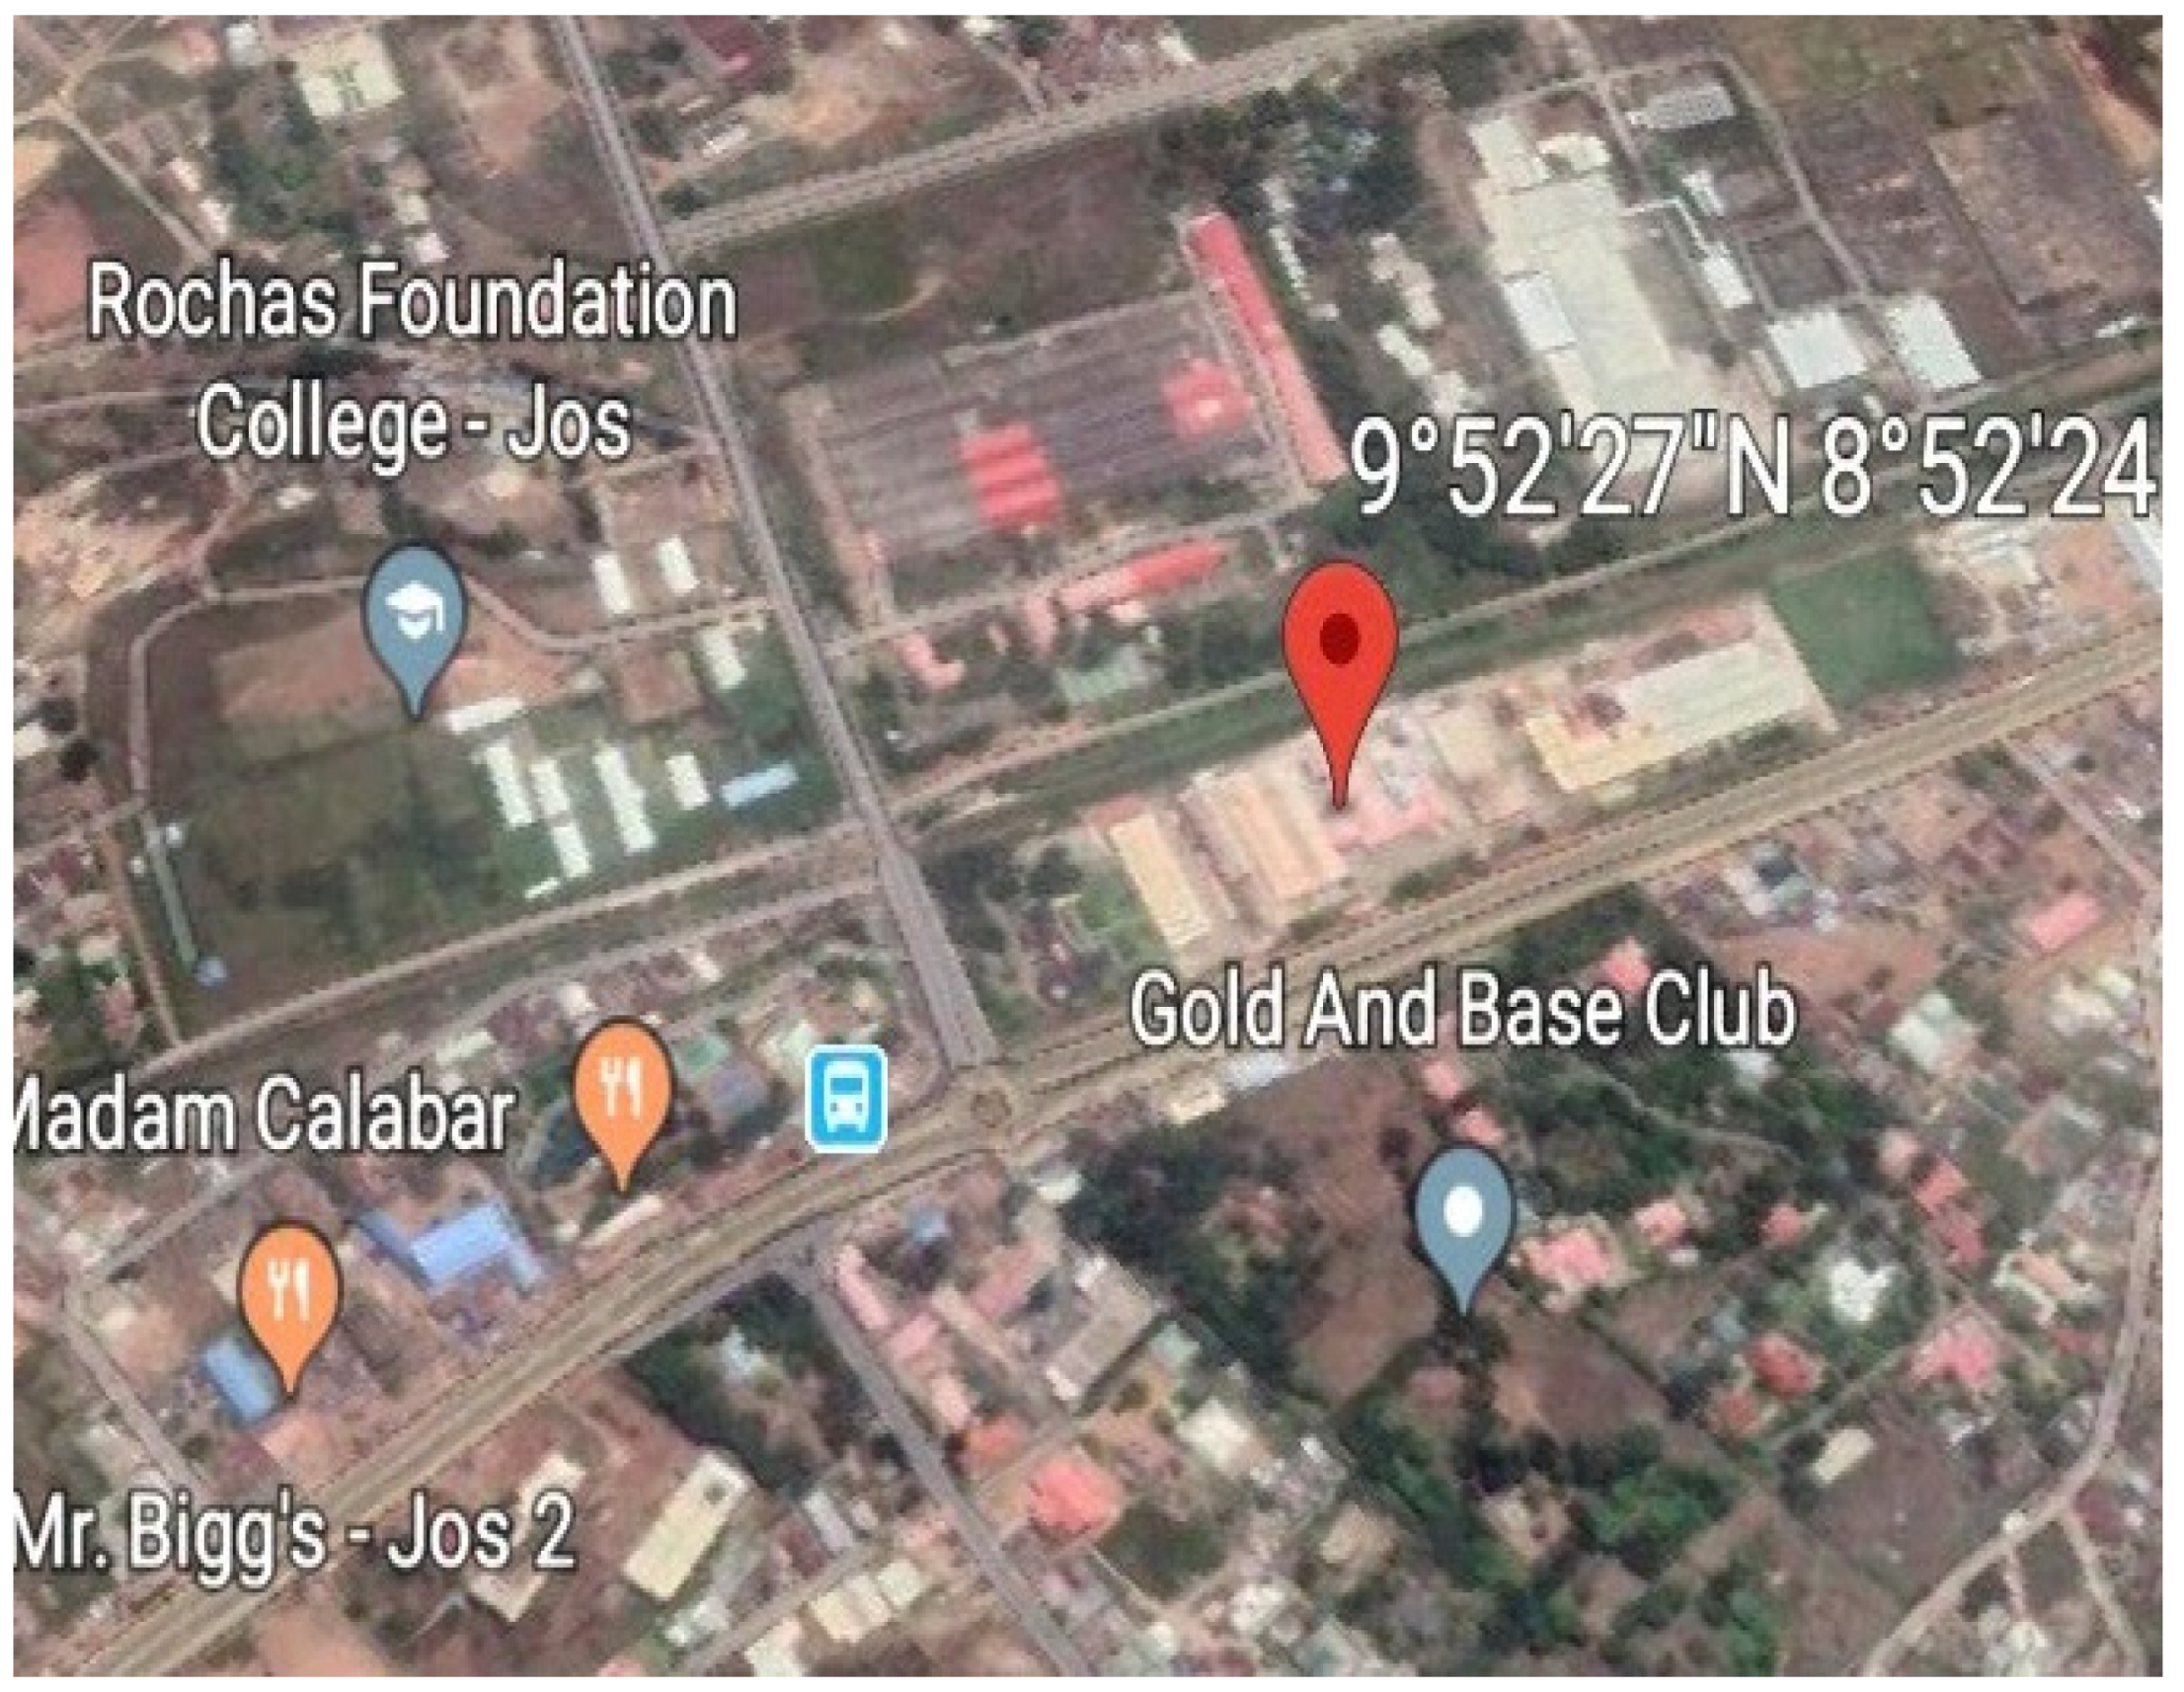
  17. Google Earth. Satellite Map Showing NHPL Jos Plateau State, Nigeria. 2019. Available online: https://www.nasco.net/companies/nasco-household/ (accessed on 22 June 2022).
  18. NASCO Group Report. (n.d.). History and Heritage; NASCO Press: Jos, Nigeria; Available online: https://www.nasco.net/about-us/history-heritage/ (accessed on 20 June 2022).
  19. NASCO Brochure. NASCO Press: Jos, Nigeria, 2022. Available online: https://www.nasco.net/news/downloads/ (accessed on 20 June 2022).
  20. Occupational Safety and Health Administration [OSHA]. Indoor air quality investigation. In OSHA Technical Manual (OTM); 2018; Section iii, Chapter 2. Available online: https://www.osha.gov/otm/section-3-health-hazards/chapter-2 (accessed on 13 May 2021).
  21. National Environmental Standards and Regulations Enforcement Agency [NESREA]. Draft of the National Environmental (Air Quality Control) Regulations; NESREA Press: Abuja, Nigeria, 2014; pp. 16–17. Available online: https://lawnigeria.com/2020/08/national-environmental-air-quality-control-regulations-2014/ (accessed on 15 June 2022).
  22. Chen, Q.F.; Milburn, R.K. Real time monitoring of hazardous airborne chemicals: A styrene investigation. J. Hazard. Mater. 2006, 132, 261–268. [Google Scholar] [CrossRef]
  23. Whalley, J.; Zandi, S. Particulate matter sampling technique and data modelling methods. Open Access 2016, 2, 29–54. [Google Scholar]
  24. Napoli, C.; Marcotrigiano, V.; Montagna, M.T. Air sampling procedures to evaluate microbial contamination: A comparison between active and passive methods in operating theatres. BMC Public Health 2012, 12, 594. [Google Scholar] [CrossRef] [PubMed] [Green Version]
  25. Specac. Analyzing the Composition of Cement—XRF Sample Prep. Azo Mater. 2018. Available online: https://www.environmental-expert.com/articles/xrf-sample-preparation-techniques-pellets-versus-loose-powder-spectroscopy-guides-778859 (accessed on 17 July 2021).
  26. Yamada, Y. Sample Preparation for X-Ray Florescence Analysis. Rigaku J. 2014, 30, 29. Available online: https://www.rigaku.com/newsletters/mabu/may2016/RigakuJournal_XRF.pdf (accessed on 23 January 2021).
  27. Yin, H.; Liu, C.; Zhang, L.; Li, A.; Ma, Z. Measurement and evaluation of indoor air quality in naturally ventilated residential buildings. Indoor Built Environ. J. 2019, 28, 1307–1323. [Google Scholar] [CrossRef]
  28. Occupational Safety and Health Administration (OSHA). Record Retention Requirements for Indoor Air Quality Documents and Reports; 2002. Available online: https://www.osha.gov/laws-regs/standardinterpretations/2002-08-0 (accessed on 16 February 2021).
  29. Ling, Z.H.; Zhao, J.; Fan, S.J.; Wang, X.M. Sources of formaldehyde and their contributions to photochemical O3 formation at an urban site in the Pearl River Delta, southern China. Chemosphere 2017, 168, 1293–1301. [Google Scholar] [CrossRef] [PubMed]
  30. OSHA. Formaldehyde Standard; 29FCR 1910.48; 2002. Available online: https://www.osha.gov/laws-regs/regulations/standardnumber/1910/1910.1048 (accessed on 13 February 2021).
  31. Ozdamar, M.; Umarogullari, F. Thermal comfort and indoor air quality. Int. J. Sci. Res. Innov. Technol. 2018, 5, 2313–3759. [Google Scholar]
  32. Abbasi, A.M.; Motamedzade, M.; Aliabadi, M.; Golmohammadi, R.; Tapak, L. The impact of indoor air temperature on the executive functions of human brain and the physiological response of body. Health Promot. Perspect. 2019, 9, 55–64. [Google Scholar] [CrossRef] [Green Version]
  33. OSHA. Office Temperature, Humidity and Environmental Tobacco Smoke; Washington, DC, USA, 2003. Available online: https://www.osha.gov/laws-regs/standardinterpretations/2003-02-28 (accessed on 11 April 2022).
  34. Aziah, D.; Abdin, E.; Azwan, A.; Lin, N.; Rusli, N. Assessment of Indoor Air Quality and Heat Stress Exposure in an Automotive Assembly Plant. Air Quality 2010, 343–365. Available online: https://www.intechopen.com/chapters/11393 (accessed on 13 September 2021).
  35. Rumchev, K.; Brown, H.; Spickett, J. Volatile organic compounds: Do they present a risk to our health? Rev. Environ. Health 2007, 22, 39–55. [Google Scholar] [CrossRef]
  36. Arif, A.A.; Shah, S.M. Association between personal exposure to volatile organic compounds and asthma among US adult population. Int. Arch. Occup. Environ. Health 2007, 80, 711–719. [Google Scholar] [CrossRef] [PubMed]
  37. Liu, N.; Bu, Z.; Liu, W.; Kan, H.; Zhao, Z.; Deng, F.; Huang, C.; Zhao, B.; Zeng, X.; Sun, Y.; et al. Health effects of exposure to indoor volatile organic compounds from 1980 to 2017: A systematic review and meta-analysis. Indoor Air 2022, 32, e13038. [Google Scholar] [CrossRef] [PubMed]
  38. Ware, J.H.; Spengler, J.D.; Neas, L.M.; Samet, J.M.; Wagner, G.R.; Coultas, D.; Ozkaynak, H.; Schwab, M. Respiratory and irritant health effects of ambient volatile organic compounds. The Kanawha County Health Study. Am. J. Epidemiol. 1993, 137, 1287–1301. [Google Scholar] [CrossRef] [PubMed]
  39. USEPA. Volatile Organic Compounds’ Impact on Indoor Air Quality; 2022. Available online: https://www.epa.gov/indoor-air-quality-iaq/volatile-organic-compounds-impact-indoor-air-quality# (accessed on 15 June 2020).
  40. Li, Y.; Yuan, Y.; Li, C.; Han, X.; Zhang, X. Human responses to high temperature, relative humidity and carbon dioxide concentration in underground refuge chamber. Build. Environ. J. 2018, 131, 53–62. [Google Scholar] [CrossRef]
  41. Bonino, S. Carbon Dioxide Detection and Indoor Air Quality Control. Occup Health Saf. 2016, 85, 46–48. Available online: https://pubmed.ncbi.nlm.nih.gov/27183813/ (accessed on 12 December 2021).
  42. OSHA Fact Sheet. Carbon dioxide Poisoning. 2012. Available online: https://www.osha.gov/sites/default/files/publications/carbonmonoxide-factsheet.pdf (accessed on 19 December 2020).
  43. Wikipedia. Geography of Nigeria and Climate Types Found in Nigeria. 2018. Available online: https://en.wikipedia.org/wiki/Geography_of_Nigeria (accessed on 12 November 2020).
  44. Wolkoff, P. Indoor air humidity, air quality and health—An overview. Int. J. Hyg. Environ. Health 2018, 221, 376–390. [Google Scholar] [CrossRef]
  45. Moda, H.M.; King, D. Assessment of Occupational Safety and Hygiene Perception among Afro-Caribbean Hair Salon Operators in Manchester, United Kingdom. Int. J. Environ. Res. Public Health 2019, 16, 3284. [Google Scholar] [CrossRef] [Green Version]
  46. Alomirah, H.F.; Moda, H.M. Assessment of indoor air quality and users perception of a renovated office building. Int. J. Environ. Res. Public Health 2020, 17, 1972. [Google Scholar] [CrossRef] [Green Version]
  47. Boguski, T.K. Understanding units of measurements. In Environmental Science and Technology Briefs for Citizens; Centre for Hazardous Substance Research (CHSR), Kansas State University: Manhattan, KS, USA, 2008; Available online: https://engg.k-state.edu/CHSR/outreach/resources/docs/2UnitsofMeasure022508.pdf (accessed on 18 August 2021).
  48. Ausetute. Parts Per Million (ppm) Concentration. Key Concepts. 2020. Available online: https://www.ausetute.com.au/partspm.html (accessed on 13 February 2022).
  49. Teesing. Parts Per Million to Milligram Per meter Cube Converter. 2020. Available online: https://www.justintools.com/unit-conversion/density.php?k1=parts-per-million&k2=milligrams-per-cubic-meter (accessed on 11 February 2022).
  50. OSHA. OSHA Permissible Exposure Limits. OSHA Annotated Table Z-1 & Z-3 (Mineral Dusts); 29. CFR 1910.1000; 2018. Available online: https://www.osha.gov/annotated-pels/table-z-1 (accessed on 11 June 2022).
  51. INCHEM. Sodium Oxide. 2006. Available online: https://inchem.org/documents/icsc/icsc/eics1653.htm (accessed on 15 June 2022).
  52. Treesubsuntorn, C.; Setiawan, G.D.; Permana, B.H.; Citra, Y.; Krobthong, S.; Yingchutrakul, Y.; Siswanto, D.; Thiravetyan, P. Particulate matter and volatile organic compound phytoremediation by perennial plants: Affecting factors and plant stress response. Sci. Total Environ. 2021, 794, 148–779. [Google Scholar] [CrossRef]
  53. International Labour Organization/World Health Organization [ILO/WHO]. Aluminium Oxide. 2017. Available online: https://www.ilo.org/wcmsp5/groups/public/@ed_dialogue/@lab_admin/documents/publication/wcms_819788.pdf (accessed on 11 June 2022).
  54. Xiao, Y.; Reuter, M.A.; Boin, U. Aluminium recycling and environmental issues of salt slag treatment. J. Environ. Sci. Health A Tox Hazard Subst. Environ. Eng. 2005, 40, 1861–1875. [Google Scholar] [CrossRef]
  55. OSHA. Crystalline Silica Exposure Health Hazard Information for Industry Employees. US Department of Labour. 2018. Available online: https://www.osha.gov/sites/default/files/2018-12/fy16_sh-29661-sh6_SilicaTrainingReferences.pdf (accessed on 11 June 2022).
  56. Heaviside, C.; Witham, C.; Vardoulakis, S. Potential health impacts from sulphur dioxide and sulphate exposure in the UK resulting from an Icelandic effusive volcanic eruption. Sci. Total Environ. 2021, 774, 145549. [Google Scholar] [CrossRef] [PubMed]
  57. Cain, W.S.; Jalowayski, A.A.; Kleinman, M.; Lee, N.-S.; Lee, B.-R.; Ahn, B.-H.; Magruder, K.; Schmidt, R.; Hillen, B.K.; Warren, C.B.; et al. Sensory and irritating reactions to mineral dusts: Sodium borate, calcium oxide, and calcium sulfate. J. Occup. Environ. Hyg. 2004, 1, 222–236. [Google Scholar] [CrossRef] [PubMed]
  58. National Institute for Occupational Safety and Health [NIOSH]. Iron Oxide Fumes. In In Centre for Disease Control; 2011. Available online: https://www.cdc.gov/niosh/npg/npgd0344.html (accessed on 19 June 2022).
  59. Hartwig, A.; Commission, M.A.K. Iron oxides (inhalable fraction. MAK-Collect. Occup Health Saf. Annu. Threshold. Cl. Workplace 2016, 1, 1804–1869. [Google Scholar] [CrossRef]
Figure 1. Map of Nigeria Showing the Study Area within Plateau State.
Toxics 10 00419 g001
Figure 2. Google Earth (2019) Satellite Map Showing NHPL Jos Plateau State Nigeria.
Toxics 10 00419 g002
Figure 3. Sketched Layouts of the Workstations.
Toxics 10 00419 g003
Figure 4. Sectors involved in High VOCs Emissions for the EU-27.
Toxics 10 00419 g004
Figure 5. Monitored CO2 concentration and RH across the workstations.
Toxics 10 00419 g005
Figure 6. Concentrations (mg/m3) of Characterized Particulate Matter vs. OSHA PELs.
Toxics 10 00419 g006
Table 1. Information of the Monitored Workstations NHPL.
No.WorkstationFloorFloor Area (m2)Minimum No. of Workforce per ShiftMaximum No of Workers per Shift
1BPAGround floor50932
2BOAGround floor5038
3FFAFirst floor200717
4SPAGround floor4003471
5BSPGround floor20068
Table 2. Reported indoor air syndrome among employees of NHPL.
WorkstationReported Exposure Health Complaints
Respiratory RelatedEyes RelatedOther Surface Injuries
BPA (32)7100
BOA (8)220
FFA (17)431
SPA (71)1796
BSP (8)230
Total32267
Table 3. Measured Indoor Air Quality at monitored Workstations within NHPL.
Sampling Points
Parameters(BPA)(BOA)(FFA)(SPA)(BSP)p Value
PM2.5 (µg/m3)44 ± 5.6624.5 ± 2.3848.5 ± 6.2528.75 ± 1.8938.25 ± 4.11S
PM10 (µg/m3)54 ± 8.1726.75 ± 2.7561.75 ± 9.5333.75 ± 3.9545.25 ± 6.23S
HCHO (mg/m3)0.01 ± 0.020.0025 ± 0.000.0125 ± 0.000.00 ± 0.000.0025 ± 0.00NS
VOCs (mg/m3)1.35 ± 0.280.98 ± 0.400.93 ± 0.060.27 ± 0.040.09 ± 0.00S
CO2 (mg/m3)1227.75 ± 55.221265 ± 55.821190.25 ± 4.51155.25 ± 2.361137 ± 2.00S
T (°C)25.65 ± 0.4227.6 ± 0.3428.15 ± 0.1026.95 ± 0.1227.55 ± 0.12S
RH (%)20.13 ± 0.2222.55 ± 0.2022.7 ± 0.6222.75 ± 0.1723.80 ± 0.52S
Note: The decision (p value), p > 0.05 is Not Significant (NS), p < 0.05 is Significant (S), p value at 95% confidence level.
Table 4. The AQ Parameters and Permissible Exposure Limits (8 h TWA).
Sample ValuesRegulatory Limits
ParametersMinimumMaximumOSHANESREA
PM2.5(µg/m3)24.5048.5050.00-
PM10(µg/m3)26.7561.75150.00180.00
HCHO (mg/m3)0.000.010.750.10
VOCs (mg/m3)0.091.350.750.60
CO2 (mg/m3)11371265.005000.0010,000.00
T (°C)25.6528.1524.4425.50
RH (%)20.1323.8060.0070.00
Table 5. Characterization of Particulate Matter.
Parameter (wt. %)Sampling Location
BPABOAFFASPABSP
Na2O26.58029.09629.94527.95525.490
MgO1.1011.3560.3070.3786.348
Al2O33.1834.1782.4072.90416.498
SiO241.72240.71126.19325.27925.788
P2O50.4460.0000.1330.1390.014
SO318.01414.21338.08631.7679.600
Cl0.5440.5670.6740.3410.834
K2O0.0750.0170.1110.1130.150
CaO6.4069.2871.6572.02514.311
TiO20.2500.2720.0910.1450.528
Cr2O30.0080.0020.0020.0150.003
Mn2O30.0170.0060.0060.0710.010
Fe2O31.6290.2790.3768.8340.402
ZnO0.0230.0000.0090.0310.005
SrO0.0010.0170.0030.0020.019
Table 6. Particulate Matter Characterization 8 h TWA.
Parameter (mg/m3)Sampling Location
BPABOAFFASPABSPOSHA PEL
Na2O22.4624.5925.3023.6221.5415
MgO0.610.750.170.213.4915
Al2O34.425.813.344.0422.9315
SiO234.1733.3521.4520.7021.1221.06
P2O50.860.000.260.270.0315(NE)
SO319.6715.5241.5734.6810.4815 (NE)
Cl0.260.270.330.170.4015
K2O0.100.020.140.150.1915 (NE)
CaO4.907.101.271.5510.945
TiO20.270.300.100.160.5715
Cr2O30.020.010.010.030.010.5
Mn2O30.000.000.000.020.005 (as Mn)
Fe2O33.550.610.8219.230.8810 (as fumes)
ZnO0.030.000.010.030.0115
SrO0.000.030.000..000.0315
Publisher’s Note: MDPI stays neutral with regard to jurisdictional claims in published maps and institutional affiliations.

