
Transcriptomic Evidence That Switching from Tobacco to Electronic Cigarettes Does Not Reverse Damage to the Respiratory Epithelium

 , , and
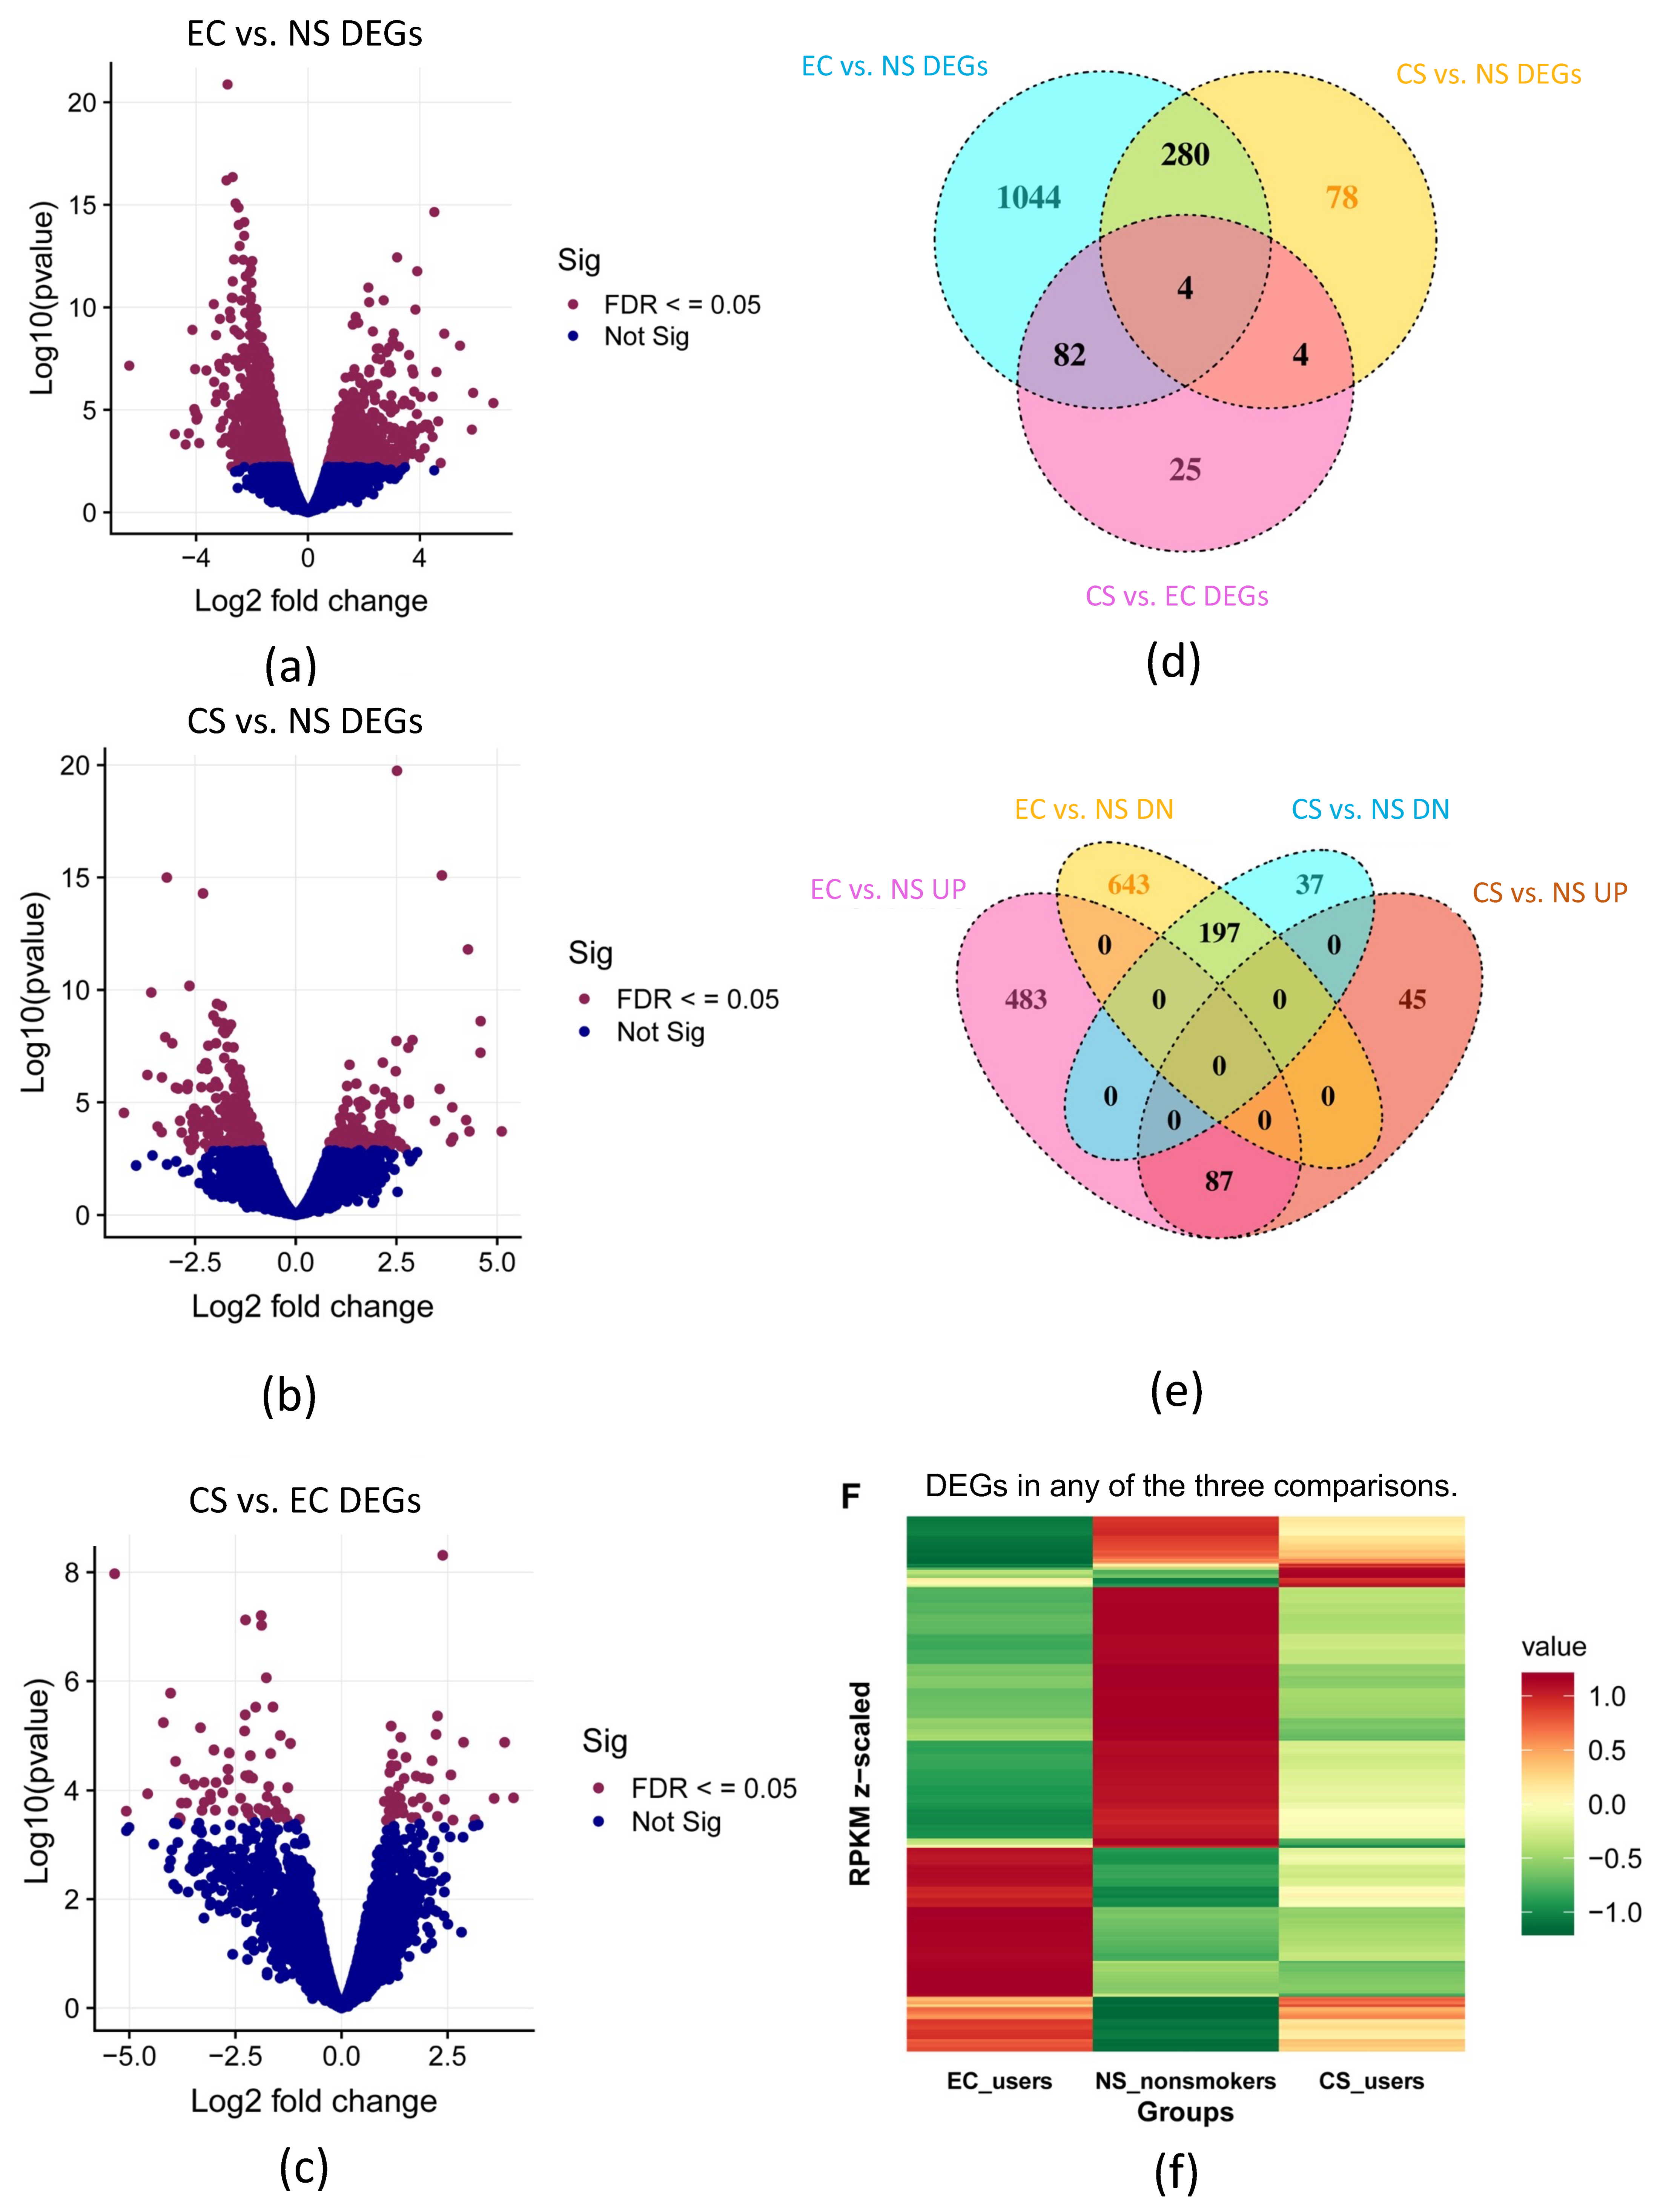
Abstract
1. Introduction
2. Materials and Methods
2.1. Sample Collection and RNA Extraction
2.2. Sample Information, Selection, and Demographics
2.3. Library Preparation and Sequencing
2.4. Hierarchical Clustering and Differential Expression Analysis
2.5. Gene Ontology (GO) Enrichment and Reactome Pathway Analyses
2.6. Ingenuity Pathway Analysis (IPA)
3. Results
3.1. Differential Gene Expression (DEGs) in EC, CS, and NS: Initial Analysis
3.2. GO Term Enrichment Analysis for EC vs. NS, CS vs. NS, and CS vs. EC
3.3. IPA Biological Functions for EC vs. NS
3.4. Reactome Pathway Enrichment Analysis for EC vs. NS, CS vs. NS and CS vs. EC
3.5. Canonical Pathway Using IPA
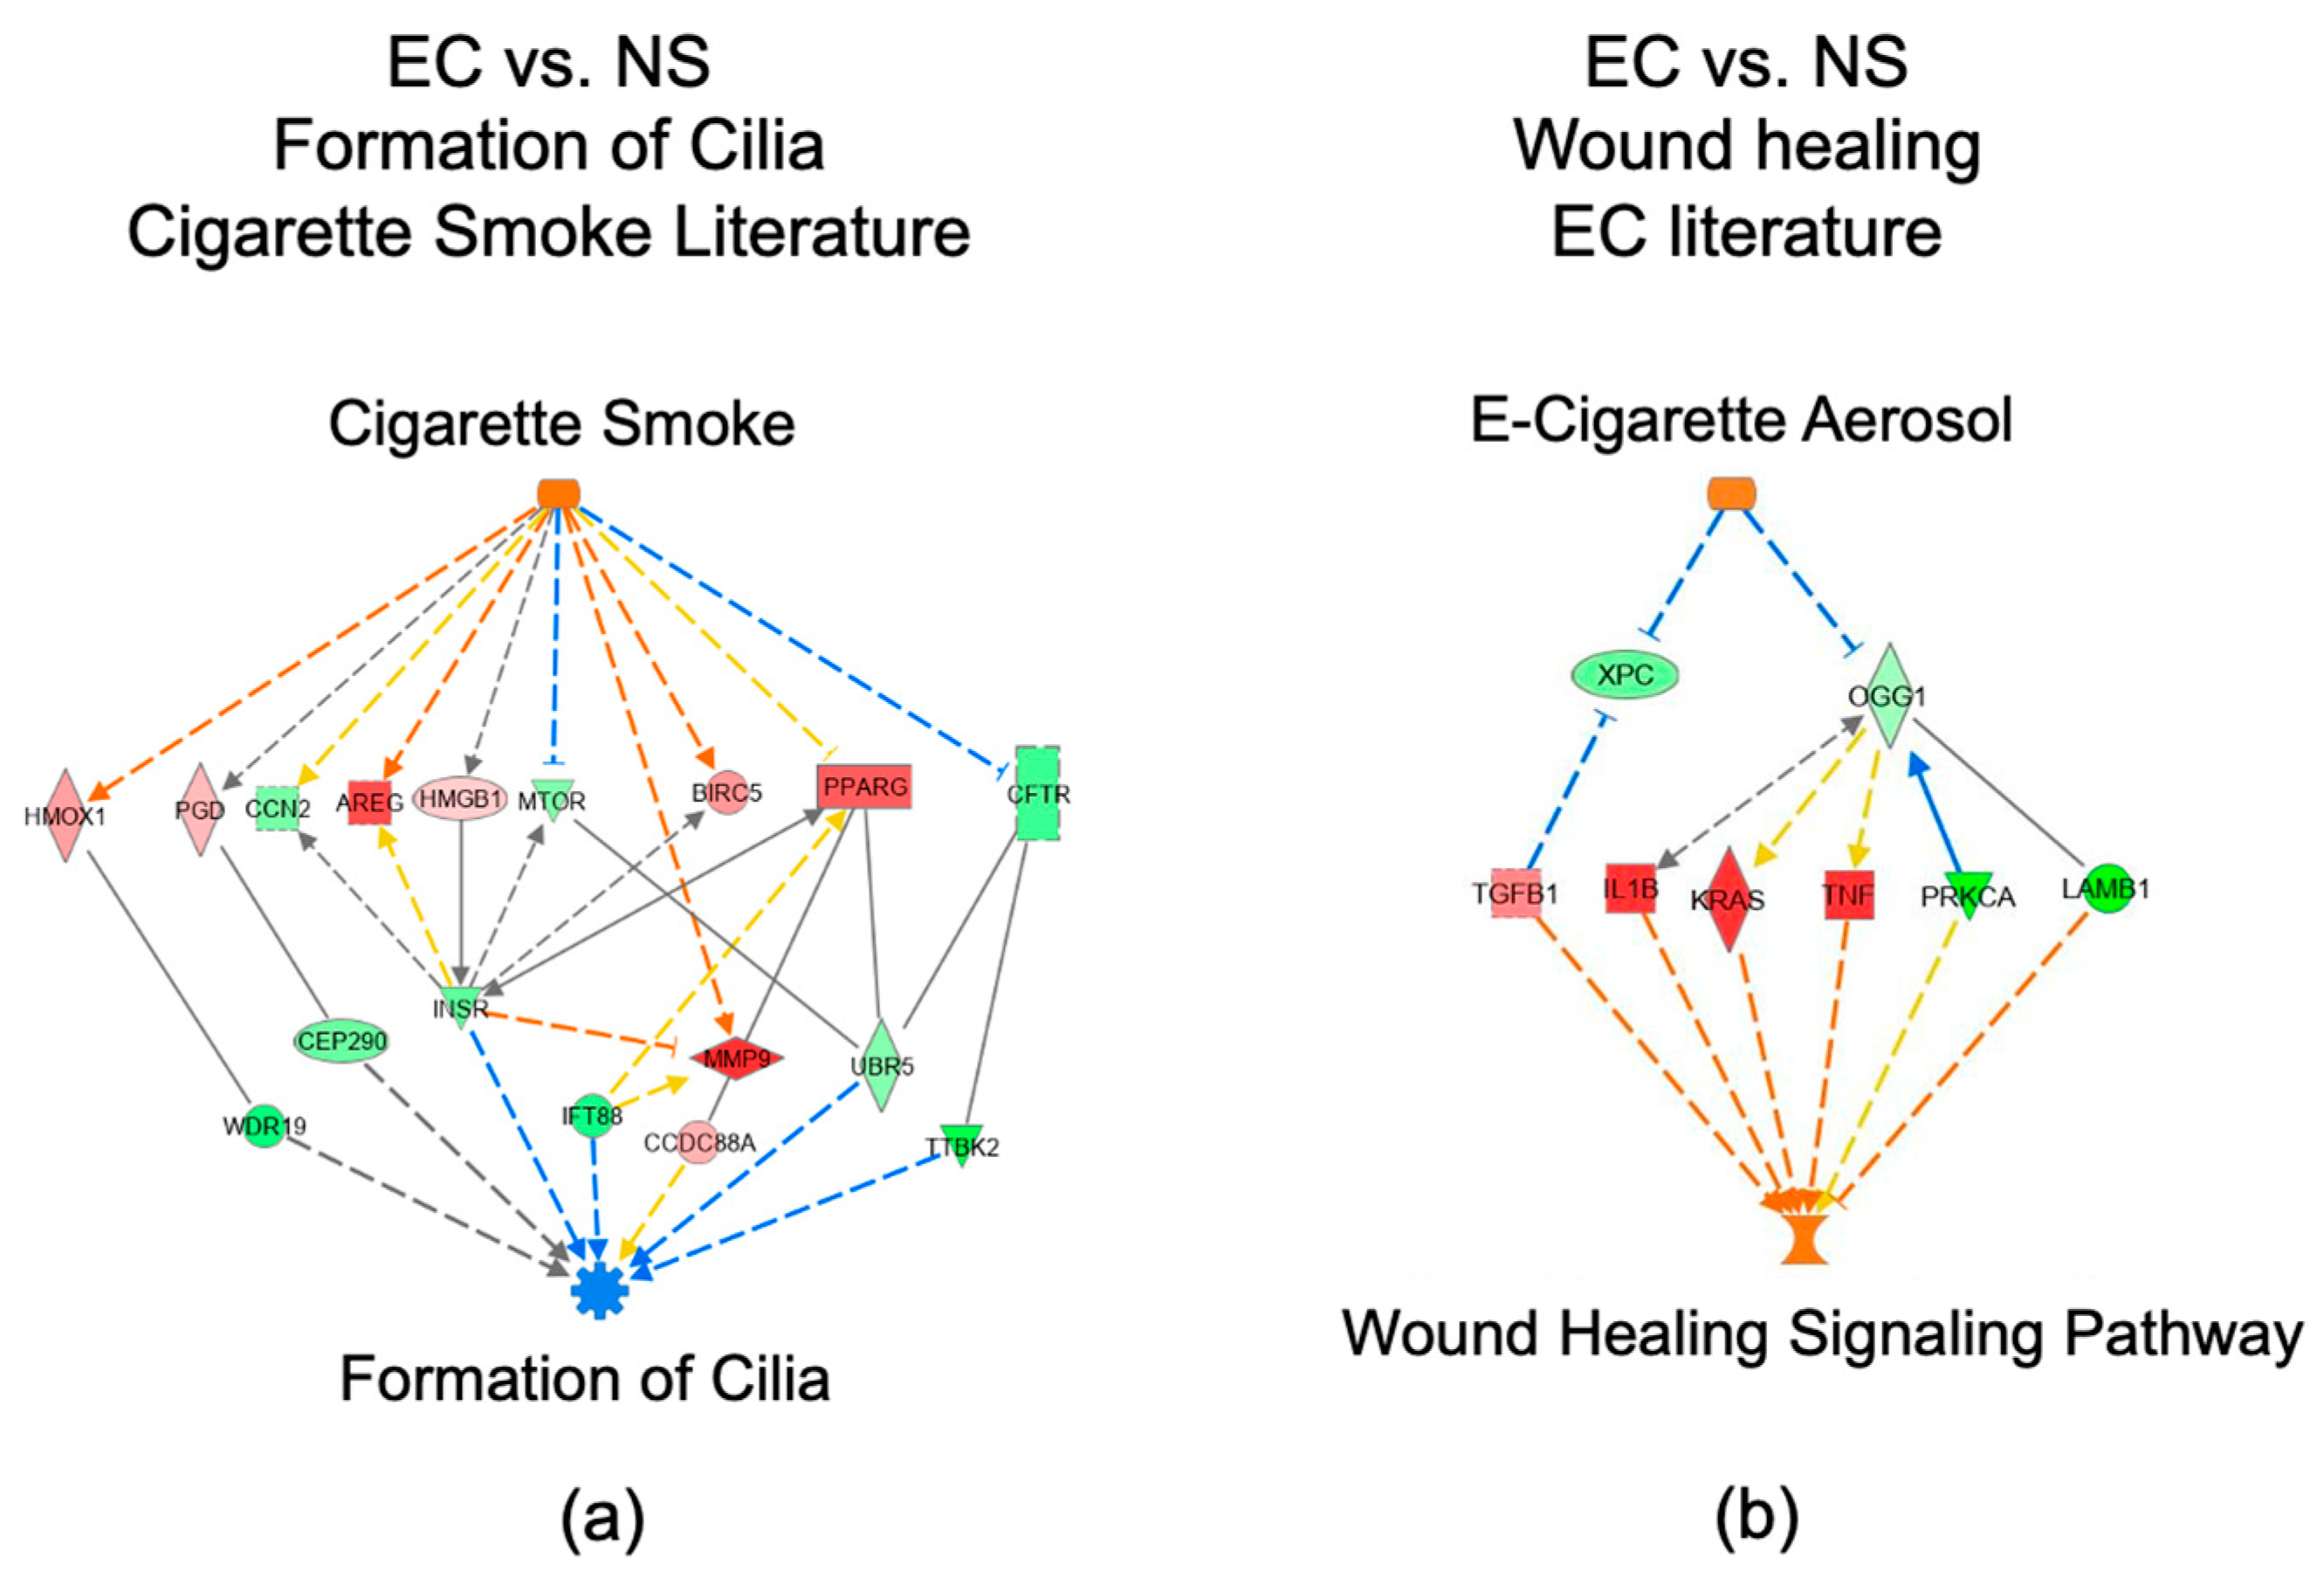
3.6. Networks Identified in the EC vs. NS Comparison
3.7. IPA Regulator Effect Analysis for the EC vs. NS Comparison
3.8. Disease Ontology Semantic and Enrichment (DOSE)
4. Discussion
5. Conclusions
Supplementary Materials
Author Contributions
Funding
Institutional Review Board Statement
Informed Consent Statement
Data Availability Statement
Conflicts of Interest
References
- Trtchounian, A.; Talbot, P. Electronic nicotine delivery systems: Is there a need for regulation? Tob. Control 2010, 20, 47–52. [Google Scholar] [CrossRef]
- National Academies of Sciences, Engineering, and Medicine, Health and Medicine Division; Board on Population Health and Public Health Practice; Committee on the Review of the Health Effects of Electronic Nicotine Delivery Systems. Public Health Consequences of E-Cigarettes; Eaton, D.L., Kwan, L.Y., Stratton, K., Eds.; National Academies Press: Washington, DC, USA, 2018.
- Polosa, R.; Morjaria, J.; Caponnetto, P.; Caruso, M.; Strano, S.; Battaglia, E.; Russo, C. Effect of Smoking Abstinence and Reduction in Asthmatic Smokers Switching to Electronic Cigarettes: Evidence for Harm Reversal. Int. J. Environ. Res. Public Health 2014, 11, 4965–4977. [Google Scholar] [CrossRef]
- Polosa, R. Electronic cigarette use and harm reversal: Emerging evidence in the lung. BMC Med. 2015, 13, 54. [Google Scholar] [CrossRef]
- Polosa, R.; Morjaria, J.B.; Coponnetto, P.; Prosperini, U.; Russo, C.; Pennisi, A.; Bruno, C.M. Evidence for harm reduction in COPD smokers who switch to electronic cigarettes. Respir. Res. 2016, 17, 166. [Google Scholar] [CrossRef]
- Polosa, R.; Morjaria, J.B.; Prosperini, U.; Russo, C.; Pennisi, A.; Puleo, R.; Caruso, M.; Caponnetto, P. Health effects in COPD smokers who switch to electronic cigarettes: A retrospective-prospective 3-year follow-up. Int. J. COPD 2018, 13, 2533–2542. [Google Scholar] [CrossRef]
- Adriaens, K.; Van Gucht, D.; Declerck, P.; Baeyens, F. Effectiveness of the Electronic Cigarette: An Eight-Week Flemish Study with Six-Month Follow-up on Smoking Reduction, Craving and Experienced Benefits and Complaints. Int. J. Environ. Res. 2014, 11, 11220–11248. [Google Scholar] [CrossRef]
- Goniewicz, M.L.; Miller, C.R.; Sutanto, E.; Li, D. How effective are electronic cigarettes for reducing respiratory and cardiovascular risk in smokers? A systematic review. Harm Reduct. J. 2020, 17, 91. [Google Scholar] [CrossRef]
- Arnold, M.J.; Nollen, N.L.; Mayo, M.S.; Ahluwalia, J.S.; Leavens, E.L.; Zhan, G.; Rice, M.; Pulvers, K. Harm Reduction Associated with Dual Use of Cigarettes and e-Cigarettes in Black and Latino Smokers: Secondary Analyses from a Randomized Controlled e-Cigarette Switching Trial. Nicotine Tob. Res. 2021, 23, 1972–1976. [Google Scholar] [CrossRef]
- Hua, M.; Alfi, M.; Talbot, P. Health-Related Effects Reported by Electronic Cigarette Users in Online Forums. J. Med. Internet Res. 2013, 15, e59. [Google Scholar] [CrossRef]
- Hua, M.; Sadah, S.; Hristidis, V.; Talbot, T. Health Effects Associated With Electronic Cigarette Use: Automated Mining of Online Forums. J. Med. Internet Res. 2020, 22, e15684. [Google Scholar] [CrossRef]
- Hua, M.; Talbot, P. Potential health effects of electronic cigarettes: A systematic review of case reports. Prev. Med. Rep. 2016, 4, 169–178. [Google Scholar] [CrossRef]
- Sakla, N.M.; Gattu, R.; Singh, G.; Sadler, M. Vaping-associated acute respiratory distress syndrome. Emerg. Radiol. 2020, 27, 103–106. [Google Scholar] [CrossRef]
- Jonas, A.M.; Raj, R. Vaping-Related Acute Parenchymal Lung Injury: A Systematic Review. Chest 2020, 158, 1555–1565. [Google Scholar] [CrossRef]
- Fryman, C.; Lou, B.; Weber, A.G.; Steinberg, H.N.; Khanijo, S.; Iakovou, A.; Makaryus, M.R. Acute Respiratory Failure Associated with Vaping. Chest 2020, 157, e63–e68. [Google Scholar] [CrossRef]
- Henry, T.S.; Kanne, J.P.; Kligerman, S.J. Imaging of vaping-associated lung disease. N. Engl. J. Med. 2019, 381, 1486–1487. [Google Scholar] [CrossRef]
- Martin, E.M.; Clapp, P.W.; Rebuli, M.E.; Pawlak, E.A.; Glista-Baker, E.; Benowitz, N.L.; Fry, R.C.; Jaspers, I. E-cigarette use results in suppression of immune and inflammatory-response genes in nasal epithelial cells similar to cigarette smoke. Am. J. Physiol. Lung Cell. Mol. Physiol. 2016, 311, L135–L144. [Google Scholar] [CrossRef]
- Rebuli, M.E.; Glista-Baker, E.; Hoffman, J.R.; Duffney, P.F.; Robinette, C.; Speen, A.M.; Pawlak, E.A.; Dhingra, R.; Noah, T.L.; Jaspers, I. Electronic-Cigarette Use Alters Nasal Mucosal Immune Response to Live-attenuated Influenza Virus. A Clinical Trial. Am. J. Respir. Cell Mol. Biol. 2021, 64, 126–137. [Google Scholar] [CrossRef]
- Corbett, S.E.; Nitzberg, M.; Moses, E.; Kleerup, E.; Wang, T.; Perdomo, C.; Perdomo, C.; Liu, G.; Xiao, X.; Liu, H.; et al. Gene Expression Alterations in the Bronchial Epithelium of e-Cigarette Users. Chest 2019, 156, 764–773. [Google Scholar] [CrossRef]
- Esteve-Codina, A.; Hofer, T.P.; Burggraf, D.; Heiss-Neumann, M.S.; Gesierich, W.; Boland, A.; Olaso, R.; Bihoreau, M.-T.; Deleuze, J.-F.; Moeller, W.; et al. Gender specific airway gene expression in COPD sub-phenotypes supports a role of mitochondria and of different types of leukocytes. Sci. Rep. 2021, 11, 12848. [Google Scholar] [CrossRef]
- Bolger, A.M.; Lohse, M.; Usadel, B. Trimmomatic: A flexible trimmer for Illumina sequence data. Bioinformatics 2014, 30, 2114–2120. [Google Scholar] [CrossRef]
- Backman, T.W.; Girke, T. systemPipeR: NGS workflow and report generation environment. BMC Bioinform. 2016, 17, 388. [Google Scholar] [CrossRef] [PubMed]
- Langmead, B.; Salzberg, S.L. Fast gapped-read alignment with Bowtie 2. Nat. Methods 2012, 9, 357–359. [Google Scholar] [CrossRef] [PubMed]
- Kim, D.; Pertea, G.; Trapnell, C.; Pimentel, H.; Kelley, R.; Salzberg, S.L. TopHat2: Accurate alignment of transcriptomes in the presence of insertions, deletions and gene fusions. Genome Biol. 2013, 14, R36. [Google Scholar] [CrossRef] [PubMed]
- Robinson, M.D.; McCarthy, D.J.; Smyth, G.K. edgeR: A Bioconductor package for differential expression analysis of digital gene expression data. Bioinformatics 2010, 26, 139–140. [Google Scholar] [CrossRef]
- Yu, G.; Wang, L.; Han, Y.; He, Q. clusterProfiler: An R package for comparing biological themes among gene clusters. OMICS A J. Integr. Biol. 2016, 16, 284–287. [Google Scholar] [CrossRef]
- Croft, D.; Mundo, A.F.; Haw, R.; Milacic, M.; Weiser, J.; Wu, G.; Caudy, M.; Garapati, P.; Gillespie, M.; Kamdar, M.R.; et al. The Reactome pathway knowledgebase. Nucleic Acids Res. 2014, 42, D472–D477. [Google Scholar] [CrossRef]
- Fabregat, A.; Sidiropoulos, K.; Viteri, G.; Forner, O.; Marin-Garcia, P.; Arnau, V.; D’Eustachio, P.; Stein, L.; Hermjakob, H. Reactome pathway analysis: A high-performance in-memory approach. BMC Bioinform. 2017, 18, 142. [Google Scholar] [CrossRef]
- Yu, G.; Wang, L.G.; Yan, G.R.; He, Q.Y. DOSE: An R/Bioconductor package for disease ontology semantic and enrichment analysis. Bioinformatics 2015, 31, 608–609. [Google Scholar] [CrossRef]
- Mosadomi, A.; Shklar, G.; Loftus, E.R.; Chauncey, H.H. Effects of tobacco smoking and age on the keratinization of palatal mucosa: A cytologic study. Oral Surg. Oral Med. Oral Pathol. 1978, 46, 413–417. [Google Scholar] [CrossRef]
- Tanriverdi, H.; Evrengul, H.; Kuru, O.; Tanriverdi, S.; Seleci, D.; Enli, Y.; Kaftan, H.A.; Kilic, M. Cigarette smoking induced oxidative stress may impair endothelial function and coronary blood flow in angiographically normal coronary arteries. Circ. J. 2006, 70, 593–599. [Google Scholar] [CrossRef]
- Lee, J.; Taneja, V.; Vassallo, R. Cigarette Smoking and Inflammation: Cellular and Molecular Mechanisms. J. Dent. Res. 2012, 91, 142–149. [Google Scholar] [CrossRef] [PubMed]
- Brekman, A.; Walters, M.S.; Tilley, A.E.; Crystal, R.G. FOXJ1 prevents cilia growth inhibition by cigarette smoke in human airway epithelium in vitro. Am. J. Respir. Cell Mol. Biol. 2014, 51, 688–700. [Google Scholar] [CrossRef] [PubMed]
- Lee, T.; Yang, C.M. Role of NADPH oxidase/ROS in pro-inflammatory mediators-induced airway and pulmonary diseases. Biochem. Pharmacol. 2012, 84, 581–590. [Google Scholar] [CrossRef]
- Loffredo, L.; Zicari, A.M.; Occasi, F.; Perri, L.; Carnevale, R.; Angelico, F.; Del Ben, M.; Martino, F.; Nocella, C.; De Castro, G.; et al. Role of NADPH oxidase-2 and oxidative stress in children exposed to passive smoking. Thorax 2018, 73, 986–988. [Google Scholar] [CrossRef]
- Khanna, A.; Guo, M.; Mehra, M.; Royal, W., 3rd. Inflammation and oxidative stress induced by cigarette smoke in Lewis rat brains. J. Neuroimmunol. 2013, 254, 69–75. [Google Scholar] [CrossRef]
- Raju, S.V.; Jackson, P.L.; Courville, C.A.; McNicholas, C.M.; Sloane, P.A.; Sabbatini, G.; Tidwell, S.; Tang, L.P.; Liu, B.; Fortenberry, J.A.; et al. Cigarette smoke induces systemic defects in cystic fibrosis transmembrane conductance regulator function. Am. J. Respir. Crit. Care Med. 2013, 188, 1321–1330. [Google Scholar] [CrossRef]
- Sumimoto, H.; Miyano, K.; Takeya, R. Molecular composition and regulation of the Nox family NAD(P)H oxidases. Biochem. Biophys. Res. Commun. 2005, 338, 677–686. [Google Scholar] [CrossRef]
- Cross, A.R. p40(phox) Participates in the activation of NADPH oxidase by increasing the affinity of p47(phox) for flavocytochrome b(558). Biochem. J. 2000, 349, 113–117. [Google Scholar] [CrossRef]
- Tarazona-Santos, E.; Machado, M.; Magalhães, W.C.; Chen, R.; Lyon, F.; Burdett, L.; Crenshaw, A.; Fabbri, C.; Pereira, L.; Pinto, L.; et al. Evolutionary dynamics of the human NADPH oxidase genes CYBB, CYBA, NCF2, and NCF4: Functional implications. Mol. Biol. Evol. 2013, 30, 2157–2167. [Google Scholar] [CrossRef]
- Noël, A.; Hossain, E.; Perveen, Z.; Zaman, H.; Penn, A.L. Sub-ohm vaping increases the levels of carbonyls, is cytotoxic, and alters gene expression in human bronchial epithelial cells exposed at the air-liquid interface. Respir. Res. 2020, 21, 305. [Google Scholar] [CrossRef]
- Kuntic, M.; Oelze, M.; Steven, S.; Kröller-Schön, S.; Stamm, P.; Kalinovic, S.; Frenis, K.; Vujacic-Mirski, K.; Bayo Jimenez, M.T.; Kvandova, M.; et al. Short-term e-cigarette vapour exposure causes vascular oxidative stress and dysfunction: Evidence for a close connection to brain damage and a key role of the phagocytic NADPH oxidase (NOX-2). Eur. Heart J. 2020, 41, 2472–2483. [Google Scholar] [CrossRef] [PubMed]
- Chatterjee, S.; Tao, J.Q.; Johncola, A.; Guo, W.; Caporale, A.; Langham, M.C.; Wehrli, F.W. Acute exposure to e-cigarettes causes inflammation and pulmonary endothelial oxidative stress in nonsmoking, healthy young subjects. Am. J. Physiol. Lung Cell. Mol. Physiol. 2019, 317, L155–L166. [Google Scholar] [CrossRef] [PubMed]
- Yao, H.; Edirisinghe, I.; Yang, S.R.; Rajendrasozhan, S.; Kode, A.; Caito, S.; Adenuga, D.; Rahman, I. Genetic ablation of NADPH oxidase enhances susceptibility to cigarette smoke-induced lung inflammation and emphysema in mice. Am. J. Pathol. 2008, 172, 1222–1237. [Google Scholar] [CrossRef] [PubMed]
- Darabseh, M.Z.; Maden-Wilkinson, T.M.; Welbourne, G.; Wüst, R.C.I.; Ahmed, N.; Aushah, H.; Selfe, J.; Morse, C.I.; Degens, H. Fourteen days of smoking cessation improves muscle fatigue resistance and reverses markers of systemic inflammation. Sci. Rep. 2021, 11, 12286. [Google Scholar] [CrossRef]
- Reidel, B.; Radicioni, G.; Clapp, P.W.; Ford, A.A.; Abdelwahab, S.; Rebuli, M.E.; Haridass, P.; Alexis, N.E.; Jaspers, I.; Kesimer, M. E-Cigarette Use Causes a Unique Innate Immune Response in the Lung, Involving Increased Neutrophilic Activation and Altered Mucin Secretion. Am. J. Respir. Crit. Care Med. 2018, 197, 492–501. [Google Scholar] [CrossRef]
- Barnes, P.J. Mechanisms in COPD: Differences from asthma. Chest 2000, 117, 10S–14S. [Google Scholar] [CrossRef]
- Lerner, C.A.; Sundar, I.K.; Yao, H.; Gerloff, J.; Ossip, D.J.; McIntosh, S.; Robinson, R.; Rahman, I. Vapors produced by electronic cigarettes and e-juices with flavorings induce toxicity, oxidative stress, and inflammatory response in lung epithelial cells and in mouse lung. PLoS ONE 2015, 10, e0116732. [Google Scholar] [CrossRef]
- Escobar, Y.H.; Nipp, G.; Cui, T.; Petters, S.S.; Surratt, J.D.; Jaspers, I. In Vitro Toxicity and Chemical Characterization of Aerosol Derived from Electronic Cigarette Humectants Using a Newly Developed Exposure System. Chem. Res. Toxicol. 2020, 33, 1677–1688. [Google Scholar] [CrossRef]
- Escobar, Y.H.; Morrison, C.B.; Chen, Y.; Hickman, E.; Love, C.A.; Rebuli, M.E.; Surratt, J.D.; Ehre, C.; Jaspers, I. Differential responses to e-cig generated aerosols from humectants and different forms of nicotine in epithelial cells from nonsmokers and smokers. Am. J. Physiol. Lung Cell. Mol. Physiol. 2021, 320, L1064–L1073. [Google Scholar] [CrossRef]
- Nair, V.; Tran, M.; Behar, R.Z.; Zhai, S.; Cui, X.; Phandthong, R.; Wang, Y.; Pan, S.; Luo, W.; Pankow, J.F.; et al. Menthol in electronic cigarettes: A contributor to respiratory disease? Toxicol. Appl. Pharmacol. 2020, 407, 115238. [Google Scholar] [CrossRef]
- Peters, E.J.; Morice, R.; Benner, S.E.; Lippman, S.; Lukeman, J.; Lee, J.S.; Ro, J.Y.; Hong, W.K. Squamous metaplasia of the bronchial mucosa and its relationship to smoking. Chest 1993, 103, 1429–1432. [Google Scholar] [CrossRef] [PubMed]
- Rigden, H.M.; Alias, A.; Havelock, T.; O’Donnell, R.; Djukanovic, R.; Davies, D.E.; Wilson, S.J. Squamous Metaplasia Is Increased in the Bronchial Epithelium of Smokers with Chronic Obstructive Pulmonary Disease. PLoS ONE 2016, 11, e0156009. [Google Scholar] [CrossRef] [PubMed]
- Yee, K.K.; Pribitkin, E.A.; Cowart, B.J.; Vainius, A.A.; Klock, C.T.; Rosen, D.; Hahn, C.G.; Rawson, N.E. Smoking-associated squamous metaplasia in olfactory mucosa of patients with chronic rhinosinusitis. Toxicol. Pathol. 2009, 37, 594–598. [Google Scholar] [CrossRef] [PubMed]
- Lapperre, T.S.; Sont, J.K.; van Schadewijk, A.; Gosman, M.M.; Postma, D.S.; Bajema, I.M.; Timens, W.; Mauad, T.; Hiemstra, P.S.; GLUCOLD Study Group. Smoking cessation and bronchial epithelial remodeling in COPD: A cross-sectional study. Respir. Res. 2007, 8, 85. [Google Scholar] [CrossRef] [PubMed]
- Schamberger, A.; Staab-Weijnitz, C.; Mise-Racek, N.; Eickelberg, O. Cigarette smoke alters primary human bronchial epithelial cell differentiation at the air-liquid interface. Sci. Rep. 2015, 5, 8163. [Google Scholar] [CrossRef] [PubMed]
- Chung, S.; Baumlin, N.; Dennis, J.S.; Moore, R.; Salathe, S.F.; Whitney, P.L.; Sabater, J.; Abraham, W.M.; Kim, M.D.; Salathe, M. Electronic Cigarette Vapor with Nicotine Causes Airway Mucociliary Dysfunction Preferentially via TRPA1 Receptors. Am. J. Respir. Crit. Care Med. 2019, 200, 1134–1145. [Google Scholar] [CrossRef] [PubMed]
- Clapp, P.W.; Lavrich, K.S.; van Heusden, C.A.; Lazarowski, E.R.; Carson, J.L.; Jaspers, I. Cinnamaldehyde in flavored e-cigarette liquids temporarily suppresses bronchial epithelial cell ciliary motility by dysregulation of mitochondrial function. Am. J. Physiol. Lung Cell. Mol. Physiol. 2019, 316, L470–L486. [Google Scholar] [CrossRef]
- Park, H.R.; O’Sullivan, M.; Vallarino, J.; Shumyatcher, M.; Himes, B.E.; Park, J.A.; Christiani, D.C.; Allen, J.; Lu, Q. Transcriptomic response of primary human airway epithelial cells to flavoring chemicals in electronic cigarettes. Sci. Rep. 2019, 9, 1400. [Google Scholar] [CrossRef]
- Omaiye, E.E.; McWhirter, K.J.; Luo, W.; McWhirter, K.J.; Pankow, J.F.; Talbot, P. High concentrations of flavor chemicals are present in electronic cigarette refill fluids. Sci. Rep. 2019, 9, 2468. [Google Scholar] [CrossRef]
- Omaiye, E.E.; Luo, W.; McWhirter, K.J.; Pankow, J.F.; Talbot, P. Electronic Cigarette Refill Fluids Sold Worldwide: Flavor Chemical Composition, Toxicity, and Hazard Analysis. Chem. Res. Toxicol. 2020, 33, 2972–2987. [Google Scholar] [CrossRef]
- Behar, R.Z.; Luo, W.; Lin, S.C.; Wang, Y.; Valle, J.; Pankow, J.F.; Talbot, P. Distribution, quantification and toxicity of cinnamaldehyde in electronic cigarette refill fluids and aerosols. Tob. Control 2016, 25, ii94–ii102. [Google Scholar] [CrossRef] [PubMed]
- Behar, R.Z.; Luo, W.; McWhirter, K.J.; Pankow, J.F.; Talbot, P. Analytical and toxicological evaluation of flavor chemicals in electronic cigarette refill fluids. Sci. Rep. 2018, 8, 8288. [Google Scholar] [CrossRef] [PubMed]
- US Department of Health and Human Services; Centers for Disease Control and Prevention; National Center for Chronic Disease Prevention and Health Promotion; Office on Smoking and Health. The Health Consequences of Smoking–50 Years of Progress: A Report of the Surgeon General; Centers for Disease Control and Prevention: Atlanta, GA, USA, 2014.
- Tilley, A.E.; Walters, M.S.; Shaykhiev, R.; Crystal, R.G. Cilia dysfunction in lung disease. Annu. Rev. Physiol. 2015, 77, 379–406. [Google Scholar] [CrossRef] [PubMed]
- Siques, P.; Brito, J.; Pena, E. Reactive Oxygen Species and Pulmonary Vasculature During Hypobaric Hypoxia. Front. Physiol. 2018, 9, 865. [Google Scholar] [CrossRef]
- Kellner, M.; Noonepalle, S.; Lu, Q.; Srivastava, A.; Zemskov, E.; Black, S.M. ROS Signaling in the Pathogenesis of Acute LungInjury (ALI) and Acute Respiratory Distress Syndrome (ARDS). In Pulmonary Vasculature Redox Signaling in Health and Disease; Springer: Cham, Switzerland, 2017; Volume 967, pp. 105–137. [Google Scholar] [CrossRef]
- Zhang, Y.; He, J.; He, B.; Huang, R.; Li, M. Effect of tobacco on periodontal disease and oral cancer. Tob. Induc. Dis. 2019, 17, 40. [Google Scholar] [CrossRef]
- Jeong, W.; Choi, D.W.; Kim, Y.K.; Lee, H.J.; Lee, S.A.; Park, E.C.; Jang, S.I. Associations of electronic and conventional cigarette use with periodontal disease in South Korean adults. J. Periodontol. 2020, 91, 55–64. [Google Scholar] [CrossRef]
- Omaiye, E.E.; McWhirter, K.J.; Luo, W.; Pankow, J.F.; Talbot, P. High-Nicotine Electronic Cigarette Products: Toxicity of JUUL Fluids and Aerosols Correlates Strongly with Nicotine and Some Flavor Chemical Concentrations. Chem. Res. Toxicol. 2019, 32, 1058–1069. [Google Scholar] [CrossRef]
- Davis, B.; Dang, M.; Kim, J.; Talbot, P. Nicotine concentrations in electronic cigarette refill and do-it-yourself fluids. Nicotine Tob. Res. 2015, 17, 134–141. [Google Scholar] [CrossRef]
- Omaiye, E.E.; Luo, W.; McWhirter, K.J.; Pankow, J.F.; Talbot, P. Flavour chemicals, synthetic coolants and pulegone in popular mint-flavoured and menthol-flavoured e-cigarettes. Tob. Control. 2021, 1–7. [Google Scholar] [CrossRef]
- Pozuelos, G.L.; Rubin, M.; Vargas, S.; Ramirez, E.; Bandaru, D.; Sha, J.; Wohlschlegel, J.; Talbot, P. Nicotine Affects Multiple Biological Processes in EpiDermTM Organotypic Tissues and Keratinocyte Monolayers. Atmosphere 2022, 13, 810. [Google Scholar] [CrossRef]
- Zhang, S.; Day, I.; Ye, S. Nicotine Induced Changes in Gene Expression by Human Coronary Artery Endothelial Cells. Atherosclerosis 2001, 154, 277–283. [Google Scholar] [CrossRef]
- Elwany, S.; Shewel, Y.; Bazak, R.; Talaat, I.; Elwany, M. Quitting smoking reverses nasal mucosal changes. Eur. Arch. Oto-Rhino-Laryngol. 2020, 277, 1691–1698. [Google Scholar] [CrossRef] [PubMed]
- Kosmider, L.; Sobczak, A.; Fik, M.; Knysak, J.; Zaciera, M.; Kurek, J.; Goniewicz, M.L. Carbonyl Compounds in Electronic Cigarette Vapors: Effects of Nicotine Solvent and Battery Output Voltage. Nicotine Tob. Res. 2014, 16, 1319–1326. [Google Scholar] [CrossRef] [PubMed]
- Uchiyama, S.; Noguchi, M.; Sato, A.; Ishitsuka, M.; Inaba, Y.; Kunugita, N. Determination of Thermal Decomposition Products Generated from E-Cigarettes. Chem. Res. Toxicol. 2020, 33, 576–583. [Google Scholar] [CrossRef]
- Talbot, P.; DiCarlantonio, G.; Knoll, M.; Gomez, C. Identification of Cigarette Smoke Components That Alter Functioning of Hamster (Mesocricetus auratus) Oviducts In Vitro. Biol. Reprod. 1998, 58, 1047–1053. [Google Scholar] [CrossRef][Green Version]
- Duell, A.K.; Pankow, J.F.; Peyton, D.H. Nicotine in Tobacco Product aerosols: ‘It’s déjà vu all over again’. Tob. Control 2020, 29, 656–662. [Google Scholar] [CrossRef]
- Khachatoorian, C.; McWhirter, K.J.; Luo, W.; Pankow, J.F.; Talbot, P. Tracing the movement of electronic cigarette flavor chemicals and nicotine from refill fluids to aerosol, lungs, exhale, and the environment. Chemosphere 2022, 286, 131494. [Google Scholar] [CrossRef]
- Olmedo, P.; Goessler, W.; Tanda, S.; Grau-Perez, M.; Jarmul, S.; Aherrera, A.; Chen, R.; Hilpert, M.; Cohen, J.E.; Navas-Acien, A.; et al. Metal Concentrations in e-Cigarette Liquid and Aerosol Samples: The Contribution of Metallic Coils. Environ. Health Perspect. 2018, 126, 027010. [Google Scholar] [CrossRef]
- Williams, M.; Li, J.; Talbot, P. Effects of Model, Method of Collection, and Topography on Chemical Elements and Metals in the Aerosol of Tank-Style Electronic Cigarettes. Sci. Rep. 2019, 9, 13969. [Google Scholar] [CrossRef]


Publisher’s Note: MDPI stays neutral with regard to jurisdictional claims in published maps and institutional affiliations. |
© 2022 by the authors. Licensee MDPI, Basel, Switzerland. This article is an open access article distributed under the terms and conditions of the Creative Commons Attribution (CC BY) license (https://creativecommons.org/licenses/by/4.0/).
Share and Cite
Pozuelos, G.L.; Kagda, M.; Rubin, M.A.; Goniewicz, M.L.; Girke, T.; Talbot, P. Transcriptomic Evidence That Switching from Tobacco to Electronic Cigarettes Does Not Reverse Damage to the Respiratory Epithelium. Toxics 2022, 10, 370. https://doi.org/10.3390/toxics10070370
Pozuelos GL, Kagda M, Rubin MA, Goniewicz ML, Girke T, Talbot P. Transcriptomic Evidence That Switching from Tobacco to Electronic Cigarettes Does Not Reverse Damage to the Respiratory Epithelium. Toxics. 2022; 10(7):370. https://doi.org/10.3390/toxics10070370
Chicago/Turabian StylePozuelos, Giovanna L., Meenakshi Kagda, Matine A. Rubin, Maciej L. Goniewicz, Thomas Girke, and Prue Talbot. 2022. "Transcriptomic Evidence That Switching from Tobacco to Electronic Cigarettes Does Not Reverse Damage to the Respiratory Epithelium" Toxics 10, no. 7: 370. https://doi.org/10.3390/toxics10070370
APA StylePozuelos, G. L., Kagda, M., Rubin, M. A., Goniewicz, M. L., Girke, T., & Talbot, P. (2022). Transcriptomic Evidence That Switching from Tobacco to Electronic Cigarettes Does Not Reverse Damage to the Respiratory Epithelium. Toxics, 10(7), 370. https://doi.org/10.3390/toxics10070370