RFID-Enhanced Modified Two-Bin System for Reducing Excess Inventory of FMCG Industry
Abstract
1. Introduction
2. Literature Review
3. Methodology
3.1. Research Approach
3.2. Data Collection
3.3. RFID-Based Modified Bin System with a Developed OPQ Model Formulation
3.3.1. Model Assumptions, Parameters and Variables
- The time period of RFID counting will be constant for each batch production.
- The maximum number of defect items is constant.
- Lead time is less than the RFID counting period.
- Only one type of product is involved at a time to determine production quantity.
| Parameters and Variables: | |
| Period of RFID counting. | |
| Lead time. | |
| Total days, . | |
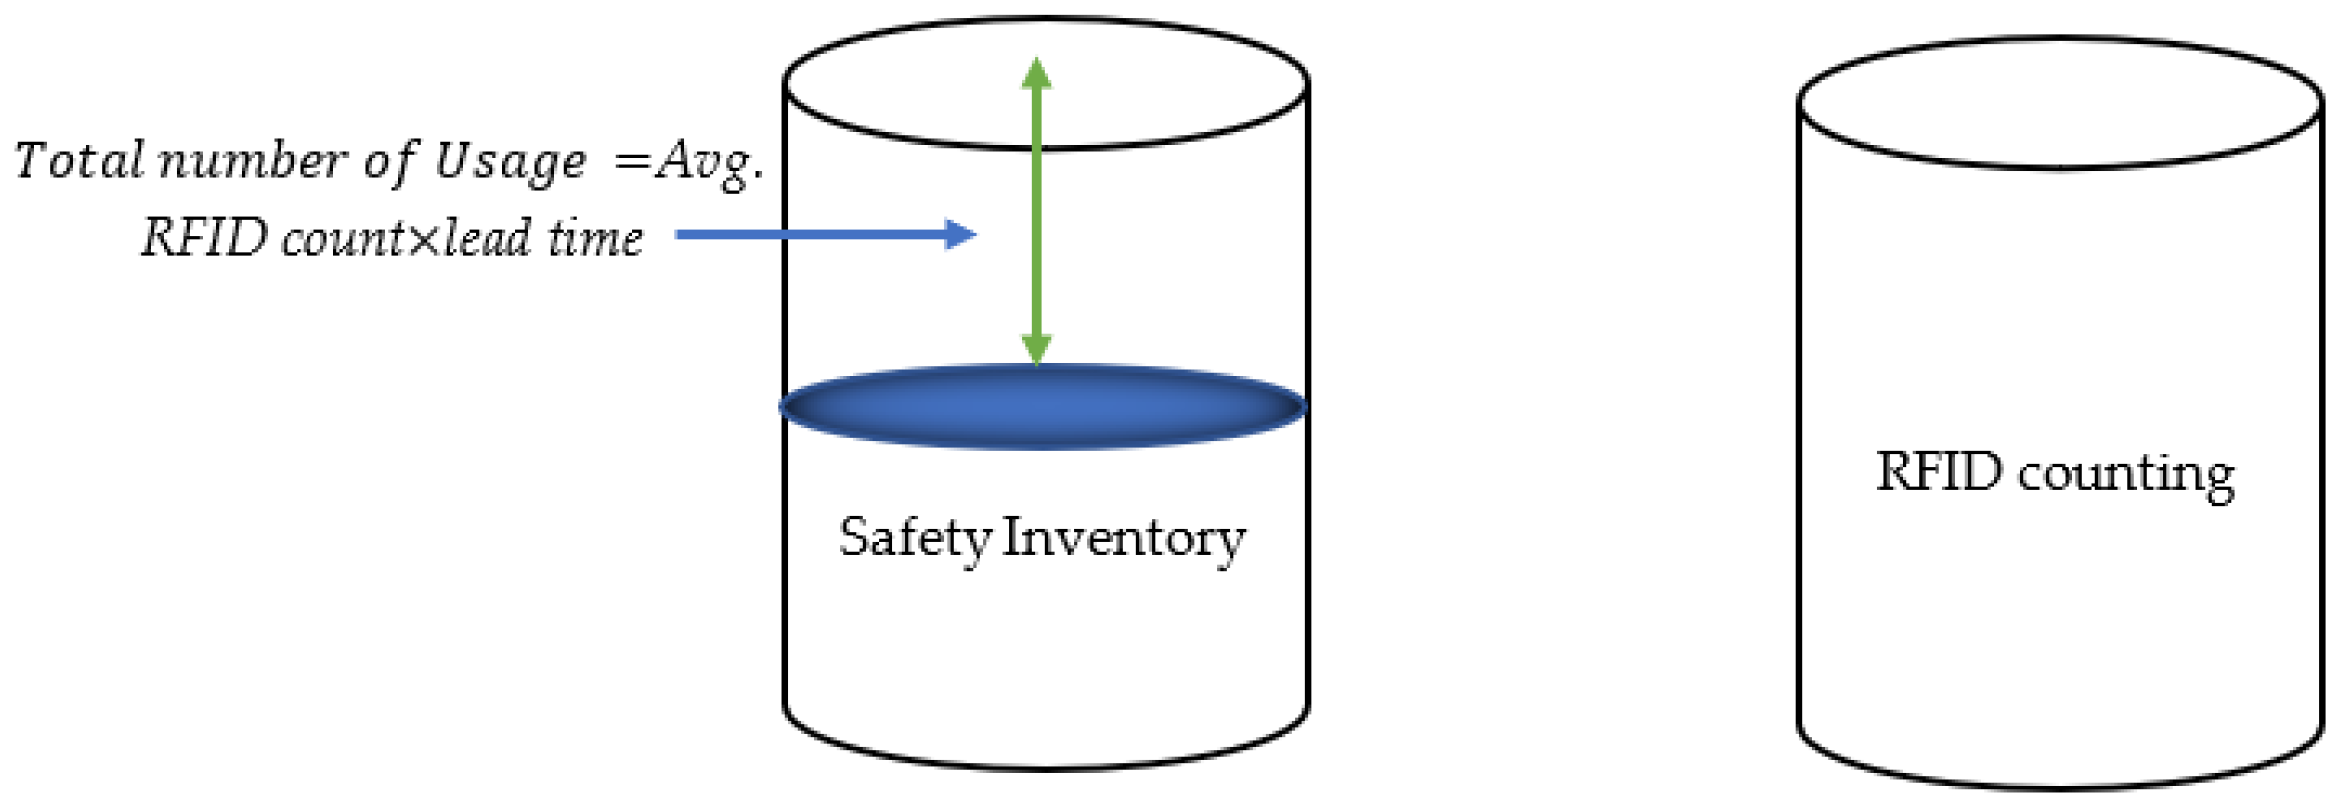
| Average usage. | |
| RFID counting for counting the number of removed items, . | |
| Total RFID counting for all the distribution centers. | |
| Defect rate,. | |
| Target production for the nth week. | |
| Rework rate. | |
| Optimized reworked rates after ABC optimization. | |
| Production time. | |
| Total period of procurement time and the time period after the production period, . | |
| Usage rate for the nth week. | |
| Production rate for the nth week. | |
| Actual defect item for the nth week. | |
| Deviation from the defect item. | |
| Maximum defect item for the nth week. | |
| Demand for the nth week. | |
| Per unit holding cost. | |
| Deviation from defect items for the nth week. | |
| Reworked item for the nth week. | |
| Total allowed cost. | |
| Total remaining cost for reworking the item and the holding cost of the item. | |
| Per unit allowed remaining cost for reworking and holding cost of reworking item. | |
| Reduction in excess inventory. | |
| Number/population of bees in ABC optimization. | |
| Decision Variables: | |
| Traditional excess inventory for the nth week. | |
| Excess inventory for the nth week after OPQ model implementation. | |
| Excess inventory for the nth week after cost optimization by the Artificial Bee Colony Algorithm. | |
| Reduction in excess inventory after OPQ model implementation. | |
| Reduction in excess inventory after cost optimization. | |
3.3.2. Mathematical Formulation of Developed Model
4. Results
4.1. Performance of Developed OPQ Model
4.2. Integration of the ABC Algorithm for Cost Optimization
4.3. Results of Sensitivity Analysis
5. Discussion
6. Conclusions
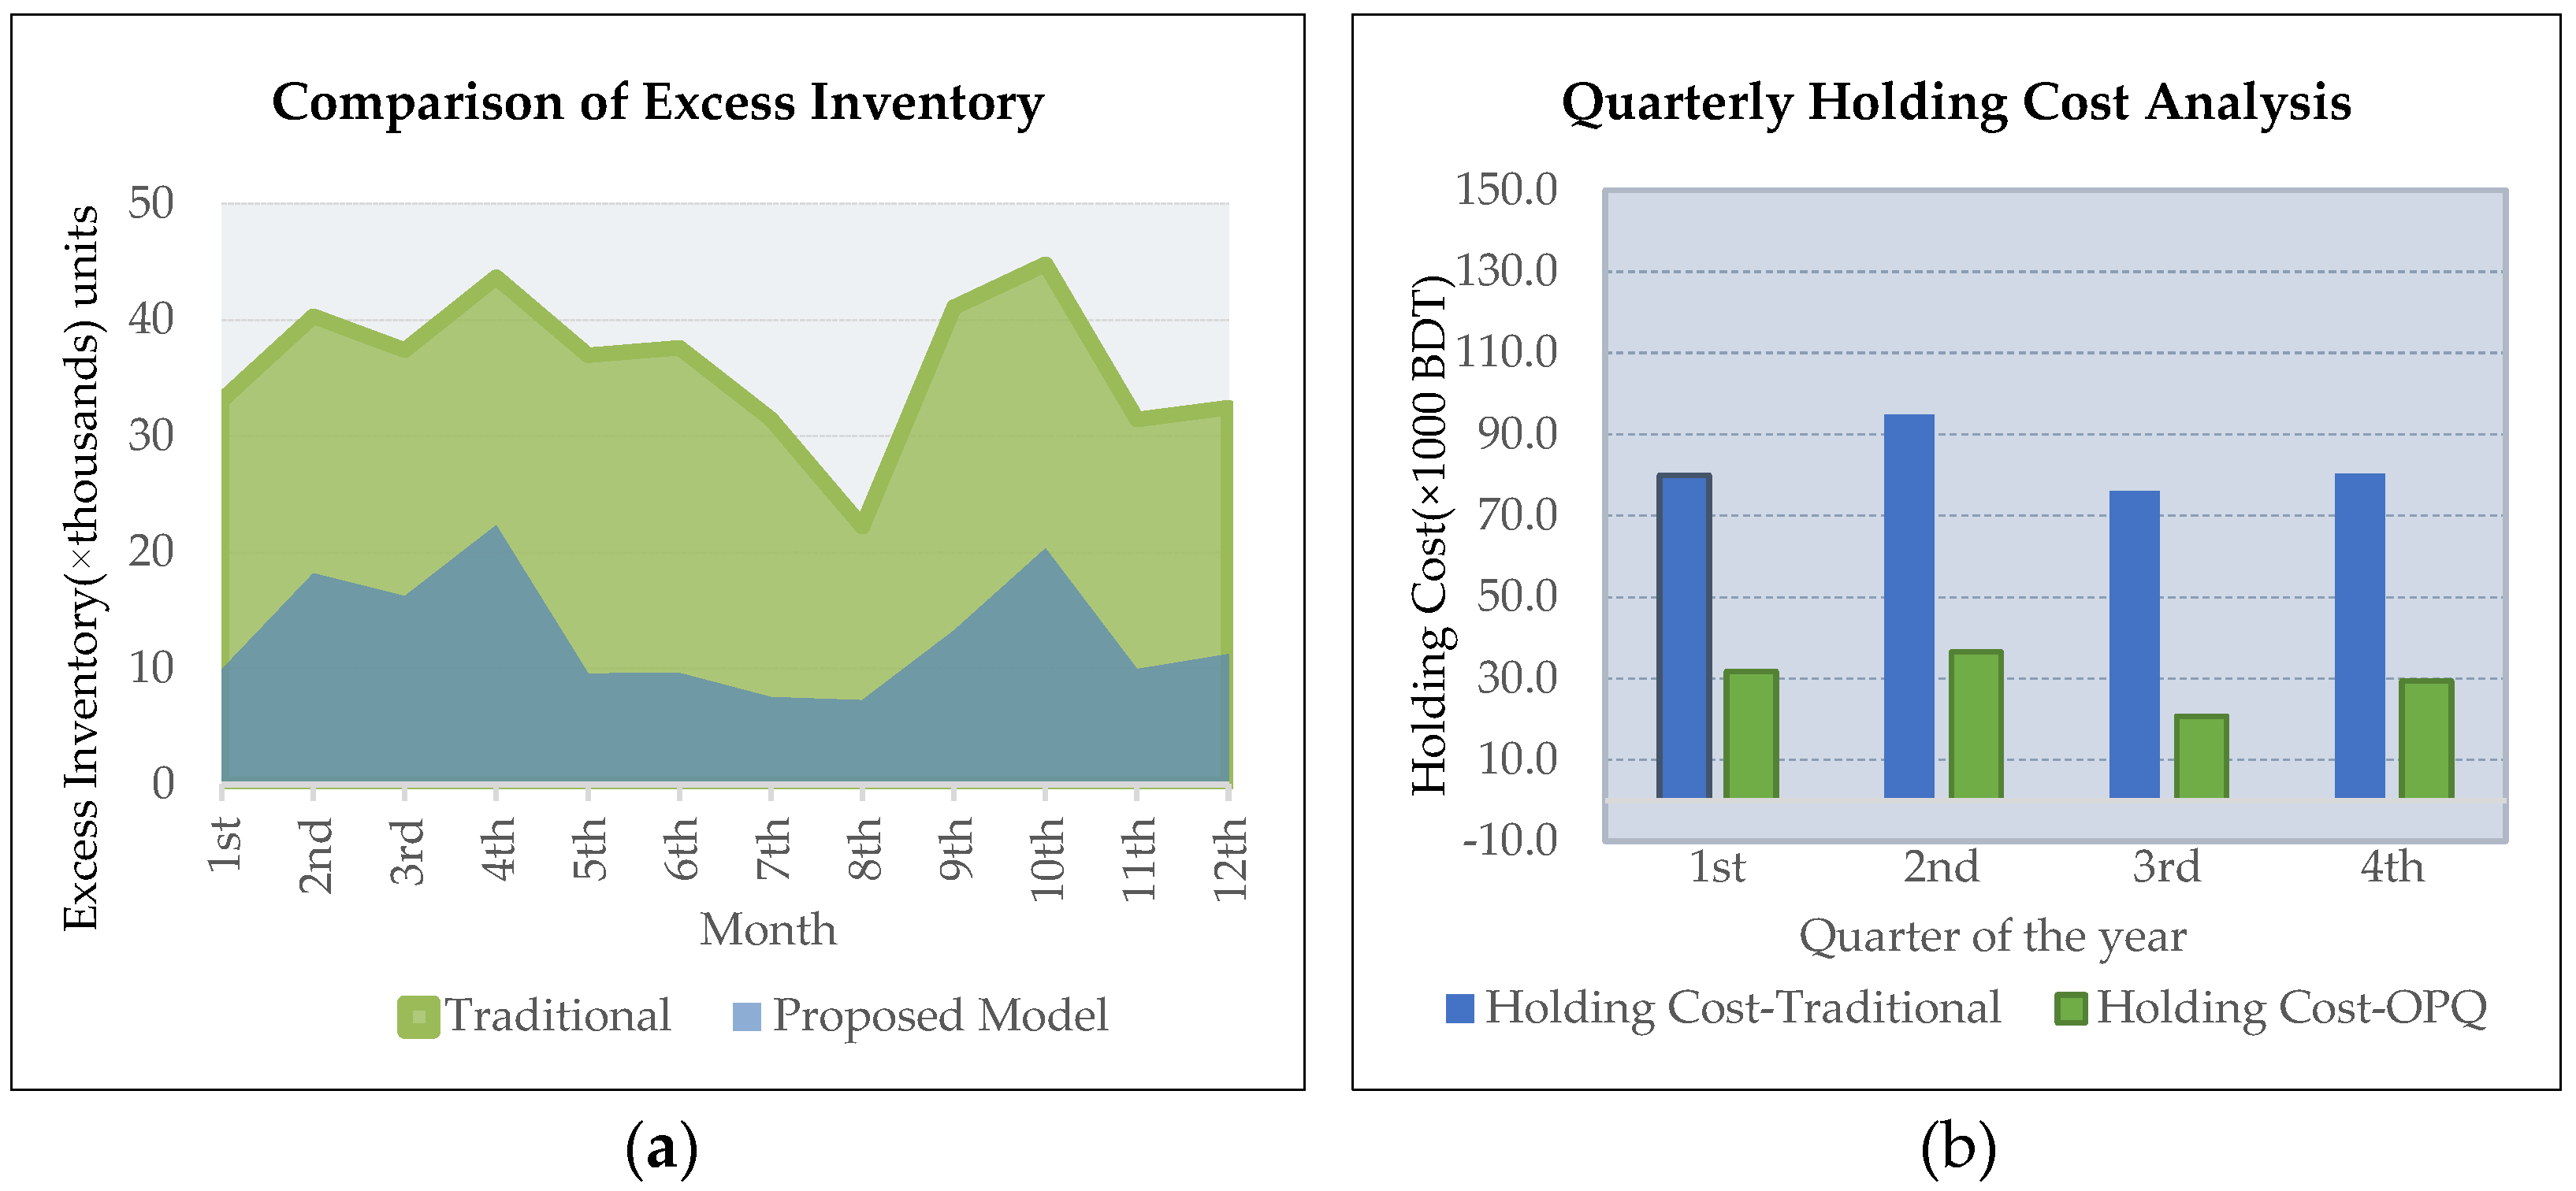
- Proposed OPQ implementation indicates a pronounced reduction in excess inventory in percentages of 49%, 67%, 65% after the fourth month, eighth month, and twelfth month, respectively. As a result, tangible cost–benefit from a managerial point of view results in a reduction in cumulative holding costs in percentage of 57%, 63%, 64%, respectively.
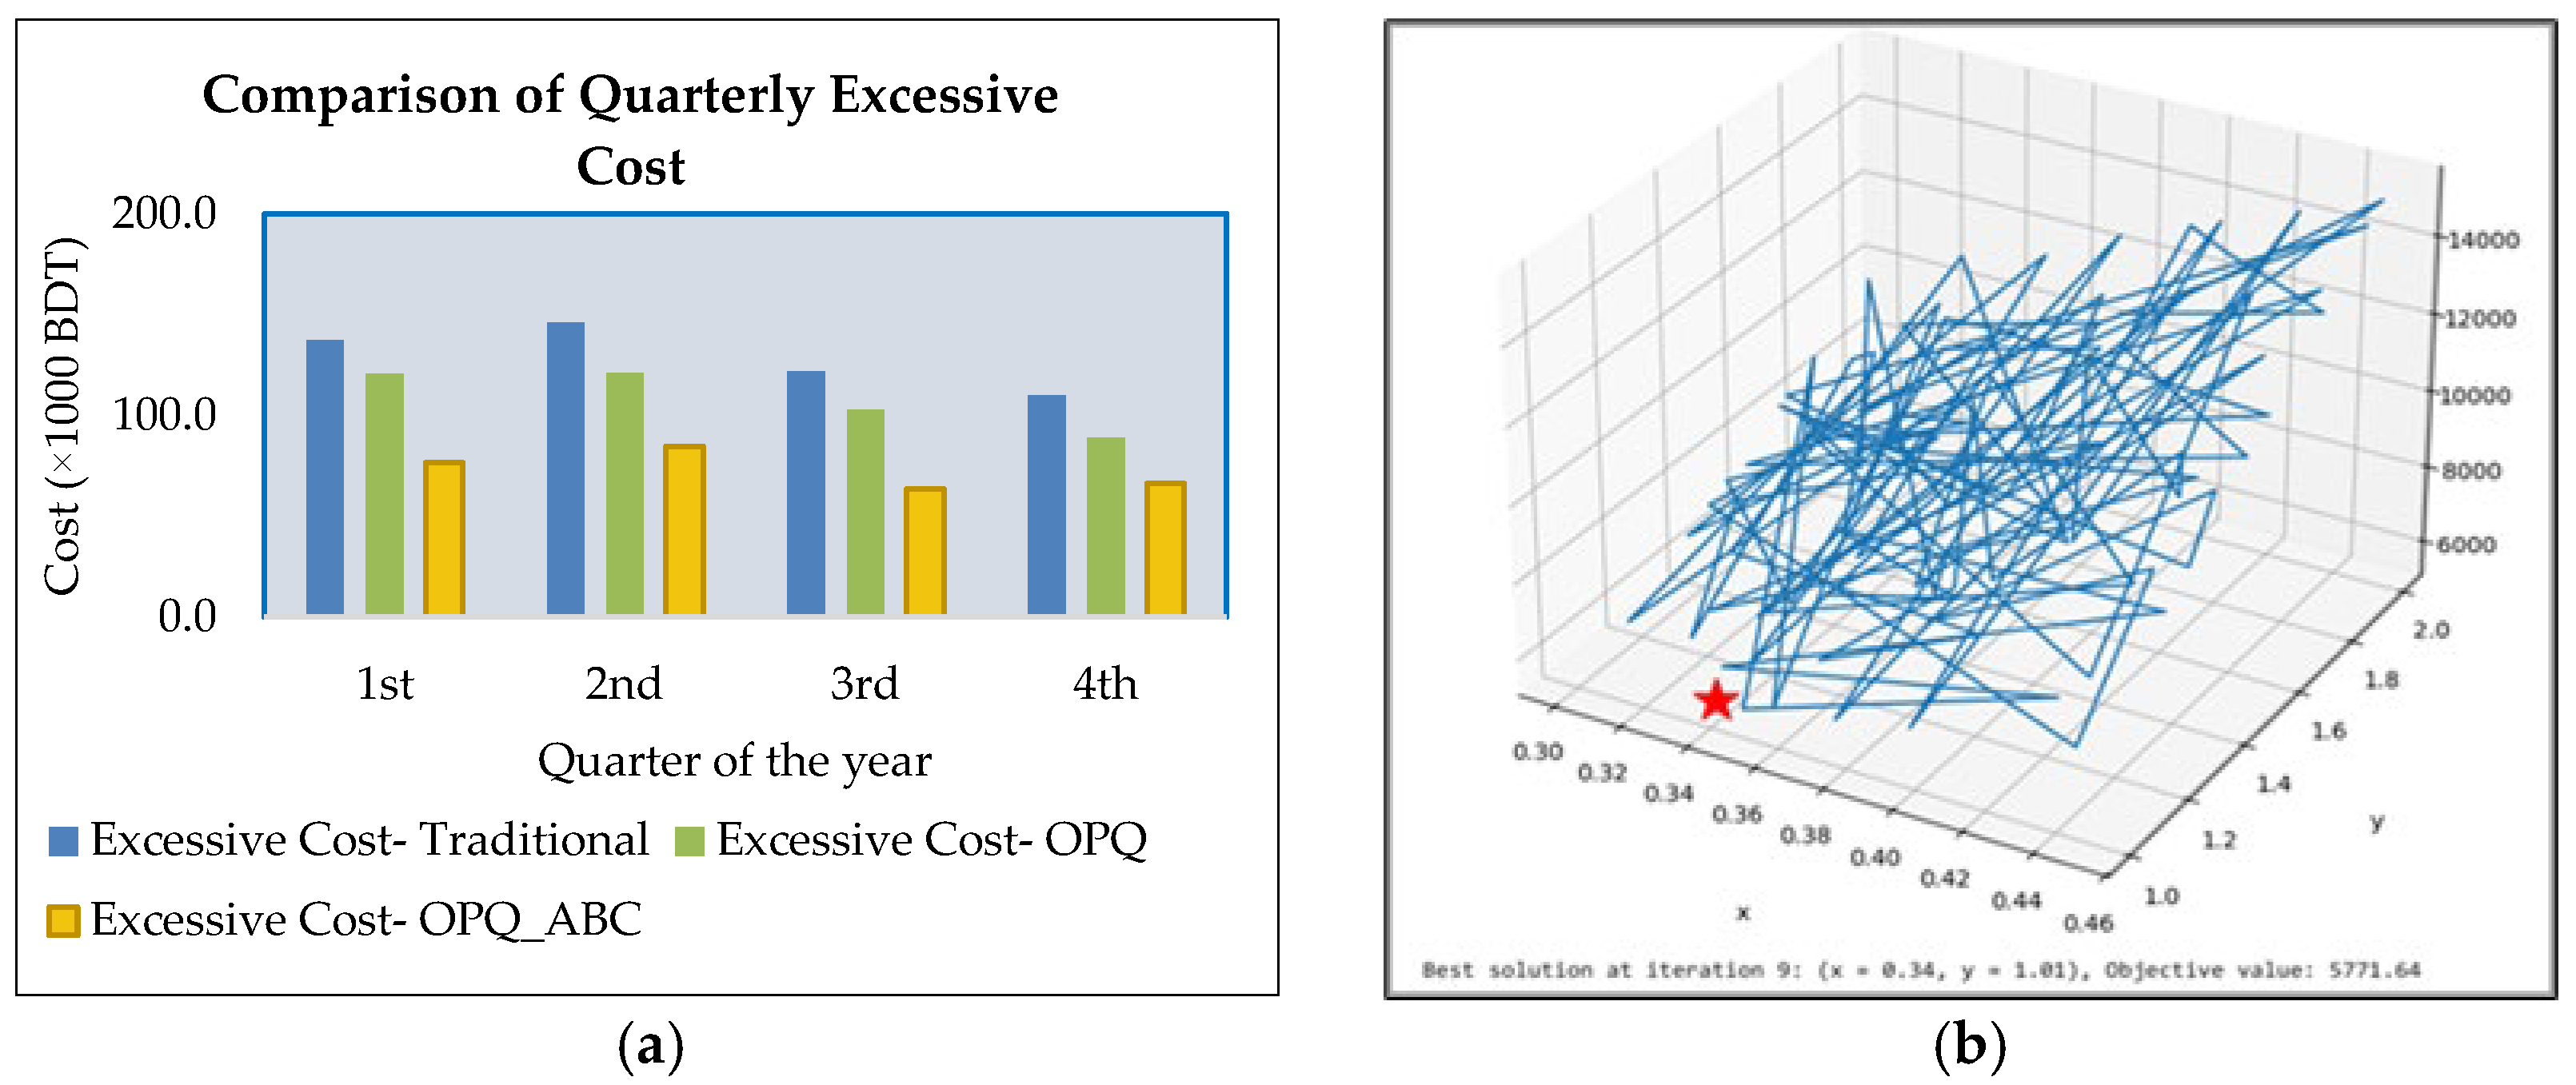
- After the integration of the ABC algorithm into the proposed model, considerable cost–benefit was obtained on both reworking cost and holding cost, which leads to the overall cumulative excessive cost reduction in percentage of 41%, 44%, 44% after the fourth month, eighth month, and twelfth month, respectively.
Author Contributions
Funding
Institutional Review Board Statement
Informed Consent Statement
Data Availability Statement
Conflicts of Interest
Abbreviations
| FMCG | Fast-Moving Consumer Goods |
| RFID | Radio-Frequency Identification |
| ABC | Artificial Bee Colony |
| EI | Excess Inventory |
| OPQ | Optimal Production Quantity |
| Notations: | |
| The following notations are introduced for formulation: | |
| Indices: | |
| Number of distribution centers. | |
| Total days, t [d1, d1 + d2]. | |
| No. of weeks. | |
| Minimum. | |
| Maximum. | |
| Random number. | |
| Cost. | |
| Cost optimization of a specific variable. | |
References
- Grunow, M.; Piramuthu, S. RFID in Highly Perishable Food Supply Chains—Remaining Shelf Life to Supplant Expiry Date? Int. J. Prod. Economics 2013, 146, 717–727. [Google Scholar] [CrossRef]
- John, K.; Rajendran, C.; Ziegler, H. A Comparative Study on Allocation/Rationing Mechanisms Operational with/without Backorder Clearing in Divergent Supply Chains. Sādhanā 2019, 44, 231. [Google Scholar] [CrossRef]
- Chen, L.-M.; Yang, S.-J.S. Designing an Optimal Two-Bin Strategy for Selling Perishable Produce to Responsible and Mainstream Buyers. IEEE Trans. Eng. Manag. 2024, 71, 2089–2102. [Google Scholar] [CrossRef]
- Guo, J.; Liu, X. Research on the Supply Chain of Fast Moving Consumer Goods Industry. Front. Bus. Econ. Manag. 2023, 8, 73–76. [Google Scholar] [CrossRef]
- Khan, M.H.; Ahmad, S. Ranking Operational Causes of Bullwhip Effect in Supply Chain Using AHP: Perception of Managers in FMCG Sector. Metamorph. A J. Manag. Res. 2017, 15, 79–90. [Google Scholar] [CrossRef]
- Durán Peña, J.A.; Ortiz Bas, Á.; Reyes Maldonado, N.M. Impact of Bullwhip Effect in Quality and Waste in Perishable Supply Chain. Processes 2021, 9, 1232. [Google Scholar] [CrossRef]
- Derbel, M.; Hachicha, W.; Masmoudi, F. A literature survey of bullwhip effect (2010–2013) according to its causes and evaluation methods. In Proceedings of the 2014 International Conference on Advanced Logistics and Transport (ICALT), Hammamet, Tunisia, 1–3 May 2014; pp. 173–178. [Google Scholar]
- Musa, A.; Dabo, A.-A.A. A Review of RFID in Supply Chain Management: 2000–2015. Glob. J. Flex. Syst. Manag. 2016, 17, 189–228. [Google Scholar] [CrossRef]
- Tao, F.; Fan, T.; Lai, K.K.; Li, L. Impact of RFID Technology on Inventory Control Policy. J. Oper. Res. Soc. 2017, 68, 207–220. [Google Scholar] [CrossRef]
- Zhigang, Z. Applying RFID to Reduce Bullwhip Effect in a FMCG Supply Chain. In Proceedings of the 2011 International Conference on E-Business and E-Government (ICEE), Shanghai, China, 6–8 May 2011; pp. 1–4. [Google Scholar]
- Abdulmalek, F.; Wang, L.; Norman, B.A.; Rajgopal, J. Retail Shelf Replenishment with Item-Level RFID Tagging. Int. J. Ind. Syst. Eng. 2011, 8, 19–37. [Google Scholar] [CrossRef]
- Piramuthu, S.; Wochner, S.; Grunow, M. Should Retail Stores Also RFID-Tag ‘Cheap’ Items? Eur. J. Oper. Res. 2014, 233, 281–291. [Google Scholar] [CrossRef]
- Piramuthu, S.; Zhou, W. RFID and Perishable Inventory Management with Shelf-Space and Freshness Dependent Demand. Int. J. Prod. Econ. 2013, 144, 635–640. [Google Scholar]
- Fan, T.; Tao, F.; Deng, S.; Li, S. Impact of RFID Technology on Supply Chain Decisions with Inventory Inaccuracies. Int. J. Prod. Econ. 2015, 159, 117–125. [Google Scholar]
- Wanitwattanakosol, J.; Attakomal, W.; Suriwan, T. Redesigning the Inventory Management with Barcode-Based Two-Bin System. Procedia Manuf. 2015, 2, 113–117. [Google Scholar] [CrossRef]
- Pawłowicz, B.; Salach, M.; Trybus, B. The Infrastructure of RFID-Based Fast Moving Consumer Goods System Using Cloud. In Automation 2020: Towards Industry of the Future; Szewczyk, R., Zieliński, C., Kaliczyńska, M., Eds.; Advances in Intelligent Systems and Computing; Springer International Publishing: Cham, Switzerland, 2020; Volume 1140, pp. 216–226. [Google Scholar]
- Wang, X.; Disney, S.M. The Bullwhip Effect: Progress, Trends and Directions. Eur. J. Oper. Res. 2016, 250, 691–701. [Google Scholar]
- Leuveano, R.A.C.; Asih, H.M.; Ridho, M.I.; Darmawan, D.A. Balancing Inventory Management: Genetic Algorithm Optimization for A Novel Dynamic Lot Sizing Model in Perishable Product Manufacturing. J Robot. Control. 2023, 4, 878–895. [Google Scholar]
- Satiti, D.; Rusdiansyah, A.; Dewi, R.S. Shelf-Space Allocation and Product Arrangement for Fruits Considering Facility’s Temperature Distribution. In Proceedings of the 2020 IEEE 7th International Conference on Industrial Engineering and Applications (ICIEA), Bangkok, Thailand, 16–21 April 2020; pp. 409–413. [Google Scholar]
- Raghunathan, S. Information Sharing in a Supply Chain: A Note on Its Value When Demand Is Nonstationary. Manag. Sci. 2001, 47, 605–610. [Google Scholar]
- Gaur, V.; Giloni, A.; Seshadri, S. Information Sharing in a Supply Chain Under ARMA Demand. Manag. Sci. 2005, 51, 961–969. [Google Scholar]
- Moyaux, T.; Chaib-draa, B.; D’Amours, S. Information Sharing as a Coordination Mechanism for Reducing the Bullwhip Effect in a Supply Chain. IEEE Trans. Syst. Man. Cybern. Part C 2007, 37, 396–409. [Google Scholar] [CrossRef]
- Buchmeister, B.; Friscic, D.; Palcic, I. Bullwhip Effect Study in a Constrained Supply Chain. Procedia Eng. 2014, 69, 63–71. [Google Scholar] [CrossRef]
- Nemtajela, N.; Mbohwa, C. Relationship between Inventory Management and Uncertain Demand for Fast Moving Consumer Goods Organisations. Procedia Manuf. 2017, 8, 699–706. [Google Scholar]
- Nasiri, G.R.; Kalantari, M.; Karimi, B. Fast-Moving Consumer Goods Network Design with Pricing Policy in an Uncertain Environment with Correlated Demands. Comput. Ind. Eng. 2021, 153, 106997. [Google Scholar] [CrossRef]
- Bottani, E.; Montanari, R.; Volpi, A. The Impact of RFID and EPC Network on the Bullwhip Effect in the Italian FMCG Supply Chain. Int. J. Prod. Econ. 2010, 124, 426–432. [Google Scholar] [CrossRef]
- Ghelichi, A.; Abdelgawad, A. A Study on RFID-Based Kanban System in Inventory Management. In Proceedings of the 2014 IEEE International Conference on Industrial Engineering and Engineering Management, Selangor Darul Ehsan, Malaysia, 9–12 December 2014; pp. 1357–1361. [Google Scholar]
- Matharage, S.T.; Hewage, U.; Perera, H.N. Impact of Sharing Point of Sales Data and Inventory Information on Bullwhip Effect. In Proceedings of the 2020 IEEE International Conference on Industrial Engineering and Engineering Management (IEEM), Singapore, Singapore, 14–17 December 14 2020; pp. 857–861. [Google Scholar]
- Putrevu, V.L.P.K. Study on the Impact of Data and Information Quality on Warehouse Management of Raw Materials on the Supply Chain in an Enterprise of the Consumer Goods Branch. Duisburg Essen Publ. Online 2022. [Google Scholar] [CrossRef]
- Mattegunta, V.K.P. Retail-Time Inventory Visibility: Transforming Retail Operations Through Real-Time Data Integration. J. Comput. Sci. Technol. Stud. 2025, 7, 58–64. [Google Scholar] [CrossRef]
- Chung, K.-J.; Cárdenas-Barrón, L.E. The Complete Solution Procedure for the EOQ and EPQ Inventory Models with Linear and Fixed Backorder Costs. Math. Comput. Model. 2012, 55, 2151–2156. [Google Scholar] [CrossRef]
- Chiu, S.W.; Lin, H.-D.; Song, M.-S.; Chen, H.-M.; Chiu, Y.-S.P. An Extended EPQ-Based Problem with a Discontinuous Delivery Policy, Scrap Rate, and Random Breakdown. Sci. World J. 2015, 2015, 621978. [Google Scholar] [CrossRef]
- Ali, R.; Khalid, R.; Qaiser, S. A Discrete Event Simulation Analysis of the Bullwhip Effect in a Multi-Product and Multi-Echelon Supply Chain of Fast Moving Consumer Goods. Pak. J. Stat. Oper. Res. 2020, 16, 561–576. [Google Scholar] [CrossRef]
- Xu, Y.; Fan, P.; Yuan, L. A Simple and Efficient Artificial Bee Colony Algorithm. Math. Probl. Eng. 2013, 2013, 526315. [Google Scholar] [CrossRef]
- Ruidas, S.; Seikh, M.R.; Nayak, P.K. An EPQ Model with Stock and Selling Price Dependent Demand and Variable Production Rate in Interval Environment. Int. J. Syst. Assur. Eng. Manag. 2020, 11, 385–399. [Google Scholar] [CrossRef]
- Dash, S.S.; Nayak, S.K.; Mishra, D. ABC Versus PSO: A Comparative Study and Analysis on Optimization Aptitude. In Advances in Intelligent Computing and Communication; Das, S., Mohanty, M.N., Eds.; Lecture Notes in Networks and Systems; Springer: Singapore, Singapore, 2021; Volume 202, pp. 527–544. [Google Scholar]
- Mohd Zin, N.S.; Jamaluddin, S.H.; Mahmud, N.; Muhammat Pazil, N.S. Minimizing the Total Cost of Inventory by Using Artificial Bee Colony Algorithm. Int. J. Acad. Res. Bus. Soc. Sci. 2021, 11, 1147–1154. [Google Scholar] [CrossRef]
- Zhigang, Z. Applying RFID to Reduce Bullwhip Effect in a FMCG Supply Chain. In Advances in Computational Environment Science; Lee, G., Ed.; Advances in Intelligent and Soft Computing; Springer: Berlin, Heidelberg, 2012; Volume 142, pp. 193–199. [Google Scholar]
- Sardar, S.K.; Sarkar, B.; Kim, B. Integrating Machine Learning, Radio Frequency Identification, and Consignment Policy for Reducing Unreliability in Smart Supply Chain Management. Processes 2021, 9, 247. [Google Scholar] [CrossRef]
- Sadeghi, A. Providing a Measure for Bullwhip Effect in a Two-Product Supply Chain with Exponential Smoothing Forecasts. Int. J. Prod. Econ. 2015, 169, 44–54. [Google Scholar] [CrossRef]

| Author/Year | Objective | Algorithm/Solution Method | Data | Sector/Industry | Unit of Analysis |
|---|---|---|---|---|---|
| Wanitwattanakosol, J et al. (2015) [15] | Implement a lean concept for eliminating wastes | Value stream mapping (VSM) was adopted | Real-time data | Electronics Company | Inventory |
| Tao, F et al. (2017) [9] | Evaluate multiperiod inventory control policies | Intensive numerical study with sensitivity analysis | Observation | Retail | Inventory |
| Pawłowicz, B et al. (2020) [16] | Demonstrates field use of RFID | Built prototype with Raspberry Pi | Observation | FMCG | Inventory |
| Chung, K.-J. et al. (2012) [31] | Determine the optimal lot size and backorder level | Enhanced Johnson, Sphicas’s and Montgomery work. | Deterministic | FMCG | Inventory |
| Nasiri, G.R. et al. (2021) [25] | Develop an integrated DC location model for FMCG | Meta-heuristic algorithms, GAMS, MATLAB | Real-time Data | FMCG | Inventory |
| Nemtajela, N. and Mbohwa, C. (2017) [24] | Examine between inventory and uncertain demand | Survey, Descriptive stats and correlation analysis | Real-time Data | FMCG | Inventory |
| Bottani, E. al. (2010) [26] | Reduce bullwhip effect. | Pallet and case tagging for visibility | Real-time Data | FMCG | Supply Chain |
| Zhigang, Z et al. (2012) [38] | Reduce bullwhip effect. | No Algorithm | Real-time Data | FMCG | Supply Chain |
| Ruidas, S. et al. (2020) [35] | Developing real-world production inventory. | Particle swarm optimization (PSO) | Real-time data | Universal | Inventory |
| Ghelichi, A. et al. (2014) [27] | Introduce an RFID system on Kanban inventory approach | Two-bin Kanban inventory for JIT products | Real-time data | Manufacturing | Inventory |
| Chiu, S.W. et al. (2015) [32] | Optimizing EPQ discontinuous delivery, scrap and random breakdown | Recursive searching algorithm | Real-time data | Manufacturing | Inventory |
| Ali, R et al. (2020) [33] | Determining demand information impact on supply chain performance | Discrete-event simulation in Arena | Experimental and simulated | FMCG | Supply Chain |
| Sardar, S.K. et al. (2021) [39] | ML-based forecasting for smart supply chain | Using Long–Short–Term Memory, Machine Learning | Real-time Data | Manufacturing | Supply chain |
| Dash, S.S. (2021) [36] | Inventory optimization with ABC vs. PSO algorithm | PSO algorithm and Artificial Bee Colony algorithm | Simulated | N/A | Algo. Perf. |
| Putrevu, V.L.P.K. et al. (2022) [29] | Warehousing and inventory impact competitiveness | Structural Executive opinion-based data model | Real-time | FMCG | Supply chain |
| Mattegunta, V.K.P. et al. (2025) [30] | Reducing labor and stock outs, while optimizing inventory accuracy investments | Cloud platforms, RFID, POS integration, mobile inventory | Real-time Data | Retail | Supply Chain |
| Mohd Zin, N.S. et al. (2021) [37] | Minimizing the total cost of inventory | Artificial Bee Colony Algorithm | Real-time Data | Electronics Industry | Inventory |
| This research study | Reducing excess inventory with financial agility | Mathematical model integrated with Artificial Bee Colony Algorithm | Real-time Data | FMCG | Inventory |
| Particulars of Sample | Data Source | Size/Volume | |
|---|---|---|---|
| Collected from a leading FMCG Manufacturer | Sales and prehistoric inventory data | Logistics Provider Transportation Data | Records for 12 months. Weekly stored data |
| Traditional Excess Inventory Data | Manufacturer Production Records | ||
| Regular holding cost data | Storage & Transportation records | ||
| Traditional reworking of data | Manufacturer Production Records | ||
| Evolved to evaluate the objective function | No. of weeks | - | 52 |
| Number of employed bees | - | 20 | |
| Number of iterations/per optimization results | - | 20 | |
| Parameters | Excess Inventory (Thousands) After | Month-Wise Total Holding Cost (Thousands) BDT | Cumulative Total Holding Cost (Thousands) BDT | |||||||
|---|---|---|---|---|---|---|---|---|---|---|
| Fourth Month | Eighth Month | Twelfth Month | Fourth Month | Eighth Month | Twelfth Month | First four Month | Eighth Month | Twelfth Month | ||
| Traditional Approach (Before) | 43.7 | 22.2 | 32.5 | 32.7 | 22.7 | 16.7 | 112.6 | 225.3 | 331.2 | |
| OPQ Implementation (After) | 22.3 | 7.3 | 11.2 | 16.2 | 6.1 | 5.2 | 47.9 | 82.2 | 118.4 | |
| Improvement (EI and Cost Reduced by OPQ) | Amount | 21.4 | 15.0 | 21.2 | 16.5 | 16.6 | 11.5 | 64.7 | 143.0 | 212.7 |
| % | 49% | 67% | 65% | 50% | 73% | 69% | 57% | 63% | 64% | |
| Parameters | Excess Inventory (×1000) After | Month-Wise Excessive Cost (×1000) | Cumulative Excessive Cost (×1000) BDT | |||||||
|---|---|---|---|---|---|---|---|---|---|---|
| Fourth Month | Eighth Month | Twelfth Month | Fourth Month | Eighth Month | Twelfth Month | Fourth Month | Eighth Month | Twelfth Month | ||
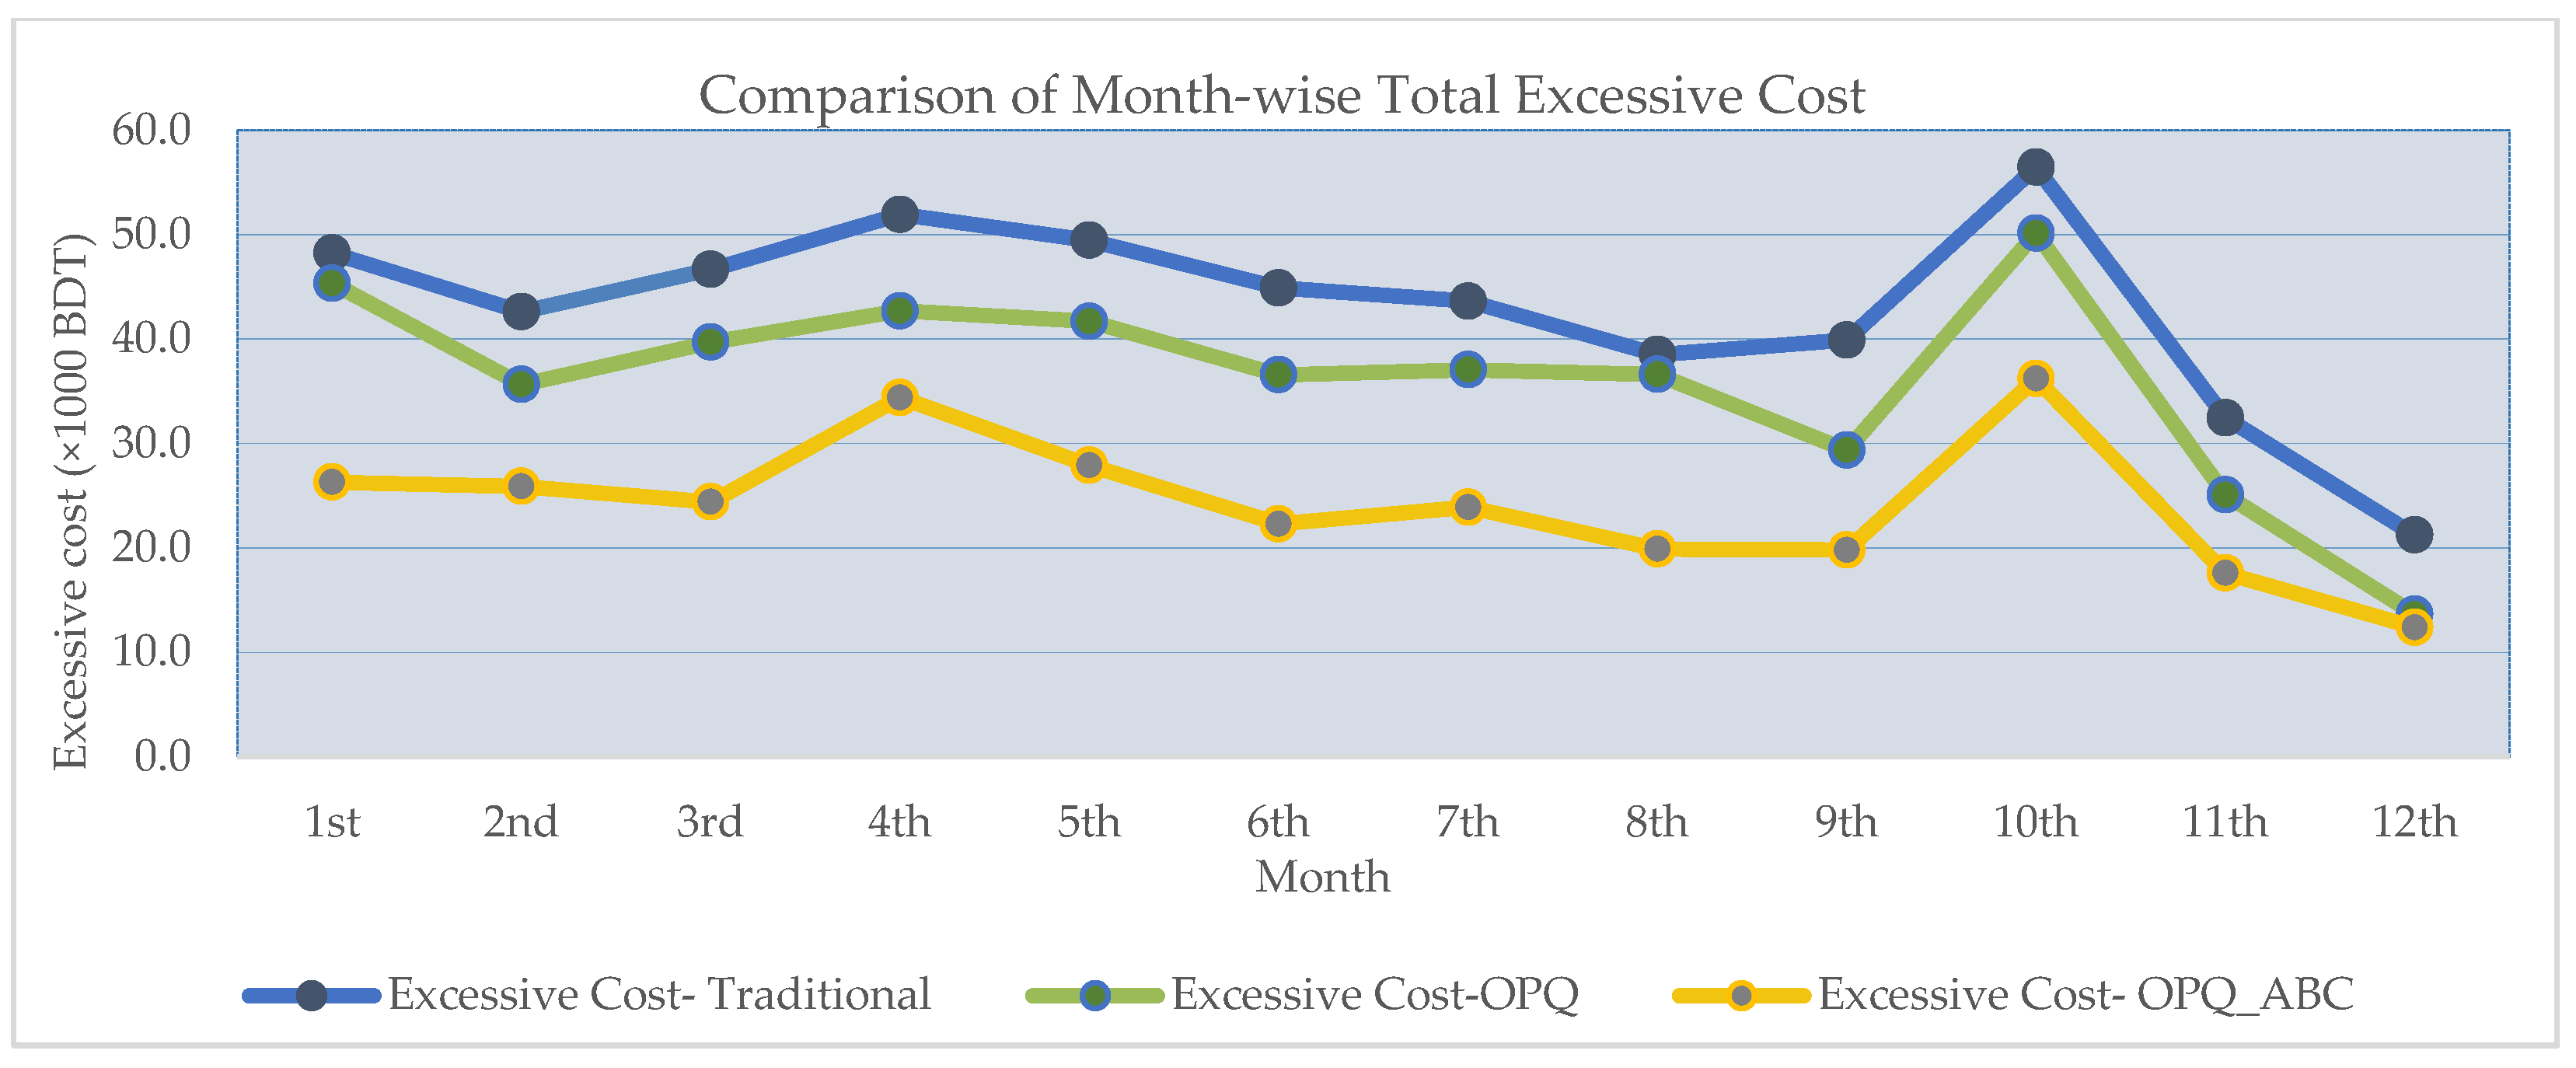
| Traditional Approach (Before) | 43.7 | 22.2 | 32.5 | 51.9 | 38.5 | 21.2 | 189.5 | 366.0 | 516.1 | |
| After OPQ and ABC Implementation | 21.0 | 6.2 | 11.1 | 34.4 | 19.9 | 12.4 | 110.9 | 205.0 | 290.9 | |
| Improvement (EI and Cost Reduced by OPQ-ABC) | Amount | 22.7 | 16.1 | 21.3 | 17.5 | 18.6 | 8.8 | 78.5 | 161.0 | 225.1 |
| % | 52% | 72% | 66% | 34% | 48% | 42% | 41% | 44% | 44% | |
| Parameters | Excess Inventory (×1000) After | Monthly Excessive Cost (×1000) | Cumulative Excessive Cost (×1000) BDT | |||||||
|---|---|---|---|---|---|---|---|---|---|---|
| Fourth Month | Eighth Month | Twelfth Month | Fourth Month | Eighth Month | Twelfth Month | Fourth Month | Eighth Month | Twelfth Month | ||
| Traditional Approach (Before) | 43.7 | 22.2 | 32.5 | 51.9 | 38.5 | 21.2 | 189.5 | 366.0 | 516.1 | |
| After OPQ Implementation | 22.3 | 7.3 | 11.2 | 16.2 | 6.1 | 5.2 | 47.9 | 82.2 | 118.4 | |
| After OPQ and ABC Implementation | 21.0 | 6.2 | 11.1 | 34.4 | 19.9 | 12.4 | 110.9 | 205.0 | 290.9 | |
| EI and Cost Reduced by OPQ | Amount | 21.4 | 15.0 | 21.2 | 16.5 | 16.6 | 11.5 | 64.7 | 143.0 | 212.7 |
| % | 49% | 67% | 65% | 50% | 73% | 69% | 57% | 63% | 64% | |
| EI and Cost Reduced by OPQ and ABC | Amount | 22.7 | 16.1 | 21.3 | 17.5 | 18.6 | 8.8 | 78.5 | 161.0 | 225.1 |
| % | 52% | 72% | 66% | 34% | 48% | 42% | 41% | 44% | 44% | |
| Condition | Parameters | Excess Inventory (×1000) | Month-wise Excessive Cost (×1000) | Cumulative Excessive Cost (×1000) BDT | |||||||
|---|---|---|---|---|---|---|---|---|---|---|---|
| Fourth Month | Eighth Month | Twelfth Month | Fourth Month | Eighth Month | Twelfth Month | Fourth Month | Eighth Month | Twelfth Month | |||
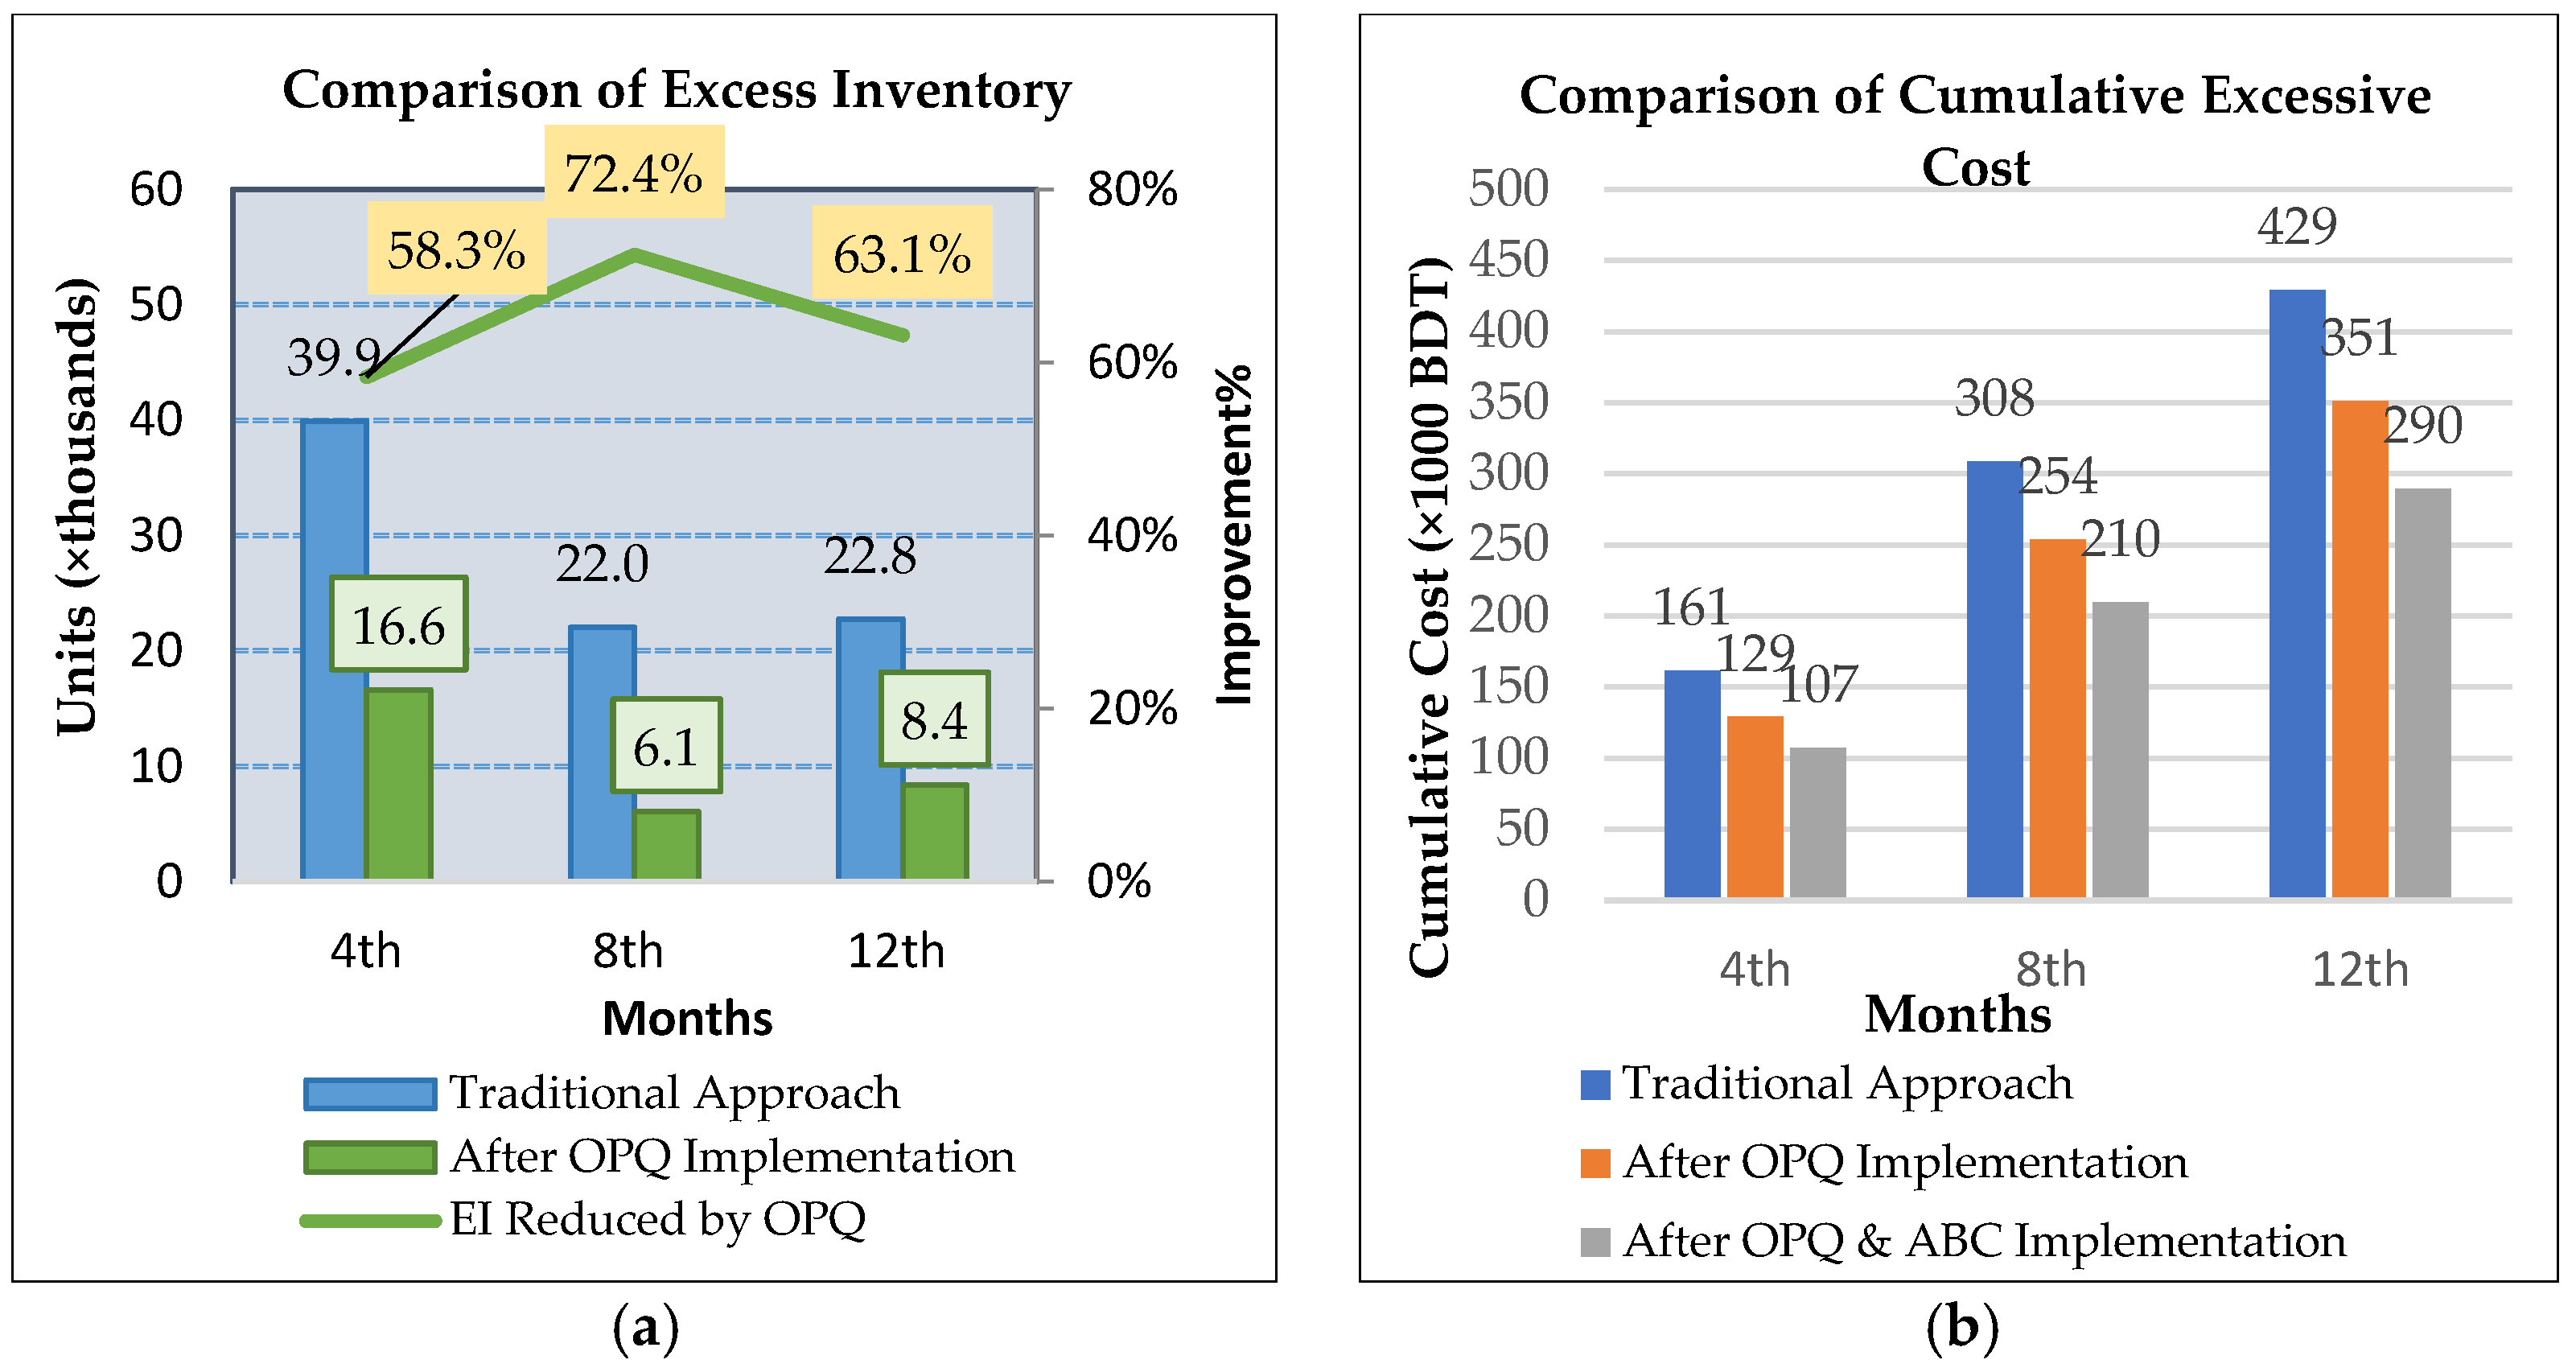
| Maximum Defect rate: 0.2 Holding cost: 0.15 BDT/unit | Traditional Approach (Before) | 39.9 | 22.0 | 22.8 | 82.6 | 165.6 | 245.4 | 161.5 | 308.4 | 429.2 | |
| After OPQ Implementation | 16.6 | 6.1 | 8.4 | 27.2 | 46.2 | 65.8 | 129.0 | 253.7 | 351.3 | ||
| After OPQ and ABC Implementation | 15.4 | 5.2 | 8.3 | 25.1 | 42.1 | 59.9 | 107.4 | 209.8 | 289.6 | ||
| EI and Cost Reduced by OPQ | Amount | 23.3 | 16.0 | 14.4 | 55.4 | 119.4 | 179.7 | 32.5 | 54.8 | 77.9 | |
| % | 58.3% | 72.4% | 63.1% | 67.1% | 72.1% | 73.2% | 20.1% | 17.8% | 18.1% | ||
| EI and Cost Reduced by OPQ and ABC | Amount | 24.5 | 16.8 | 14.4 | 57.5 | 123.4 | 185.5 | 54.0 | 98.6 | 139.6 | |
| % | 61.5% | 76.3% | 63.4% | 69.6% | 74.6% | 75.6% | 33.5% | 32.0% | 32.5% | ||
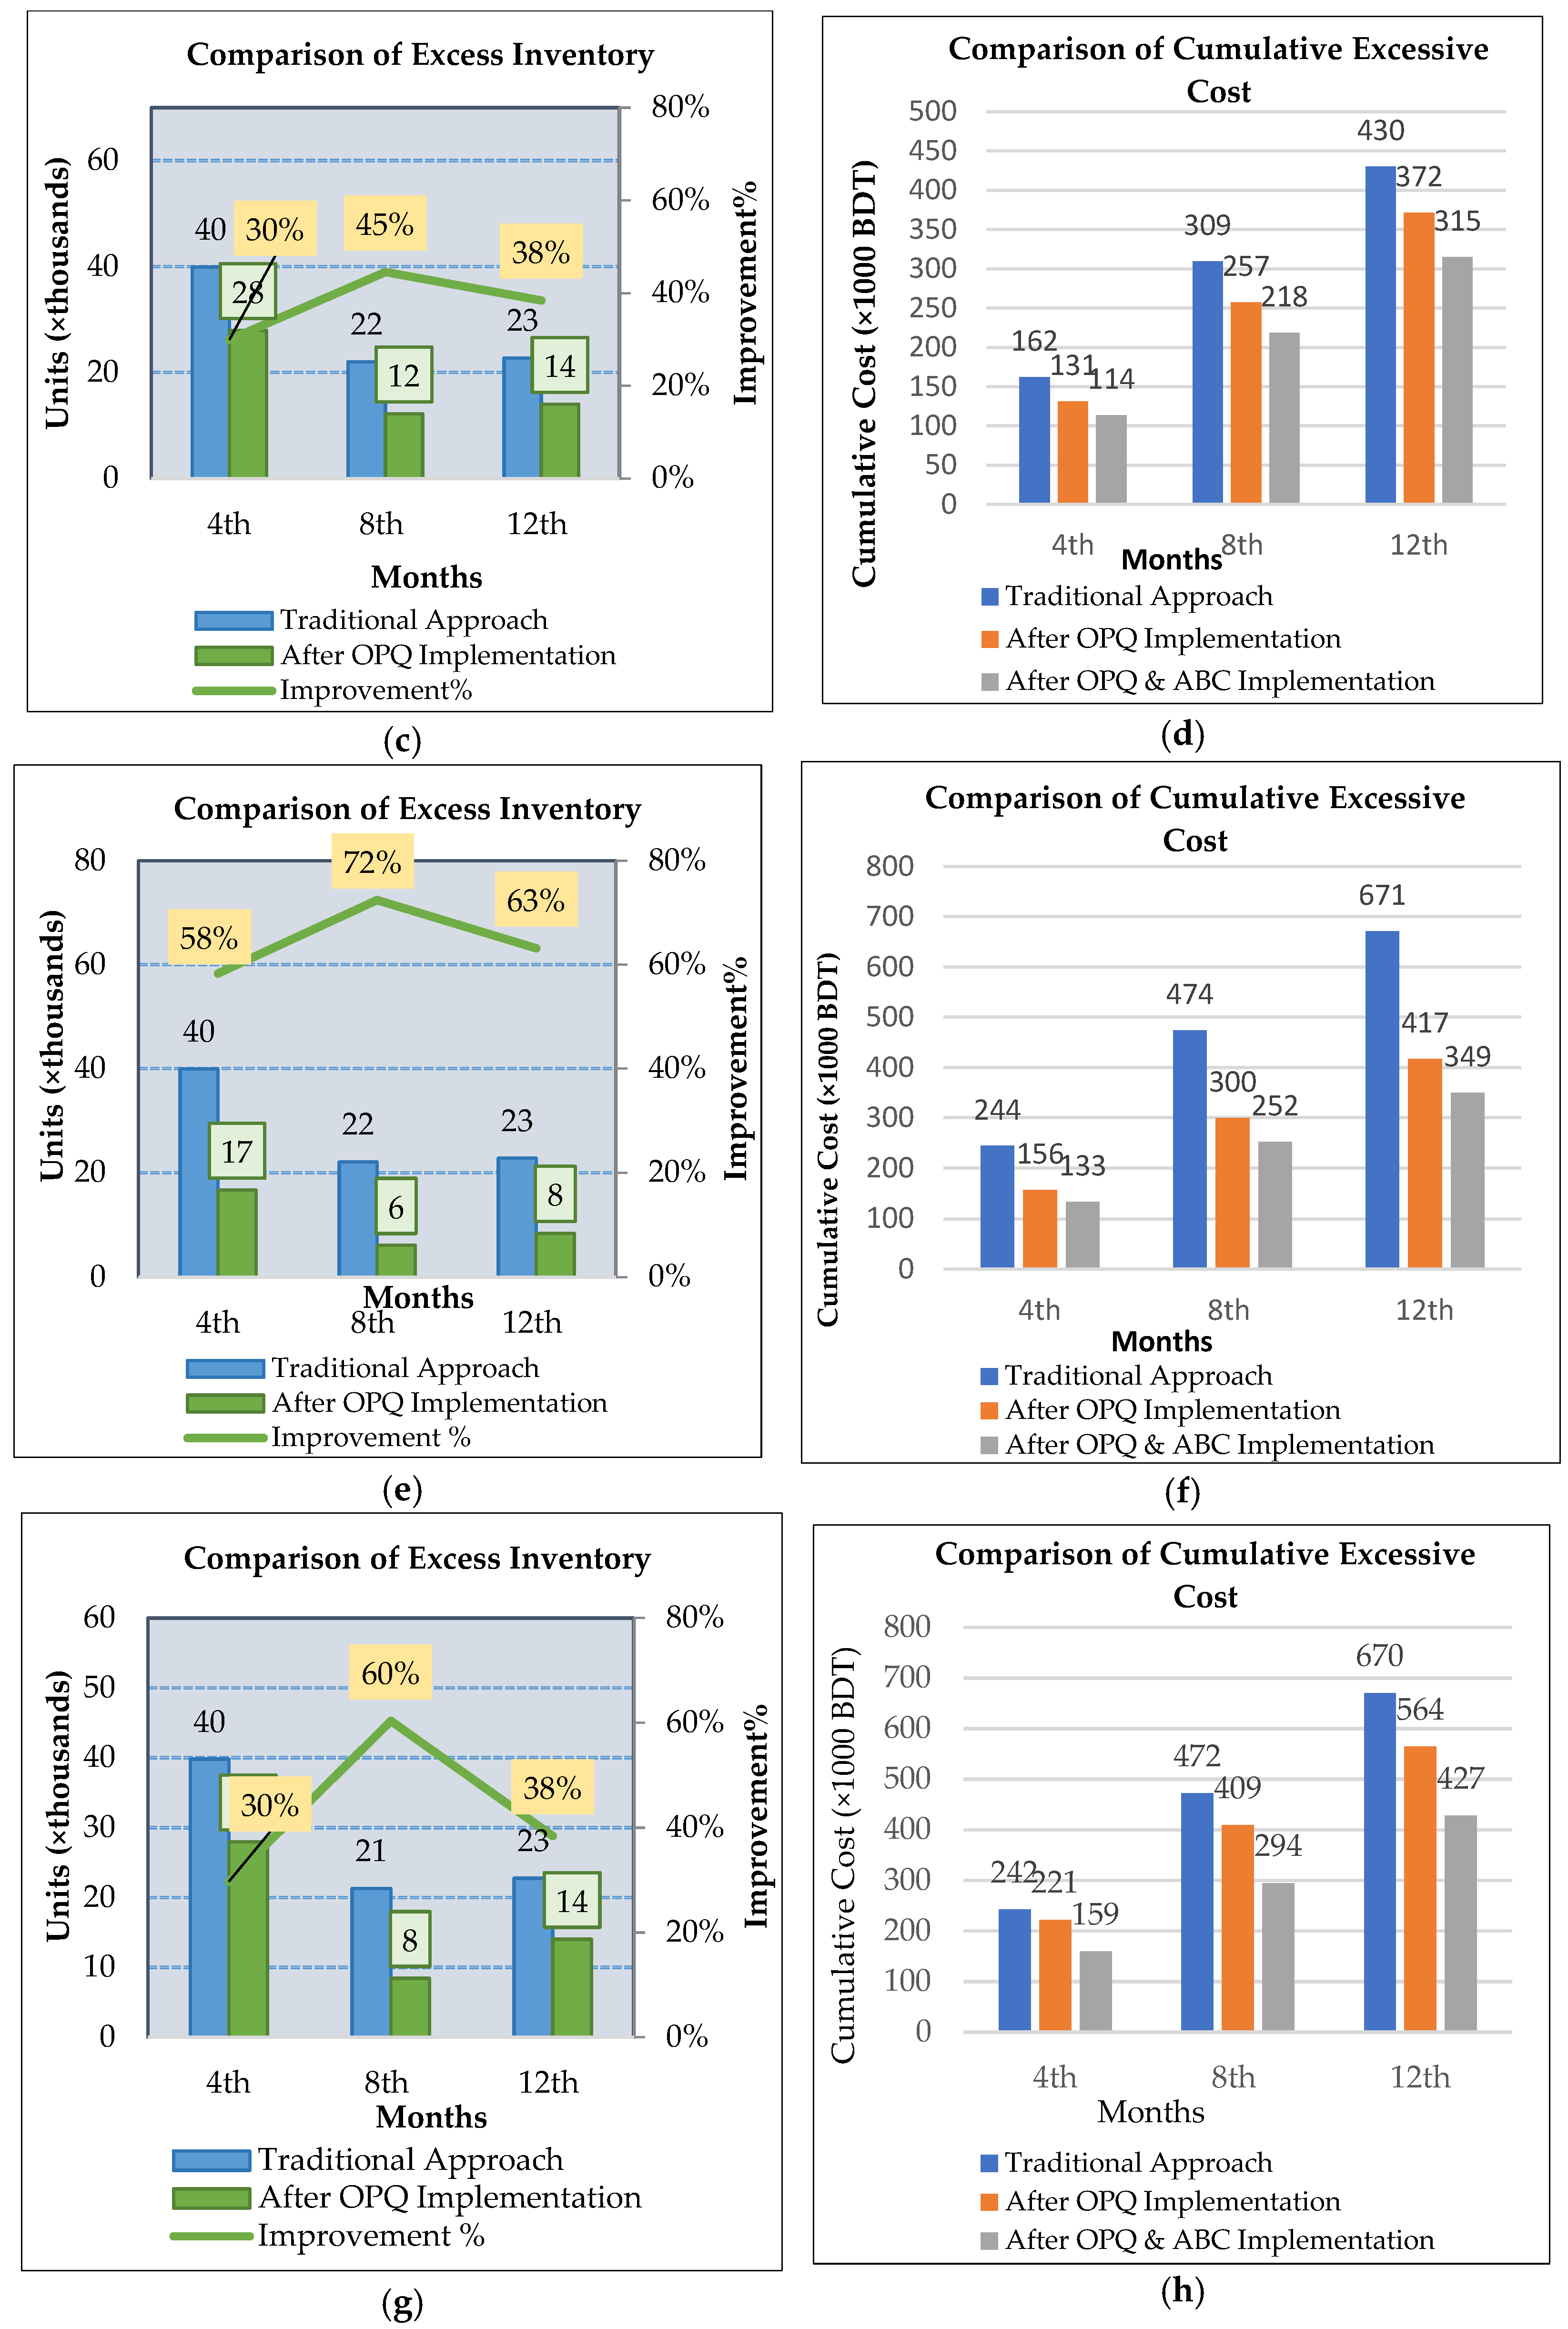
| Maximum Defect rate: 0.3 Holding cost: 0.15 BDT/unit | Traditional Approach (Before) | 39.9 | 22.0 | 22.8 | 82.6 | 165.6 | 245.4 | 162.3 | 309.3 | 430.1 | |
| After OPQ Implementation | 28.0 | 12.2 | 14.0 | 48.5 | 84.7 | 120.9 | 131.0 | 257.2 | 371.5 | ||
| After OPQ and ABC Implementation | 26.7 | 11.4 | 14.0 | 46.4 | 80.6 | 115.0 | 113.6 | 218.4 | 314.8 | ||
| EI and Cost Reduced by OPQ | Amount | 11.9 | 9.8 | 8.7 | 34.1 | 80.9 | 124.5 | 31.3 | 52.0 | 58.5 | |
| % | 29.9% | 44.5% | 38.4% | 41.3% | 48.8% | 50.7% | 19.3% | 16.8% | 13.6% | ||
| EI and Cost Reduced by OPQ and ABC | Amount | 13.2 | 10.7 | 8.8 | 36.2 | 84.9 | 130.4 | 48.7 | 90.9 | 115.3 | |
| % | 33.1% | 48.4% | 38.7% | 43.8% | 51.3% | 53.1% | 30.0% | 29.4% | 26.8% | ||
| Maximum Defect rate: 0.2, Holding cost: 0.3 BDT/unit | Traditional Approach (Before) | 39.9 | 22.0 | 22.8 | 165.3 | 331.1 | 490.9 | 244.1 | 474.0 | 671.2 | |
| After OPQ Implementation | 16.6 | 6.1 | 8.4 | 54.4 | 92.4 | 131.5 | 156.2 | 299.9 | 417.1 | ||
| After OPQ and ABC Implementation | 15.4 | 5.2 | 8.3 | 50.2 | 84.3 | 119.8 | 132.5 | 251.9 | 349.5 | ||
| EI and Cost Reduced by OPQ | Amount | 23.3 | 16.0 | 14.4 | 110.8 | 238.8 | 359.3 | 87.9 | 174.2 | 254.2 | |
| % | 58.3% | 72.4% | 63.1% | 67.1% | 72.1% | 73.2% | 36.0% | 36.7% | 37.9% | ||
| EI and Cost Reduced by OPQ and ABC | Amount | 24.5 | 16.8 | 14.4 | 115.0 | 246.9 | 371.0 | 111.6 | 222.1 | 321.8 | |
| % | 61.5% | 76.3% | 63.4% | 69.6% | 74.6% | 75.6% | 45.7% | 46.9% | 47.9% | ||
| Maximum Defect rate: 0.3, Holding cost: 0.3 BDT/unit | Traditional Approach (Before) | 39.8 | 21.3 | 22.8 | 163.5 | 327.2 | 486.2 | 242.0 | 471.7 | 670.1 | |
| After OPQ Implementation | 28.0 | 8.4 | 14.0 | 89.4 | 154.4 | 223.8 | 221.4 | 408.5 | 564.1 | ||
| After OPQ and ABC Implementation | 26.7 | 7.1 | 14.0 | 84.0 | 144.2 | 209.6 | 159.0 | 294.5 | 427.4 | ||
| EI and Cost Reduced by OPQ | Amount | 11.8 | 12.8 | 8.7 | 74.2 | 172.9 | 262.4 | 20.6 | 63.2 | 106.1 | |
| % | 29.7% | 60.4% | 38.4% | 45.3% | 52.8% | 54.0% | 8.5% | 13.4% | 15.8% | ||
| EI and Cost Reduced by OPQ and ABC | Amount | 13.1 | 14.2 | 8.8 | 79.5 | 183.0 | 276.6 | 83.0 | 177.3 | 242.7 | |
| % | 32.9% | 66.8% | 38.7% | 48.6% | 55.9% | 56.9% | 34.3% | 37.6% | 36.2% | ||
Disclaimer/Publisher’s Note: The statements, opinions and data contained in all publications are solely those of the individual author(s) and contributor(s) and not of MDPI and/or the editor(s). MDPI and/or the editor(s) disclaim responsibility for any injury to people or property resulting from any ideas, methods, instructions or products referred to in the content. |
© 2025 by the authors. Licensee MDPI, Basel, Switzerland. This article is an open access article distributed under the terms and conditions of the Creative Commons Attribution (CC BY) license (https://creativecommons.org/licenses/by/4.0/).
Share and Cite
Das, S.; Rajin, G.M.M.A.; Sarker, M.N.H.; Uddin, M.M.; Sakaline, G.; Süle, E. RFID-Enhanced Modified Two-Bin System for Reducing Excess Inventory of FMCG Industry. Logistics 2025, 9, 167. https://doi.org/10.3390/logistics9040167
Das S, Rajin GMMA, Sarker MNH, Uddin MM, Sakaline G, Süle E. RFID-Enhanced Modified Two-Bin System for Reducing Excess Inventory of FMCG Industry. Logistics. 2025; 9(4):167. https://doi.org/10.3390/logistics9040167
Chicago/Turabian StyleDas, Shuvojit, Gazi Md. Mahbubul Alam Rajin, Md. Nazmul Hasan Sarker, Md. Mahraj Uddin, Golam Sakaline, and Edit Süle. 2025. "RFID-Enhanced Modified Two-Bin System for Reducing Excess Inventory of FMCG Industry" Logistics 9, no. 4: 167. https://doi.org/10.3390/logistics9040167
APA StyleDas, S., Rajin, G. M. M. A., Sarker, M. N. H., Uddin, M. M., Sakaline, G., & Süle, E. (2025). RFID-Enhanced Modified Two-Bin System for Reducing Excess Inventory of FMCG Industry. Logistics, 9(4), 167. https://doi.org/10.3390/logistics9040167


