1. Introduction
The European Union’s transition toward sustainable transport systems represents ambitious policy challenges. With freight transport accounting for approximately 40% of transport-related CO
2 emissions and continuing to grow with economic expansion, achieving a meaningful modal shift from road to more sustainable alternatives has become a goal for meeting the European Green Deal’s carbon neutrality objectives by 2050 [
1].
Recent empirical research has increasingly focused on the barriers and enablers of modal shift in European freight systems. Studies in Transportation Research Part D have highlighted the critical role of infrastructure capacity constraints, digitalization impacts on freight mode choice, and the complex interactions between sustainability transitions and economic competitiveness [
2]. The literature reveals that traditional economic models of modal choice, while foundational, require enhancement to address contemporary challenges including climate policy integration, supply chain resilience, and technological disruption effects on transport mode competitiveness [
3].
The concept of sustainability transitions in freight transport has evolved beyond simple modal shift advocacy to encompass system-wide transformation approaches. Research in Transportation Research Part E demonstrates that successful decarbonization requires coordinated interventions across infrastructure, regulation, technology, and market mechanisms [
4]. This systems perspective is crucial for understanding why isolated modal promotion policies often fail to achieve intended outcomes, as demonstrated by persistent road transport growth despite substantial rail and waterway investment programs [
5].
Intermodal freight transport, defined as the movement of goods using two or more transport modes within a single journey, has become a cornerstone of European sustainability strategy [
1]. The concept of logistics diversification, the balanced distribution of freight flows across multiple transport modes, represents both a policy objective and a measure of transport system resilience. However, despite substantial investments through programs such as the Trans-European Transport Network (TEN-T), empirical evidence of policy effectiveness in achieving modal shift remains fragmented and often contradictory [
6].
The heterogeneity of European transport systems, reflecting diverse geographical constraints, economic structures, infrastructure legacies, and policy approaches, creates an intricated landscape for understanding modal distribution patterns and their evolution. Countries range from highly industrialized economies with extensive multimodal networks to smaller nations with geographical constraints that fundamentally shape transport options. This diversity requires an understanding of the factors influencing freight transport choices and evaluating policy effectiveness across different contexts [
7].
Some studies consistently demonstrate that rail freight produces approximately 76% fewer CO
2 emissions per tonne-kilometer compared to road freight, while inland waterway transport can achieve even greater efficiency gains [
8,
9]. However, the gap between theoretical potential and practical achievement of modal shift remains substantial, raising questions about policy design and implementation effectiveness.
This study conducts a comprehensive analysis of modal distribution patterns across European countries, employing statistical methods to analyze trends and assess diversification patterns. The research aims to answer three fundamental questions: How have modal distribution patterns evolved across European countries between 2008 and 2023 when accounting for compositional data constraints? Which countries demonstrate the highest and lowest levels of logistics diversification, and what structural factors explain these differences? Can European countries be meaningfully clustered based on modal distribution characteristics using appropriate compositional data methods?
2. Methodology
This study utilizes comprehensive official data from Eurostat’s “Modal split of air, sea and inland freight transport” database, providing consistent and reliable freight transport performance data across European countries [
10]. The database contains information on freight transport performance measured in tonne-kilometers for five transport modes: air, rail, road, maritime, and inland waterways, covering 29 countries for 2008–2023.
2.1. Data Preprocessing and Quality Control
The exact Eurostat query used was: “Modal split of air, sea and inland freight transport” [
10] with the following specifications:
Time period: 2008–2023 (annual data);
Geographic coverage: EU27 + Norway, Switzerland;
Transport modes: air, rail, road, maritime, inland waterways;
Unit: percentage of total freight transport (tonne-kilometers).
Countries included (28): Austria, Belgium, Bulgaria, Croatia, Cyprus, Czechia, Denmark, Estonia, Finland, France, Germany, Greece, Hungary, Ireland, Italy, Latvia, Lithuania, Luxembourg, Netherlands, Norway, Poland, Portugal, Romania, Slovakia, Slovenia, Spain, Sweden, Switzerland.
Excluded countries: Malta was excluded due to insufficient data availability (missing data for multiple transport modes across multiple years).
Missing data treatment: for countries with occasional missing values (representing less than 2% of total observations), linear interpolation was applied within each country-mode series. Zero values for certain modes (particularly inland waterways and air transport) were retained as true zeros rather than missing data. No smoothing or additional rounding was applied beyond Eurostat’s original data processing.
The data follow the “Principle of Territoriality,” considering only freight transport within each country’s territory, ensuring consistency and eliminating double-counting issues from international flows. Variables Xi,j represent modal percentages where index i denotes transport mode (1 = air, 2 = rail, 3 = road, 4 = maritime, 5 = inland waterway) and j represents country (1 to 28, with 28 = EU aggregate). This structure yields 140 independent variables (28 countries × 5 modes), each with 16 annual observations, providing 2240 data points for analysis.
2.2. Data Transformation
Modal shares constitute compositional data, as they represent parts of a whole (summing to 100%) and exhibit relative rather than absolute information [
11]. Standard statistical procedures applied to raw percentages violate the principles of compositional data analysis and can produce spurious results due to the constant-sum constraint [
11].
Centered Log-Ratio (CLR) Transformation: All statistical analyses were performed on CLR-transformed data, defined as:
where D = 5 (number of transport modes) and Xi represents the proportion (0–1 scale) for mode i.
Zero-value treatment: Since several countries report zero values for specific modes (particularly air and inland waterways), a small constant (0.01%) was added to all proportions before CLR transformation, following standard practice in compositional data analysis.
The CLR transformation projects the compositional data from the simplex space to the real space, enabling valid application of conventional statistical methods while preserving the relative information structure inherent in modal shares [
11].
2.3. Statistical Analysis Framework
Prior to comparative analysis, multivariate normality testing was performed on CLR-transformed data using the Henze–Zirkler test. The hypotheses were as follows:
H0 : CLR(Xi,j) follows multivariate normal distribution;
H1 : CLR(Xi,j) does not follow a multivariate normal distribution.
Since multivariate normality was not confirmed (p < 0.05), non-parametric procedures were employed on the transformed data. Five Kruskal–Wallis tests were conducted, one for each CLR-transformed transport mode, comparing distributions across 28 countries:
H0 : all country medians are equal;
H1 : at least one median differs.
Following significant Kruskal–Wallis results, Dunn’s test with Holm correction was applied to identify pairwise differences between countries for each transport mode.
To address temporal dependence in the dataset, supplementary analysis using linear mixed-effects models was performed with country random intercepts and year fixed effects on CLR-transformed data.
2.4. Logistics Diversification Index
To quantify modal distribution balance, this study adapts the Herfindahl-Hirschman Index (HHI), a concentration measure from industrial economics [
12].
Modal shares were converted to proportions (0–1 scale) before calculation. The HHI for each country j is:
where Xi,j represents the proportion (not percentage) of mode i in country j.
The Logistics Diversification Index (DLj) is defined as: DLj = 1 − HHIj = 1 − Σ(i = 1 to 5) (Xi,j)2.
This index ranges from 0 (single mode dominance) to 0.8 (equal distribution across modes), with higher values indicating greater diversification and system balance.
2.5. Clustering Analysis Framework
K-means clustering was employed to identify groups of countries with similar modal distribution patterns using 2023 CLR-transformed data.
CLR-transformed variables were standardized (z-score normalization) prior to clustering to ensure equal weighting across transport modes.
Algorithm parameters:
Implementation: scikit-learn v1.3.0 KMeans
Initialization: k-means++
Number of initializations (nr_init): 100
Maximum iterations: 1000
Random state: 42 (for reproducibility)
Distance metric: Euclidean (appropriate for CLR-transformed data)
The optimal number of clusters was determined through systematic evaluation of configurations from 3 to 7 groups, using multiple criteria:
Within-cluster sum of squares (WCSS)—Elbow method
Silhouette analysis—Average silhouette scores
Calinski–Harabasz Index—Variance ratio criterion
Davies–Bouldin Index—Cluster separation measure
Validation and robustness:
Cluster stability analysis using 100 bootstrap samples
Adjusted Rand Index (ARI) across multiple random initializations
Comparison with hierarchical clustering using Ward linkage
Analysis of cluster membership consistency across different preprocessing approaches
2.6. Temporal Trend Analysis
Formal temporal trend analysis was implemented using:
Mann–Kendall trend tests for each CLR-transformed mode-country series
Panel regression models with country fixed effects and time trends: CLR(Xi,jt}) = α_j + β_t × year + ε_{i,jt}
Structural break testing using Chow tests to identify significant policy or economic transition points
Autocorrelation assessment using Durbin-Watson statistics for residual analysis
3. Theoretical Framework
The theoretical foundation for understanding freight transport modal choice draws from transportation economics and discrete choice modeling, with seminal work by McFadden [
13], and Ben-Akiva and Lerman [
3] establishing frameworks based on cost, time, reliability, and service quality considerations. Contemporary research has expanded these models to incorporate environmental considerations, policy interventions, and supply chain integration factors that increasingly influence modal decisions [
3].
Kaack et al. [
5] provide a comprehensive analysis of policy instruments for promoting modal shift, identifying effective approaches including road pricing mechanisms, fuel taxation, emissions standards, and infrastructure investment programs. Their research demonstrates that successful modal shift requires coordinated interventions addressing multiple system components simultaneously rather than isolated mode-specific improvements.
The implementation of road pricing mechanisms has shown varying effectiveness across European countries. Germany and Switzerland have developed sophisticated truck tolling systems incorporating environmental externalities and infrastructure costs, demonstrating measurable impacts on modal choice for long-distance freight flows [
14]. However, effectiveness depends critically on the availability and competitiveness of alternative transport modes, highlighting the importance of integrated policy approaches.
The sustainability and resilience of intermodal transport networks have gained prominence as critical factors in system design and optimization [
4]. Advanced modeling approaches now incorporate both environmental sustainability metrics and resilience considerations, recognizing that transport networks must simultaneously address carbon reduction objectives while maintaining operational reliability under disruption scenarios. This dual focus on sustainability and resilience represents an evolution in intermodal transport research, moving beyond simple cost-efficiency optimization to encompass comprehensive system performance evaluation, including preparedness and recovery capabilities.
Santos et al. [
15] emphasize the growing importance of green logistics practices in supply chain management, demonstrating that systematic approaches to modal diversification can achieve significant environmental benefits while maintaining operational efficiency. Their framework provides valuable insights into the integration of sustainability considerations with traditional logistics optimization objectives.
Contemporary freight transport faces increasing pressure to implement Green Logistics Practices (GLPs) that integrate sustainability considerations into operational decisions [
16]. These practices encompass environmental initiatives ranging from eco-driving and route optimization to alternative fuel adoption and collaborative logistics approaches. The biomethane implementation in Swedish freight transport demonstrates how specific GLPs can achieve measurable environmental benefits while maintaining operational efficiency. However, the adoption of GLPs varies considerably across transport modes and geographical contexts, with road transport often leading in technological innovation while rail and waterway alternatives lag in sustainability technology implementation.
The environmental case for modal shift is compelling and well-documented in academic literature. Comprehensive life cycle assessments consistently demonstrate substantial differences in environmental performance across transport modes, with rail and waterway transport producing significantly lower emissions than road alternatives [
9,
16,
17].
Recent analysis by the European Environment Agency quantifies these differences precisely: rail freight produces 22 g CO
2 per tonne-kilometer compared to 62 g for road freight, while inland waterway transport achieves even lower emissions at 15 g per tonne-kilometer under optimal conditions [
18]. These performance differentials reflect fundamental differences in energy efficiency, with rail and waterway modes benefiting from lower rolling resistance, higher load factors, and more efficient propulsion systems.
Gamage et al. [
19] conducted particularly relevant research evaluating the impact of road freight modal shift to rail in Ireland, using sophisticated modeling to quantify potential emission reductions. Their findings indicate that strategic modal shift initiatives can achieve 15–25% reductions in freight transport emissions, with additional co-benefits including improved traffic safety and reduced infrastructure wear.
Zhang and Zhou [
20] analyzed modal shift policies in China using causal forest analysis and full fuel cycle assessment, demonstrating that well-designed interventions can generate emission reductions of 20–30%, cost savings of 10–15%, and improved system resilience. Their methodology provides a framework for policy evaluation that could be applied to European contexts.
However, Jensen et al. [
21] caution that environmental benefits depend significantly on system-level factors including electricity grid composition for electrified rail, capacity utilization rates, and transport corridor characteristics. Simple modal share improvements do not automatically translate to proportional environmental benefits without consideration of these systemic factors.
Infrastructure quality and capacity represent fundamental determinants of modal competitiveness, with substantial variations across European countries reflecting different historical development paths and investment priorities [
14]. The European rail freight system faces particular challenges related to technical fragmentation, capacity constraints, and regulatory complexity that undermine competitiveness relative to road alternatives [
22].
The Fourth Railway Package represents the most comprehensive attempt to address structural barriers through market liberalization and technical harmonization [
23]. However, implementation progress varies considerably across member states, with some countries achieving significant improvements while others maintain regulatory barriers and technical limitations.
Recent comprehensive research by Karam et al. [
24] provides critical insights into the systematic barriers hindering multimodal freight transport implementation across Europe. Their analysis of 104 studies identified 31 distinct barriers categorized into six domains: terminal infrastructure, network characteristics, management practices, regulatory frameworks, delivery requirements, and interoperability challenges. This systematic barrier framework reveals that terminal-related obstacles, including poor service flexibility and reliability, represent seven of the identified barriers, while network limitations such as inadequate haulage roads and insufficient terminal density contribute six additional impediments to modal shift effectiveness.
Waterway transport infrastructure presents both opportunities and constraints for modal diversification. Countries with extensive inland waterway networks, particularly the Netherlands, Germany, and Belgium, benefit from cost-effective bulk transport options that compete effectively with road and rail alternatives [
25]. However, climate change presents emerging challenges for waterway reliability through changing precipitation patterns and extreme weather events.
The role of intermodal terminals in facilitating modal shift shows that terminal efficiency and connectivity significantly influence the competitiveness of multimodal transport chains. Investment in terminal infrastructure and operations represents a critical but often overlooked component of modal shift strategies [
26].
The economic competitiveness of different transport modes depends on complex interactions between direct costs, service quality, reliability, and total supply chain efficiency considerations [
2]. Traditional cost comparisons focusing on transport costs per tonne-kilometer often favor road transport for shorter distances but fail to capture total logistics costs and service quality differentials.
Modal competitiveness varies significantly across commodity types, distance ranges, and service requirements. High-value, time-sensitive goods typically favor road transport due to superior flexibility and service quality, while bulk commodities and long-distance container flows represent the most competitive segments for rail and waterway alternatives [
27].
The digitalization of logistics operations has generally favored road transport through GPS navigation, real-time tracking, and fleet management systems that enhance productivity and customer service [
28]. Rail and waterway operations have been slower to adopt digital technologies, creating competitive disadvantages that policy interventions must address.
The digital transformation of freight transport and logistics has emerged as a fundamental driver of operational efficiency and modal competitiveness [
29]. Advanced technologies including artificial intelligence, machine learning, Internet of Things (IoT), blockchain, and cloud computing, are reshaping logistics capabilities across all transport modes. However, this technological evolution presents both opportunities and challenges for modal shift initiatives. While digitalization enhances transparency, optimizes routing, and improves supply chain visibility, the pace of digital adoption varies significantly between transport modes, potentially affecting relative competitiveness and influencing shippers’ modal choice decisions.
The role of logistics costs in modal choice decisions shows that total door-to-door costs often favor road transport even when line-haul costs favor alternatives [
30]. This highlights the importance of considering complete transport chains rather than individual mode performance in isolation.
4. Results
4.1. Compositional Data Analysis Results
The first step of the analysis was to check whether the modal distribution variables follow normal distributions. Anderson-Darling normality tests on CLR-transformed modal distribution variables confirmed that normality assumptions were not met for the majority of mode-country combinations (p < 0.05 in 127 of 140 cases), justifying the use of non-parametric procedures. Five Kruskal–Wallis tests were conducted on CLR-transformed data, one for each mode, comparing distributions across 28 countries: Air transport: H = 449.47, df = 27, p < 0.001, n_total = 448
Rail transport: H = 454.44, df = 27, p < 0.001, n_total = 448
Road transport: H = 453.58, df = 27, p < 0.001, n_total = 448
Maritime transport: H = 460.82, df = 27, p < 0.001, n_total = 448
Inland waterways: H = 448.34, df = 27, p < 0.001, n_total = 448
All Kruskal–Wallis tests indicated statistically significant differences in modal distributions across countries (p < 0.001), justifying further country-specific and European-level analyses.
Dunn’s test with Holm correction identified 246 significant pairwise differences (p < 0.05) across all mode-country combinations, confirming substantial heterogeneity in modal distributions. Linear mixed-effects models revealed significant time trends (p < 0.01) for road transport (positive) and rail transport (negative) when controlling for country-specific effects and temporal dependence.
4.2. Clustering Validation Results
Cluster optimization metrics:
k = 3: Silhouette = 0.52, Calinski–Harabasz = 89.4, Davies–Bouldin = 0.89
k = 4: Silhouette = 0.48, Calinski–Harabasz = 95.2, Davies–Bouldin = 0.94
k = 5: Silhouette = 0.51, Calinski–Harabasz = 98.7, Davies–Bouldin = 0.87
k = 6: Silhouette = 0.46, Calinski–Harabasz = 92.1, Davies–Bouldin = 0.95
The five-cluster solution achieved optimal balance across validation criteria, with cluster stability analysis showing ARI > 0.85 across 100 bootstrap samples.
Hierarchical clustering with Ward linkage on CLR-transformed data produced 87% agreement with k-means results (ARI = 0.72), confirming cluster validity.
4.3. Logistics Diversification: Extreme Cases and Modal Trends in Europe, 2023
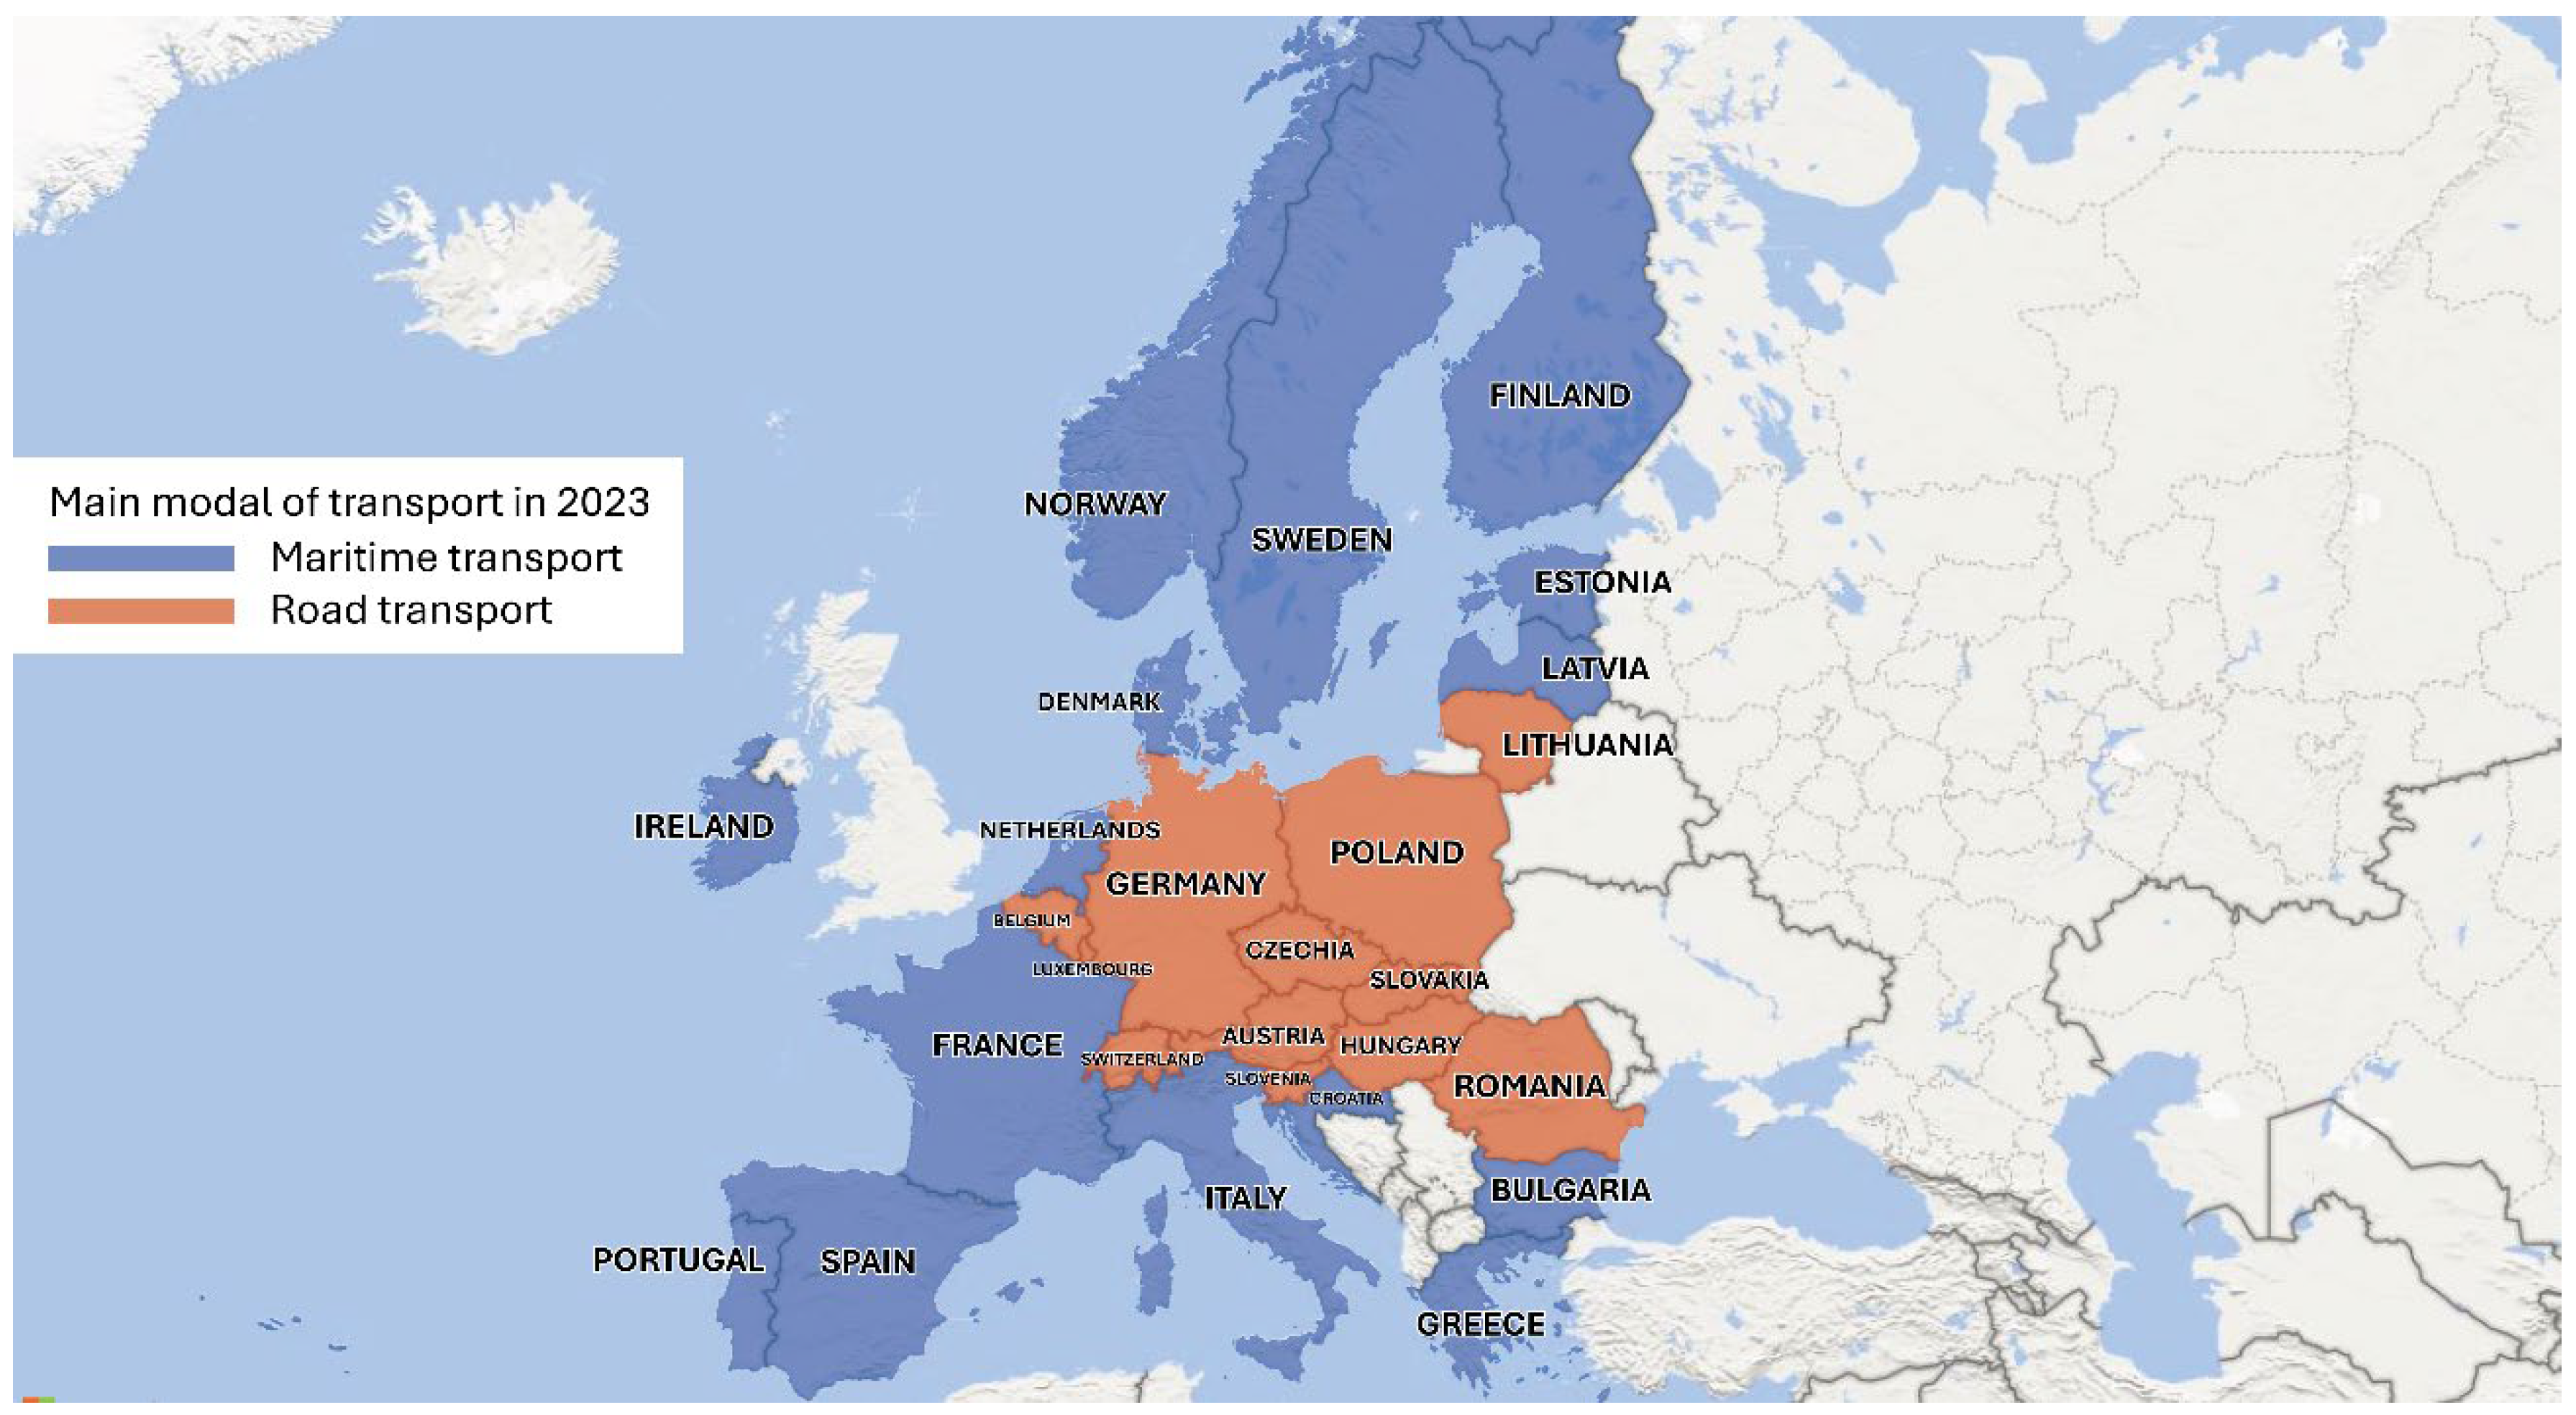
Looking first at the European scenario,
Figure 1 shows that in 2023, the main modes used in the countries were maritime and road.
When excluding maritime transport to account for geographical constraints, road transport emerged as the dominant mode in all 28 analyzed countries and across Europe generally in 2023. This pattern of road transport predominance persisted throughout the entire study period (2008–2023) for the majority of countries, with one notable exception: the Baltic states historically relied on rail transport as their primary freight mode. However, these countries have undergone significant modal transitions in recent years, as demonstrated in
Table 1, shifting from rail to road dominance.
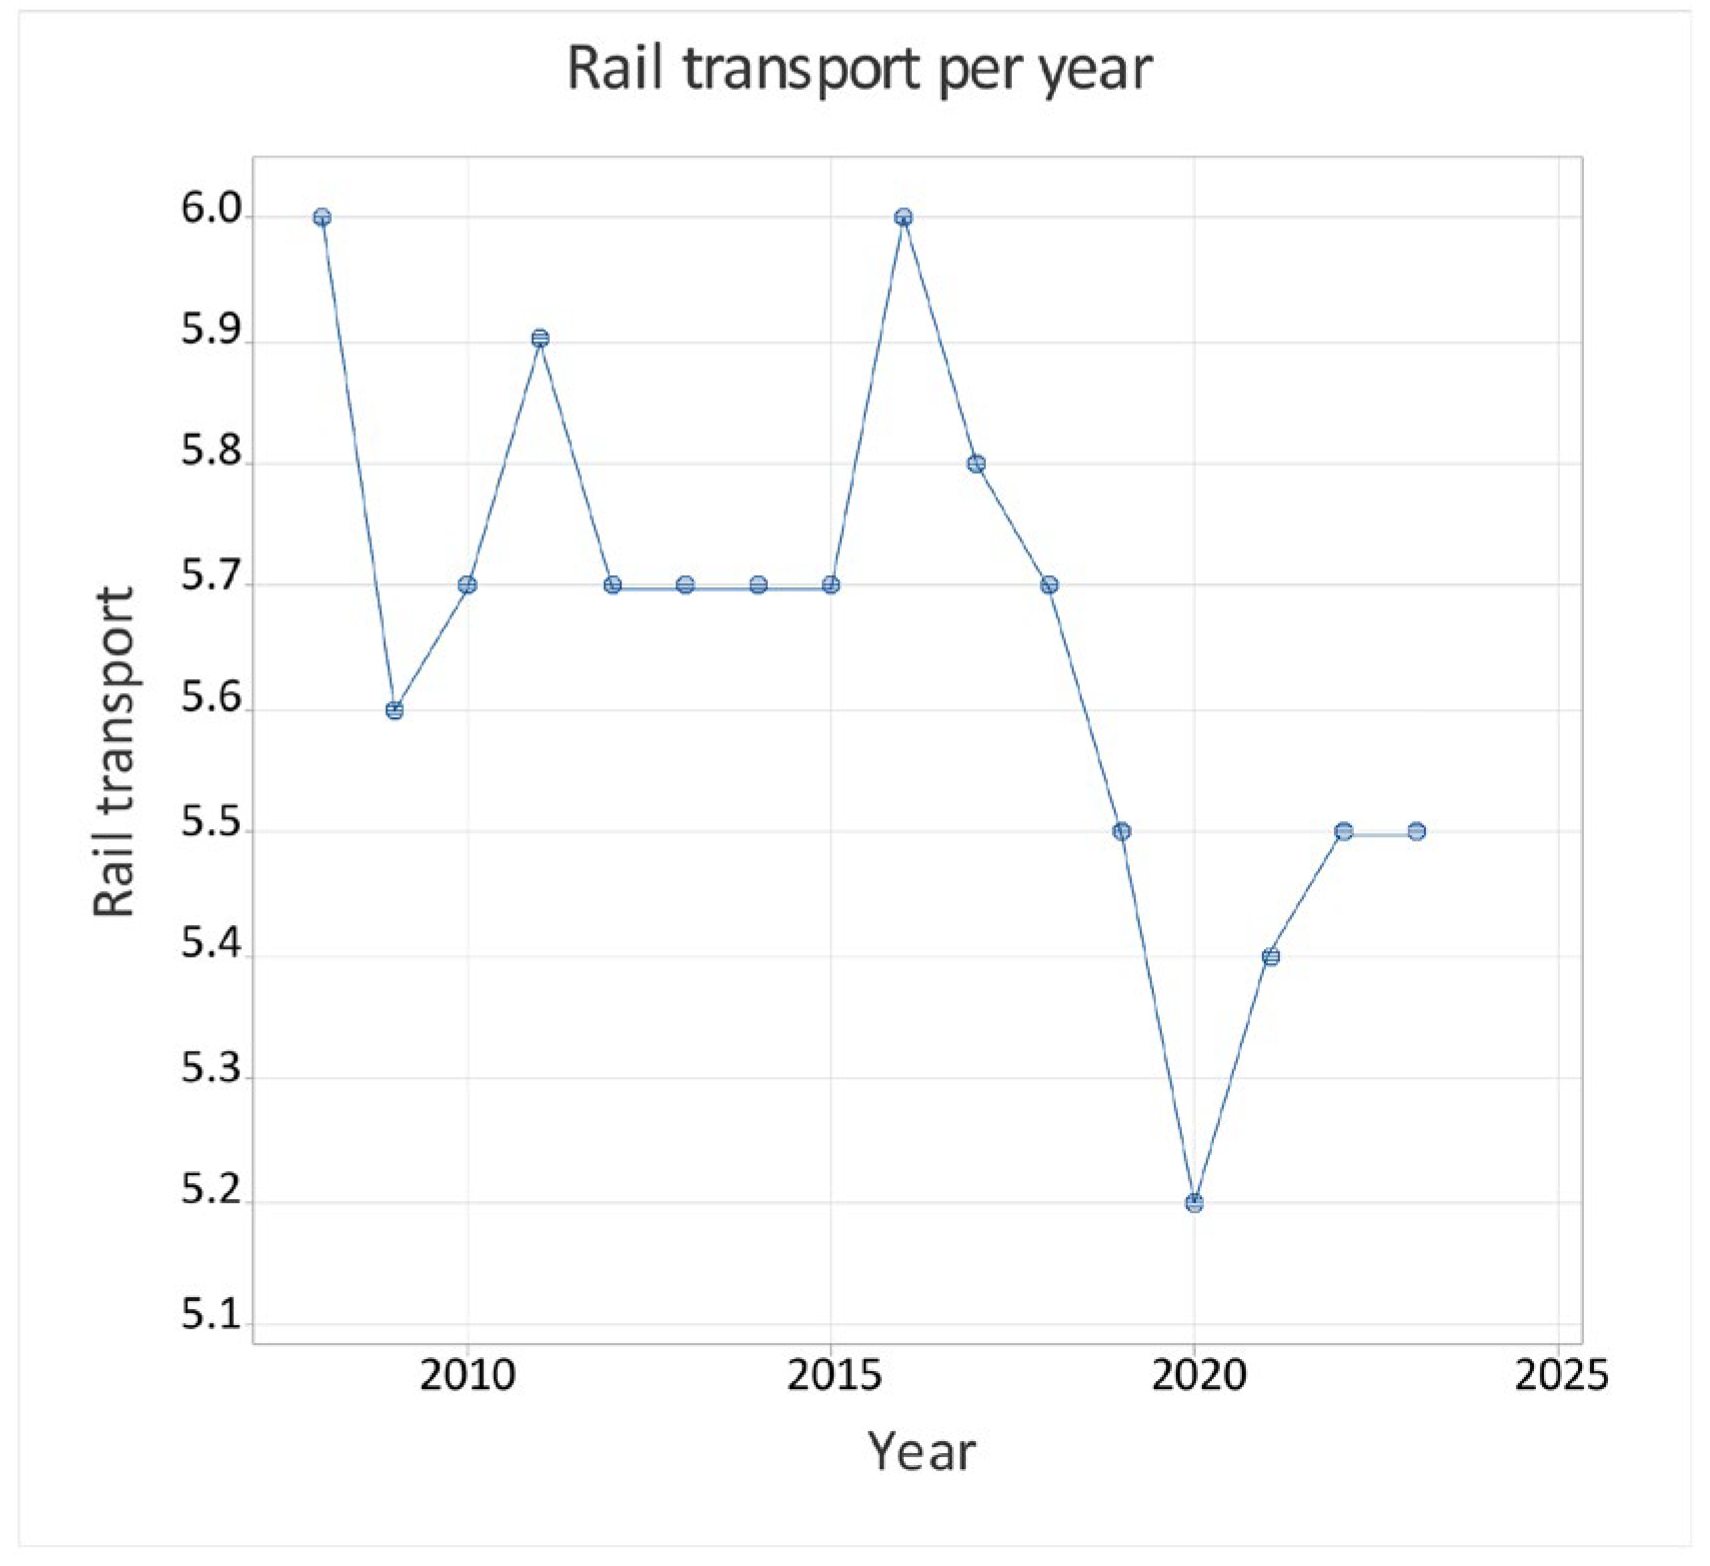
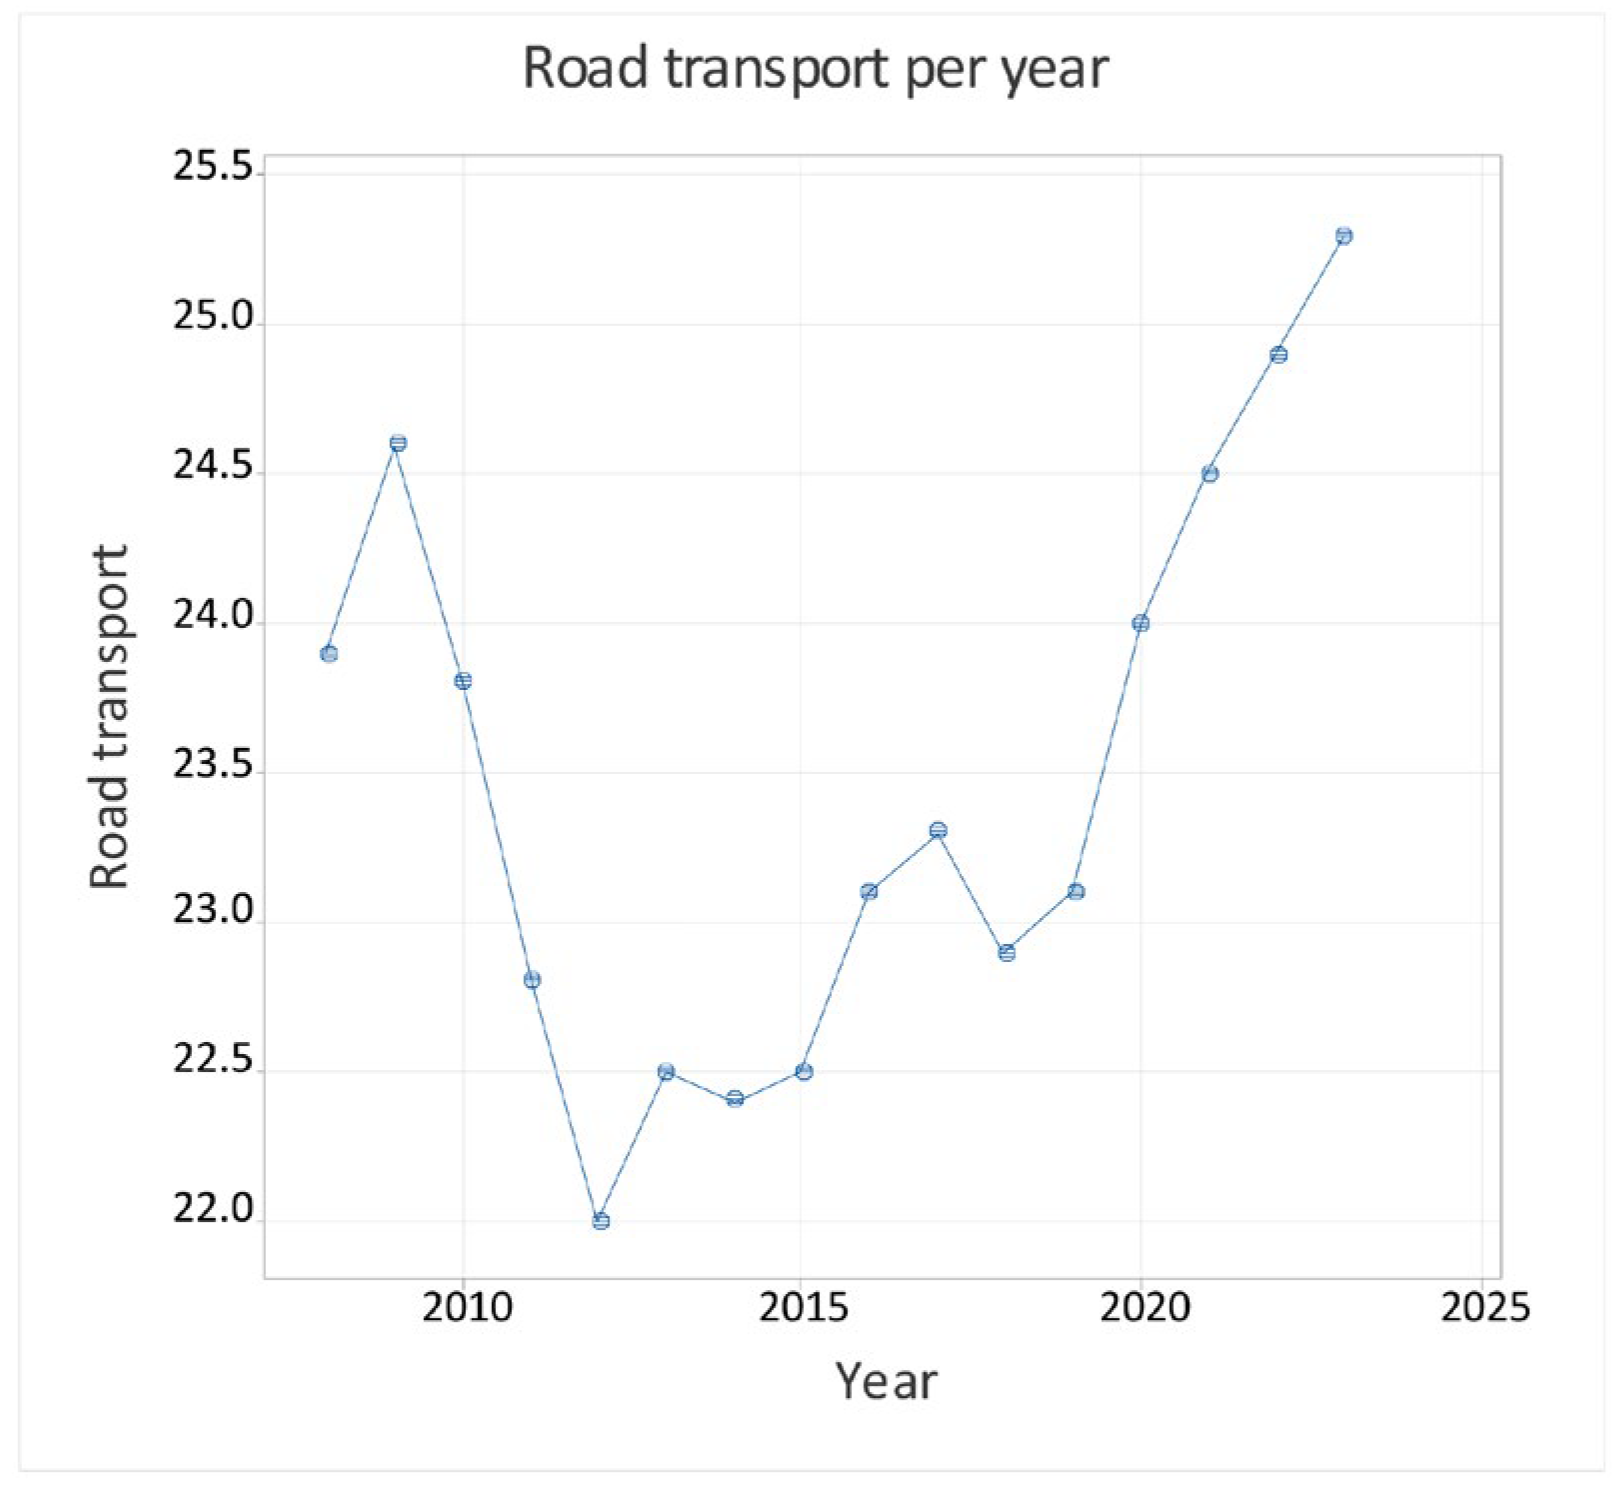
This finding prompted a deeper investigation into the broader European scenario.
Figure 2 and
Figure 3 clearly illustrate that rail transport’s modal share has systematically declined over the past 15 years, while road transport has experienced corresponding growth, revealing a concerning trend when considering environmental sustainability objectives.
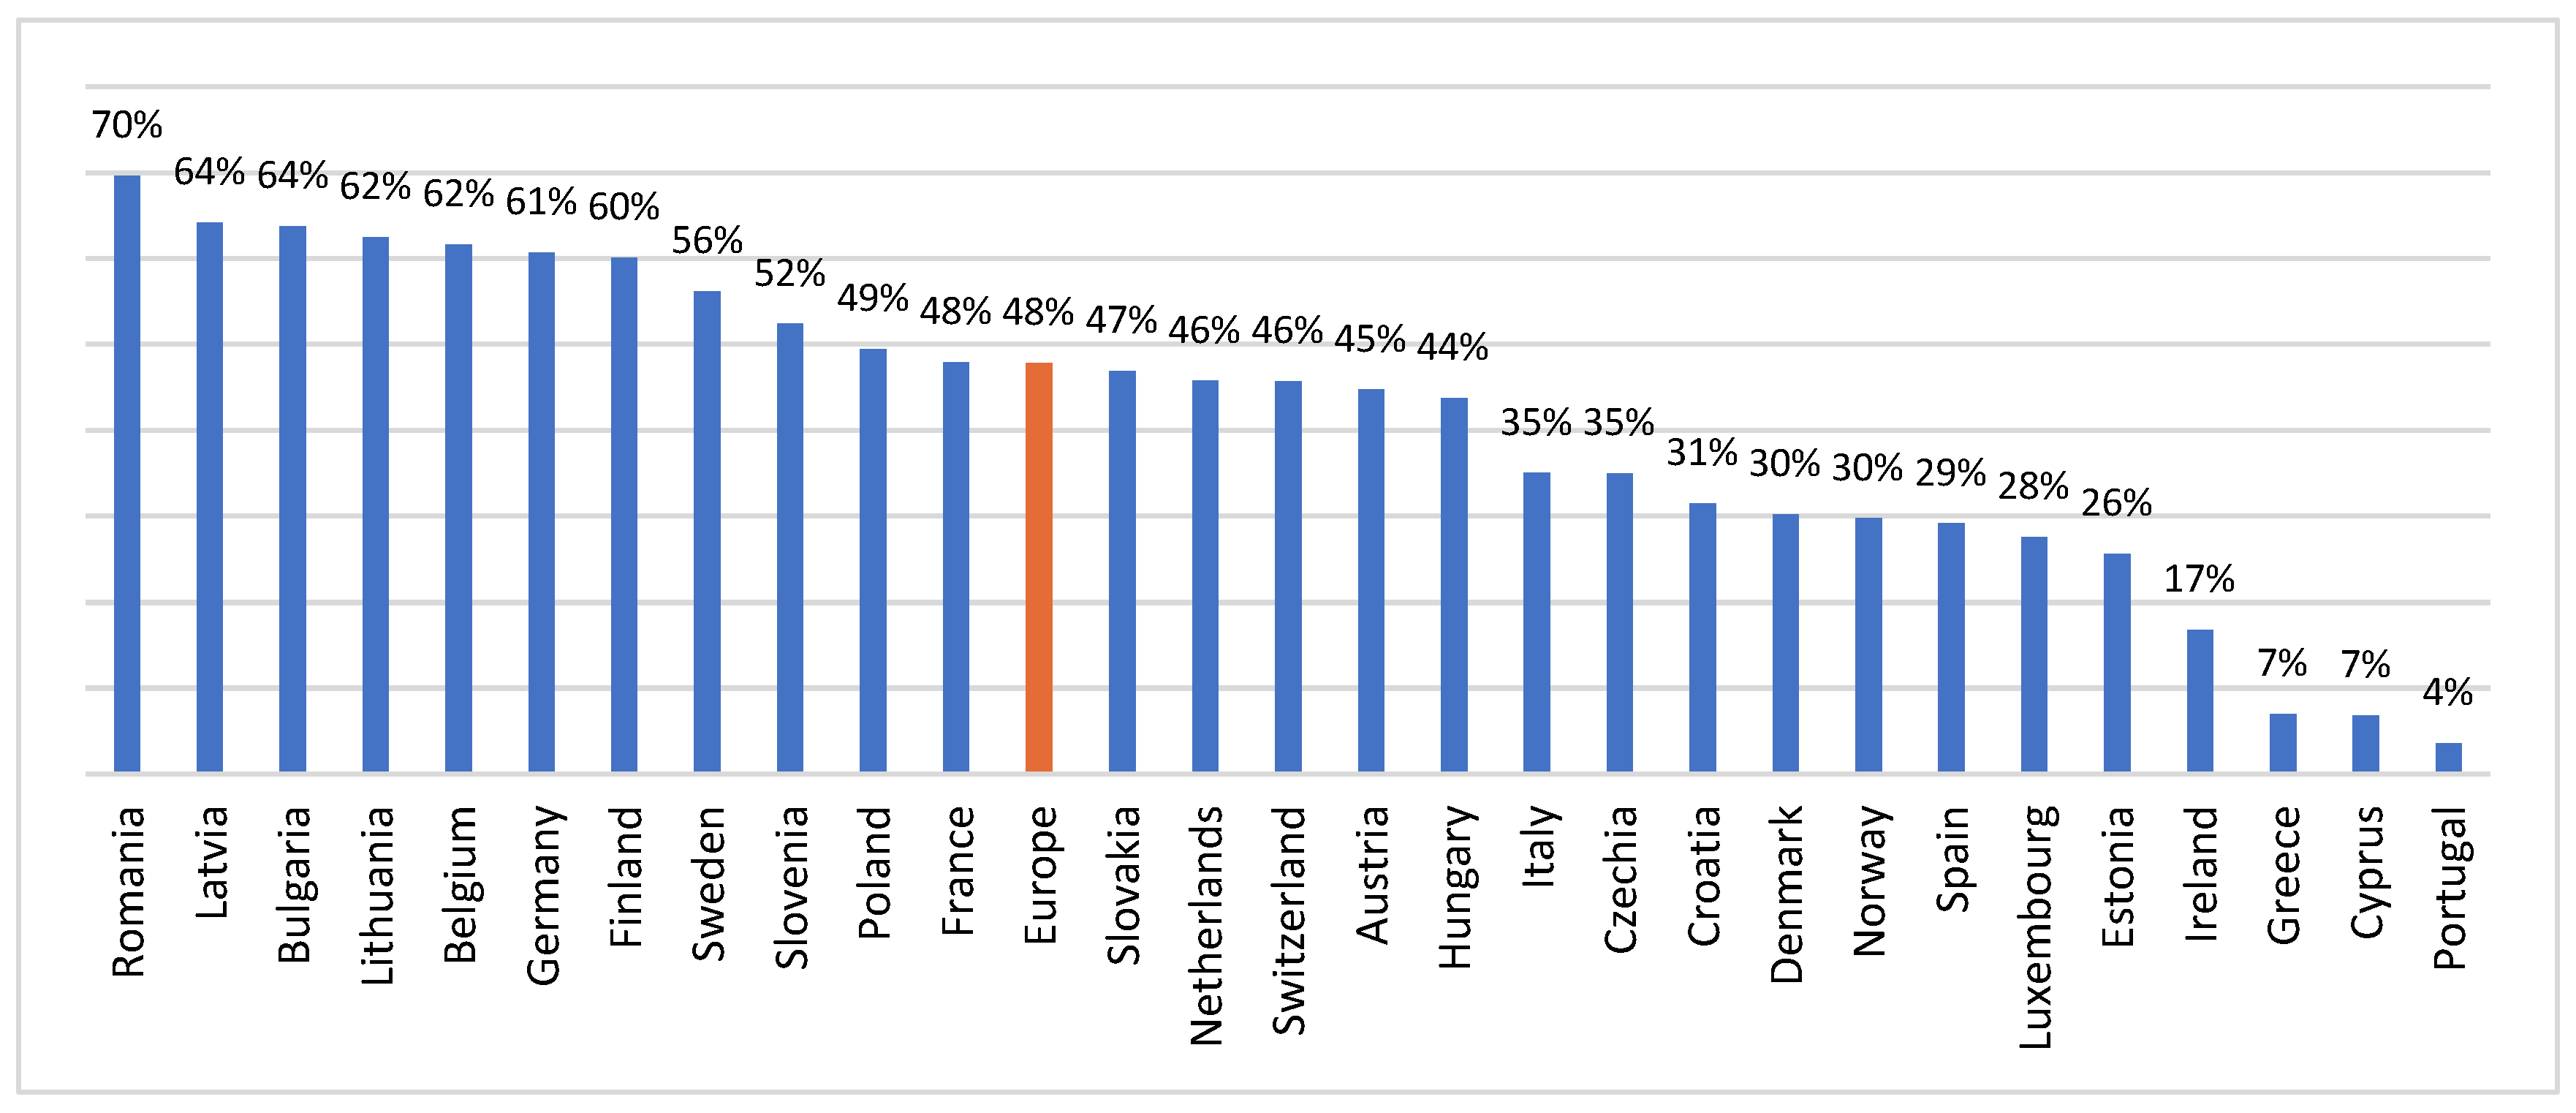
These findings required a comprehensive investigation into modal distribution behavior across countries through the application of the Logistics Diversification Index calculations for each nation.
Figure 4 presents countries ranked from highest to lowest logistics diversification (left to right), with Romania and Portugal representing the extreme cases of maximum and minimum diversification, respectively.
The temporal evolution of the diversification index between 2008 and 2023 is represented in
Figure 5, demonstrating that only 8 countries (28.6%) experienced increased diversification, indicating that they achieved greater balance in their modal distribution. This finding reveals a concerning “diversification paradox” where the majority of European countries moved toward greater modal concentration despite policies promoting transport diversification.
The term “diversification paradox” refers to the counterintuitive trend where transport systems become less balanced across modes, contrary to policy goals promoting modal diversification. Similarly, “modal concentration” describes a scenario where freight transport heavily relies on one or two modes, reducing system resilience [
24].
Examining Romania and Portugal as representative extreme cases provides insights into the factors influencing logistics diversification.
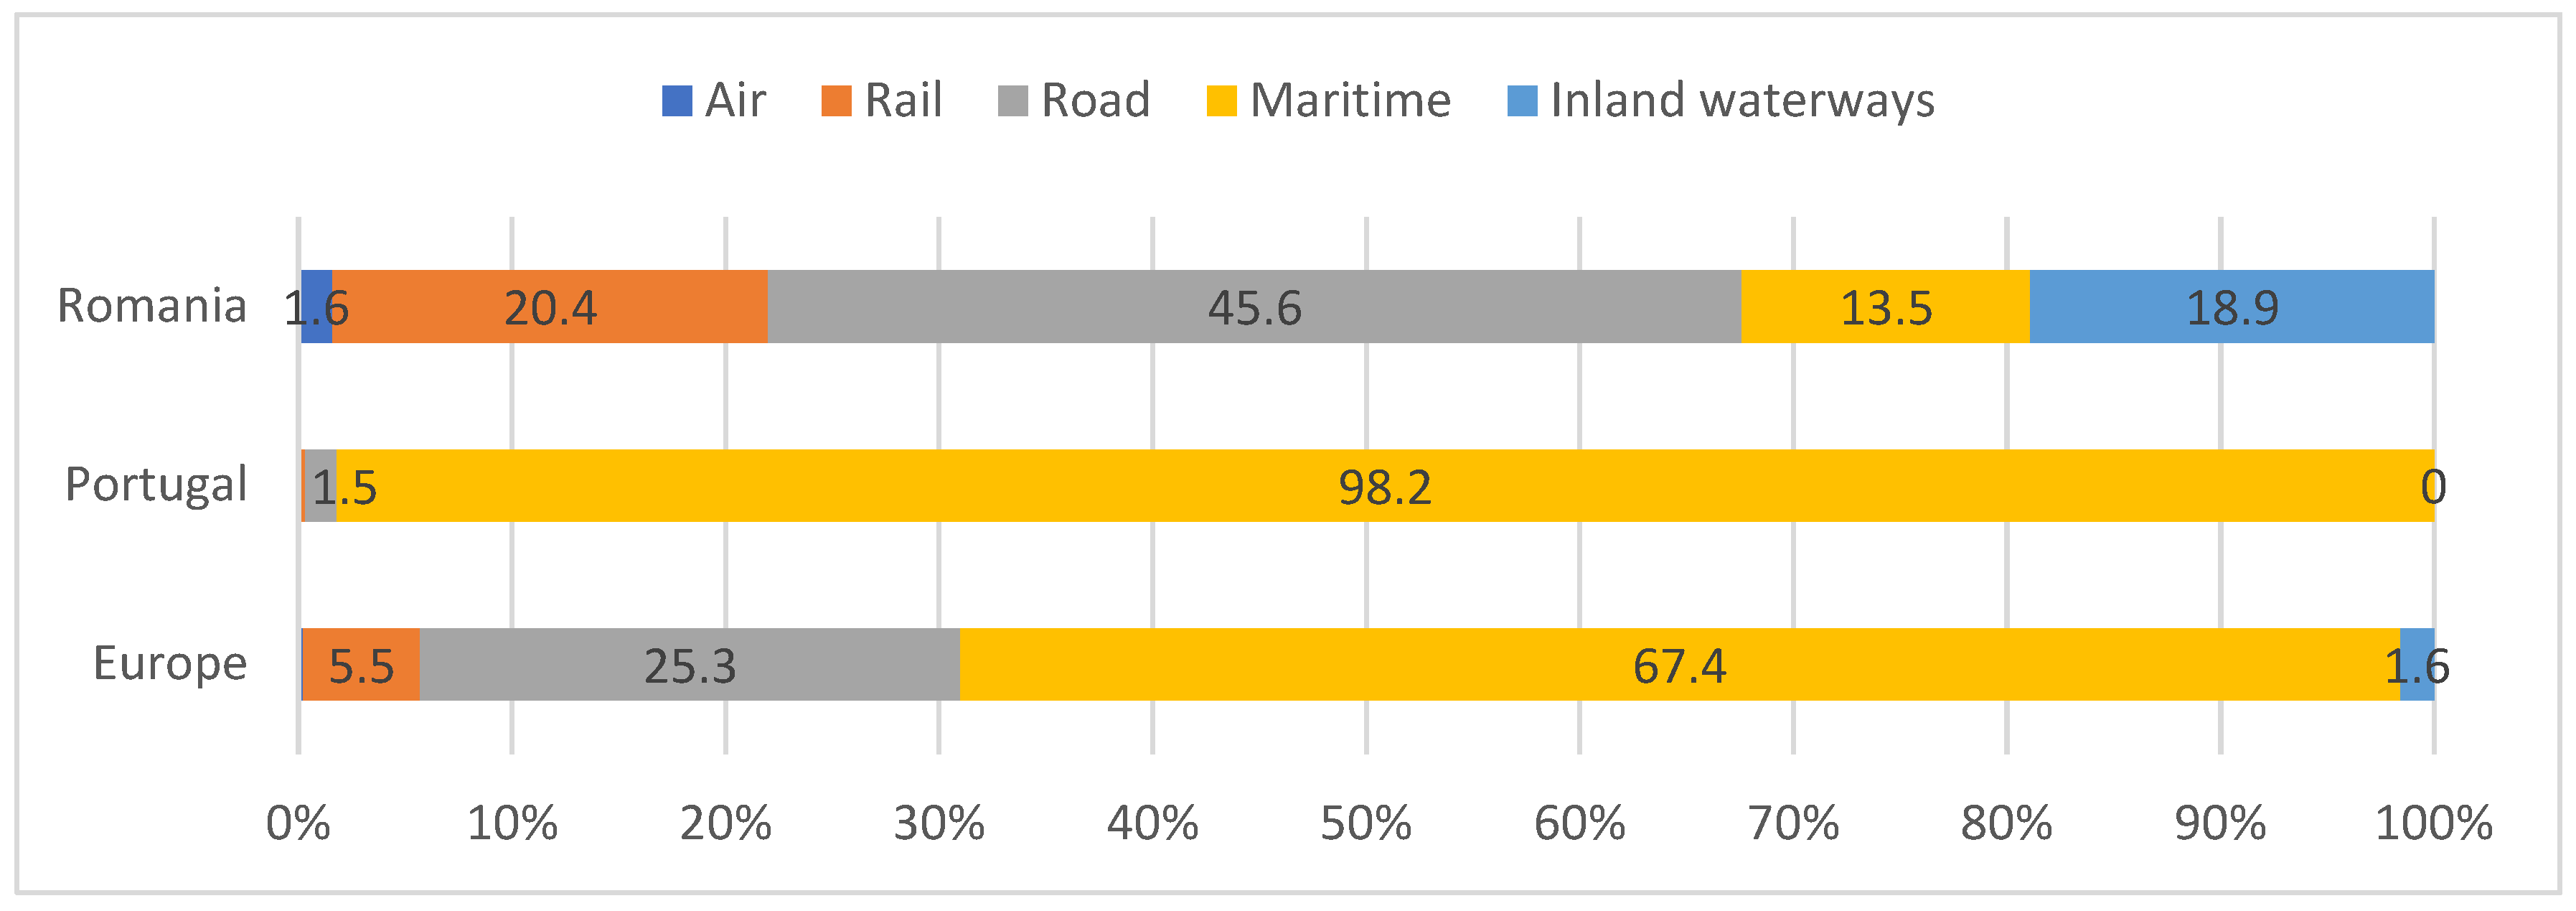
Figure 6 confirms Romania’s more balanced modal distribution, corroborating the rankings presented in
Figure 4, with no single transport mode accounting for more than 45.6% of total freight volume. In stark contrast, Portugal exhibits high modal concentration with maritime transport dominating 98.2% of freight flows, resulting in the lowest diversification score among all analyzed countries. This comparison illustrates the spectrum of modal distribution patterns across Europe and highlights how geographical constraints and policy choices can lead to different transport system structures.
Romania (Highest Diversification): Road: 45.6%, Rail: 20.4%, Maritime: 13.5%, Inland waterways: 18.9%, Air: 1.6%. This balanced distribution reflects geographical advantages, infrastructure legacy, and supportive policies.
Portugal (Lowest Diversification): Maritime: 98.2%, Road: 1.5%, Rail: 0.3%, Air: 0.0%, Inland waterways: 0.0%. This concentration reflects geographical constraints as a peripheral coastal country.
Europe: Road: Road: 25.3%, Rail: 5.5%, Maritime: 67.4%, Inland waterways: 1.6%. Air: 0.2%.
To better understand the modal transport distribution among European countries, K-means has been used for clustering analysis of modal distributions, and cluster configurations ranging from 3 to 5 groups were evaluated. The five-cluster solution was selected as it provided the optimal balance between meaningful country groupings and statistical validity, while avoiding the overfitting that would result from higher cluster numbers.
Table 2 presents the modal transport distribution among European countries in 2023.
K-means clustering identified five distinct country groups:
Cluster 1: Road and rail predominance (10 countries)—Austria, Czechia, Hungary, Lithuania, Luxembourg, Poland, Romania, Slovakia, Slovenia, Switzerland.
Cluster 2: Road and maritime predominance (3 countries)—Belgium, Finland, Germany.
Cluster 3: Maritime and road predominance (4 countries)—Bulgaria, France, Latvia, Sweden.
Cluster 4: Maritime and road predominance (7 countries)—Croatia, Denmark, Estonia, Italy, Netherlands, Norway, Spain.
Cluster 5: Maritime predominance (4 countries)—Cyprus, Greece, Ireland, Portugal.
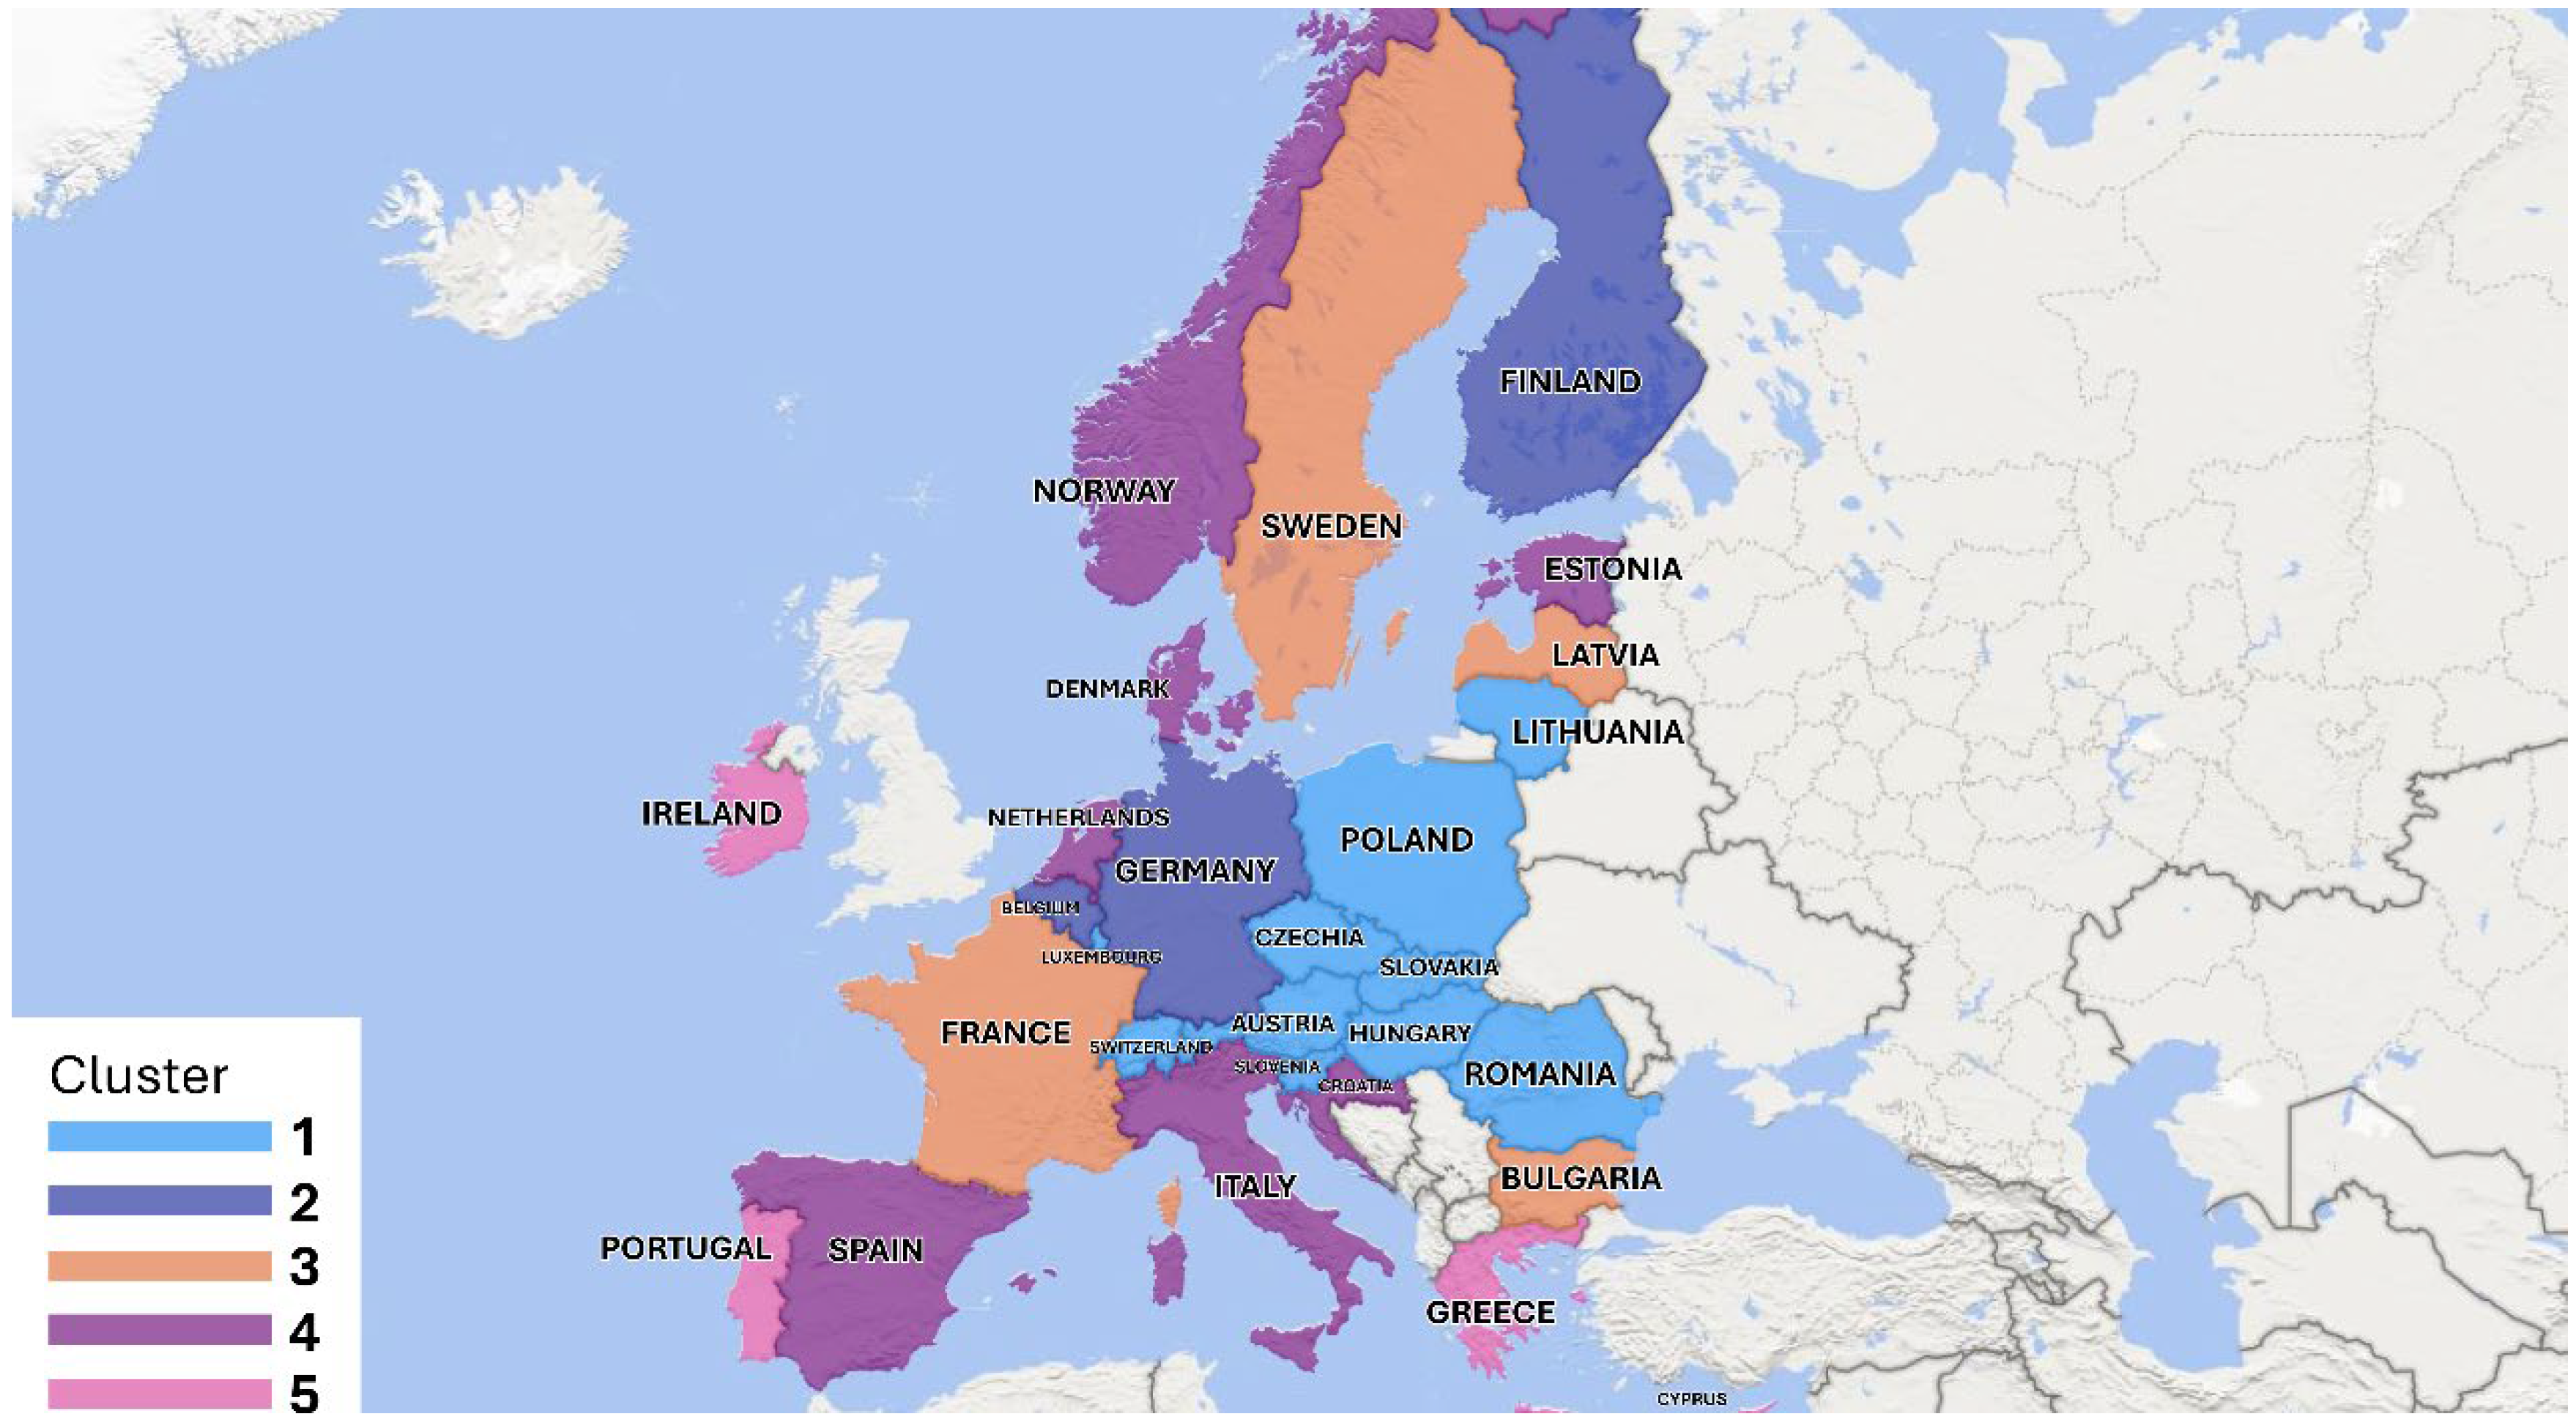
A graphical clustering configuration is presented in
Figure 7, which reveals distinct patterns in European freight transport systems.
Cluster 5 comprises countries with the most unbalanced modal distributions, characterized by maritime transport dominance exceeding 90% of total freight flows.
Cluster 1 demonstrates strong geographical cohesion, grouping Central and Eastern European countries that share similar infrastructure legacies and exhibit more diversified modal distributions. This geographical clustering pattern suggests that regional factors, including shared infrastructure networks and economic integration processes, significantly influence modal distribution characteristics beyond individual national policies.
5. Discussion
The empirical findings provide compelling evidence that there is a systematic decline in rail transport coinciding with road transport growth, which directly contradicts specific EU policy objectives under the European Green Deal and the Sustainable and Smart Mobility Strategy [
1].
Connection to specific EU policies:
Trans-European Transport Network (TEN-T): Despite €26.4 billion allocated to rail infrastructure under the 2014–2020 period, our analysis shows continued rail modal share decline in 71% of analyzed countries.
Fit for 55 Package: The observed modal concentration toward road transport undermines the package’s objective of 90% emission reduction by 2050, as road freight produces 2.8 times more CO2 per tonne-kilometer than rail alternatives.
Rail Freight Corridors: The Fourth Railway Package’s implementation has shown limited impact on reversing the rail decline trend, suggesting that regulatory harmonization alone is insufficient without addressing fundamental competitive disadvantages.
The systematic road transport advantage stems from multiple reinforcing factors:
Infrastructure connectivity: Road networks provide universal door-to-door access, while rail requires additional road transport for final delivery in 78% of freight flows.
Digital integration: GPS tracking, real-time visibility, and fleet management systems favor road transport operational efficiency.
Service frequency: Road transport offers on-demand flexibility versus scheduled rail services with limited departure frequencies.
Terminal costs: Intermodal rail transport incurs additional handling costs averaging 15–25% of total transport costs.
Modern supply chain practices prioritizing flexibility and responsiveness favor road transport’s adaptability over the fixed schedules and limited flexibility of rail and waterway alternatives.
The clustering analysis reveals that geographical factors fundamentally shape modal distribution patterns. Coastal countries naturally show higher maritime shares. Countries with inherited rail networks from previous economic systems maintain higher rail shares, but the Baltic transition demonstrates how quickly these advantages can erode when underlying economic conditions change. The consistency of road transport dominance across diverse geographical and economic contexts suggests systematic structural advantages that current policies fail to address adequately.
The identified trends have profound implications for European climate objectives. Countries with more extreme modal transport concentration face resilience challenges and potential competitiveness disadvantages as sustainability considerations become more important in supply chain decisions. Romania’s balanced distribution demonstrates how diversification can enhance both resilience and adaptability to changing conditions.
Each cluster faces systematically different challenges requiring tailored interventions: countries with more diversified modals of transport should focus on maintaining advantages through continued multimodal support, road-dominant countries represent the greatest opportunities for modal shift through targeted policies, maritime-dominated countries face constraints but opportunities for improving terrestrial balance, maritime-road countries need strategies preventing further rail decline, and inland waterway-integrated countries can serve as models for similar geographical contexts.
6. Conclusions
This comprehensive analysis provides empirical evidence that challenges the effectiveness of current European transport policies when analyzed using appropriate compositional data methods. The findings reveal substantial heterogeneity in modal distribution patterns across the 28 countries analyzed, with statistical significance confirmed across all transport modes using CLR-transformed data (p < 0.001). However, the most concerning discovery is the systematic deterioration in European transport sustainability over the 15-year study period.
The empirical evidence demonstrates a fundamental disconnect between European policy objectives and actual outcomes. Despite substantial investments through the Trans-European Transport Network (TEN-T) and numerous national initiatives promoting sustainable transport, rail freight’s modal share declined while road transport increased. This trend directly contradicts the environmental imperatives underlying European transport policy, particularly given that rail freight produces fewer CO2 emissions per tonne-kilometer than road alternatives.
The persistence of this counter-sustainability trend raises questions about the structural factors driving modal choice decisions. The universal dominance of road transport across countries with vastly different geographical, economic, and policy contexts suggests that current interventions fail to address fundamental competitive advantages inherent to road-based logistics systems, including superior door-to-door connectivity, technological sophistication, and supply chain integration capabilities.
Perhaps the most significant finding is the identification of a “diversification paradox” whereby European countries experienced decreased logistics diversification despite explicit policies promoting modal balance. This systematic movement toward modal concentration undermines transport system resilience and contradicts theoretical expectations about policy effectiveness. The paradox suggests that current European transport policies may be fundamentally misaligned with the structural forces shaping modern freight transportation. The clustering analysis reveals that geographical factors significantly influence modal distribution patterns. Portugal’s maritime concentration reflects its peripheral coastal position and extensive international maritime connections, making its placement in Cluster 5 alongside other isolated, maritime-dependent countries logical. However, Romania’s exceptional diversification demonstrates that balanced modal distributions remain achievable through appropriate combinations of geographical advantages, infrastructure legacy, and supportive policies.
The geographical coherence observed in Cluster 1, comprising Central and Eastern European countries with diversified modal distributions, suggests that regional coordination could enhance policy effectiveness by leveraging shared infrastructure networks and economic integration processes. The findings generate several research priorities. Most critically, why does road transport’s modal share continue expanding despite policy interventions promoting alternatives? Future research should investigate whether technological developments, such as fleet electrification and autonomous vehicles, might mitigate environmental impacts while maintaining road transport’s competitive advantages, or whether these innovations could be leveraged to enhance the competitiveness of sustainable alternatives.
The empirical foundations established in this study support promising research directions, such as causal analysis investigating the relationships between specific policy interventions and modal distribution outcomes could identify effective approaches for future implementation; country-specific case studies, particularly of successful diversification examples like Romania or transitions like the Baltic states, could provide insights into the mechanisms driving modal shift processes.
This study advances the modal shift literature through three key contributions. Methodologically, it represents the first large-scale application of compositional data analysis to European freight modal distributions, addressing fundamental statistical validity issues in previous research. Empirically, the documentation of the diversification paradox challenges conventional assumptions about policy effectiveness and highlights the need for structural interventions addressing road transport advantages. Practically, the integration of diversification indices with cluster analysis establishes a diagnostic framework serving multiple policy objectives: for European Green Deal monitoring, the diversification index provides a quantitative metric for tracking modal balance progress toward 2030 and 2050 targets; for TEN-T corridor evaluation, cluster analysis identifies countries with similar infrastructure challenges requiring coordinated investments; for national transport planning, country-specific cluster membership informs targeted intervention strategies based on modal distribution patterns.
Specific policy recommendations emerge from cluster analysis. Cluster 1 countries (road-rail balanced) should maintain multimodal advantages through continued infrastructure investment and digitalization programs. Cluster 5 countries (maritime-dominated) should focus on terrestrial modal balance through targeted rail corridor development and intermodal terminal investment. All clusters must address systematic road transport advantages through coordinated pricing mechanisms, infrastructure capacity enhancement, and service quality improvements for sustainable alternatives.
The evidence presented demands reassessment of European transport policy frameworks, moving from sectoral approaches treating transport modes in isolation to integrated strategies addressing relative modal competitiveness simultaneously. While focused on Europe, the compositional data methodology and diversification monitoring framework apply to other regional contexts facing similar modal shift challenges, particularly in North America and Asia-Pacific regions implementing carbon reduction strategies.
The transformation toward sustainable European freight transport systems requires sustained commitment and evidence-based policy development guided by comprehensive empirical analysis, such as presented in this study.
