1. Introduction
South Africa’s pome fruit industry ranks among the world’s leading apple and pear exporters, serving over 60 international markets and competing directly with major producing countries like Chile, New Zealand, and the United States. This industry is critical to the country’s agricultural exports, employment, and economic growth. However, supply chain inefficiencies in the early stages compromise South Africa’s ability to maintain its competitive edge internationally, particularly as global quality standards continue to rise and consumers increasingly demand premium fruit with an extended shelf life.
South Africa (SA) is the leading fruit exporter in the Southern Hemisphere, contributing to approximately 36% of total fruit exports [
1]. Deciduous fruit comprise a large percentage of these exports, with 72% of growth and production of pome fruit, i.e., apples and pears, concentrated in the Western Cape, where this study took place [
2]. Despite their international relevance, the competitiveness of these commodities is increasingly constrained. Within a developing country such as SA, the infrastructure, technology, processes, and management skills within a cold chain display major inefficiencies [
3,
4]. It is further estimated that developing countries prescribe roughly 40% of their losses to inefficiencies found in the post-harvest and processing stages of the supply chain [
5].
The physiological sensitivity of apples and pears to temperature and time is well established [
6,
7,
8,
9]. Apples and pears are extremely sensitive to temperature fluctuations in the 48 h following harvest. Once harvested, the fruit continues to respire, necessitating rapid cooling to maintain quality. If pulp temperatures do not drop below 5 °C within 12–24 h after harvest, fruit respiration continues at a higher rate, reducing its firmness and overall shelf life [
10]. Delays in the fruit reaching their optimal pulp temperature often result in the downgrading of fruit quality from Class 1 (required for export markets) to Class 2 (destined for local markets).
Limited research exists on the initial stages of the pome fruit supply chain, particularly the processing phase, which forms the focus of this study. Pome fruit processing involves multiple sequential stages within processing facilities, influenced by interconnected factors, including handling practices, lead times, facility congestion, operational coordination, and cooling infrastructure. This study conducts an in-depth analysis of Company X’s processing facility by systematically dividing the processing phase into four distinct stages: (1) Weighbridge to Pre-cooling, (2) Cold Storage to Packhouse, (3) Packhouse to Re-cooling, and (4) Re-cooling to Loading for Market. While the research encompasses Company X’s overall fruit processing operations, particular emphasis is placed on the five highest-value apple and pear varieties based on monetary value and/or volume: Royal Gala, Golden Delicious, and Pink Lady apples, and Forelle and Packham’s Triumph pears.
Although cold chain research has highlighted operational inefficiencies in developed markets, limited studies within a developing-country context exist, particularly during the processing phase of pome fruit. This study addresses this gap in the research by combining quantitative operational data with qualitative insights from observations and industry stakeholders: (1) empirically, it provides one of the first systemic analyses of bottlenecks in South Africa’s pome fruit industry by linking operational processing challenges to impacts on fruit quality; and (2) theoretically, it enhances supply chain resilience and perishable logistics literature by highlighting how infrastructure constraints and coordination inefficiencies influence outcomes in export-orientated agricultural countries.
Based on the identified gaps in the literature and the challenges experienced in South Africa’s pome fruit sector, this study aims to answer the following research questions (RQ):
RQ1: How do lead times at key cold chain stages affect fruit temperature and firmness during handling and processing?
RQ2: To what extent do pulp temperature variations effect the relationship between operational delays and fruit quality?
RQ3: How does seasonality, especially during peak harvest periods, influence operational delays, temperature rises, and quality loss?
RQ4: How can tracking firmness changes from fruit arrival to packing provide a practical way to monitor and improve cold chain performance at a pome fruit packhouse?
2. Research Design and Methodology
The following section outlines the research design and methodology used to conduct the research for this article.
2.1. Research Design
The research followed a deductive, case-study approach, focusing on a single organisation (Company X) wherein real-world cold chain operations are executed. A mixed-methods approach combined both secondary quantitative data and primary and secondary qualitative data (observations, semi-structured interviews, and internal reports) to ensure detailed data triangulation. Due to Company X altering their data systems in 2021, the study was limited to a single season (2022), making this research cross-sectional in nature. However, the 2022 harvest season dataset was of sufficient scale, completeness and consistency to clearly identify systemic patterns. This approach highlights the interdependencies between variables at the four different stages present at Company X’s facility, enhancing the understanding of the pome fruit industry within the specific context of this use case [
11].
2.2. Setting
The research was conducted at Company X’s pome fruit facility, where the processing and logistical functions of the surrounding farmers are performed, stretching from post-harvest activities to the cold storage, marketing, and exporting of the fruit. Company X was selected as it processes a significant share of South Africa’s pome fruit exports, making it representative of industry practices within the deciduous fruit industry. While a single-case design can limit generalisability, the facility’s scale allows meaningful insights into systemic cold chain challenges.
2.3. Study Population and Sampling Strategy
The research population consisted of Company X employees and industry professionals specialising in cold chain management, quality control, and supply chain logistics. The study used historical operational datasets from Company X’s systems to quantitatively analyse the fruit’s journey through the facility. One of these quantitative datasets consisted of 580 temperature trials across six operational stages with both temperature and maturity testing performed on 30 fruit per bin (10 large, 10 medium, 10 small)—in other words, 1 trial consisted of 30 samples. Although the study relied on secondary data from Company X, the researchers are confident that industry standard temperature monitoring equipment and proper calibration procedures were applied, given the company’s established expertise and reputation within the South African pome fruit supply chain.
A purposive sampling strategy was used to collect qualitative data through semi-structured interviews with operational managers, marketers, quality controllers, and other supply chain actors. A total of twelve semi-structured interviews were conducted, each lasting 60–90 min and guided by a standardised set of questions related to cooling, handling delays, and infrastructure bottlenecks. Five facility observations were performed during both peak and off-peak periods to document operational variability. Analyses were cross validated through triangulation of temperature trial data, lead time measurements, and interview insights to ensure reliability and enhance understanding of systemic inefficiencies within the cold chain process.
2.4. Data Collection and Analysis
Secondary quantitative data were sourced directly from Company X’s operational systems (standardised in Excel and CSV format) and included a combination of structured and semi-structured data across all handling and processing stages. Data management was guided by the ‘Five V’s’ of big data management—volume, velocity, variety, veracity, and value—encompassing diverse information on lead times, temperature profiles (ambient and pulp temperature), maturity indices, and quality reports [
12]. Prior to analyses, raw data was cleaned and transformed in Excel and Python (version 3.10) using pandas to structure the data. Cleaning encompassed the standardisation of columns and textual data, aggregating data for time resolutions and evaluating missingness profiles to determine, for example, whether data was missing not at random and/or missing at random due to missed recordings. These steps were verified through consultations with Company X’s data scientists, and domain accuracy was ensured through a data dictionary.
Data analyses were predominantly performed in said Python Notebooks through the use of NumPy for calculations, Matplotlib (version 3.5) for visualisations, and statsmodels for regression and significance testing. Records exceeding 24 h represented approximately 2–3% of the usable dataset (after data transformation) and were excluded to avoid skewness. However, this may result in overlooking rare but critical operational failures. To address this, descriptive results for the excluded more-than-24 h cases were reported separately to highlight systemic vulnerabilities. Furthermore, interquartile ranges were used to address and exclude these outliers that had the ability to skew results and findings. Measures of central tendency (mode, median, mean, and variability) were used in combination with their standard deviation to further enhance the accuracy of the results [
13]. The use of these measurements (IQR and central tendency) enabled the study to identify common trends between temperature, lead times, and fruit quality throughout the processing stages, while also assessing the variability and distribution (shape) of the data, ultimately aiding in real life operational comparisons and decision-making. In addition, inferential analyses were applied to assess relationships between lead times, seasonality, pulp temperatures, and fruit quality.
Primary qualitative data was collected via semi-structured interviews and observations, while secondary qualitative data was collected from internal documentation. This included information pertaining to operational procedures, policies, bottlenecks, cold chain practices, and infrastructure layout and efficiency. A thematic analysis was used to analyse the data, and the findings were used to support the interpretation of the quantitative operational data. Constructs and variables such as time of harvest, quality, temperature deviation, lead times, and maturity indices were used to ascertain cause and effect through links between time, temperature, and fruit quality/maturity.
2.5. Strengths and Limitations of the Study
This study demonstrates several methodological strengths that enhance the reliability of its findings. The research utilised a robust quantitative foundation derived from operational data spanning multiple months and encompassing hundreds of thousands of fruit bins, providing sufficient statistical power for meaningful pattern analysis. The integration of semi-structured interviews with internal stakeholders enabled contextual validation of quantitative findings and provided explanatory insights into observed operational anomalies. In addition, the focus on real-world operational data rather than simulated conditions enhances the external validity and practical applicability of the findings.
Several limitations must be acknowledged when interpreting these results. First, the systematic exclusion of outlier records exceeding 24 h, whilst justified for analytical focus, may introduce selection bias by potentially disregarding critical operational failures that could provide valuable insights into system vulnerabilities. Second, temporal constraints limited the analysis to the 2022 harvest season due to data quality inconsistencies in previous seasons from legacy systems, restricting the ability to assess seasonal variability or longitudinal trends.
Third, the reliance on secondary data provided by Company X precluded access to specific technical specifications regarding temperature monitoring equipment or calibration protocols, representing a potential source of measurement uncertainty. Fourth, the single-organisation case study approach, whilst providing depth of analysis, limits generalisability across the broader perishable goods sector, particularly to operations with different scales, technologies, or geographic contexts.
4. Results
This section presents an overview of the key findings from the analysis of the beginning stages of the apple and pear supply chain at Company X during the 2022 harvest season, focusing on the pre-cooling, packhouse, and re-cooling stages. The analysis drew on extensive secondary data from Company X, including throughput and lead time metrics, along with descriptive data from 580 temperature trials conducted across six critical operational areas. Observations and semi-structured interviews proved invaluable in contextualising the quantitative data into meaningful insights. The aim was to assess compliance with cold chain protocols, evaluate temperature integrity, and identify systemic inefficiencies that contribute to pulp temperature variations, fruit quality decline, and ultimately influence fruit classification and market readiness.
4.1. Company X’s Market Overview
South African pome fruit farmers, and Company X in particular, rely heavily on exporting their produce to international markets. This industry is experiencing complex trading challenges due to significant market volatility and saturation, and a growing emphasis on quality amongst consumers. Company X and its competitors must continuously adapt to changing market requirements to secure increased volume and value for their farmers whilst maintaining fruit quality standards.
Company X processes and markets over 25 pome fruit varieties across roughly 75 farms, positioning them as a major player in the South African pome fruit supply chain. Company X’s five-year data trend shows an increase of 80,000 bins received and processed from 2018 to 2022, peaking at over 360,000 bins for the 2022 season.
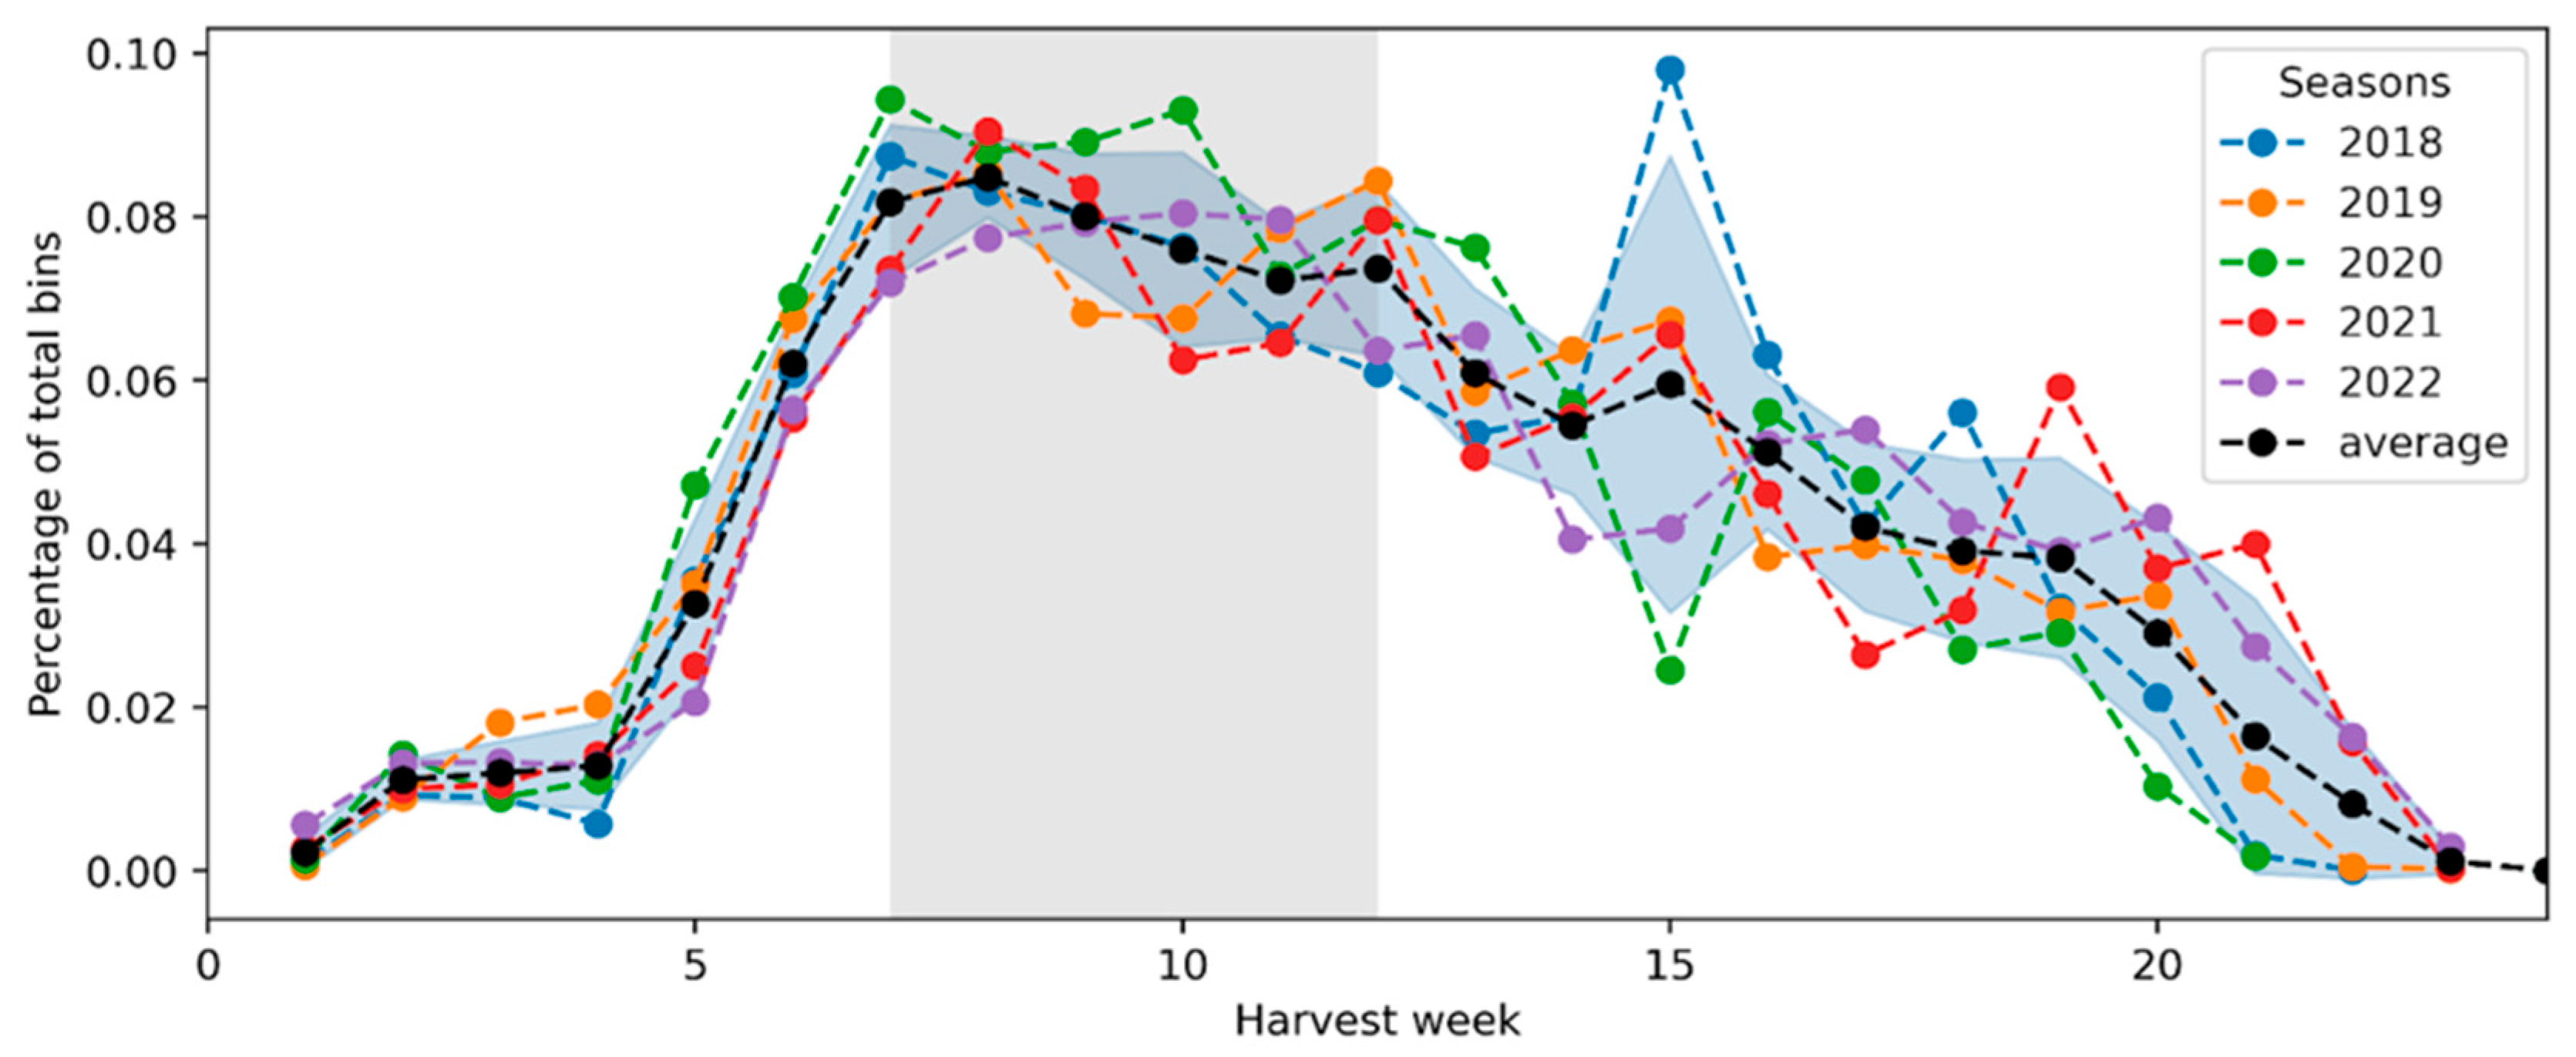
Figure 1 illustrates the percentage of total volume of bins received weekly across the five-year period from week one to week 25 (January to end of June) of a given year.
Harvest volumes peak between weeks 7 and 11 (February to early March), represented by the grey area. This is further supported by the calculated standard deviation represented by the blue shaded area on the graph. The standard deviation measures by what degree the annual percentages deviate from the mean value (indicated by the black line). A higher standard deviation, as seen in week 15 for the 2018 and 2020 seasons, indicates higher variability in the data, which could be attributed to factors such as late harvest, environmental conditions, or, as is the case with the 2020 season, the international COVID-19 pandemic affecting Company X’s operations. During the peak harvest time (week 7 to 11), it is estimated that Company X needs to reach a bin turnover of 1.5 times per bin to maintain efficient operational flow.
Although the focus of this study is an in-depth analysis of Company X’s 2022 season, providing a snapshot of events at a certain period in time, this figure is crucial to emphasise the pressure placed on cold chain infrastructure during peak harvest periods. Pressures align with challenges such as throughput efficiency, processing delays, and high pulp temperatures due to prolonged exposure to higher ambient temperatures.
4.2. Key Insights from Key Company X Personnel
To contextualise the quantitative results and better understand the operational dynamics contributing to cold chain inefficiencies, semi-structured interviews were conducted with key personnel across Company X’s departments, including quality control, cold storage, and packhouse operations.
Communication breakdown and lack of departmental coordination were highlighted by multiple employees as significant contributors to cold chain inefficiencies. Fruit is often released from cold storage prematurely or processed without ensuring downstream capacity, leading to prolonged ambient exposure and pulp temperature increases. It is further noted that decision-making at supervisory levels was inconsistent, particularly during peak harvest and processing periods, and that best practice measures such as moving fruit back to cold storage during packhouse breakdowns were rarely implemented due to time or staffing constraints. The areas with the highest fluctuation in fruit pulp temperatures occur between when fruit is taken out of cold storage/pre-cooling during the packing process and final re-cooling of palletised fruit.
Despite these challenges, several improvements were introduced to address the inefficiencies identified above. These included the appointment of floor managers to oversee specific cold chain areas, the use of handheld barcode scanners for real-time tracking of bins and pallets, and the hiring of a continuous improvement manager who identifies bottlenecks and streamlines throughput. Respondents acknowledged that while these interventions improved accountability and traceability, their effectiveness was still limited by systemic delays and resource constraints—such as insufficient forklifts, inadequate infrastructure, and limited cold room capacity. The information gathered from the interviews confirmed that while protocols and quality standards existed on paper, ensuring consistent implementation under operational pressure remained a fundamental gap in preserving temperature integrity and fruit quality across the supply chain.
4.3. Lead Time Analyses per Cold Chain Stage
Lead time analyses were conducted on the processing and coordination of cold chain activities from fruit arrival to loading for market, identifying whether standard protocols were adhered to. Areas where inefficiencies were incurred are highlighted, along with their effect on the quality of the fruit.
During analyses it was evident that, apart from cold storage time protocols and a 30 min loading-for-market time, no other time protocols for or between the different stages existed. In consultation with Company X, lead time analyses were capped at 24 h, as any processing of fruit (apart from cold storage) beyond that timeframe is unacceptable and has a detrimental effect on fruit quality. By excluding these outliers, focus can be placed on identifying common patterns and trends found during the normal processing of fruit. To provide insightful results, an in-depth analysis was conducted by dividing (and subdividing) Company X’s cold chain stages into the following categories:
- (1)
Weighbridge to Pre-cooling
- (2)
Cold Storage/Pre-cooling to Packhouse
- (3)
Packhouse to Re-cooling
- (4)
Re-cooling to Loading for Market
4.3.1. Weighbridge to Loaded-into-Pre-Cooling
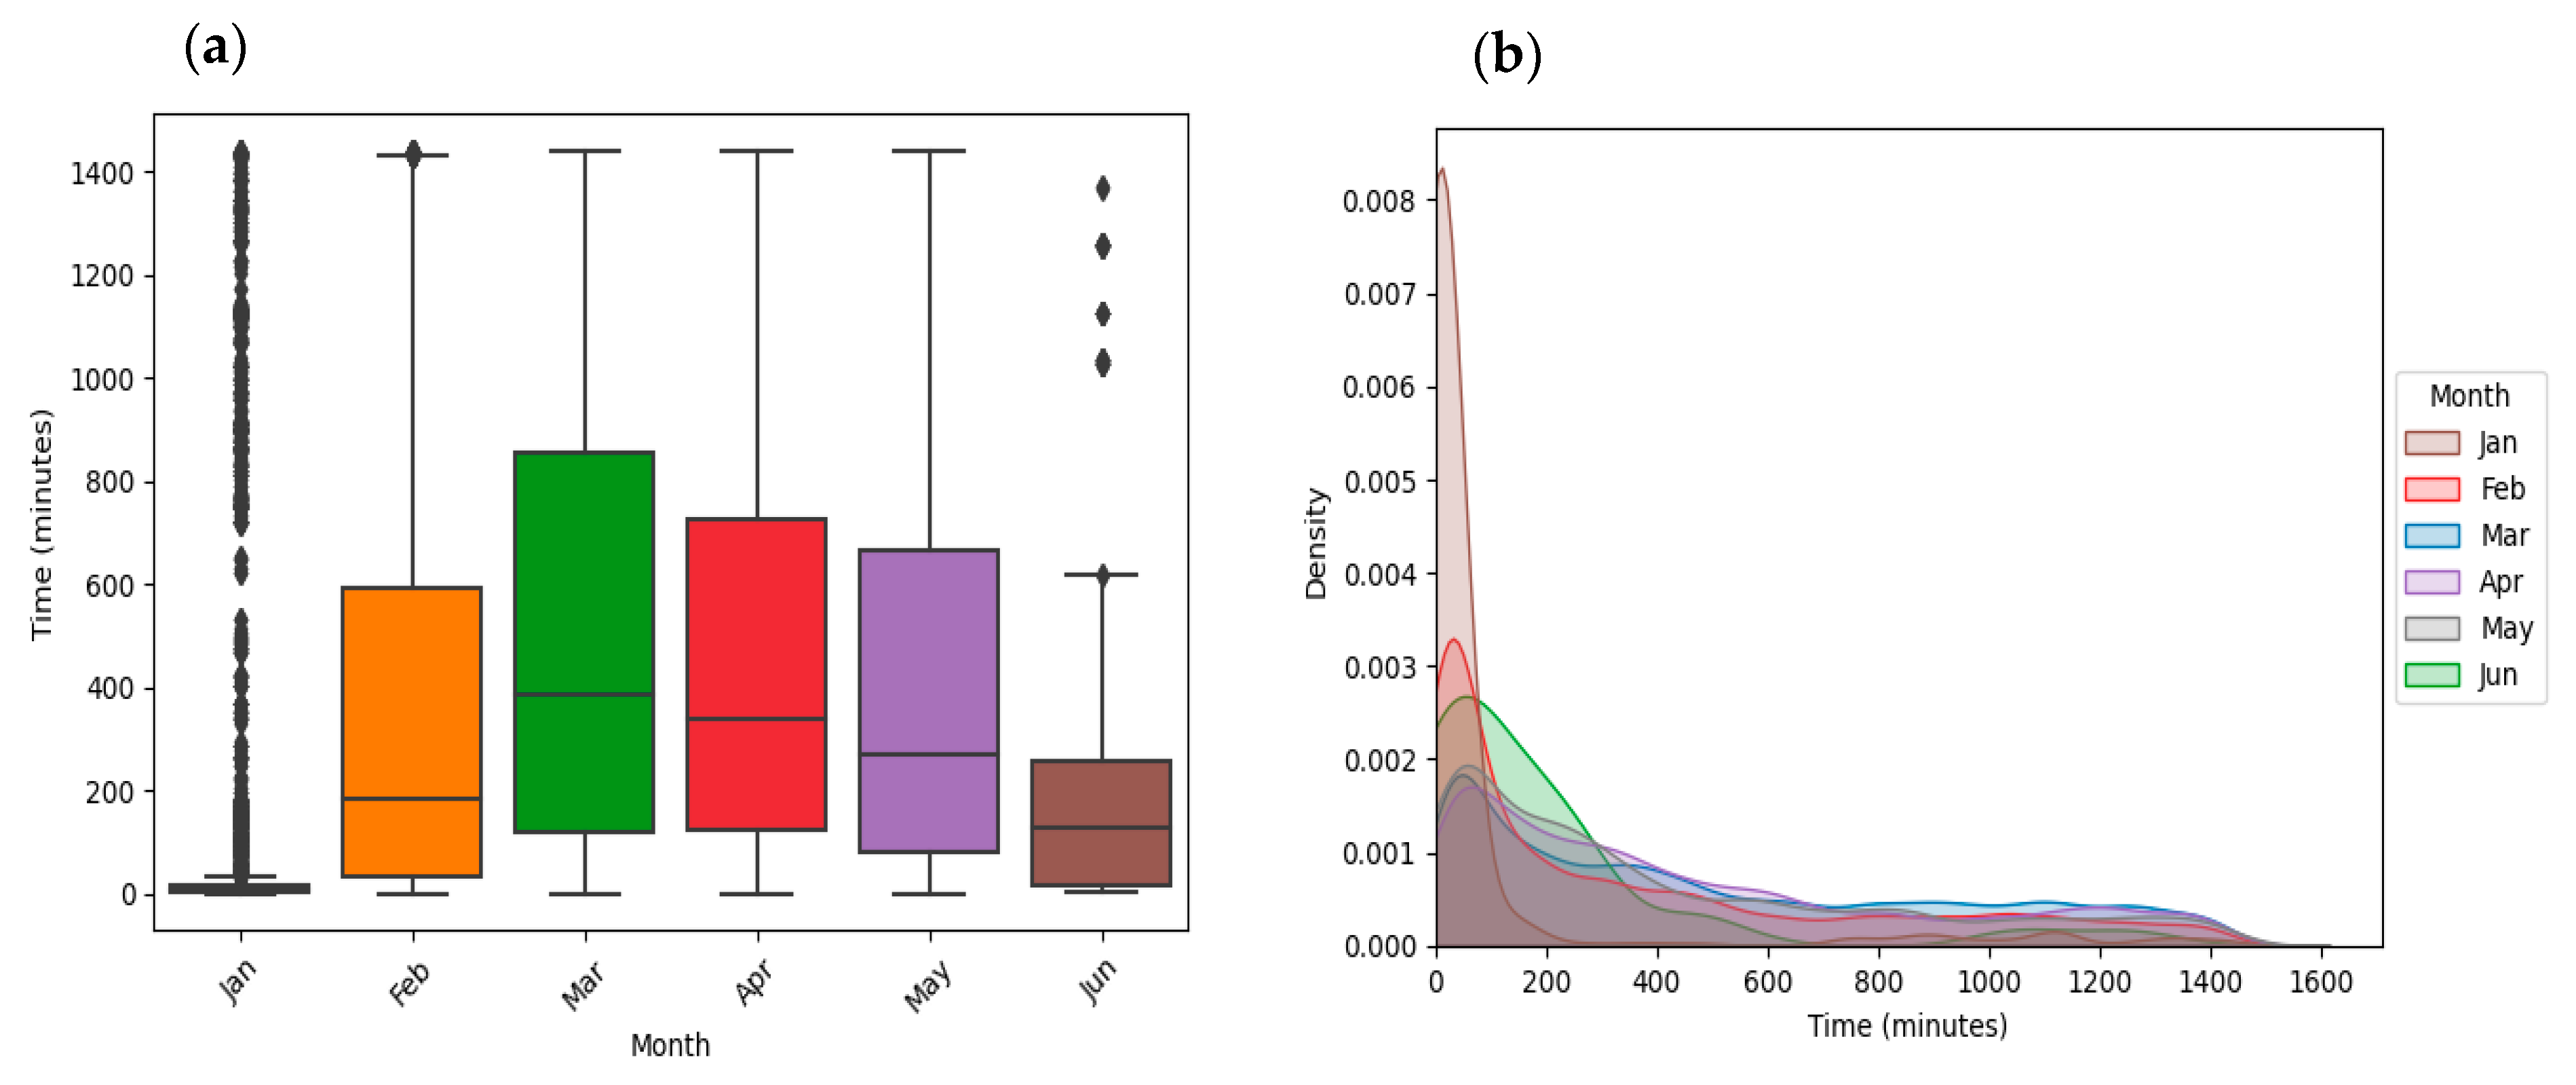
Significant delays were observed in the transition between bin placement outside cold storage and their eventual intake into pre-cooling facilities, particularly during peak harvest periods. To avoid truck congestion in the facility during high afternoon intake volumes, trucks would offload bins that were often left stacked in ambient conditions for extended periods before being placed into pre-cooling facilities. The analysis showed an average lead time for this transition for 425 min (roughly 7 h), with an interquartile range (representing the middle 50% of lead times) of 665 min, whilst outliers exceeded 11 h of exposure.
Figure 2a illustrates monthly variability in these delays, with a clear seasonal pattern of increased IQR and median values observed. Notably, the distribution of lead time is right-skewed with the median located closer to the first quartile (Q1), representing some fast-moving bins, but with a long upper tail, indicating significant lead times for others. To further enhance the data,
Figure 2b, a Kernel Density Estimation (KDE) plot, illustrates the probability distribution of lead times for this stage across all varieties. A log normal distribution with a distinct unimodal shape (central tendency surrounding the median) is observed, indicating a high density of measures falling within the first 200 min followed by a long tail towards the right. This reflects inconsistencies in the handling of fruit at the pre-cooling facilities, with some bins experiencing low lead times, whilst others are high, highlighting the operational pressure experienced during peak harvest periods.
Variety-specific analysis reveals the severity of these delays.
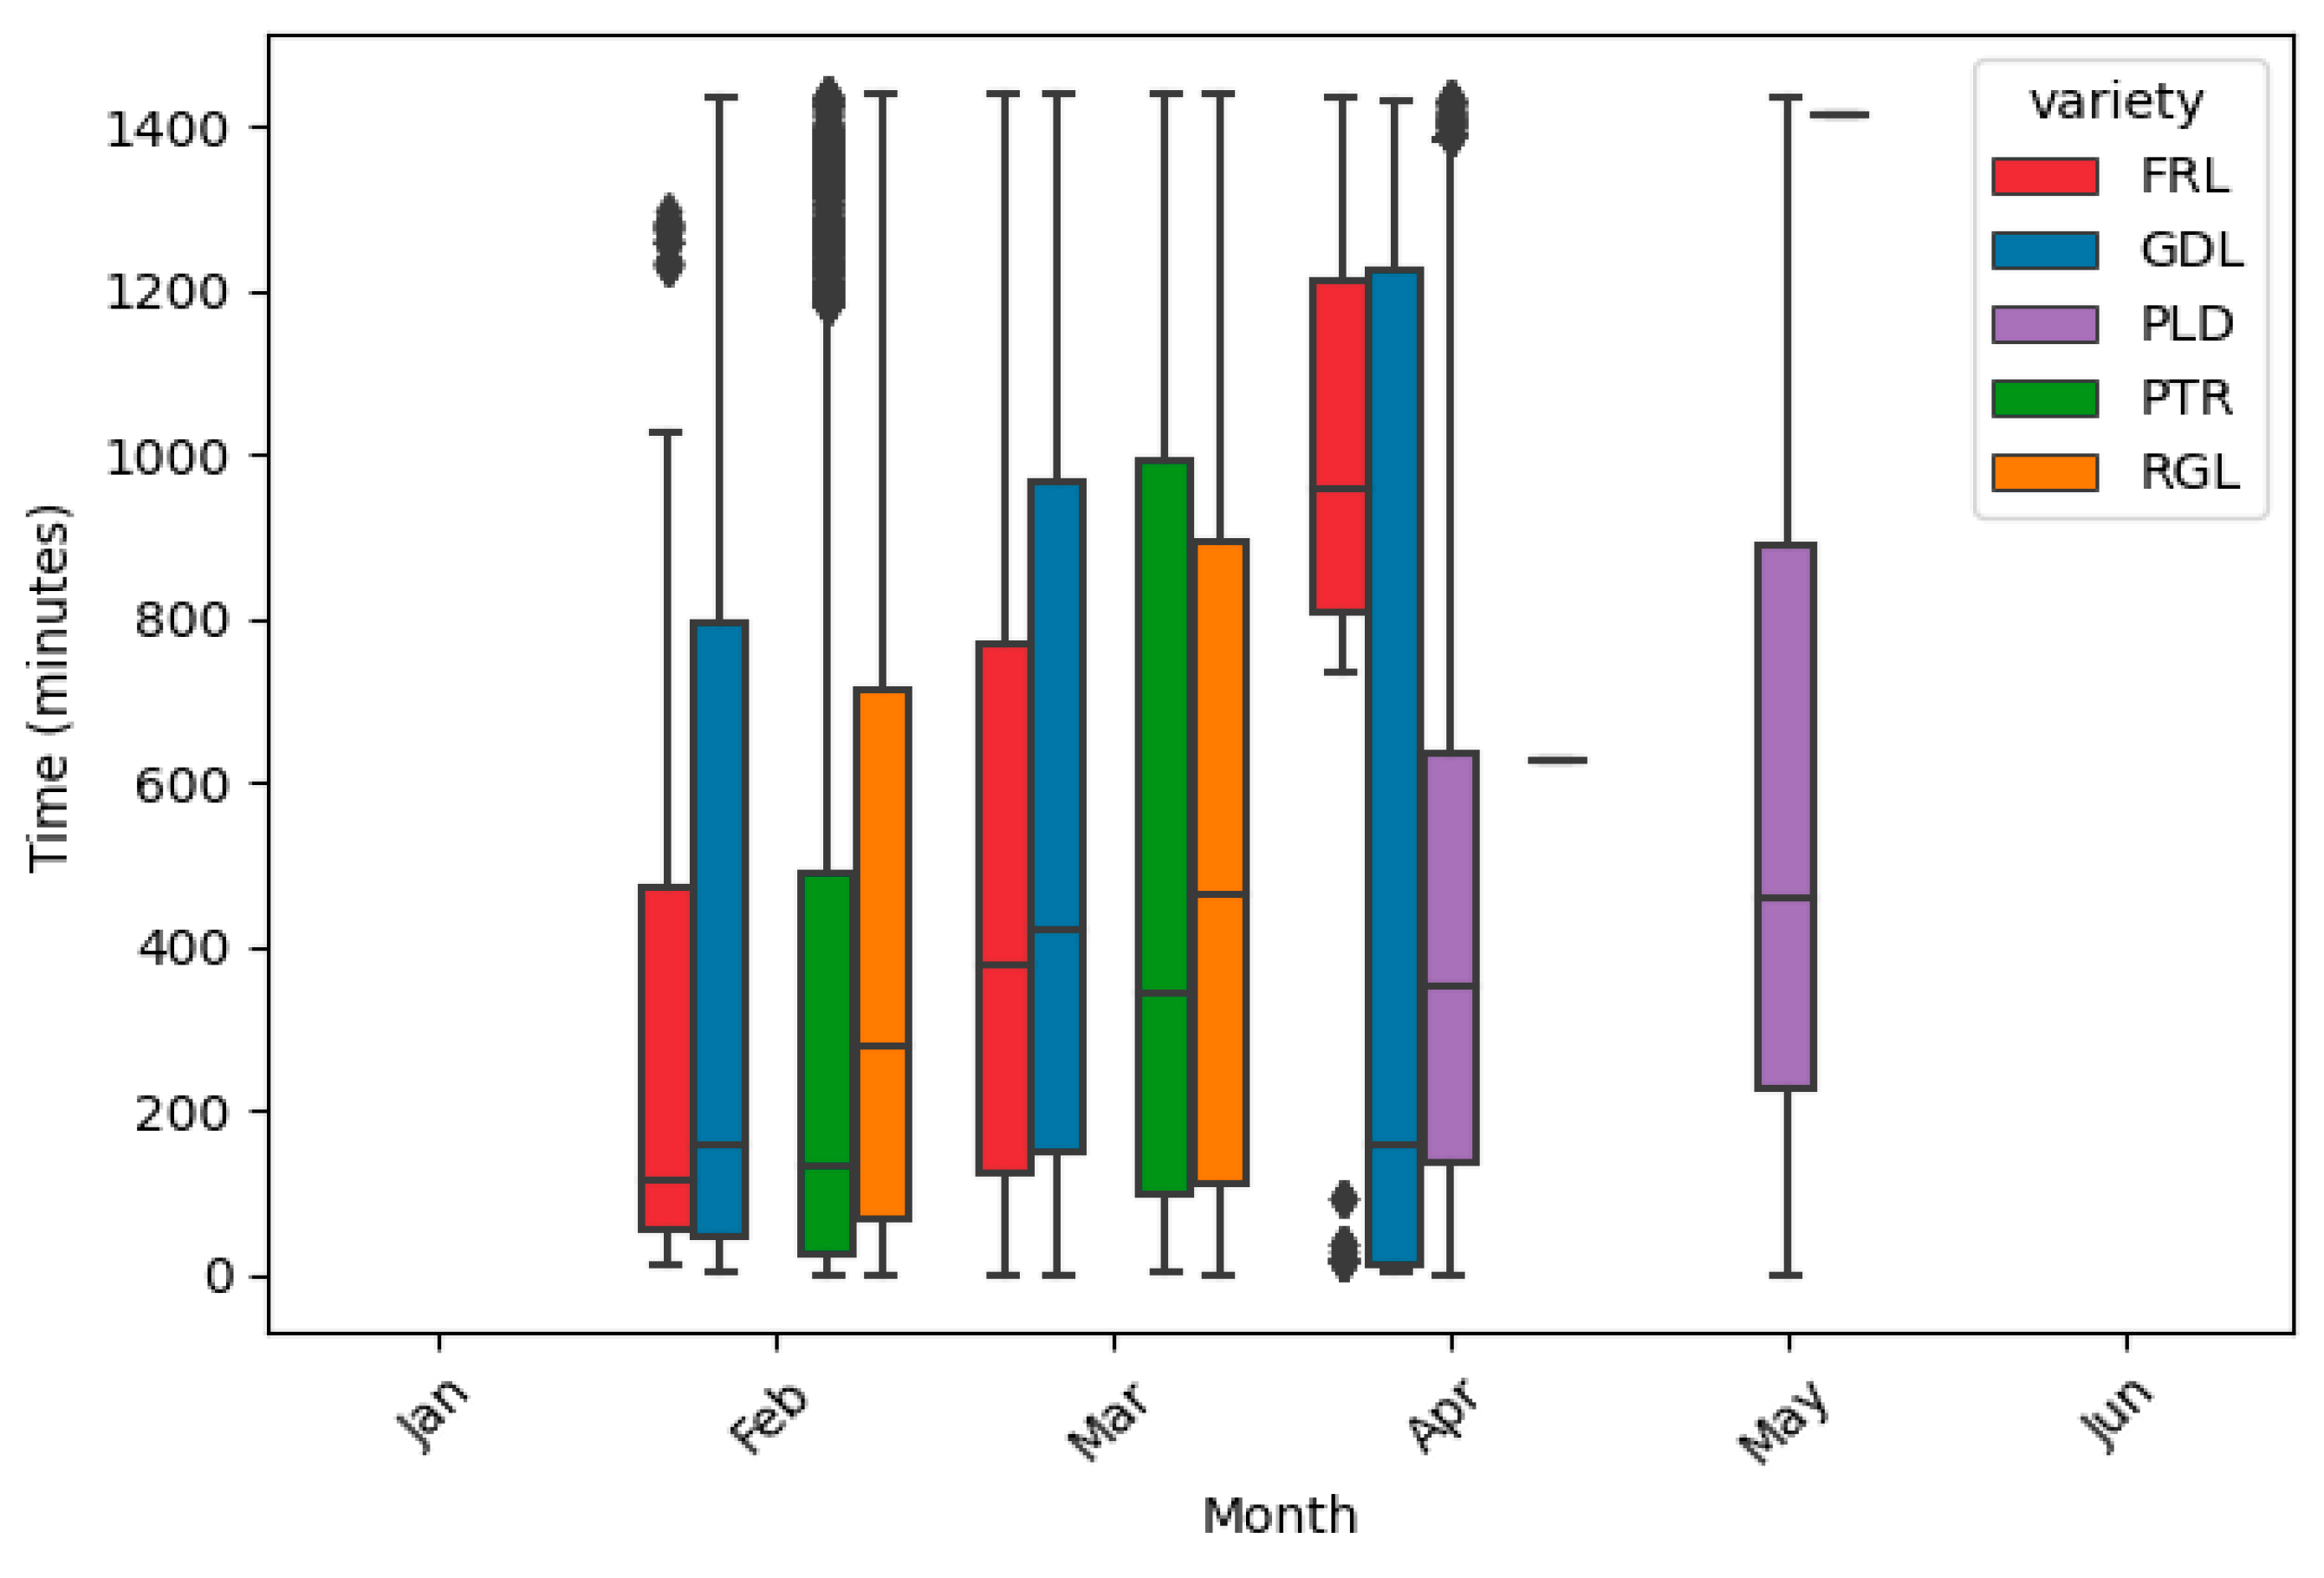
Figure 3 demonstrates that Forelle (FRL) bins experienced delays of up to 960 min during April, while Golden Delicious (GDL) showed the most extreme variability, with delays frequently exceeding 1200 min. Both Royal Gala (RGL) and Packham’s Triumph (PTR) exhibited substantial processing delays, with median wait times and interquartile ranges increasing markedly between February and March. Pink Lady (PLD) proved the exception, achieving relatively faster processing times due to reduced intake volumes during its later harvest window, which created less operational congestion.
High logistical congestion during the intake of bins into pre-cooling, despite Company X’s efforts to stack bins in shaded areas as much as possible, poses a significant risk to pulp temperature compliance and fruit quality. High bin volumes and sun exposure during prolonged waiting times lead to increased pulp temperature, increased respiration, moisture loss, and quality degradation.
Figure 2a and
Figure 3 show predominately right-skewed distributions with a median close to operational targets, but long tails, indicating delays exceeding acceptable thresholds. From a fruit quality perspective, this means that every additional hour before pre-cooling commences is an increase in pulp temperatures, respiration rates, and development of latent defects. These distributions are especially important for logistics and operations managers, as they highlight congestion areas and underline the need for improved scheduling or slot booking during peak harvest weeks. In addition, the visualisations signal where resources like forklifts and labour should be placed to reduce bottlenecks.
4.3.2. Cold Storage/Pre-Cooling to Packhouse
Once fruit is removed from pre-cooling/long term storage, bins are stacked outside or directly onto a tractor-trailer to be transported to the nearby packhouse for processing. Analyses showed short lead times for this section of the chain with a median lead time of 8 min. This short lead time would have minimal effects on fruit pulp temperature and was therefore not investigated further.
4.3.3. Packhouse to Re-Cooling
This vital stage of Company X’s operations is divided into two sub-stages: (1) Processing to Palletisation; and (2) Palletisation to Re-cooling Intake.
- (1)
Processing (bins tipped) to Palletisation:
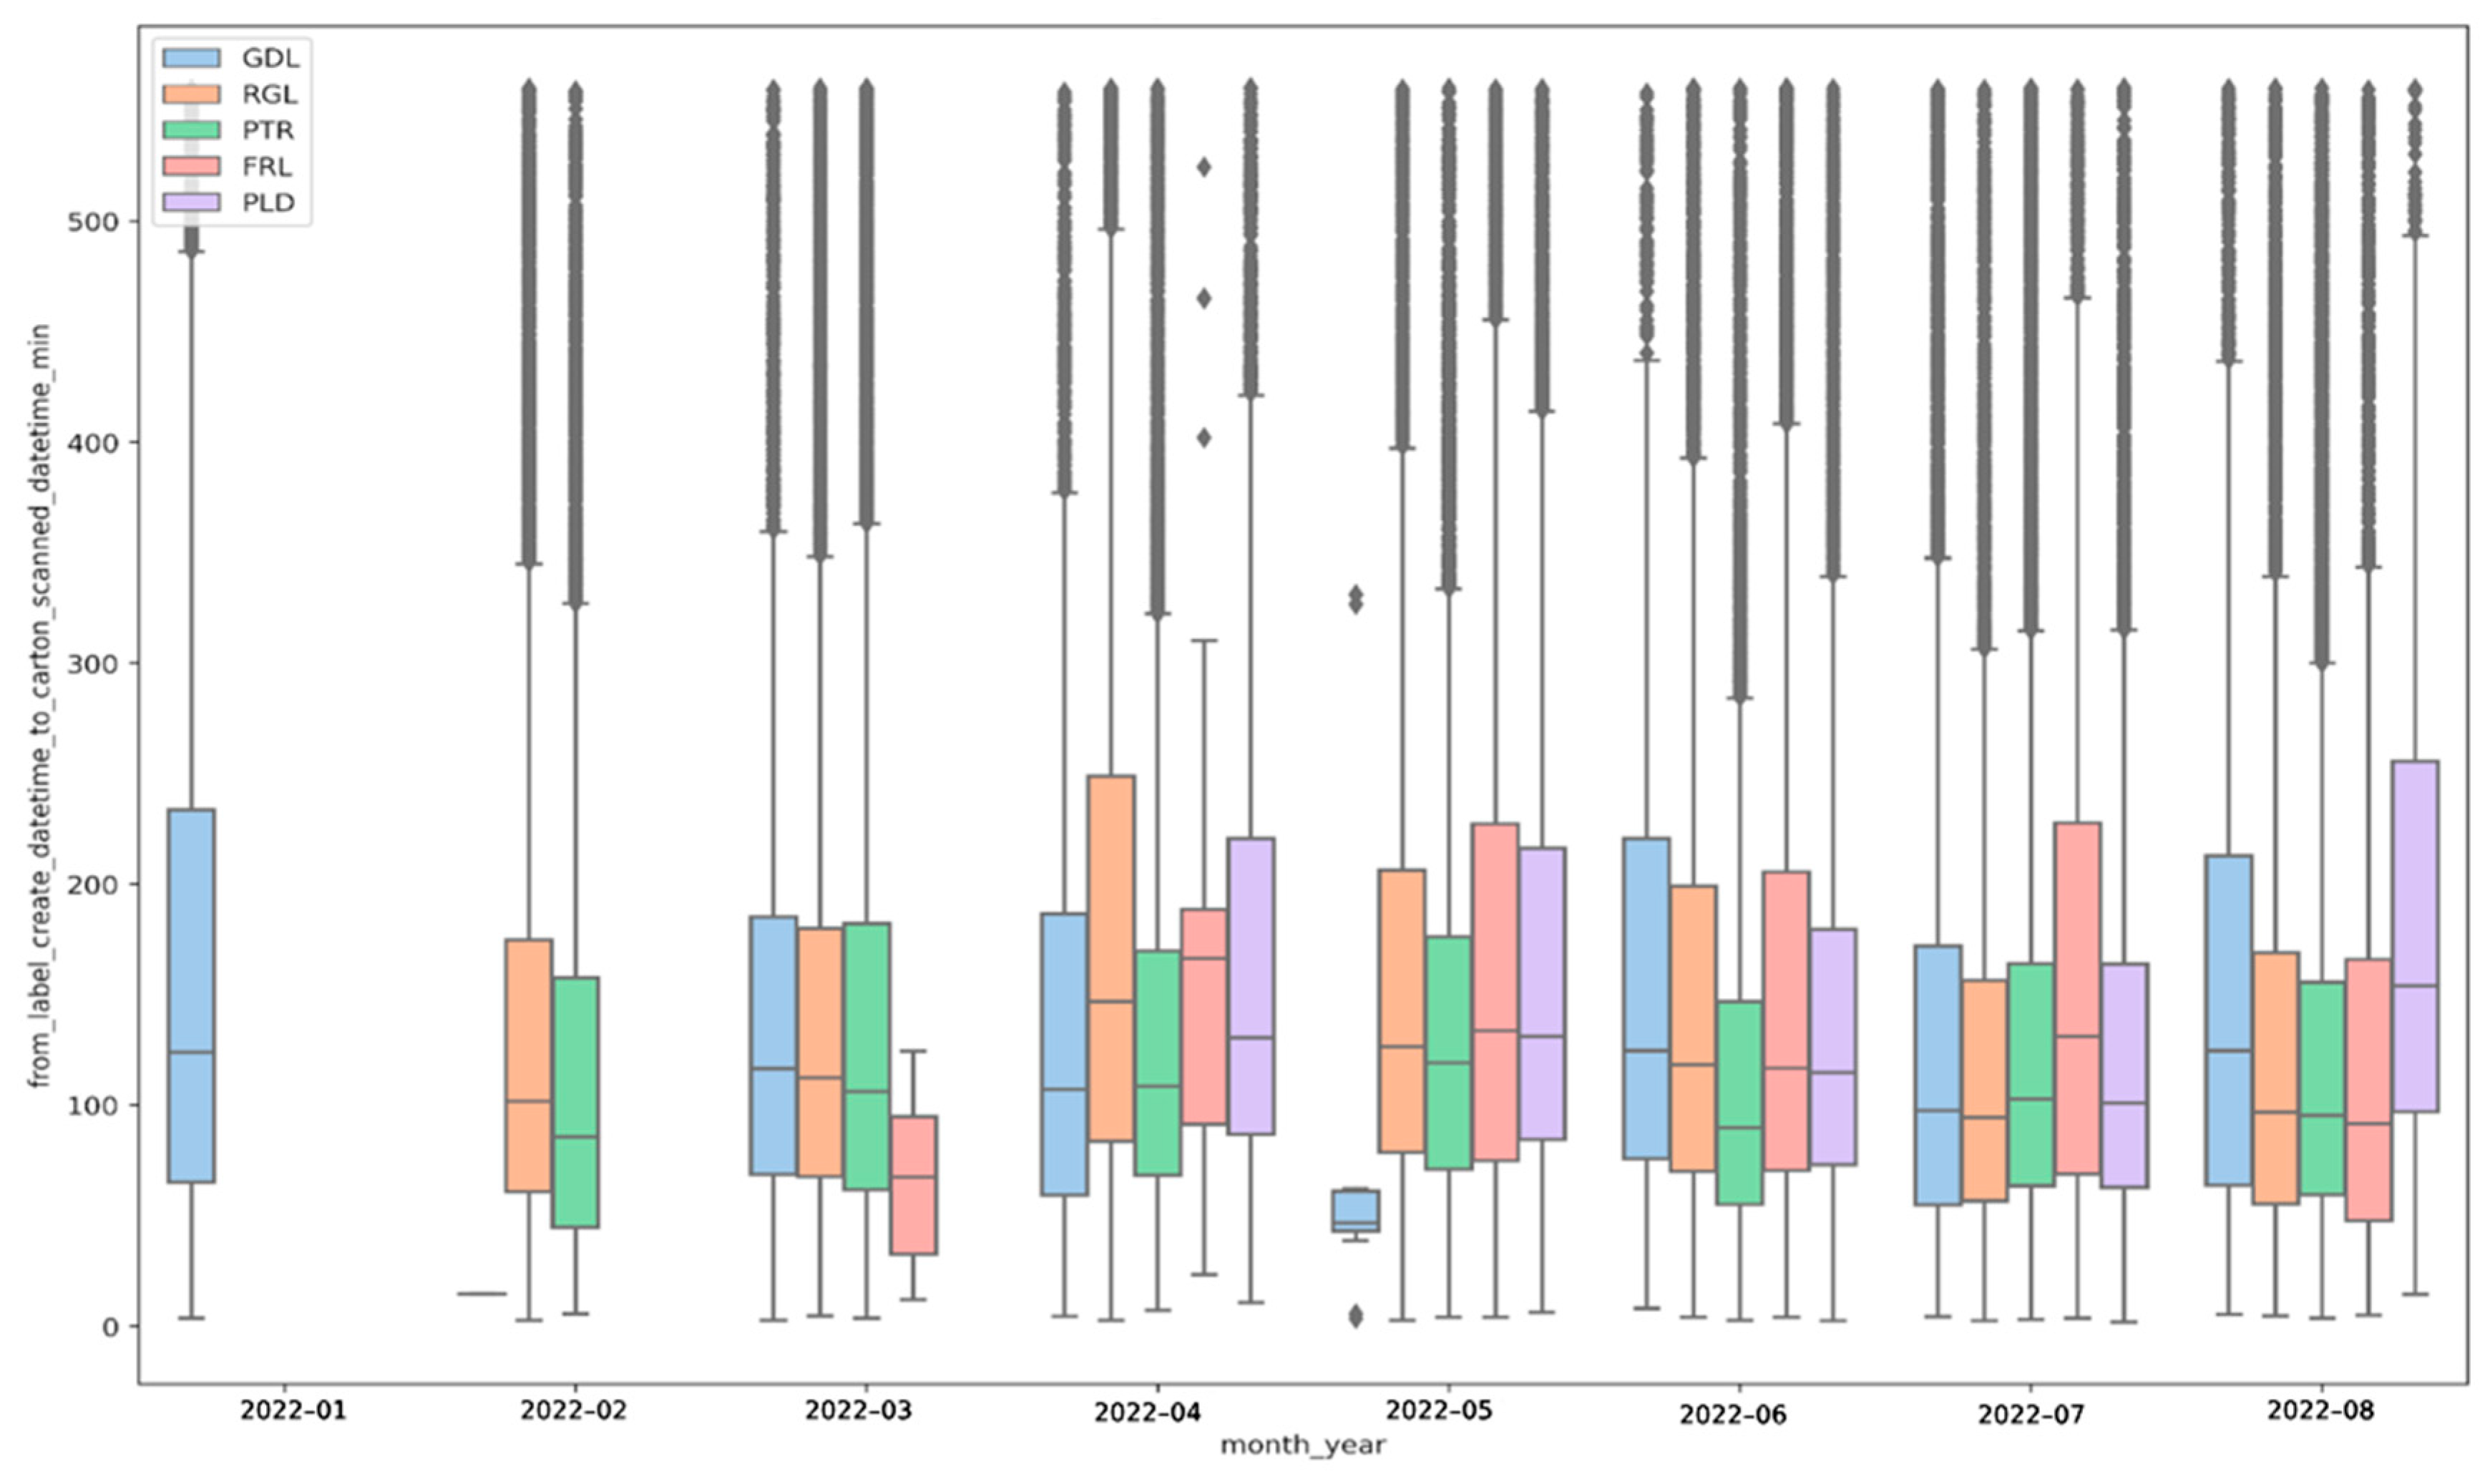
The analysis of lead times from January to August 2022, as seen in
Figure 4, illustrates important seasonal trends observed across the five varieties. Most of the monthly boxplots are right-skewed, indicating longer lead times being classified as outliers/deviations from the norm, with a median lead time of 110 min across all varieties. Outliers extended to 600 min during peak months. RGL demonstrates a pronounced spike during April, coinciding with Company X’s peak harvest period. The median RGL increases by 146 min while variability also intensifies, shown by the interquartile range widening by 165 min. Both metrics normalise in the following months as harvest operations wind down.
GDL exhibits considerable volatility in both median and IQR throughout the year, with peaks in January, June, and August, reflecting variation in packing volumes. PLD’s lead times remain relatively stable, although a peak of 155 min is observed in the month of August. PTR consistently shows the lowest and most reliable lead times, though an unusual spike in May reflects a higher median of 120 min versus its IQR of 105 min. FRL follows a similar pattern in March and April, with a particularly high median of 166 min in April, classifying this month as being left skewed. As the data is more densely concentrated around the upper quartile of the boxplot, longer average lead times were experienced.
Seasonal variability explains the absence of certain varieties in specific months. The presence of outliers and high upper whiskers during peak processing months (May to August) highlights increased measurements, resulting in reduced data and distribution variability. On the other hand, this increased operational pressure within the packhouses resulted in higher operational inefficiencies and longer processing lead times. Although the majority of bins returned to cold storage within acceptable timeframes, as can be seen in
Figure 4, fruit remaining outside storage temperatures experiences high respiration levels and accelerated softening. These trends indicate that whilst varieties like PTR remained relatively constant throughout the 2022 season, other varieties such as GDL and FRL experienced significant delays and inefficiencies during peak harvest and processing times.
- (2)
Palletisation to Re-cooling Intake
Once fruit is sorted, graded, boxed, and palletised, it awaits inspection from a PPECB officer before being cleared to be stored in the re-cooling facilities.
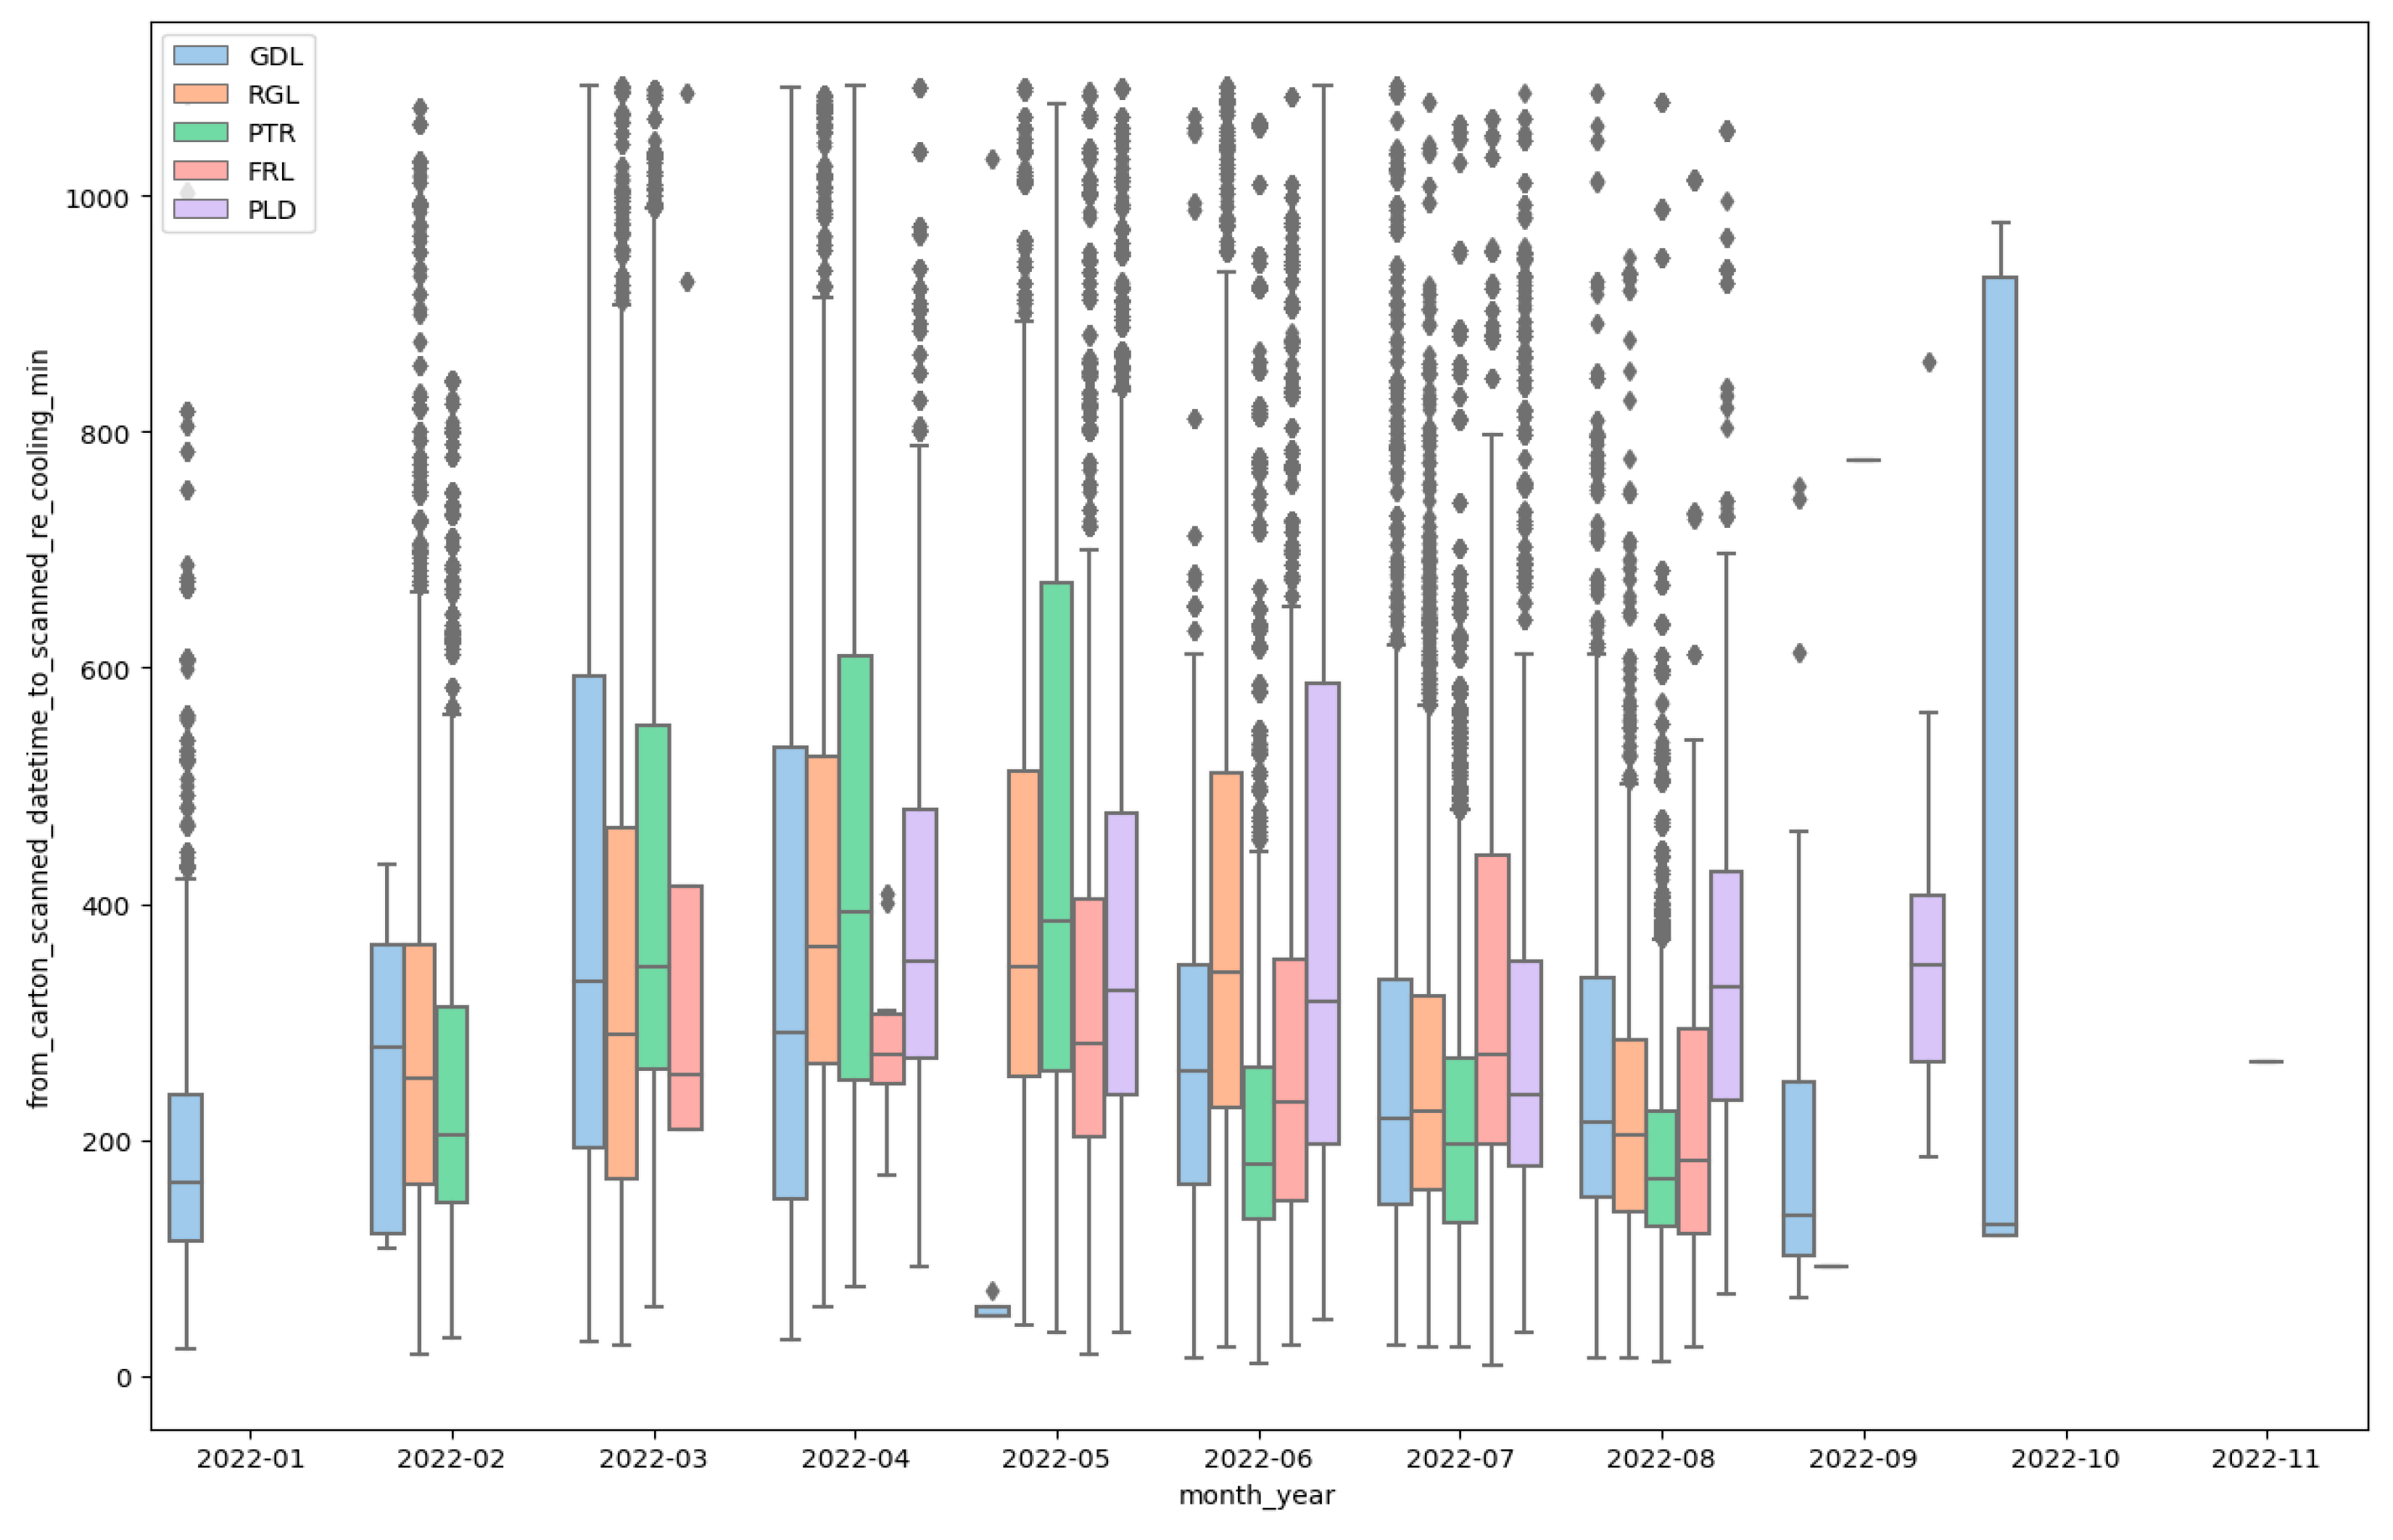
Figure 5 illustrates monthly lead times from when pallets are scanned at the packhouse until they are scanned into the re-cooling facilities. The average median lead time across the varieties for the analysed months was 267 min, with outliers reaching above the capped threshold of 1200 min—more than 20 h exposed to higher ambient temperatures. It is further evident that significant variability, with distinct differences in peak and off-peak seasons, exist across the five fruit varieties.
RGL shows its highest median lead time in April at 364 min, with increased values continuing into June, while its IQR peaks in March, indicating increased variability. PLD peaks in March and September with a median of 350 min, whilst experiencing an IQR in June of 390 min. GDL exhibits the greatest variability, with the widest IQR across all varieties, months, and stages of over 800 min in October. Further fluctuations throughout the year are likely due to inconsistent packing schedules and smaller sample sizes outside the peak seasons. FRL peaks in April and May with median lead times of 273 and 282 min, respectively, and shows increasing IQRs in July. PTR consistently maintains higher medians and IQRs year-round, peaking at 390 min in April and May, and reaching its widest IQR in July.
The boxplot analysis reveals consistent patterns across all varieties and months: distributions are predominantly right-skewed with medians positioned closer to the first quartile, with extended upper whiskers and frequent outliers indicating occasional extreme delays. This stage represents the most prolonged and unpredictable component of Company X’s cold chain, with delays exhibiting both the highest magnitude and greatest variability. From
Figure 5 it is evident that outbound scheduling and internal logistics (pallet staging and forklift allocation) are not synchronised, leading to detrimental bottlenecks at this processing stage. The extended re-cooling delays identify risk windows for QC specialists where pulp temperatures rise, which directly correlates with firmness loss and likely downgrades of Class 1 fruit. These quantitative findings corroborate stakeholder interview responses identifying palletisation to re-cooling as the most operationally challenging phase of the process.
4.4. Temperature Analyses per Cold Chain Stage
Given the climacteric nature of pome fruit, temperature has a direct impact on the preservation of its quality and as such needs to be optimally managed throughout the cold chain to prolong the fruit’s shelf life. To do this, temperature protocols are put in place. Temperature protocols implemented by Company X, in alignment with those of the PPECB, exist for each stage and are used as a benchmark to assess whether pulp temperatures were optimally maintained:
Cold Store Out (Cold storage/Pre-cooling to Packhouse) ≤ −0.5 °C
Infeed (Packhouse to Re-cooling) ≤ 3 °C
Sorting Table and Packing (Packhouse to Re-cooling) ≤ 10 °C
Dispatch (Packhouse to Re-cooling) ≤ 12 °C
Cold Store In (Packhouse to Re-cooling) ≤ 15 °C
Analysis of the 2022 temperature trials revealed variations in sample sizes across different fruit varieties; to maintain consistency and avoid skewed results, all temperature data across all varieties were analysed collectively. Inferences were then drawn specifically for the top five fruit varieties, linking the temperature data to logistical processes and lead times experienced.
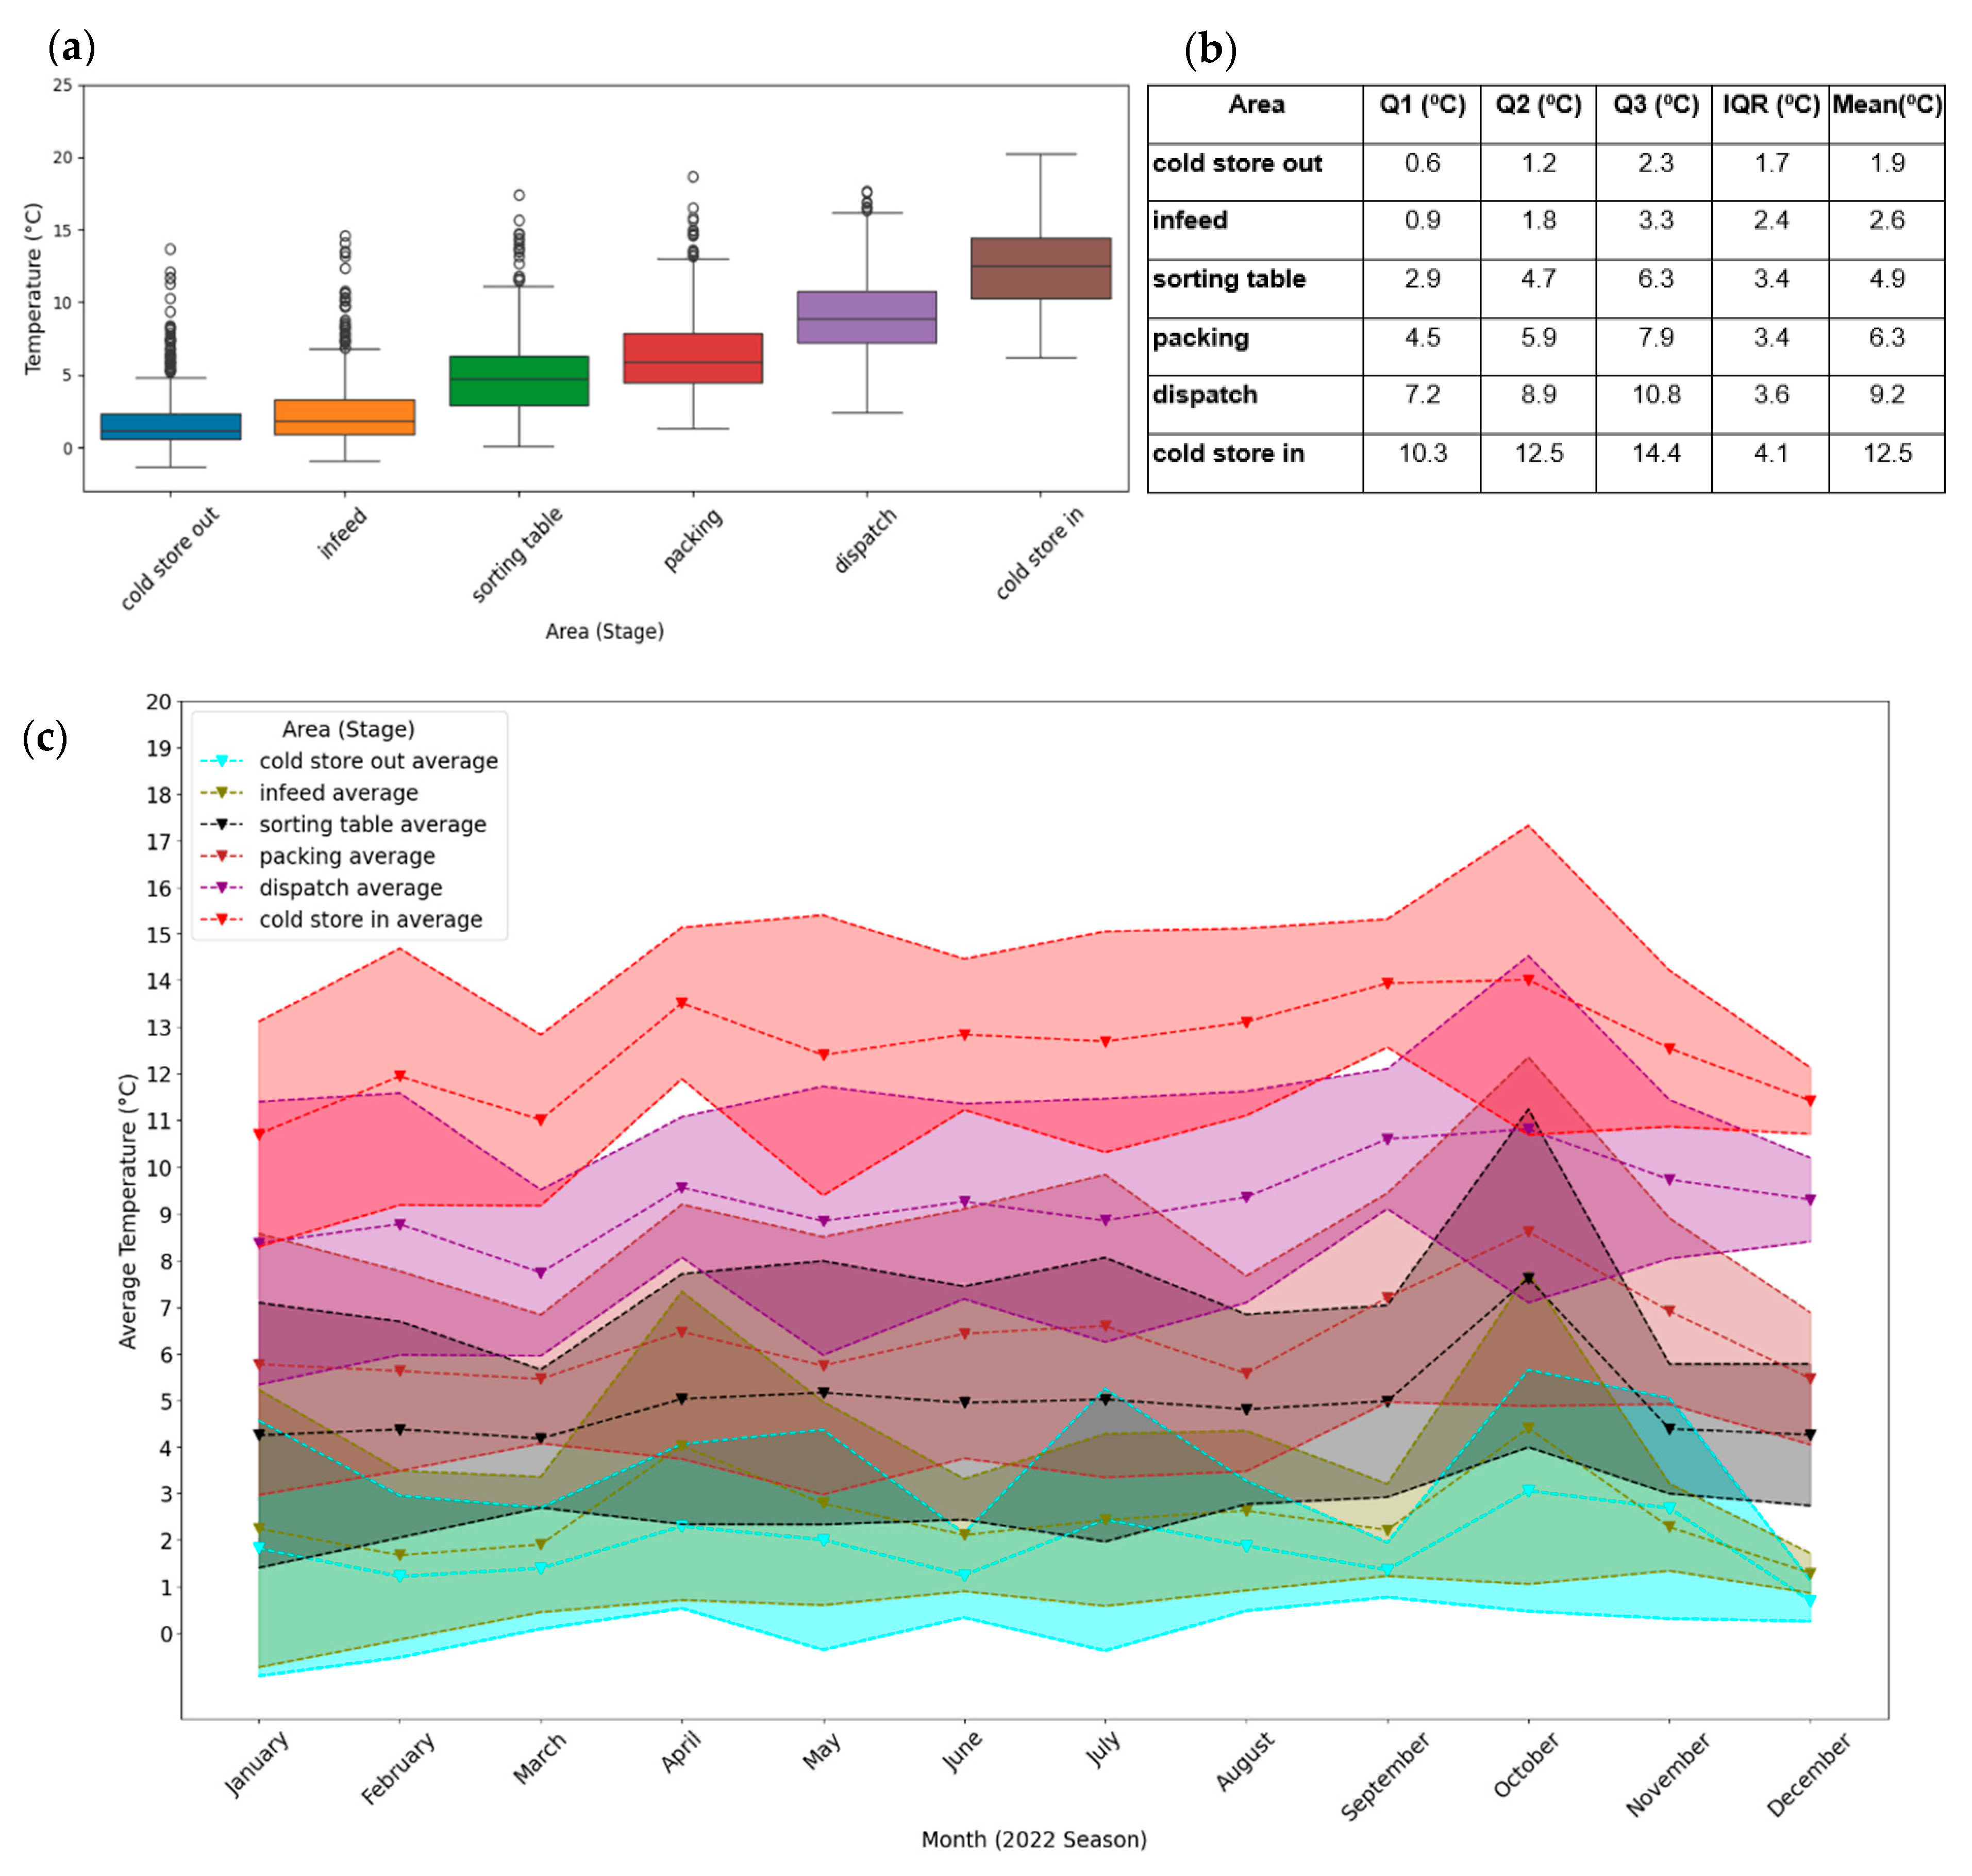
Figure 6a illustrates the progressive increase in pulp temperature across the various stages and is used in conjunction with
Figure 6b to quantify the temperature readings at each stage. The boxplots for the ‘cold store out’ to ‘dispatch’ areas are right-skewed with numerous high temperature outliers found beyond the upper whiskers. For the ‘cold store in’ stage, however, the distribution is left skewed, indicating a bigger frequency of higher pulp temperatures recorded for this area. Furthermore, the IQR data within the ‘dispatch’ and ‘cold store in’ stages are relatively evenly dispersed. Notably, the pulp temperature increases as fruit moves between intake and handling stages before re-entering cold storage. The data signals possible interventions such as investment in extended shaded intake bays, especially for areas where the majority of the congestion occurs.
Notably, the median temperature at ‘cold store out’ was 1.2 °C, with an IQR of 1.7 °C, indicating that half the fruit exited pre-cooling with pulp temperatures between 0.6 °C and 2.3 °C. This points to inconsistencies in the pre-cooling process that can be attributed to the long lead times of fruit arrival at the facility until placed into pre-cooling (an IQR of 11 h). In addition, insufficient pre-cooling practices together with shorter storage durations due to peak harvest pressures, can result in incomplete field heat removal. Consequently, the pulp temperature profiles, across the 2022 season trials conducted, shows that the pre-cooling protocol temperatures of −0.5 °C were rarely met.
Overall, the fruit experienced a median pulp temperature increase of 11.3 °C and a mean increase of 10.5 °C across the six stages, highlighting consistent heat gain due to prolonged exposure to higher ambient temperatures. The most significant increase occurred between ‘dispatch’ and ‘cold store in’, where the median temperature peaked at 12.5 °C with an IQR of 4.1 °C—the highest across all stages. This significant increase in temperature coincides with the extensive median lead times of over 4 h between palletisation and re-cooling intake.
Figure 6a,b further highlight incidents above prescribed temperature ranges experienced, for example >2 °C for more than 90 min, leading to detrimental physiological effects on the fruit. This means a higher probability of Class 1 downgrades and visible defects.
Seasonal pressures during peak harvest and processing periods further intensify cold chain inefficiencies. As seen in
Figure 6c, the highest monthly pulp temperature increases are observed from March to April (peak harvest) and September to October (the release of most long-term storage fruit), when temperature spikes of nearly 13 °C were recorded. This is closely followed by the June and August temperature spikes of 12.4 °C and 12.3 °C, respectively. The shaded areas around each stage are the standard deviation temperatures of the fruit—the higher the deviation, the higher the variability in the data.
The peaks observed in
Figure 6c align with increased fruit volumes and longer lead times, such as bins waiting for up to 7 h outside cold storage before pre-cooling, processing delays of up to 600 min during peak packing, and prolonged palletisation-to-re-cooling lead times exceeding 4 h. Underlying these delays are infrastructural and operational constraints, including limited pallet tracking, manual labelling for exports, delayed quality checks, and reduced oversight during night shifts, as confirmed during Company X observations and interviews. These vulnerabilities result in packed fruit remaining in ambient conditions for extended periods, particularly affecting temperature-sensitive varieties like Royal Gala, Golden Delicious, and Pink Lady.
Not only are volumes highest during peak seasons, but these are also the times when the cooling capacity is reaching its limits. The monthly patterns displayed in
Figure 6c suggest the need for logistics managers to implement peak season contingency plans such as staggered deliveries and maximising equipment reliability during March, April, and October. This seasonal trend further highlights where QC specialists should intensify firmness and temperature monitoring to catch early signs of quality deterioration.
4.5. Logistical Operations Performed
Company X’s logistical operations reveal systemic inefficiencies that compromise cold chain integrity, especially during peak harvest and processing periods. While certain practices—such as maturity assessments at weighbridge and packhouse intake, the use of automated palletisation, and pre-cooled airlock bays—enhance process efficiency, these are often undermined by infrastructure limitations, poor coordination, and reactive management.
From truck arrival to market loading, bins and pallets are frequently exposed to ambient conditions due to delays in pre-cooling, forklift shortages, cold room bottlenecks, and communication breakdowns between the different stages. Notably, bins are often left in sunlight at intake areas, cold room doors remain open during loading, and manual interventions like export sticker protocols require repacking in non-cooled areas. Seasonal congestion intensifies these vulnerabilities, leading to truck queues, pallet backlogs, and extensive re-cooling delays. Furthermore, the lack of pulp temperature measurements upon weighbridge arrival and insufficient contingency planning during equipment breakdowns expose fruit to heat gain. These findings underscore the critical need for improved process flow, real-time temperature monitoring across all stages, and enhanced coordination between departments to optimally utilise available infrastructure and ultimately preserve fruit quality and meet export standards.
4.6. Quality and Maturity Analyses
Maturity index (MI) measurements were conducted at two key points: (1) upon arrival at the weighbridge, and (2) during processing at the packhouse. Fruit maturity plays a critical role in classification for storage type (RA or CA) and market allocation (Class 1, 2, or juicing). A total of 30 fruit samples per bin (10 large, 10 medium, and 10 small) are tested for firmness (kg), Brix (%), and starch (apples only), with averages calculated per variety and harvest week. To assess quality degradation between the weighbridge and packhouse, the firmness measurements are compared, as the measurements performed at the packhouse only consist of firmness tests.
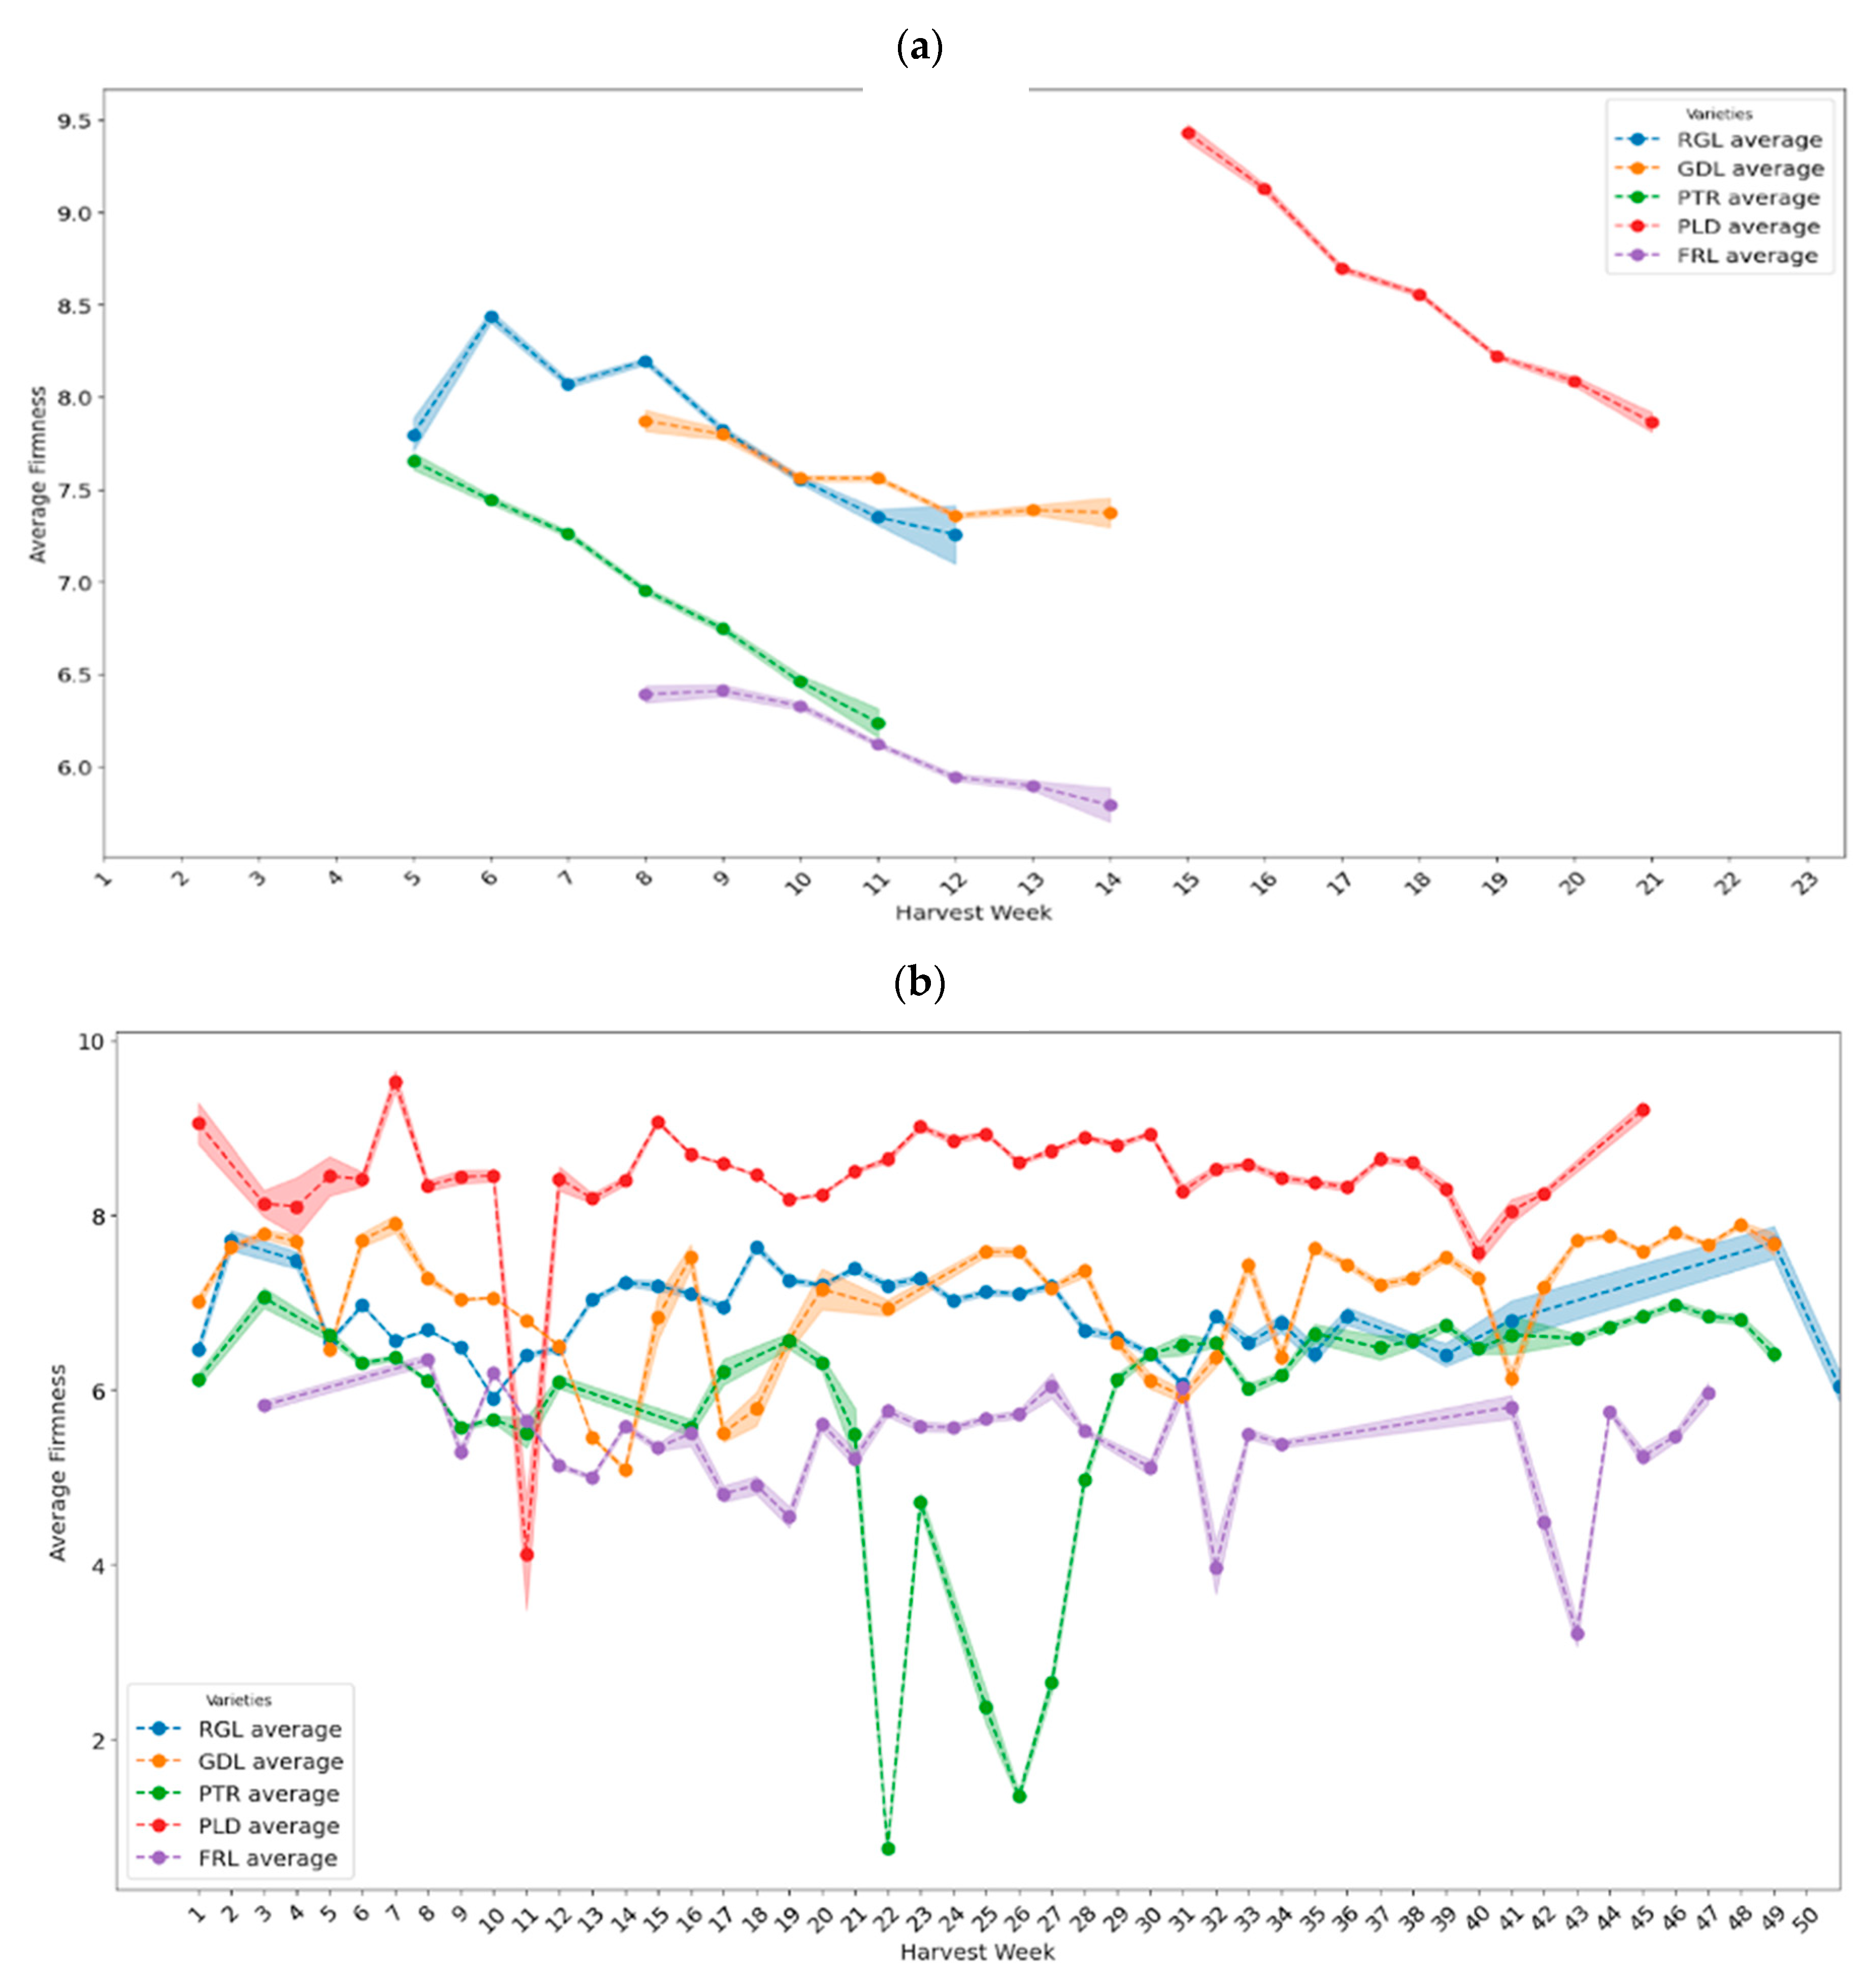
Figure 7a shows a clear decline in fruit firmness across all five varieties during their respective harvest seasons. RGL exhibited the highest variability in firmness, peaking at 8.4 kg in week 6, with large standard deviations (up to 1.4 kg), before declining to 7.3 kg in week 12. GDL displayed a gradual decrease from 7.9 kg to 7.4 kg between weeks 8 and 14, whilst FRL slowly declined from 6.4 kg to 5.8 kg over its harvest period. PLD and PTR displayed the quickest firmness decreases of 1.5 kg each. Apart from RGL, the standard deviations for the remaining varieties remained relatively stable between 0.5 and 0.8 kg.
The weekly firmness trends in
Figure 7b show clear seasonal and storage-related patterns across the five fruit varieties, alongside some obvious anomalies. Fruit firmness generally declines from early to mid-harvest as fruit continues to ripen whilst in the orchards. Clear declines in weeks 5–14 for RGL, GDL and FRL are seen, which coincides with their peak harvest and early processing periods. Storage duration influences firmness preservation especially for late-season fruit. In later weeks (week 20–49), GDL’s firmness stabilises between 7.7 and 7.8 kg, likely because of well managed long term CA storage. FRL shows post cold storage firmness rebound in weeks 19–31, before a drop in average firmness is experienced. Most varieties show moderate standard deviations of between 0.7 and 0.8 kg, showing reasonable confidence in the values observed. RGL on the other hand shows high firmness variability throughout, with standard deviations of up to 1.3 kg.
Two key anomalies were identified in the maturity data. PLD exhibited an unusually low firmness of 4.1 kg in Week 11, likely representing overstored fruit from the previous season, exceeding storage capacity. PTR recorded an improbably low firmness of 0.8 kg in Week 22, likely due to measurement or data entry errors, with values stabilising again after Week 28.
Figure 7a,b show measurable declines between weighbridge arrival and packhouse stages, with cultivar-specific differences, for example, Packham’s Triumph pears being more sensitive than Golden Delicious apples. These changes reflect the cumulative impact of lead time delays and temperature variations as discussed in previous sections. The trends confirm the importance of cultivar-specific handling guidelines during throughput. For logistic managers, the linkage between lead time delays and firmness loss highlights the value of reducing lead times during various processing stages.
4.7. Inferential Analysis of Firmness, Temperature, Lead Times, and Seasonality
The descriptive statistics provide detailed insights into the variability of pulp temperature, lead time and firmness across fruit varieties, visually portraying clear seasonal trends. To further quantify the results, inferential analyses were conducted to test the relationships between the operational factors (lead times, temperature exposure, and seasonality) and to what degree they influence firmness outcomes across the varieties. Through evaluating the relative contribution of each factor, Company X managers have statistical evidence of which delays and/or conditions impact fruit quality the most.
Table 2 provides a Pearson correlation of the above-mentioned variables, whilst
Table 3 shows regression analyses for packhouse firmness (kg).
The correlations in
Table 2 confirm that longer lead times are associated with lower firmness, especially at the early Weighbridge (WB) to Pre-cooling (PC) stage (r = −0.32). Similarly, delays between Packhouse (PH) and Re-cooling (RC) are also negatively correlated with firmness. Interestingly, pulp temperature shows a weak relationship with firmness (r = 0.18), suggesting that the temperature variables are meaningful but compounded by process delays. These correlations align with the descriptive lead time analyses where long tail delays were shown to increase pulp temperatures and reduce Class 1 fruit proportions.
Table 2 is significant for logistics managers as it highlights the stages with the greatest risks, i.e., the congestion found at pre-cooling and re-cooling facilities rather than temperature fluctuations alone.
Table 3 shows a regression test of packhouse fruit firmness in (kg). The regression confirms that lead times are significant predictors of firmness. Each additional hour at the WB to PC stage reduces firmness by 0.09 kg while each additional hour at the PH to RC stage reduces firmness by 0.055 kg. This escalates during peak season conditions (Feb to Apr) where firmness decreases by 0.22 kg, consistent with the seasonal boxplots discussed previously.
The effects of lead times on different varieties are the largest drivers of firmness (for example, PLD increases by 2.28 kg relative to FRL). It is again evident that once lead times and seasonality are introduced, pulp temperatures are not a significant predictor of firmness loss (ß = 0.075, p = 0.252), highlighting once again the significant impact of delays on firmness loss.
To identify the total deterioration occurring at Company X’s facility, fruit firmness of the identified varieties captured at the weighbridge is compared to the firmness at the packhouse. The difference represents the loss of quality due to operational factors such as intake delays, pre-cooling inefficiency, packhouse handling, and re-cooling delays.
The difference in firmness is significantly indicated by lead times and seasonal congestion. Each additional hour in the WB to PC stage adds 0.047 kg of firmness loss, while the same amount of time in the PH to RC stage adds 0.029 kg firmness loss. An additional 0.065 kg firmness decline is experienced during peak season months. Notably, the apple varieties (GDL, PLD, and RGL) lose slightly more firmness during processing compared to the FRL pear variety, suggesting these cultivars are more sensitive to operational inefficiencies. PTR did not show statistically relevant firmness differences, which can be attributed to smaller sample sizes.
The inferential analyses reinforce the descriptive findings, wherein the long tail of the boxplots present at the weighbridge to pre-cooling and packhouse to re-cooling stages correspond directly to measurable firmness loss during processing. In addition, seasonal congestion is evident in statistically higher firmness loss in peak months. In summary, for logistics managers, this means that every delayed hour in operations increases fruit firmness loss by 0.05 kg at pre-cooling and 0.03 kg at re-cooling.
