Abstract
Background: Rapid urbanization has intensified the challenges of freight transport, particularly in last-mile (LM) delivery, leading to rising costs and environmental externalities. Autonomous vehicles (AVs) have emerged as a promising innovation to address these issues. While much of the existing literature emphasizes business and operational perspectives, this study focuses on the acceptance of AVs from the standpoint of e-consumers—individuals who make purchases via digital platforms—in an emerging market context. Methods: Grounded in an extended Unified Theory of Acceptance and Use of Technology 2 (UTAUT2), which is specifically suited to consumer-focused technology adoption research, this study incorporates five constructs tailored to AV adoption. Structural Equation Modeling (SEM) was applied to survey data collected from 304 e-consumers in Northeast Brazil. Results: The findings reveal that performance expectancy, hedonic motivation, and environmental awareness exert significant positive effects on acceptance and intention to use AVs for LM delivery. Social influence shows a weaker, yet still positive, impact. Importantly, price sensitivity exhibits a minimal effect, suggesting that while consumers are generally cost-conscious, perceived value may outweigh price concerns in early adoption stages. Conclusions: These results offer valuable insights for policymakers and logistics providers aiming to implement consumer-oriented, cost-effective AV solutions in LM delivery, particularly in emerging economies. The findings emphasize the need for strategies that highlight the practical, emotional, and environmental benefits of AVs to foster market acceptance.
1. Introduction
The emergence of new digital business models, combined with innovative delivery technologies, has enabled consumers to acquire a wide variety of products with just a few clicks, offering greater choice, easy access to information, and purchasing convenience [1]. This shift in consumer behavior has significantly increased the demand for urban last-mile (LM) delivery logistics, introducing new operational challenges and associated costs [2,3]. Last-mile delivery refers to the final stage of the delivery process, in which goods are transported directly to the end consumer [4,5].
In direct-to-consumer e-commerce channels, several studies have emphasized the crucial role of last-mile delivery in ensuring operational efficiency. This is especially true in the case of traditional road transport, which faces challenges such as urban congestion, increased shipment fragmentation to meet customer-specific needs, and rising costs for both consumers and retailers, mainly due to increasing fuel prices and a lack of dedicated logistics infrastructure [6,7]. To address these issues, technological innovations, such as autonomous vehicles (AVs), are becoming increasingly necessary [8,9]. Rejeb et al. [10] highlight those technologies such as AVs offer potential benefits, including reduced delivery time and cost, greater operational flexibility, and enhanced sustainability.
In this scenario, the rapid growth of online sales has placed logistics at the center of the consumer experience [3]. Consumers increasingly expect free next-day delivery to their preferred location during business hours. However, the complexities of urban logistics systems require consumers to consider trade-offs and select delivery options that best align with their individual preferences. For example, when free delivery and return options are available, consumers may be more willing to wait longer or travel to collection points to retrieve their orders [11]. The expansion of e-commerce and the rise of omnichannel retailing have further underscored the diversity of consumer preferences, compelling logistics providers to revise their business models to meet increasing expectations [12].
As e-commerce platforms introduce more advanced and technology-driven delivery methods, consumers are offered new options and may switch between retailers based on the service experience [13]. As such, understanding consumer intention and acceptance of these innovations becomes increasingly relevant [14]. There is currently no consensus in the literature on the most appropriate theoretical framework to explain behavioral intention toward disruptive delivery technologies. Theories frequently used in this field include the diffusion of innovations theory [15]; random utility theory [7]; resource-matching theory, perceived risk theory, and perceived value theory [16]; technology acceptance model [14]; the theory of planned behavior [17]; social cognitive theory [18]; and the Unified Theory of Acceptance and Use of Technology (UTAUT) [14,19,20,21,22]. While these models identify key constructs for studying technology adoption in LM delivery, it is essential to consider both the nature of the innovation and the regional context in which it is introduced [17].
Most existing research has focused on innovations related to collection and delivery points rather than on delivery modes. Although several studies have examined AV-based deliveries [7,14,16,19,21,23], these were predominantly conducted in economically and technologically advanced countries, where consumers are generally more familiar with such technologies. Research focused on emerging countries, such as Brazil, remains limited. Furthermore, none of the existing studies have simultaneously examined the five constructs investigated here, particularly environmental awareness. The steady rise in last-mile deliveries—driven by the exponential growth of e-commerce—has considerable sustainability implications [24], underscoring the need to explore consumer awareness of environmental impacts when choosing delivery options. Leon et al. [22], for example, presented an early effort to consider environmental benefits in a U.S.-based study focusing on drone delivery, further highlighting the relevance of the present research.
This study investigates the factors influencing e-consumers’ acceptance and intention to use AVs for last-mile delivery. To that end, we extend the UTAUT2 framework by developing a customized theoretical model incorporating five constructs particularly relevant to AV-based logistics: (a) performance expectancy, (b) social influence, (c) hedonic motivation, (d) price sensitivity, and (e) environmental awareness. A self-administered questionnaire was used to assess both the measurement model (relationships between latent and observed variables) and the structural model (relationships between constructs), with a focus on e-consumers in Northeast Brazil.
A previous study conducted in technologically advanced countries found that respondents were generally neutral toward AV use in last-mile delivery, reinforcing the importance of examining consumer acceptance in its early stages. Insights from such studies can guide development strategies, helping increase user adoption over time [19,20,25]. Thus, this paper contributes to the literature by proposing a measurement model, addressing a gap in research focused on consumer perspectives toward last-mile delivery alternatives [26], especially regarding AVs in emerging economies. The main contribution of this study lies in its theoretical model, which advances the understanding of key antecedents of consumer acceptance and intention to adopt AV technologies in the context of last-mile delivery.
2. Research Hypotheses
This study is grounded in the understanding that the effective market penetration of autonomous vehicles (AVs) depends on their introduction in a way that appeals to consumers. As such, research on consumer preferences should be central to this discussion [23]. In this section, we present the constructs included in the theoretical model used to analyze the acceptance and intention to use AV technology in last-mile (LM) delivery, along with the corresponding hypotheses. As previously noted, five constructs were considered: (a) performance expectancy, (b) social influence, (c) hedonic motivation, (d) price sensitivity, and (e) environmental awareness.
Performance expectancy refers to the perceived benefits that AV use offers the consumer. Specifically, it reflects the extent to which an individual believes that adopting such a service will enhance delivery efficiency and provide greater flexibility [14,27]. When confronted with a new delivery method, consumers may evaluate whether the technology will be useful in their daily routines, such as receiving or returning products more quickly. Studies have confirmed the strong relationship between this construct and behavioral intention to adopt new technologies [19,20]. Accordingly, the first hypothesis is proposed as follows:
H1:
Performance expectancy positively influences the acceptance and intention to use AV technology.
Social influence pertains to the degree to which a consumer’s decision is shaped by the opinions of important referents, such as family and friends. Individuals within the same social circle may directly influence acceptance intentions through mechanisms such as social norms, perceived image, or status. In this sense, consumer decisions are often guided by how others view the adoption and use of new technologies [20,27,28,29,30]. Based on this, the second hypothesis is formulated as follows:
H2:
Social influence positively influences the acceptance and intention to use AV technology.
Hedonic motivation has become a key construct in the evolution of UTAUT2, originally applied in organizational contexts. It now plays a prominent role in explaining technology adoption in consumer-centered environments [31]. This construct captures the degree of enjoyment and pleasure derived from using a particular technology, which can motivate e-consumers to adopt it. In essence, hedonic motivation reflects the fun and emotional appeal associated with the innovation [14,27]. Therefore, the third hypothesis is as follows:
H3:
Hedonic motivation positively influences the acceptance and intention to use AV technology.
Price sensitivity is a well-established construct in studies on technology adoption. Its influence can vary based on the research focus and methodological approach [32]. Prior studies on AV acceptance suggest that consumers are often unwilling to pay extra fees for advanced delivery services, preferring traditional delivery methods instead [25]. The cost of delivery has been consistently identified as a critical factor in consumer decision-making [11,19,20,33]. In other words, if AV-based delivery services are more expensive than traditional options, consumers are less likely to adopt the technology. Thus, the fourth hypothesis is as follows:
H4:
Price sensitivity negatively influences the acceptance and intention to use AV technology.
Environmental awareness plays a growing role in shaping consumer decisions, particularly when additional information is provided about the environmental impact of new delivery methods [34]. The adoption of green innovations is often linked to an individual’s level of environmental consciousness [5,35]. However, this factor has been relatively underexplored in AV delivery studies [22]. Severo et al. [36] identified environmental awareness as a strong predictor of sustainable practices among future generations, including sustainable consumption. In this study, environmental awareness is treated as a potential predictor of the intention to adopt AV technology. Moreover, the COVID-19 pandemic has heightened environmental awareness, prompting behavioral shifts toward sustainability [22,37,38]. Based on this rationale and considering that this construct has not yet been tested in the context of AVs, the fifth hypothesis is proposed as follows:
H5:
Environmental awareness positively influences the acceptance and intention to use AV technology.
Based on these five hypotheses, a theoretical model was developed to assess e-consumers’ acceptance and intention to use AV technology in the context of last-mile delivery, as illustrated in Figure 1.
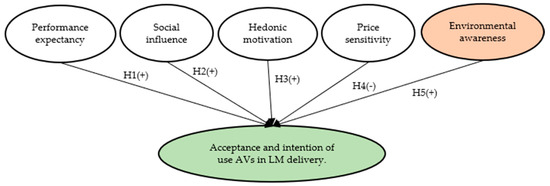
Figure 1.
Theoretical Model. Source: The Authors (2025).
3. Materials and Methods
This quantitative research is characterized as a survey methodology following the Theoretical model in Figure 1.
3.1. Sample and Data Collection
A self-administration questionnaire, based on observable variables and constructs (Table 1), was used as an instrument for data collection.

Table 1.
Constructs and variables. Source: The Authors (2025).
The questionnaire was sent to five (05) experts with experience in scientific research in the area of logistics and management. Some modifications to the written form were made for better understanding by respondents; thus, the questionnaire was validated. Each variable was evaluated using a 5-point Likert scale, ranging from 1 (Totally Disagree) to 5 (Totally Agree).
This research complies with the ethical principles determined by the National Research Ethics Council (CONEP), as it involves public opinion research without conducting experiments on humans or animals, relying only on the perception and opinion of the participants. Furthermore, complete anonymity of participants was guaranteed.
The research universe was the population of the state of Pernambuco, Brazil, considering consumers who make purchases through e-commerce (websites or shopping apps). According to the latest census released by the Brazilian Institute of Geography and Statistics [39], Pernambuco had a population of 9,058,931, with a significant number of these residents buying or starting to buy products online after the pandemic.
The survey questionnaire was administered through digital platforms, including WhatsApp®, Instagram®, LinkedIn®, and institutional emails to ensure broad reach across the target population of e-commerce consumers in Pernambuco, Brazil. While this sampling approach may underrepresent less digitally-engaged demographic groups, it effectively targets the tech-savvy consumer segment that comprises both the primary e-commerce user base and the most probable early adopters of autonomous vehicle delivery services. This strategic focus aligns with our research objectives, as these digitally-engaged consumers represent the key market for innovative last-mile delivery solutions and provide the most relevant insights for assessing initial technology acceptance.
This non-probabilistic convenience sampling approach yielded 374 initial responses collected between 12 October 2023, and 6 January 2024. Rigorous quality control measures were implemented, excluding 70 responses (18.7%) identified as outliers (uniform response patterns), resulting in 304 valid questionnaires (81.3% validity rate). This sample size exceeds the minimum thresholds recommended by the literature for hypothesis testing (200–400 respondents) and for structural equation modeling (5–10 respondents per question, requiring 105–210 for our 21-item questionnaire) [37,38]. Table 2 presents the descriptive statistics for the sample of 304 respondents, providing a comprehensive overview of the sample characteristics.
Table 2.
Respondent descriptive statistics. Source: The Authors (2025).
The gender distribution closely mirrors the demographic composition of Pernambuco’s population as reported in the 2022 IBGE census (52% women and 48% men), indicating good gender representativeness in our sample [39]. The sample shows a predominance of Generation Z respondents (42%), comprising either current university students or graduates. This age distribution reflects the inherent characteristics of our non-probabilistic convenience sampling methodology. While this age concentration limits generalizability to older demographics, it appropriately represents the primary target market for e-commerce and emerging delivery technologies, as Generation Z constitutes the most active digital consumer segment in Brazil [40]. The sample’s educational profile further strengthens its validity for technology acceptance studies, as educated consumers typically make more informed evaluations of innovative solutions.
3.2. Data Analysis
For data analysis, a multivariate analysis using Structural Equation Modeling (SEM) was performed. Figure 2 summarizes the data analysis steps adopted from [38].
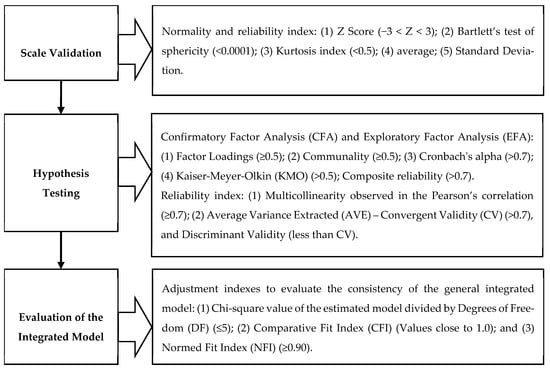
Figure 2.
Data analysis steps. Source: adopted from [38].
Some effects, such as the halo effect, which occurs when the evaluation of an item under a certain bias can interfere with the results on other factors, and Common Method Variance (CVM), which represents research biases, can lead to an incorrect generalization of the results. To mitigate such effects, tests of variability, reliability, and normality were considered, with no biases detected [37,38]. The following results confirm the absence of biases and highlight the relevance of the proposed model.
4. Results
Following the proposed methodology, one of the first parameters for validating and enabling SEM specific statistical techniques is based on the understanding that a set of data has a normal distribution. The Z-score test and the Asymmetry test were applied, in addition to evaluating the Kurtosis index. In all tests applied, the sample was found to follow a normal distribution. Furthermore, the internal reliability of each questionnaire construct was tested, so that the Cronbach’s Alpha tests (>0.7) and the Kaiser-Meyer-Olkin KMO (>0.5) are at satisfactory levels. In addition to all constructs presenting a significant Bartlett’s sphericity test, they also present a total variance explained of more than 60%. In addition, exploratory factor analysis was also carried out. Factorial loads above 0.3 mean the scale item makes a good contribution to explaining the construct. The communality indices, which express the explanatory power of that variable by the factor, were also satisfactory (>0.5). Thus, Table 3 summarizes the results (significance level p < 0.001). The variable EA4 presented a communality index lower than recommended (<0.5), which could be indicative of withdrawal. However, before any variables were removed from the analysis, [41] recommends investigating their explanatory power of this variable based on the literature. Accordingly, this item was found to be important in explaining the level of environmental awareness of respondents, supported by several authors [5,35,37,38]. Based on these results, it is possible to infer that the instrument used to measure the acceptance and intention to use AVs by e-consumers was validated for the selected sample.
Table 3.
Exploratory Factor Analysis and reliability measures. Source: The authors (2025).
Additionally, the consistency of the instrument can also be assessed using the Pearson correlation test, which showed possible multicollinearity in 11 combinations of variables, with values p > 0.7 [38]: PE2←→PE3 (p = 0.759), PE3←→PE4 (p = 0.750), SI1←→SI2 (p = 0.775), SI1←→SI3 (p = 0.719), SI2←→SI3 (p = 0.796), PS1←→PS2 (p = 0.737), EA1←→EA2 (p = 0.801), EA2←→EA3 (p = 0.794), AU1←→AU2 (p = 0.745), AU1←→AU3 (p = 0.809), and AU2←→AU3 (p = 0.800). However, all correlated variables belong to the same construct, with no need for exclusion, reinforcing the consistency of the scale. The average variance extracted was calculated to indicate the precision with which the items explain the latent variables, which must present values above 0.7. All constructs presented satisfactory values, such as PE = 0.78, SI = 0.85, HM = 0.74, PS = 0.80, EA = 0.76, and AU = 0.87. In addition, a convergent validity (CV) above 0.7 indicates a strong correlation among the variables that form the construct (Table 4), while discriminant validity (DV) must present results lower than those of CV. This demonstrates an excellent measurement model, showing that all variables explain their respective construct very well.
Table 4.
Discriminant Validity and Convergent Validity. Source: The Authors (2025).
Continuing the steps of data analysis, SEM combines multiple variables into a single set of causal relationships. Here, this knowledge was acquired through a literature review, which allowed the elaboration of the theoretical model (Figure 1); therefore, the general integrated model is presented in Figure 3.
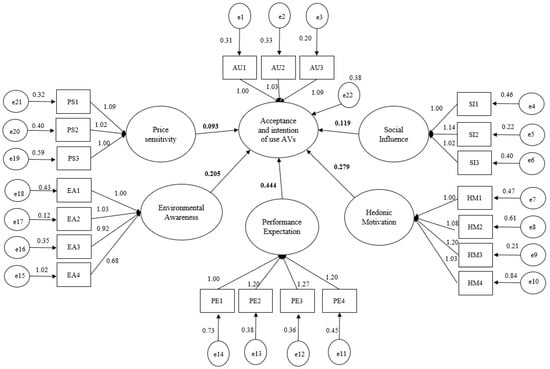
Figure 3.
General Integrated Model. Source: The Authors (2025).
Thus, considering the model in Figure 3, the hypotheses were tested with the aid of the AMOS® software version 21 (Table 5).
Table 5.
Hypothesis Testing and Regression Estimates. Source: The Authors (2025).
All hypotheses were confirmed with positive estimates and important loadings. The hypotheses are statistically significant (p < 0.05) except for the price sensitivity variable.
Adjusted Model
After the initial analysis, model adjustments (optimized) were made to account for correlations among constructs from the same theoretical foundation, such as performance expectancy, hedonic motivation, and social influence, as suggested by [42]. Incorporating these correlations improved model fit indices (as shown in Table 6), thereby enhancing the robustness of the structural model and reinforcing the internal consistency of the relationships examined.
Table 6.
Adjustment indexes of the general integrated model. Source: The Authors (2025).
The covariance indices identified were: HM←→SI (0.542), HM←→PE (0.699), and SI←→PE (0.642). Thus, resulting in an integrated model adjusted as shown in Figure 4.
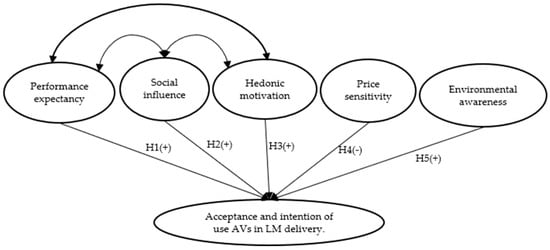
Figure 4.
Hypothesis Testing and Regression Estimates. Source: The Authors (2025).
Based on the adjusted model, the consistency of the model in explaining the degree of acceptance and intention to use AVs by e-consumers is confirmed.
5. Discussion
To support this discussion, we compare our findings with previous studies that examined similar constructs in comparable contexts, enabling a meaningful analysis of quantitative results (see Table 7). Specifically, studies [20,27] provide benchmark values for the constructs performance expectancy, social influence, and hedonic motivation. Additionally, study [20] offers comparable data for price sensitivity, while study [22] presents relevant findings related to environmental awareness.
Table 7.
Comparative Summary of Related Studies on Consumer Acceptance of AV-Based Deliveries.
Performance expectancy, the strongest predictor in our model (ERMPE = 0.444), also emerged as a key construct in previous studies. In [20], it showed a lower effect size (ERMPE = 0.231), while in [27], it reached an intermediate value (ERMPE = 0.370). These differences suggest a stronger reliance on utilitarian benefits in the emerging market context of Brazil, as reflected in our findings.
Social influence showed a similarly modest effect across studies—ERMSI = 0.119 in our study, ERMSI = 0.135 in [20], and ERMSI = 0.120 in [27]—suggesting that, while social cues are present, they consistently play a secondary role in shaping behavioral intentions across different contexts.
Hedonic motivation presented a stronger effect in our study (ERMHM = 0.279) compared to [20] (ERMHM = 0.133), with an even more pronounced impact in [27] (ERMHM = 0.480). These differences highlight varying levels of consumer sensitivity to novelty and emotional engagement, suggesting that in less technologically mature regions, such as the one examined in our study, hedonic factors exert a greater influence than in more established markets, though not as strongly as observed in [27].
Environmental awareness proved to be a relevant factor in our study (ERMEA = 0.205), although its impact was lower than that found in [22] in the context of drone delivery services (ERMEA = 0.520). Lastly, price sensitivity had a negligible and non-significant influence in our model (ERMPS = (-) 0.093), contrasting sharply with [20], where it showed a significant negative effect (ERMPS = −0.244), likely reflecting contextual differences in market maturity and consumer information.
These results reveal how core technology acceptance constructs—such as performance expectancy, social influence, and hedonic motivation—retain their relevance across geographical and economic contexts, yet exhibit significant variation in magnitude depending on local conditions. In Brazil, where delivery logistics are still developing and AV services are not yet available, consumers appear to prioritize functional benefits and derive more excitement from emerging technologies [14,19,20,38], possibly due to limited exposure to innovation. The inclusion of environmental awareness reflects a growing concern for sustainability [22,34,37,38,43], even in regions where environmental discourse has traditionally been less prominent. Although its impact was moderate, it demonstrates the potential for future engagement strategies centered on ecological benefits. Conversely, the limited influence of price sensitivity can be explained by two contextual factors: the absence of real-world AV delivery services and the uncertainty around associated costs. In this early stage, consumers may not yet weigh cost as heavily as in more mature markets [32], particularly when functional and environmental benefits are perceived as outweighing potential expenses. These findings suggest that in emerging markets, initial adoption of AV technologies may depend more on perceived utility and innovation appeal than on cost [44,45]. Therefore, emphasizing functional and environmental benefits could be a more effective strategy in the early stages of deployment.
6. Conclusions
This research addresses three fundamental challenges to improving logistics efficiency in developing regions: access, capacity, and consumer acceptance. By focusing on e-consumers’ perceptions of autonomous vehicles (AVs) for last-mile delivery, the study offers valuable insights for policymakers aiming to modernize urban freight systems in emerging economies. The results indicate that AVs are seen as a viable solution for small parcel delivery, with acceptance primarily influenced by convenience, user experience, and environmental benefits. These findings suggest that public-private partnerships should prioritize the development of AV-based delivery systems that enhance flexibility, streamline recipient verification, and clearly communicate their environmental advantages. Additionally, the importance of consumer education is highlighted, pointing to the need for targeted awareness campaigns to accelerate AV adoption in these markets.
Some limitations should be acknowledged. First, although price sensitivity is analyzed as a factor, the study does not assess the actual cost structures or long-term economic viability of AV technologies. Second, AVs are treated as a broad category, without differentiating between delivery modalities, such as drones, ground robots, or autonomous vans, which may elicit different levels of acceptance. These limitations open avenues for future research, including in-depth economic evaluations of AV deployment and modality-specific investigations on consumer preferences.
Although the sample size meets the statistical criteria for structural equation modeling, we recognize that regional, cultural, and economic factors may influence acceptance patterns elsewhere. The goal of this research is not to provide a universal model but rather to identify early signals of AV acceptance in a developing context and to establish a foundation for comparative studies across diverse markets.
Despite these limitations, this study makes important contributions to understanding how AV-based solutions can be effectively implemented in last-mile logistics within emerging economies. The demonstrated willingness of e-consumers to adopt these technologies supports the case for strategic investment in AV infrastructure as part of broader logistics modernization efforts. For policymakers and logistics providers, the findings offer practical guidance on aligning innovation with local realities while addressing the specific challenges of urban freight transport. Ultimately, this research supports evidence-based decision-making for the sustainable development of last-mile delivery systems in regions experiencing rapid urbanization and technological transition.
Author Contributions
Conceptualization—M.E.F. and E.P.S.; Methodology—E.P.S. and J.C.F.d.G.; Validation and formal analysis—E.P.S., M.E.F. and J.C.F.d.G.; Writing—original draft preparation—M.E.F. and E.P.S.; Writing—review and editing—M.E.F. and P.C.M.; Project administration—M.E.F.; Funding—M.E.F. and P.C.M. All authors have read and agreed to the published version of the manuscript.
Funding
This research was partially funded by Coordination for the Improvement of Higher Education Personnel—Brazil (CAPES), grant number 001, and Foundation for the Support of Science and Technology of the State of Pernambuco (FACEPE), grant number PBPG-0774-6.02/22. The APC was funded by P.C.M.
Data Availability Statement
All data are available upon request.
Conflicts of Interest
The authors declare no conflicts of interest.
References
- Olsson, J.; Osman, M.C.; Hellström, D.; Vakulenko, Y. Customer Expectations of Unattended Grocery Delivery Services: Mapping Forms and Determinants. Int. J. Retail. Distrib. Manag. 2022, 50, 1–16. [Google Scholar] [CrossRef]
- Modica, T.; Colicchia, C.; Tappia, E.; Melacini, M. Empowering Freight Transportation through Logistics 4.0: A Maturity Model for Value Creation. Prod. Plan. Control 2023, 34, 1149–1164. [Google Scholar] [CrossRef]
- Buldeo Rai, H.; Verlinde, S.; Macharis, C. Who Is Interested in a Crowdsourced Last Mile? A Segmentation of Attitudinal Profiles. Travel Behav. Soc. 2021, 22, 22–31. [Google Scholar] [CrossRef]
- Maas, J.; Nitsche, B.; Straube, F. Systematization of Autonomous Vehicles in Last Mile Transportation Processes—Taxonomy Development and Clustering of Existing Concepts. Int. J. Logist. Res. Appl. 2024, 27, 2104–2126. [Google Scholar] [CrossRef]
- Wang, X.; Wong, Y.D.; Li, K.X.; Yuen, K.F. A Critical Assessment of Co-Creating Self-Collection Services in Last-Mile Logistics. Int. J. Logist. Manag. 2021, 32, 846–871. [Google Scholar] [CrossRef]
- Janjevic, M.; Winkenbach, M. Characterizing Urban Last-Mile Distribution Strategies in Mature and Emerging e-Commerce Markets. Transp. Res. Part A Policy Pract. 2020, 133, 164–196. [Google Scholar] [CrossRef]
- Merkert, R.; Bliemer, M.C.J.; Fayyaz, M. Consumer Preferences for Innovative and Traditional Last-Mile Parcel Delivery. Int. J. Phys. Distrib. Logist. Manag. 2022, 52, 261–284. [Google Scholar] [CrossRef]
- Dabic-Miletic, S. Autonomous Vehicles as an Essential Component of Industry 4.0 for Meeting Last-Mile Logistics Requirements. J. Ind. Intell. 2023, 1, 55–62. [Google Scholar] [CrossRef]
- Kucukaltan, B.; Saatcioglu, O.Y.; Irani, Z.; Tuna, O. Gaining Strategic Insights into Logistics 4.0: Expectations and Impacts. Prod. Plan. Control 2022, 33, 211–227. [Google Scholar] [CrossRef]
- Rejeb, A.; Rejeb, K.; Simske, S.J.; Treiblmaier, H. Drones for Supply Chain Management and Logistics: A Review and Research Agenda. Int. J. Logist. Res. Appl. 2023, 26, 708–731. [Google Scholar] [CrossRef]
- Buldeo Rai, H.; Verlinde, S.; Macharis, C. The “next Day, Free Delivery” Myth Unravelled: Possibilities for Sustainable Last Mile Transport in an Omnichannel Environment. Int. J. Retail. Distrib. Manag. 2019, 47, 39–54. [Google Scholar] [CrossRef]
- Tsai, Y.-T.; Tiwasing, P. Customers’ Intention to Adopt Smart Lockers in Last-Mile Delivery Service: A Multi-Theory Perspective. J. Retail. Consum. Serv. 2021, 61, 102514. [Google Scholar] [CrossRef]
- Vakulenko, Y.; Shams, P.; Hellström, D.; Hjort, K. Service Innovation in E-Commerce Last Mile Delivery: Mapping the e-Customer Journey. J. Bus. Res. 2019, 101, 461–468. [Google Scholar] [CrossRef]
- Oulmakki, O.; Verny, J.; Janjevic, M.; Khalfalli, M. Empirical Study on Consumer’s Acceptance of Delivery Robots in France. Int. J. Logist. Res. Appl. 2024, 27, 2049–2079. [Google Scholar] [CrossRef]
- Yuen, K.F.; Wang, X.; Ng, L.T.W.; Wong, Y.D. An Investigation of Customers’ Intention to Use Self-Collection Services for Last-Mile Delivery. Transp. Policy 2018, 66, 1–8. [Google Scholar] [CrossRef]
- Koh, L.Y.; Xia, Z.; Yuen, K.F. Consumer Acceptance of the Autonomous Robot in Last-Mile Delivery: A Combined Perspective of Resource-Matching, Perceived Risk and Value Theories. Transp. Res. Part A Policy Pract. 2024, 182, 104008. [Google Scholar] [CrossRef]
- Asdecker, B. Building the E-Commerce Supply Chain of the Future: What Influences Consumer Acceptance of Alternative Places of Delivery on the Last-Mile. Logistics 2021, 5, 90. [Google Scholar] [CrossRef]
- Osakwe, C.N.; Hudik, M.; Říha, D.; Stros, M.; Ramayah, T. Critical Factors Characterizing Consumers’ Intentions to Use Drones for Last-Mile Delivery: Does Delivery Risk Matter? J. Retail. Consum. Serv. 2022, 65, 102865. [Google Scholar] [CrossRef]
- Kapser, S.; Abdelrahman, M. Acceptance of Autonomous Delivery Vehicles for Last-Mile Delivery in Germany—Extending UTAUT2 with Risk Perceptions. Transp. Res. Part C Emerg. Technol. 2020, 111, 210–225. [Google Scholar] [CrossRef]
- Kapser, S.; Abdelrahman, M.; Bernecker, T. Autonomous Delivery Vehicles to Fight the Spread of COVID-19—How Do Men and Women Differ in Their Acceptance? Transp. Res. Part A Policy Pract. 2021, 148, 183–198. [Google Scholar] [CrossRef]
- Leon, S.; Chen, C.; Ratcliffe, A. Consumers’ Perceptions of Last Mile Drone Delivery. Int. J. Logist. Res. Appl. 2023, 26, 345–364. [Google Scholar] [CrossRef]
- Leon, S.; Chen, C.; Ratcliffe, A. Consumers’ Perceptions of the Environmental and Public Health Benefits of Last Mile Drone Delivery. Int. J. Logist. Res. Appl. 2024, 1–25. [Google Scholar] [CrossRef]
- Pani, A.; Mishra, S.; Golias, M.; Figliozzi, M. Evaluating Public Acceptance of Autonomous Delivery Robots during COVID-19 Pandemic. Transp. Res. Part D Transp. Environ. 2020, 89, 102600. [Google Scholar] [CrossRef]
- González-Romero, I.; Ortiz-Bas, Á.; Prado-Prado, J.C.; Lyons, A. A Stakeholder-Led Sustainability Framework for Analysing Last-Mile Transport and Delivery. Int. J. Logist. Res. Appl. 2024, 1–31. [Google Scholar] [CrossRef]
- Polydoropoulou, A.; Tsirimpa, A.; Karakikes, I.; Tsouros, I.; Pagoni, I. Mode Choice Modeling for Sustainable Last-Mile Delivery: The Greek Perspective. Sustainability 2022, 14, 8976. [Google Scholar] [CrossRef]
- Zarei, M.M.; Chaparro-Pelaez, J.; Agudo-Peregrina, Á.F. Identifying Consumer’s Last-Mile Logistics Beliefs in Omni-Channel Environment. Econ. Res. Ekon. Istraživanja 2020, 33, 1796–1812. [Google Scholar] [CrossRef]
- Nordhoff, S.; Madigan, R.; Van Arem, B.; Merat, N.; Happee, R. Interrelationships among predictors of automated vehicle acceptance: A structural equation modelling approach. Theor. Issues Ergon. Sci. 2021, 22, 383–408. [Google Scholar] [CrossRef]
- Buckley, L.; Kaye, S.-A.; Pradhan, A.K. Psychosocial Factors Associated with Intended Use of Automated Vehicles: A Simulated Driving Study. Accid. Anal. Prev. 2018, 115, 202–208. [Google Scholar] [CrossRef] [PubMed]
- Madigan, R.; Louw, T.; Wilbrink, M.; Schieben, A.; Merat, N. What Influences the Decision to Use Automated Public Transport? Using UTAUT to Understand Public Acceptance of Automated Road Transport Systems. Transp. Res. Part F Traffic Psychol. Behav. 2017, 50, 55–64. [Google Scholar] [CrossRef]
- Panagiotopoulos, I.; Dimitrakopoulos, G. An Empirical Investigation on Consumers’ Intentions towards Autonomous Driving. Transp. Res. Part C Emerg. Technol. 2018, 95, 773–784. [Google Scholar] [CrossRef]
- Tamilmani, K.; Rana, N.; Dwivedi, Y.; Sahu, G.P. Roderick, Sian Exploring the Role of “Price Value” for Understanding Consumer Adoption of Technology: A Review and Meta-Analysis of UTAUT2 Based Empirical Studies. In Proceedings of the PACIS 2018 Proceedings, Yokohama, Japan, 26–30 June 2018; p. 64. [Google Scholar]
- Patil, P.; Tamilmani, K.; Rana, N.P.; Raghavan, V. Understanding Consumer Adoption of Mobile Payment in India: Extending Meta-UTAUT Model with Personal Innovativeness, Anxiety, Trust, and Grievance Redressal. Int. J. Inf. Manag. 2020, 54, 102144. [Google Scholar] [CrossRef]
- Hagen, T.; Scheel-Kopeinig, S. Would Customers Be Willing to Use an Alternative (Chargeable) Delivery Concept for the Last Mile? Res. Transp. Bus. Manag. 2021, 39, 100626. [Google Scholar] [CrossRef]
- Ignat, B.; Chankov, S. Do E-Commerce Customers Change Their Preferred Last-Mile Delivery Based on Its Sustainability Impact? Int. J. Logist. Manag. 2020, 31, 521–548. [Google Scholar] [CrossRef]
- Wang, Y.; Bi, M.; Lai, J.; Chen, Y. Locating Movable Parcel Lockers under Stochastic Demands. Symmetry 2020, 12, 2033. [Google Scholar] [CrossRef]
- Severo, E.A.; De Guimarães, J.C.F.; Henri Dorion, E.C. Cleaner Production, Social Responsibility and Eco-Innovation: Generations’ Perception for a Sustainable Future. J. Clean. Prod. 2018, 186, 91–103. [Google Scholar] [CrossRef]
- Severo, E.A.; De Guimarães, J.C.F.; Dellarmelin, M.L. Impact of the COVID-19 Pandemic on Environmental Awareness, Sustainable Consumption and Social Responsibility: Evidence from Generations in Brazil and Portugal. J. Clean. Prod. 2021, 286, 124947. [Google Scholar] [CrossRef]
- De Guimarães, J.C.F.; Severo, E.A.; Klein, L.L.; Dorion, E.C.H.; Lazzari, F. Antecedents of Sustainable Consumption of Remanufactured Products: A Circular Economy Experiment in the Brazilian Context. J. Clean. Prod. 2023, 385, 135571. [Google Scholar] [CrossRef]
- Brazilian Institute of Geography and Statistics. Population in the Last Census—2022. 2022. Available online: https://www.ibge.gov.br (accessed on 20 September 2024).
- Brazilian E-Commerce Association. Brazilian E-Commerce Report 2023. 2023. Available online: https://www.conversion.com.br (accessed on 3 April 2025).
- Matos, J.M.A.; Rodrigues, M.J. Almost Exact Computation of Eigenvalues in Approximate Differential Problems. Math. Comput. Appl. 2019, 24, 96. [Google Scholar] [CrossRef]
- Ferreira, L.; Oliveira, T.; Neves, C. Consumer’s Intention to Use and Recommend Smart Home Technologies: The Role of Environmental Awareness. Energy 2023, 263, 125814. [Google Scholar] [CrossRef]
- Caspersen, E.; Navrud, S.; Bengtsson, J. Act Locally? Are Female Online Shoppers Willing to Pay to Reduce the Carbon Footprint of Last Mile Deliveries? Int. J. Sustain. Transp. 2022, 16, 1144–1158. [Google Scholar] [CrossRef]
- Nastjuk, I.; Herrenkind, B.; Marrone, M.; Brendel, A.B.; Kolbe, L.M. What Drives the Acceptance of Autonomous Driving? An Investigation of Acceptance Factors from an End-User’s Perspective. Technol. Forecast. Soc. Change 2020, 161, 120319. [Google Scholar] [CrossRef]
- Yuen, K.F.; Cai, L.; Qi, G.; Wang, X. Factors Influencing Autonomous Vehicle Adoption: An Application of the Technology Acceptance Model and Innovation Diffusion Theory. Technol. Anal. Strateg. Manag. 2021, 33, 505–519. [Google Scholar] [CrossRef]
Disclaimer/Publisher’s Note: The statements, opinions and data contained in all publications are solely those of the individual author(s) and contributor(s) and not of MDPI and/or the editor(s). MDPI and/or the editor(s) disclaim responsibility for any injury to people or property resulting from any ideas, methods, instructions or products referred to in the content. |
© 2025 by the authors. Licensee MDPI, Basel, Switzerland. This article is an open access article distributed under the terms and conditions of the Creative Commons Attribution (CC BY) license (https://creativecommons.org/licenses/by/4.0/).