Article

Modeling Extended Service Quality for Public Transportation in the Post-Pandemic Period: Differentiating between Urban and Rural Areas: A Case Study of Intercity Railway, Thailand

by
Panuwat Wisutwattanasak
1,
Thanapong Champahom
2,
Sajjakaj Jomnonkwao
3,*,
Manlika Seefong
3,
Kestsirin Theerathitichaipa
3,
Rattanaporn Kasemsri
4 and
Vatanavongs Ratanavaraha
3
1
Institute of Research and Development, Suranaree University of Technology, Nakhon Ratchasima 30000, Thailand
2
Department of Management, Faculty of Business Administration, Rajamangala University of Technology Isan, Nakhon Ratchasima 30000, Thailand
3
School of Transportation Engineering, Institute of Engineering, Suranaree University of Technology, Nakhon Ratchasima 30000, Thailand
4
School of Civil Engineering, Institute of Engineering, Suranaree University of Technology, Nakhon Ratchasima 30000, Thailand
*
Author to whom correspondence should be addressed.
Logistics 2023, 7(4), 93; https://doi.org/10.3390/logistics7040093
Submission received: 30 September 2023 / Revised: 9 November 2023 / Accepted: 27 November 2023 / Published: 5 December 2023

Abstract

:
Background: Scholars have indicated differences in the attitudes of urban and non-urban populations, especially after the COVID-19 outbreak, which extend to their needs and expectations regarding rail transport development. The aim of this study is to enhance the quality of train services in the post-pandemic era, and multigroup analysis will be applied to achieve the difference in area context. Methods: The research data were collected from rail transport users throughout Thailand, consisting of 665 urban and 935 rural users. The questionnaires primarily focused on user expectations regarding rail service quality and travel conditions in the post-pandemic landscape using multigroup confirmatory factor analysis (MCFA). Results: The results unveiled significant variations in user trends and needs across different contexts and areas. In urban settings, there was a notably higher overall service expectation compared to rural areas. Specifically, urban users prioritized factors such as accessibility and service empathy, whereas rural rail users placed greater emphasis on staff quality and reasonable pricing. Conclusions: These findings furnish rail transport service agencies with valuable insights and guidance for comprehending their users’ needs. They can develop appropriate organizational strategies, service quality enhancements, and policy adjustments tailored to the unique demands of urban and rural areas in the post-pandemic era, thereby ensuring sustainability. Additionally, the methodology of multigroup analysis served as a significant scientific contribution; this showed that the statistical analysis of different area contexts in the study should not be ignored.

1. Introduction

The COVID-19 epidemic has affected the transportation, logistics, and economic sectors [1]. People’s tourism behavior has changed. Tourists or travelers are increasingly interested in the health, hygiene, and safety of transport systems during travel [2,3,4]. For this reason, the role of public transport is directly related to sanitation, health, and even safety in travel. Since public transport is a form of service that has many users and connects to many places, there should be special awareness of the health and safety of users. It is possible that the attitudes and needs of passengers may undergo changes in the future. Consequently, it is important to conduct a study on passengers’ attitudes towards public transport post-pandemic. Transportation is key for moving people or goods from one place to another; it plays a very important role in the development of a country, both socially and economically, as the transport system can link together the social and economic systems of the country. As society expands as a result of population growth, the demand for various aspects related to transportation increases, i.e., the demand for travel, transport of goods, etc. However, if each country lacks an efficient transport system, response to the needs of the country’s social and economic systems will not be able to continue. Hence, it is imperative to create transport services that can adeptly meet the needs of passengers for the post-pandemic period.
Railway transportation, being the most ancient and economically viable mode of land travel, is well-suited for individuals belonging to low- and middle-income brackets [5,6]. However, in some countries, the rail transport system has not yet developed standards and services that adequately meet the expectations of these users, particularly in developing nations [6]. Thailand, as a rapidly developing country, is currently experiencing significant social, economic, and industrial growth. Moreover, Thailand serves as a central hub for transportation and tourism in Southeast Asia [7]. Given these factors, Thailand represents an appropriate location for studying user expectations regarding rail transport service quality. Unfortunately, Thailand is currently grappling with a decline in public passenger rail transportation, which has led to a consistent reduction in revenue at an approximate rate of 2 percent per annum since 2017 (Figure 1). While these figures may not seem alarming in absolute terms, this trend runs counter to the developmental goals set by the State Railway of Thailand. The situation was further exacerbated by the onset of the COVID-19 pandemic, which had a profound impact on train services. During the period of 2020–2021, the average number of intercity train passengers across Thailand plummeted by a staggering 28% and 64%, respectively. Despite the passing of the pandemic, passenger numbers have yet to recover to the expected levels (2022). Thailand’s railway report attributes this decline to a decrease in passenger satisfaction with the service and concern about the potential risks of future outbreaks [8]. Examples of issues in the Thai rail transportation system include service insecurity, unsafe train and track conditions, delays, and uncleanliness inside the trains, among others [5]. In order to address these problems and develop quality and service improvement indicators for the rail transport system, it is essential to establish principles and indicators that are contextually appropriate for the study area.
The literature review underscores the significance of establishing appropriate quality indicators for the railway transport system to promote the application and enhancement of service quality. Within the realm of transportation services, two widely recognized concepts are prevalent. The first is the traditional service quality concept, encompassing factors related to general measures such as accessibility, infrastructure, pricing, information, and vehicles, among others. These factors have been employed in numerous research studies pertaining to transport systems, exemplified by the work of Eboli and Mazzulla [9] and Ibrahim et al. [10]. The second concept, SERVQUAL model, consists of tangible, reliable, responsiveness, assurance, and empathy. It has recently garnered popularity for its ability to enhance the quality of public transportation services [11,12]. Despite the potential for both of these concept measures to contribute to the development of service quality, there has not been a study that combines both concepts within the same research framework. Consequently, introducing a fusion of these two concepts may serve to leverage their respective strengths while mitigating their weaknesses. This approach can lead to the refinement and increased efficiency of quality standard indicators for railway services, rendering them more comprehensive and effective.
Furthermore, numerous studies have shed light on the significance of exploring disparities between urban and rural settings, yielding compelling findings [13,14]. Previous research has highlighted a notable disparity in population composition between urban and rural regions, which could have implications for public transport usage. This inequality may stem from disparities in access to transportation. Berg and Ihlström [15] found that rural areas tend to have low population density and limited access to public transport compared to urban areas. Consequently, rural dwellers have fewer opportunities to engage in regular relationships and activities. McDonagh [16] further emphasized that limited transportation options act as a barrier to accessibility and perceived service quality, particularly for individuals residing in rural and sparsely populated areas. Furthermore, the study conducted by Grisé and El-Geneidy [17] on the development of urban and rural regions revealed notable disparities. One aspect of this problem is reflected in the quality of the rail transport system, and enhancing the quality of trains according to the specific needs of each area can contribute to improving the quality of life and economy of rural communities. In Thailand, an official statistical report on passenger satisfaction and loyalty for intercity rail services [18], uncovered noteworthy differences between passengers who accessed rail services at urban and rural stations. The report highlighted variations in satisfaction levels related to service quality. The findings elucidated that rural (or suburban) commuters expressed satisfaction with various aspects of the service, encompassing stations, punctuality of trains, vehicle conditions and quality, the performance of staff, and ticket selling channels. In contrast, urban or metropolitan passengers primarily reported satisfaction with punctuality, staff, comfort, and safety. These disparities in satisfaction ratings provide valuable insights that warrant further investigation. Despite the fact that the intercity rail transport service system in Thailand operates under the same network supervised by the State Railway of Thailand, the discernible spatial disparities, variations in population density, divergent travel demands, and other distinctive regional characteristics can lead to differences in the operation and procedures governing rail service quality. These disparities subsequently influence the perceptions of quality and service held by users. Furthermore, it is essential to acknowledge that perceptions of rail transport service quality are not solely shaped by the experience of using the service but can also be significantly influenced by the socioeconomic characteristics of passengers. Consequently, it is evident that individuals in diverse geographical areas possess distinct needs and attitudes toward the quality of rail services. Neglecting to investigate this issue comprehensively could result in the omission of valuable insights and incomplete research outcomes. Acknowledging the disparities in user expectations for railway service quality in urban and rural areas emerges as an imperative consideration.
In light of the identified research gaps, both of which were discerned through a comprehensive review of the existing literature, it becomes evident that these gaps present an opportunity for achieving a more comprehensive understanding of the development of train service quality for the post-epidemic period. Consisting of the integration of service quality indicators and the unique variations in different urban and rural contexts, the primary contribution of this study lies in its proactive approach to addressing these gaps. This involves two key facets: (1) The application of both traditional service quality concepts and SERVQUAL to enhance the quality of rail services in the post-epidemic period. This is accomplished through the utilization of confirmatory factor analysis (CFA); (2) The analysis of disparities between distinct user groups, both within urban areas and outside them. This multi-group analysis is employed to investigate whether expectations regarding the quality of railway transport services can be categorized based on the contextual factors associated with the area of service. The outcomes of this study are poised to serve as a valuable guideline for the development of services tailored to the specific needs and perspectives of service users. Furthermore, the application of multi-group analysis has the potential to uncover spatial disparities or distinctive user groups. Consequently, service providers can formulate policies and strategies that effectively accommodate the evolving needs and trends of users in the post-pandemic era, while also taking into account the differences between urban and rural areas. This approach aims to render train transport services more efficient and sustainable, ensuring their resilience in the face of unprecedented challenges.
The remainder of this study is structured as follows: Section 2 outlines the research indicators and relevant studies that serve as the theoretical foundation for this investigation. In Section 3, we delve into the methodological approach, encompassing questionnaire design, data collection procedures, and a detailed analysis of respondents’ characteristics. Section 4 is dedicated to presenting the results derived from the statistical analysis. Section 5 offers an insightful interpretation of the obtained results, shedding light on their implications and significance. The final section, Section 6, draws the study to a conclusion, summarizing key findings and outlining potential avenues for implementation and future research.

2. Literature Review

This study reviewed service quality concepts for intercity rail service and found two concepts that could be integrated to improve the quality of rail service, as follows:

2.1. Traditional Service Quality

The traditional railway transport service indicators encompass a range of critical factors that are vital for the efficient and effective functioning of railway systems [10,19]. Their importance has been further accentuated in the context of the COVID-19 pandemic. We explore the necessity or duty of certain indicators and their association with the pandemic below:
Accessibility is a fundamental aspect of railway transport. Ensuring that railway services are easily accessible to the population is not only a matter of convenience but also a public duty [20]. Infrastructure: A well-maintained and modern railway infrastructure is essential for providing reliable services [21,22]. Pricing is crucial for railway transport, ensuring accessibility for a wide range of passengers, including those with limited financial means. During the COVID-19 pandemic, economic challenges intensified, making affordable transportation even more critical. The findings of Yang et al. [23] indicate that passenger demand is influenced by factors such as reasonable or lower fare prices. Timely and accurate information is crucial for passenger safety and satisfaction. During the pandemic, passengers needed up-to-date information on service changes, safety measures, and travel advisories. Safety has always been a paramount concern in railway transport, and the pandemic heightened the importance of this factor. Safety is an essential task for the passenger transport enterprise, and passengers often select the transport enterprise which is safer according to their experience [19,24]. General service is essential for passenger satisfaction. This encompasses factors such as timely scheduling, efficient ticketing channels, and the availability of food and amenities [24]. During the pandemic, passengers needed reliable and safe service more than ever. The quality of staff, including their training, professionalism, and responsiveness to passenger needs, contributes significantly to the overall passenger experience. Shen et al. [19] stated that staff not only contains regular employees of rail transit operation companies but also includes security personnel and cleaners. In times of crisis like COVID-19, passengers look to staff for guidance and reassurance. Railway operators have a responsibility to invest in staff training, especially regarding health and safety protocols. Maintaining a fleet of well-functioning and sanitized vehicles was essential for public safety and confidence. Regular maintenance and sanitation of vehicles became a heightened priority [21]. Railway stations serve as important transportation hubs and centers for social interaction. The responsibility of ensuring the safety of these stations and their compliance with public health guidelines has gained significant importance during the pandemic. The findings of Jomnonkwao et al. [5] suggest that the quality of infrastructure and station facilities can serve as indicators of good service. In summary, these traditional railway transport service indicators are not only essential for providing efficient and reliable railway services but also for ensuring the safety and well-being of passengers and staff, particularly in the face of challenges like the COVID-19 pandemic. Recognizing their association with the pandemic underscores their importance in shaping the future of rail service in the post-epidemic situation.

2.2. SERVQUAL

This concept was developed by Parasuraman et al. [25] and suggests five key elements of service quality, as follows:
Tangibility: This concerns the facet of business that encompasses the tangible elements of its facilities, equipment, personnel, and communication materials. The findings of Sama et al. [26] emphasized that the importance of tangible services has increased, especially in the post-pandemic context. Reliability is a crucial element of service quality, referring to the consistent and accurate provision of promised services. Wan et al. [27] expounded on the significance of reliability components in public transport, as they greatly contribute to overall service performance. In the post-pandemic era, the importance of reliability is amplified within rail transport services. Responsiveness is willingness to help customers and provide prompt service. This principle is substantiated by research findings from Huang et al. [28] and Sama et al. [26], which underscore the significance of responsiveness as a key indicator of rail service quality. Assurance encompasses the expertise, politeness, and competency of staff members, all of which play a role in establishing trust and instilling confidence in customers. Nguyen-Phuoc et al. [29] have highlighted the critical importance of providing a safe public transportation environment in shaping passengers’ loyalty intentions. The COVID-19 situation has intensified users’ worries regarding safety and well-being while traveling. Empathy refers to a firm’s capacity to deliver customer care and attention. The research findings by Hamzah et al. [30] emphasize the importance of empathy as a distinct and crucial element of service quality. It plays a central role in enhancing passengers’ satisfaction with railway services in the post-epidemic period. In conclusion, it is crucial to acknowledge that SERVQUAL collectively exerts a significant impact on users’ experiences, particularly within the post-COVID-19 scenario.

2.3. Related Studies on Rail Transportation Services

Within the domain of rail transportation service quality, numerous models have been put forth in order to assess the levels of service as perceived by passengers utilizing rail services. These models often revolve around two-dimensional concepts, namely, traditional service quality and SERVQUAL [25]. An overview of these models, which reflect the perceived service quality of railway users, is provided in Table A1, showcasing their presence in the existing body of literature. Table A1 offers a summary of the literature reviewed pertaining to structural factors or indicators within the context of railway services over the past decade (2014–2023). A significant portion of the articles predominantly concentrated on either one side (the traditional indicators) or the SERVQUAL model. The outcomes of these related studies highlight certain limitations concerning passengers’ perceived service quality. However, it is worth noting that there are variances among the individual sub-indicators of the two-dimensional concept. Consequently, disparities persist among the indicators themselves. The position of the present study, in conjunction with the existing literature, is rooted in its objective to address the gaps identified through the literature review. These gaps encompass not only limitations in the service quality indicators but also research areas that warrant further exploration. To bridge these gaps, this study endeavors to amalgamate various rail service quality models, thus offering a more holistic range of service quality indicators. Additionally, through multigroup analysis, this study aims to elucidate disparities in the perceived quality of rail services based on the context of different areas.

3. Methods

3.1. Questionnaire Designs

The research questionnaire consists of two main sections that address pertinent aspects of the study. The initial section covers general sociodemographic information, whereas the rest investigates factors impacting the quality of rail transportation services, particularly within the unique circumstances of the post-pandemic era. In Section 1, the questionnaire gathers data on respondents’ general information, encompassing variables such as age, gender, occupation, salary, and travel preferences, among others. This section serves a twofold purpose: firstly, it aids in characterizing the nature of the respondents and delineating their demographic profiles, and secondly, it facilitates the description of the distribution of the sample. These sociodemographic details provide valuable insights into the characteristics of the survey participants, offering a foundation for subsequent analyses.
Section 2 is focused on the identification of relevant variables by incorporating component indicators derived from both general service indicators and the SERVQUAL model, as informed by previous research. These variables are subsequently repositioned within the framework for evaluating the factors that influence the quality of rail transport services. Within the latent variable of the SERVQUAL model, an assessment is made of five crucial dimensions: tangibility, reliability, responsiveness, assurance, and empathy, resulting in a total of 19 observable indicators. Likewise, the general service indicators comprise 25 observed indicators, encompassing categories such as accessibility, infrastructure, price, information, safety, general service, staff, vehicles, and stations, as outlined in Table A2. Furthermore, in alignment with the research objectives, the questionnaire is tailored to elicit responses related to service quality in a post-pandemic scenario. All the questions within this section employ a 7-point Likert scale [31], the content of the questionnaire and items were validated and passed by the index of item-objective congruence (IOC) of three experts in service quality research.

3.2. Intercity Rail Link and Selected Criteria

The focus of this study centers on the domain of intercity rail transportation, specifically within the framework of the State Railway of Thailand. The Thai intercity train network is divided into four primary routes, known as the Northern, Northeastern, Eastern, and Southern lines, collectively covering 47 out of the country’s 77 provinces, accounting for approximately 61.04% of the nation’s territory. In Thailand, there are a total of 442 intercity rail stations, which encompass 48% of all administrative districts [32]. The Northern Line boasts a comprehensive network, spanning 10 provinces and covering a total distance of 751 km. It encompasses 22 main stations, both urban and rural in nature. The Northeastern Line is subdivided into two primary segments, each with respective lengths of 575 km and 624 km, extending through 12 provinces and connecting with a total of 27 main stations. The Eastern Line also features a dual division, spanning 131 km and 255 km in length and serving 4 provinces, with access to 11 main stations. The Southern Line provides extensive coverage across 14 provinces, with a combined length of 945 km, and includes a network of 37 main stations. The train services operating on these lines can be categorized into 7 principal types, all powered by diesel engines. These types include special express trains (operating at speeds of 120 km/h with 10 trains in operation), express trains (traveling at speeds of 90–100 km/h with 9 trains), rapid trains (with similar speed characteristics, also operating at 90–100 km/h, with 17 trains in service), ordinary trains (operating at 90 km/h with 27 trains), commuter trains (reaching speeds of 120 km/h with 12 trains), local trains (traveling at 90 km/h with 24 trains), and excursion trains (operating at 90 km/h with 4 trains). According to the most recent passenger statistics provided by the State Railway of Thailand in 2022, the total number of passengers using these rail services amounted to 17.55 million. The distribution of passengers across the lines revealed that the Southern Line catered to the highest percentage at 28.38%, followed by the Eastern Line (25.57%), the Northeastern Line (23.65%), and the Northern Line (22.40%), respectively. The visual representation of the intercity rail network is illustrated in Figure 2.
However, the acquisition of data pertaining to the service quality of all these stations is limited in scope. Consequently, this research aims to assess the quality of rail transport services offered by the country’s principal and prospective railway stations, which are under the purview of the State Railway of Thailand [33]. In light of the rail network distribution presented in Figure 2a, this study has systematically identified study areas (data collection sites) with significant potential for enhancing the quality of rail transport services in a post-pandemic context. This selection was based on considerations such as tourism volume and the frequency of train operations. In order to ensure that the collected samples are representative of rail users across the country, this study adopted a methodical approach. We chose to gather questionnaire data from the first four provinces with the highest passenger volumes for each rail line. The Northern line encompasses Chiang Mai, Lampang, Uttaradit, and Phitsanulok. The Northeastern line includes Nong Khai, Khon Kaen, Nakhon Ratchasima, and Ubon Ratchathani. The Eastern line comprises Prachin Buri, Sa Kaeo, Chachoengsao, and Chon Buri. Lastly, the Southern line is made up of Phetchaburi, Prachuap Kiri Khan, Surat Thani, and Nakhon Si Thammarat, totaling 16 provinces in all. Furthermore, in alignment with the research objectives aimed at capturing the variations in attitudes between rural and urban rail users, data were collected from two stations per province (considered station presented in Figure 2b). In addition to station location, trip frequency per day was utilized as a criterion for classifying urban and rural areas, following the categorization provided by the State Railway of Thailand [33]. Urban stations were characterized by an average schedule frequency of over 10 trips per day, whereas rural stations had less than 10 trips per day. This is in accordance with the average trip frequencies observed in this study, where urban stations averaged 15 trips per day, while rural stations averaged 8 trips per day. Expanding on the significance of location and trip frequency, it is worth noting that the core systems and operational standards for urban and rural stations remain largely consistent, given their shared location on the same railway network. Nevertheless, we cannot disregard the fact that users’ overall perception of service quality is influenced by factors such as station popularity and the travel demand experienced by each station. Therefore, conducting a comprehensive study on the service quality expectations of railway users is crucial for developing service quality measures from the user’s perspective.

3.3. Data Collection and Sampling

To attain an appropriate sample size for this study, Golob, T.F. [34] has recommended sampling methodologies suitable for factor analysis. According to Pituch and Stevens [35], this approach is based on the principle that the sample size needed to estimate the maximum probability should be a minimum of 15 times the number of observable variables. Given that the current study involves 44 observed variables, resulting in a requisite sample size of 660 individuals (44 multiplied by 15).
In this research, the samples encompassed railway service users, specifically passengers at both urban and rural stations. During the data collection phase, meticulous efforts were made to ensure representation across Thailand’s four rail transportation routes. As previously mentioned regarding the minimum requirement, the study successfully garnered responses from 1600 participants. Among these, 665 respondents originated from urban stations, while 935 respondents hailed from rural stations. It is noteworthy that the data collection process was conducted via face-to-face interviews administered by academic staff. This approach was chosen to guarantee that the respondents fully comprehended the research proposal and questionnaire details, thereby enhancing the overall quality of data obtained. An overview of the respondents’ demographic characteristics is presented in Table 1. It is essential to highlight that this research adhered to ethical guidelines and was duly approved by the Suranaree University of Technology Institutional Review Board (COA: 83/2565, 20 October 2022).

3.4. Statistical Method

3.4.1. Confirmatory Factor Analysis (CFA)

To validate the correlations among the components derived from the service quality indicators, encompassing both general factors and SERVQUAL [25], we employed CFA. CFA, originally developed by [36], serves as a tool to establish the consistency of measurements with the scholarly understanding of associated factors. The primary aim of confirmatory factor analysis (CFA) is to evaluate the degree of alignment between the gathered data and the research hypotheses, as outlined by [37]. These analytical processes were carried out utilizing the Mplus 7.2 software.
To evaluate the appropriateness of the component data, we subjected the results of each indicator’s model to rigorous statistical testing. To this end, we relied upon the criteria proposed by Fornell and Larcker [38] as well as [39], which involve the assessment of the average variance extracted (AVE) and composite reliability (CR) values. In order to achieve a valid fit, both the AVE and CR values should exceed the respective thresholds of 0.5 and 0.7. These critical statistical values can be computed using Equations (1) and (2), as outlined below:
A V E = i = 1 n λ i 2 n ,
C R = ( i = 1 n λ i ) 2 ( i = 1 n λ i ) 2 + ( c = 1 n δ i )
where λ i denotes the component loading of each indicator and δ i represents the error terms.

3.4.2. Multigroup Analysis

Multigroup analysis involves applying the same model to respondents with differing characteristics, such as gender or culture, and subsequently comparing it with models that possess an identical structure. As elucidated by Brown [40], multigroup analysis represents a widely employed method for determining the validity of a structural equation model (SEM) or CFA. The primary aim of the initial part of the questionnaire was to assess the equivalence between two groups or measurement invariance [39]. The second part was designed to compare the measurement models or engage in cross-validation by contrasting various CFA parameters. These parameters include the number of constructs, factor loadings, indicator means, and covariances.
To assess these comparisons, statistical values such as the chi-square difference (Delta– χ 2 ) and differences in degrees of freedom (Delta– d f ) were employed. This analysis aims to test the multi-group confirmatory factor analysis (CFA), which has been noted for its sensitivity in detecting measurement invariance. Significant differences identified through these statistics were used to ascertain non-invariance between the two models [39]. The application of multi-group analysis in the context of rail transport service quality permits the examination of the same model in distinct populations, specifically urban and rural societies. The objective is to determine whether differences exist between these populations, resulting in two sets of comparisons.

3.4.3. Model Statistical Fit

To ensure the accuracy and adequacy of the model, the analysis must consider various statistical measures that evaluate the model’s capability to elucidate the investigated relationships. These values include the chi-square per degree of freedom ( χ 2 / d f ) , which ideally should not exceed 5 in the initial evaluation [41,42]. Moreover, it is imperative that the root mean square error of approximation (RMSEA) remains under 0.07, as recommend by Steiger [43], to signify a satisfactory fit. The Tucker-Lewis index (TLI) serves as an alternative gauge of model fit, which should be equal to or greater than 0.80 [44]. The comparative fit index (CFI) for the model should be equal to or greater than 0.90, while the standardized root mean square residual (SRMR) should be equal to or less than 0.08 [45,46]. These statistical testing values can be calculated using Equations (3)–(6), as outlined below.
S R M R = i k r j k p * ,
R M S E A = χ T 2 d f T d f T ( N 1 ) ,
T L I = 1 max [ χ T 2 d f T , 0 ] max [ χ T 2 d f T , χ B 2 d f B , 0 ] ,
C F I = χ B 2 d f B χ T 2 d f T χ B 2 d f B 1
when r j k represents standardized residuals derived from a covariance matrix comprising j rows and k columns, and p * denotes the count of non-repeated elements within this covariance matrix, the χ T 2 χ 2 values pertain to the target model, d f T = d f the target model, χ B 2 χ 2 values of the baseline model, and d f B = d f of the baseline model.

4. Results

4.1. Preliminary Statistics

To ensure the standardized distribution of the model and confirm that the representative sample in this study is suitable for analyzing the key measurements of rail operation services in the post-epidemic period using CFA, preliminary analysis of respondents is imperative. Table A2 presents the descriptive statistics, encompassing the mean, standard deviation, skewness, kurtosis, and reliability test, segregated by study area (urban and rural rail stations). These statistics were derived from the questionnaire responses across nine groups of general indicators, which include accessibility, infrastructure, price, information, safety, general service, staff, vehicle, and station, as well as the five elements of SERVQUAL: tangibility, reliability, responsiveness, assurance, and empathy. The examination of descriptive statistics aimed to assess the normal distribution of the data. According to [37], a desirable skewness should fall within the range of −2 to 2, while kurtosis should range between −7 and 7. Furthermore, as per [47], reliable data should exhibit a Cronbach’s alpha value of 0.7 or higher. The statistical values in all four groupings were within acceptable ranges for analysis.
Analyzing the sample statistics, the mean values for each indicator among rural and urban respondents shed light on the factors of greatest concern to passengers. For urban users, pricing appears to be the focal point of passenger intent. Notably, “the ticket price is reasonable and tangible at any time” emerged as the highest-scoring factor (mean = 5.25) among urban users’ priorities for quality of railway service in the post-epidemic period. Conversely, accessibility was a significant influence for rural passengers. “Railway stations should provide additional services to facilitate station access for the disabled and the elderly during the epidemic” emerged as the highest-scoring factor (mean = 5.33) among rural passengers’ priorities. As discussed earlier, these initial statistics provide insight into passengers’ primary concerns. However, further in-depth analysis is required to thoroughly examine these disparities. This study intends to employ Multigroup CFA to investigate these differences.
Furthermore, in order to verify the distinction in CFA analysis for rail transportation service quality between urban and rural areas, an invariance test between the two models must be conducted. Table 2 provides detailed comparisons of parameter estimates between the measurement models for the same two characteristics as in the CFA, but encompasses different characteristics of the population groups (urban and rural areas). The statistical model for invariance measurement yielded the following fit statistics for the simultaneous model: χ 2 (1602) = 4959.97, χ 2 / d f = 3.10, CFI = 0.935, TLI = 0.923, RMSEA= 0.052, and SRMR = 0.044. For the model (with loadings, intercepts, and paths held equal across groups), the values were as follows: χ 2 (1676) = 5178.96, ( χ 2 / d f = 3.09), CFI = 0.932, TLI = 0.923, RMSEA= 0.052, and SRMR = 0.049, respectively. The Delta– χ 2 (74) = 218.99. These values were assessed in terms of statistical significance, which was set at the 0.01 level. As the null hypothesis was rejected based on the significance level, the service quality model unequivocally indicated that the population groups (urban and rural) differed significantly.

4.2. Confirmatory Factor Analysis Results

As previously defined, the statistical test of fit indicated differences in terms of variations or characteristics as perceived by rail transport users. Consequently, an analysis of the disparities in railway transportation services is warranted. The present conducted an analysis of key measurement indicators of the rail service for the post-epidemic using multigroup CFA. The results in this section are presented separately for two models representing urban and rural areas, confirming the distinct characteristics of rail transport quality as perceived by users in these contexts. We utilized Multigroup CFA to evaluate the appropriateness of indicators obtained from railway users related to latent factors, which encompass general indicators and the SERVQUAL model (using Mplus 7.2 software). The results indicated that all indicators significantly measured rail service quality in the post-pandemic scenario for both urban and rural areas (p-value < 0.01). Additionally, the AVE and CR are greater than 0.5 and 0.7, respectively, as previously established in the literature [38]. Prior research has confirmed that these values are considered acceptable. The model fit statistics, as displayed in Table 2, demonstrate a robust congruence between the models.
According to Table A3, all questionnaire items can be used as measurements of intercity railway transport service quality with a significance level of 0.01. In the urban model, the results illustrate that “accessibility” was the most important factor (β = 0.932) contributing to urban rail service quality from the perspective of urban users. ACC4, which pertains to a station’s easy accessibility in any situation, was the most influential factor in explaining service accessibility. Following closely was “empathy” (β = 0.927), with EMP1 (“The staff are individually attentive, regardless of whether problems arise in any given situation”) emerging as the most influential factor. Infrastructure (β = 0.926) also played a significant role, with INF1 (“The station has facilities for the disabled and the elderly, such as ramps and handrails”) identified as the most representative indicator. Safety (β = 0.921) was another crucial dimension, and the presence of enough officers or employees to ensure safety was the most influential factor. The following factors are presented in Table A3.
Conversely, the results of the rural model shed light on crucial insights from the perspective of intercity rail users regarding service quality. As indicated, railway staff emerged as the most vital factor for rural users (β = 0.932). Among staff indicators, STF1 (“Staff provide service with speed and agility all the time”) was identified as the most representative indicator in this context. Following staff performance, pricing considerations were also significant for rural rail users, with “PRI1” (“The ticket price is reasonable and tangible at any time”) emerging as the most crucial indicator within the price factor of service quality. Additionally, the rest of the factors are presented in Table A3.

5. Discussion

5.1. The Key Indicators for Improving Urban Rail Service for Post-Pandemic

Regarding the urban model (as depicted in Figure 3), the aspect of “accessibility” stands out as of utmost importance from the perspective of urban users. Even in the aftermath of a major epidemic, improvements in service quality or cleanliness of urban transport can be effectively implemented. However, if the service points or stations remain a challenge to access during abnormal situations, it is likely that passenger demand will decline. The accessibility indicator with the highest factor loading signifies the concerns of rail transport users regarding the significance of connectivity from diverse locations to the train station, particularly in unique or unusual situations, which urban users’ views revealed that this performance was not yet effective enough. Given that railway stations are relatively limited in number compared to other public transportation hubs, such as bus terminals, enhancing ease of access and developing facilities, such as expanding the range of transport feeder modes to improve accessibility to rail transport services, is a matter that users are keenly aware of. Consequently, the quality of accessibility emerges as a pivotal indicator for enhancing the quality of train services, especially within urban areas. This finding is consistent with the perspective put forth by Jamei et al. [20], who underscored the significance of perceived accessibility as a critical indicator in the development of public transport. Subsequently, the factors of “infrastructure” and “safety” gained prominence. It is undeniable that these two indicators constitute fundamental elements within any public transport system, particularly in the wake of the COVID-19 outbreak. The behaviors and attitudes of passengers have undergone transformation, with increased emphasis on cleanliness and safety shaped by the post-pandemic landscape [2,3]. The higher scores of expectations for rail service infrastructure indicated that the standard performance of facilities might not meet the users’ needs. Hence, the modernization of infrastructure and facilities within both stations and trains to align with contemporary technological standards is pivotal. This modernization not only unlocks the inherent potential of the rail system but also serves as a means to capture the interest and patronage of passengers. As a result, improvements in infrastructure, which include amenities designed to assist the elderly and disabled, coupled with the integration of cutting-edge equipment and the utilization of various technologies to simplify processes like seat reservations, ticket purchases, and payments, have the potential to elevate the quality of intercity train services. In the aftermath of the pandemic, passenger safety expectations are poised to escalate, encompassing considerations for life, property, and health, given the lingering impact of COVID-19. These factors are expected to establish a new benchmark for maintaining the safety of rail users even as the pandemic wanes. Consequently, investments in safety measures take on paramount significance. This includes the implementation of rigorous passenger screening protocols, the deployment of stable and precise thermometers, the installation of an adequate network of CCTV cameras both on-site and within vehicles to ensure safety, the provision of safety equipment for trains, and the cultivation of the requisite skills and support among staff to effectively manage unusual situations. The findings from research conducted by Eboli et al. [24] underscored the critical role of safety measures in public transport services, particularly within a post-pandemic context [4]. In the realm of the SERVQUAL concept, it becomes evident that urban users attach substantial importance to the aspect of “empathy”. Empathy, which is considered a cornerstone of exceptional service, pertains to a firm’s capacity to deliver caring and personalized attention to its customers [26]. Achieving this hinges on employee training aimed at providing exceptional and empathetic service, marked by individual attentiveness and an unwavering commitment to prioritizing passengers’ best interests [12]. Notably, research findings by Hamzah et al. [30] underscore the significance of empathy as a specific and pivotal component of service quality. Furthermore, several other factors emerge as noteworthy indicators of urban rail service quality, encompassing tangibility, responsiveness, general service, reliability, among others (as illustrated in Figure 3).

5.2. The Key Indicators for Improving Rural Rail Service for Post-Pandemic

However, the awareness of rural users regarding significant factors for enhancing rail transport quality in the new travel era slightly differs from that of urban users. Figure 4 illustrates the principal indicators for enhancing rural rail transport services, highlighting the paramount importance of the quality of railway “staff”. While rail service staff receive training that adheres to acceptable standards, a noticeable gap persists between the elevated expectations of rural users and the actual performance of railway staff. Pertinent research [15] underscores the prevalence of knowledge gaps and limited access as common challenges in rural areas, which can create hindrances, particularly in exceptional circumstances, for utilizing public transportation. Consequently, offering attention and support to rural users emerges as a significant asset in alleviating user concerns and significantly elevating the quality of railway services in the post-pandemic era. The findings of this study underscore users’ desire for employees capable of delivering swift assistance. The courtesy, competence, and quality of the company’s staff assume pivotal roles in providing support and disseminating information to passengers. This, in turn, serves to bridge the gaps between passengers and railway operators, thereby contributing to an overall enhancement of service quality. This interpretation aligns with the findings of [19]. Subsequently, “price” emerges as the next influential factor, emphasizing the significance of offering public transport tickets or products at reasonable and tangible prices to attract users in various circumstances. The matter of pricing exerts a significant influence on rural rail services, even though railway fares are standardized across the network and are determined by factors such as trip distance and the type or function of the vehicle [8]. However, rural passengers bear a greater burden of hidden costs associated with rail transport compared to their urban counterparts. It is essential to acknowledge that suburban and rural areas differ from urban areas in terms of demographics and income, as evidenced in Table 1. Furthermore, several studies have indicated that suburban populations typically have lower average incomes compared to their urban counterparts [48,49,50]. This income disparity can serve as a significant barrier to the use of rail services. Hence, it becomes evident that the formulation of policies aimed at establishing reasonable and affordable fares or introducing special promotions designed to attract rural users holds substantial importance in the pursuit of improving service quality within the given context. Machado-León et al.’s [22] research results substantiate the pivotal role of price as a key contributing factor in attracting users and advancing public transportation [23]. Additionally, the components of SERVQUAL and other general indicators (as depicted in Figure 4) assume importance in the enhancement of rural railway services after the epidemic.

5.3. Difference in Urban and Rural User Contexts

As indicated in the results presented in the previous section, the multigroup CFA conducted to assess rail transport service quality highlighted that users from both urban and rural settings harbor distinct expectations concerning the quality of rail service. These differing expectations may be attributed to a variety of factors, including local contextual variations. Numerous studies have underscored that distinctions in geographic context, encompassing urban and rural environments, correlate with disparities in population perceptions, expectations, needs, and behavioral characteristics [51,52,53]. According to the present study, urban areas have an abundance of pre-existing facilities and experience prevalent competition among various modes of public transportation. These areas tend to undergo efficient development across multiple domains, resulting in a more advanced and organized environment compared to rural regions [54,55]. Consequently, enhancing the quality of urban railways often involves expanding access limits and developing modern facilities and machinery, as previously discussed in Section 5.1. Increasing the convenience of access and developing modern equipment and tools will help the railway compete for market share in urban areas with high business competition. Conversely, rural areas typically exhibit lower levels of prosperity, income, and knowledge compared to urban counterparts. Therefore, the necessity for reasonable pricing and the presence of knowledgeable staff offering essential information can be instrumental in attracting users and promoting the improved quality of rural railway services, as previously mentioned in Section 5.2. This evidence can support the research findings that transport users in urban and rural contexts exhibit distinct attitudes and perspectives, which ultimately result in variations in their needs and service expectations in a post-pandemic scenario.

6. Conclusions and Recommendations

This study aimed to develop the quality of rail transport services in the context of post-pandemic era, which might differ in terms of users’ expectation, by examining the combination of general service quality indicators and SERVQUAL model [25]. Furthermore, this study captured how the perception of these factors were different between urban and rural areas to help the relevant authorities develop strategies and policies in accordance with the area context. Data were derived from 665 urban and 935 rural railway passengers. Analysis results indicated that general service quality indicators and SERVQUAL model were good representative measures of rail service quality for the post-COVID-19 situation. Model results of CFA confirmed that all observed indicators serve as legitimate measures of rail transport service. Additionally, these parameters demonstrate differences in priority between the contexts of service users’ areas. Moreover, we explored that the context of areas (urban and rural) plays an important role in representing passengers’ point of view. The findings illustrated that “accessibility” and “empathy” were the most influential measures for rail transport service in views of urban passengers, and “staff” and “price” represented the most concerns of rural passengers.
For practical implications, the findings provided related authorities (e.g., the Ministry of Transport (MOT), the State Railway of Thailand (SRT), etc.) with insight about the necessity of nine traditional factors and five elements of SERVQUAL. In the urban model, “accessibility” is the most important factor in the minds of rail users. Notably, the authorities should focus on improving rail transport access. This may involve making it easier to reach a station, enhancing connections to other modes of transport, and implementing various service strategies. Such measures can raise awareness among users that rail travel is easy and convenient to access [20]. Following accessibility, the factors of infrastructure and safety were also significant contributors. Relevant agencies need to develop safety levels whether it is about measures to prevent disease or crime. This will increase the confidence of service users. As discussed earlier, the heightened expectations in these aspects underscore the disparity between the current performance of rail transport and the requirements as perceived by service users. Promptly addressing these critical concerns is imperative for enhancing the implementation of urban rail services.
In contrast, the results of the CFA for rural areas revealed some differences in the aspects of rail users’ expectations compared to the urban model. The varying expectations observed in urban and rural contexts, as uncovered in this study, are influenced not solely by the quality of train services in each location but also by the demographic composition of passengers. In cases where service users are relatively scarce in a particular area, it can lead to heightened demands on various dimensions of service. Consequently, issues pertaining to the accessibility of rail services and their affordability give rise to a pronounced need for improvements in terms of “staff” and “price”. Therefore, rail agencies should pay attention to the quality of railway staff, including providing courteous and efficient service. Staff not only include regular employees of rail transit operation companies but also security personnel and cleaners [19]. During times of crisis, such as the COVID-19 pandemic, passengers rely on staff for guidance and reassurance. As a result, railway operators have a responsibility to invest in staff training, particularly in relation to health and safety protocols. In addition, when developing quality services, train operators should consider implementing reasonable pricing or ticket options while still maintaining a reasonable price base. These measures can enhance the perception of quality and care among rural users [23]. This confirms the importance of all measures (general indicators and SERVQUAL) for enhancing rail service quality post COVID-19. In terms of the methodology employed, the multigroup CFA provided valuable insights: incorporating multiple sample groups or utilizing multilevel models in the analysis can illuminate the intricacies of respondents’ perspectives within any research field. It is recommended that future studies consider incorporating cross-sectional studies, such as multigroup or multilevel analysis, to further explore and uncover significant findings.
As per limitations, this study focuses on intercity rail transportation, which restricts the generalizability of the finding to other transport modes. It is reasonable to assume that various users of transportation may harbor different viewpoints and dispositions regarding the country’s overall transport system. To mitigate this limitation, the inclusion of a wider spectrum of transportation modes can offer a more exhaustive comprehension of users’ attitudes. Furthermore, our study presented the key indicators of rail transportation in a singular dimension. In the future, it would be advantageous to employ multilevel analysis, as this approach allows for comparative evaluation of different policies between different area contexts, which may influence the expectations and perceptions of transport users.

Author Contributions

Conceptualization, methodology, data curation, formal analysis, writing—original draft preparation, P.W.; validation, writing—review and editing, T.C.; validation, software, S.J.; data curation, formal analysis, M.S.; data curation, formal analysis, K.T.; software, visualization; R.K.; software, supervision, V.R. All authors have read and agreed to the published version of the manuscript.

Funding

This work was supported by Suranaree University of Technology (SUT), Thailand Science Research and Innovation (TSRI), and National Science, Research and Innovation Fund (NSRF) (Project code: 179274).

Institutional Review Board Statement

The study was conducted according to the guidelines of the Declaration of Helsinki, and approved by the Ethics Committee of Suranaree University of Technology (COA: 83/2565, 20 October 2022).

Informed Consent Statement

Informed consent was waived for this study.

Data Availability Statement

The data presented in this study are available on request from the corresponding author.

Acknowledgments

We acknowledge and are deeply grateful to the participants who took part in this study.

Conflicts of Interest

The authors declare no conflict of interest.

Appendix A

Table A1. Summary of related study and indicators.
AuthorsLocationInfrastructureServiceStaffVehicleSafetyFareInformationTangibilityReliabilityAssuranceResponsivenessEmpathyMethod
Eboli and Mazzulla [9]Italy SEM
de Oña et al. [56]Italy Decision tree
Hundal and Kumar [11]India Gap analysis
Eboli et al. [24]Italy Fuzzy evaluation
Shen et al. [19]China SEM
Putra and Sitanggang [57]Indonesia Gap analysis
Machado-León et al. [22]Algeria IPA
Miranda et al. [58]Portugal Regression
Jomnonkwao et al. [5]Thailand EFA
Yuda Bakti et al. [59]Indonesia Hedonic model
Wang et al. [60]China SEM
Wonglakorn et al. [21]Thailand SEM
Ibrahim et al. [10]Malaysia Neural network
Shi et al. [61]China Evaluation method
Yang et al. [23]China Regression
Hidayat and Choocharukul [62]Thailand and Indonesia SEM
Gopal Vasanthi et al. [12]India Hierarchical regression
This studyThailandMultigroup CFA
Note: IPA = important performance-analysis; SEM = structural equation modeling; EFA = exploratory factor analysis; CFA = confirmatory factor analysis.
Table A2. Descriptive statistics.
CodesDescription (Cronbach’s Alpha)Urban (665 Respondents)Rural (935 Respondents)
MeanSDSKKUMeanSDSKKU
Accessibility (0.711)
ACC1The train station can be accessed in a variety of ways and has not encountered access problems during the epidemic.4.441.430.12−0.714.391.540.20−0.88
ACC2The station’s location is easily accessible in any situation.4.841.340.14−0.874.791.320.12−0.90
Infrastructure (0.920)
INF1The station has facilities for the disabled and the elderly, such as ramps and handrails.4.281.620.29−0.934.101.660.44−0.81
INF2Platforms are equipped with facilities or accessories for disabled and elderly people, such as ramps to board the train.4.231.500.36−0.654.071.650.40−0.80
INF3Stations and trains have state-of-the-art equipment and infrastructure.4.141.530.28−0.643.951.690.36−0.72
INF4The station has a suitable size and can accommodate a sufficient number of users.4.561.39−0.01−0.384.411.57−0.04−0.62
Safety (0.842)
SAF1Railway stations have appropriate screening measures for passengers, according to the situation.4.531.560.22−1.104.411.700.23−1.26
SAF2While traveling, the train has measures to prevent serious accidents or disease outbreaks.4.251.490.28−0.774.001.520.48−0.68
SAF3There are enough officers or employees to take care of your safety.4.191.510.27−0.763.991.550.37−0.81
SAF4Appropriate epidemic control measures are in place, such as cleaning the seats inside the train or building after each use.4.401.350.19−0.734.311.450.25−0.92
Price (0.798)
PRI1The ticket price is reasonable and tangible at any time.5.251.040.15−0.635.321.10−0.26−0.05
PRI2The price of train tickets is not too expensive to pay during the epidemic.5.201.070.04−0.475.321.03−0.04−0.34
General service (0.782)
SER1The travel schedule has a suitable frequency for every situation.4.770.990.200.364.791.05−0.191.04
SER2There are adequate and appropriate ticketing channels that are easily accessible at all times.4.901.060.130.184.901.110.090.11
SER3The price of food on the train is appropriate in every situation.4.781.110.050.484.831.08−0.060.62
Staff (0.830)
STF1Staff provide service with speed and agility all the time.4.891.18−0.150.425.011.140.16−0.18
STF2Staff provide courteous service every time.4.981.150.07−0.165.021.15−0.050.20
Vehicle (0.905)
VEH1The cabin has ample luggage space and is sufficient in any situation.4.211.540.34−0.773.981.550.42−0.70
VEH2Train seats and toilets are clean and comfortable, even under unusual circumstances.3.991.480.23−0.433.901.510.43−0.52
VEH3Windows and doors are in good working condition in all situations.3.881.450.41−0.333.721.510.57−0.33
Station (0.814)
STA1The station is clean all the time.4.751.51−0.03−0.844.541.530.01−0.77
STA2The station has ample and sufficient parking.4.691.43−0.28−0.214.431.62−0.14−0.57
Information (0.782)
IFO1Sufficient information on travel and epidemic prevention is provided while traveling by train.4.691.450.06−0.814.551.460.30−1.08
IFO2There are channels for complaints in every situation.4.671.360.38−1.034.731.490.29−1.30
IFO3Information on train services is readily available and accessible, even in unusual situations.4.841.250.28−0.724.821.320.10−0.77
Tangibility (0.875)
TAN1Railway personnel demonstrate clear and accurate communication in any situation.4.441.450.09−0.684.321.520.25−0.87
TAN2Schedules, information displays, etc. remain attention-grabbing, even in unconventional circumstances.4.401.470.15−0.624.281.580.26−0.82
TAN3Terminals and toilets are kept clean, even under unusual circumstances.4.291.450.16−0.514.221.510.33−0.68
Reliability (0.875)
REL1The train consistently adheres to its schedule, departing and arriving punctually under all circumstances.4.251.42−0.11−0.274.211.43−0.05−0.39
REL2Provide equitable service and refrain from exploiting passengers or users.4.511.350.04−0.384.461.43−0.02−0.53
REL3In the event of an issue, railway personnel demonstrate sincerity by resolving your problem.4.501.330.08−0.384.391.360.15−0.42
REL4The train did not experience any breakdowns throughout the journey.4.061.520.33−0.463.781.540.54−0.33
Responsiveness (0.882)
RES1Staff are happy to help immediately.5.001.110.14−0.054.971.050.150.16
RES2Staff is accessible for assistance and modifications, with advance communication.5.011.070.23−0.364.791.040.210.42
RES3The train staff are there to respond or assist you even when you are busy.4.911.110.23−0.204.821.060.160.13
RES4The staff provides service that is both prompt and efficient.4.961.110.24−0.094.891.050.130.57
Assurance (0.863)
ASS1Traveling via rail transport instills a sense of security, even when faced with uncommon situations.4.891.220.11−0.574.771.190.09−0.54
ASS2Railway employees are courteous in service.4.951.130.16−0.264.901.170.18−0.30
ASS3Employees have in-depth training and knowledge.4.951.090.33−0.324.861.06−0.050.47
ASS4The behavior of staff builds confidence in passengers.4.921.060.38−0.074.881.060.080.35
Empathy (0.789)
EMP1The staff are individually attentive, regardless of whether problems arise in any given situation.4.881.30−0.03−0.834.891.28−0.09−0.87
EMP2Rail transport proves convenient for all users, including children, the elderly, individuals with disabilities, and expectant mothers.4.821.280.03−0.664.741.320.02−0.74
EMP3The provider always consistently prioritizes the best interests of users.4.871.250.11−0.804.871.26−0.05−0.69
EMP4Rail operators make it easy to plan your trip.4.831.210.09−0.804.811.250.07−0.85
Note: SD = standard deviation; SK = skewness; KU = kurtosis.
Table A3. Model estimation results for multigroup CFA.
UrbanRural
CodesStd. Coef.Std. Errorp-ValueStd. Coef.Std. Errorp-Value
First-Order CFA
Accessibility [0.425] (0.964)Accessibility [0.465] (0.976)
ACC10.5650.036<0.0010.6720.023<0.001
ACC20.7280.027<0.0010.6910.022<0.001
Infrastructure [0.716] (0.995)Infrastructure [0.764] (0.997)
INF10.9140.015<0.0010.9190.007<0.001
INF20.8630.013<0.0010.8950.008<0.001
INF30.8440.014<0.0010.8780.009<0.001
INF40.7560.019<0.0010.8000.014<0.001
Safety [0.542] (0.990)Safety [0.552] (0.992)
SAF10.6330.025<0.0010.6340.021<0.001
SAF20.8180.017<0.0010.8040.014<0.001
SAF30.8340.016<0.0010.8240.013<0.001
SAF40.6350.025<0.0010.6930.019<0.001
Price [0.691] (0.987)Price [0.664] (0.988)
PRI10.8590.017<0.0010.8330.015<0.001
PRI20.8020.019<0.0010.7960.016<0.001
General service [0.521] (0.984)General service [0.599] (0.991)
SER10.5440.031<0.0010.7070.019<0.001
SER20.8650.018<0.0010.8590.013<0.001
SER30.7200.023<0.0010.7480.018
Staff [0.677] (0.987)Staff [0.906] (0.911)
STF10.8170.018<0.0010.8460.013<0.001
STF20.8290.018<0.0010.8340.014<0.001
Vehicle [0.658] (0.991)Vehicle [0.732] (0.995)
VEH10.8830.014<0.0010.8890.009<0.001
VEH20.7670.020<0.0010.8590.011<0.001
VEH30.7780.018<0.0010.8170.013<0.001
Station [0.692] (0.988)Station [0.931] (0.992)
STA10.8450.016<0.0010.8340.013<0.001
STA20.8190.017<0.0010.8750.011<0.001
Information [0.408] (0.975)Information [0.418] (0.980)
IFO10.5650.037<0.0010.5750.029<0.001
IFO20.6760.026<0.0010.6860.025<0.001
IFO30.6700.03<0.0010.6720.024<0.001
Tangibility [0.732] (0.994)Tangibility [0.748] (0.995)
TAN10.8580.014<0.0010.8540.011<0.001
TAN20.8600.015<0.0010.8540.011<0.001
TAN30.8490.014<0.0010.8860.009<0.001
Reliability [0.652] (0.994)Reliability [0.659] (0.995)
REL10.6850.022<0.0010.7670.015<0.001
REL20.8740.013<0.0010.8700.010<0.001
REL30.8690.012<0.0010.8800.009<0.001
REL40.7880.018<0.0010.7200.017<0.001
Responsiveness [0.694] (0.995)Responsiveness [0.604] (0.994)
RES10.8570.012<0.0010.8190.013<0.001
RES20.8260.014<0.0010.7140.018<0.001
RES30.8090.016<0.0010.7680.016<0.001
RES40.8390.014<0.0010.8040.014<0.001
Assurance [0.653] (0.994)Assurance [0.603] (0.994)
ASS10.7350.02<0.0010.6460.021<0.001
ASS20.8380.014<0.0010.8140.013<0.001
ASS30.8500.013<0.0010.8220.013<0.001
ASS40.8040.016<0.0010.8100.013<0.001
Empathy [0.512] (0.988)Empathy [0.492] (0.990)
EMP10.7690.022<0.0010.7590.019<0.001
EMP20.6340.027<0.0010.5840.024<0.001
EMP30.7620.020<0.0010.7180.019<0.001
EMP40.6880.026<0.0010.7310.020<0.001
Second-order CFA.
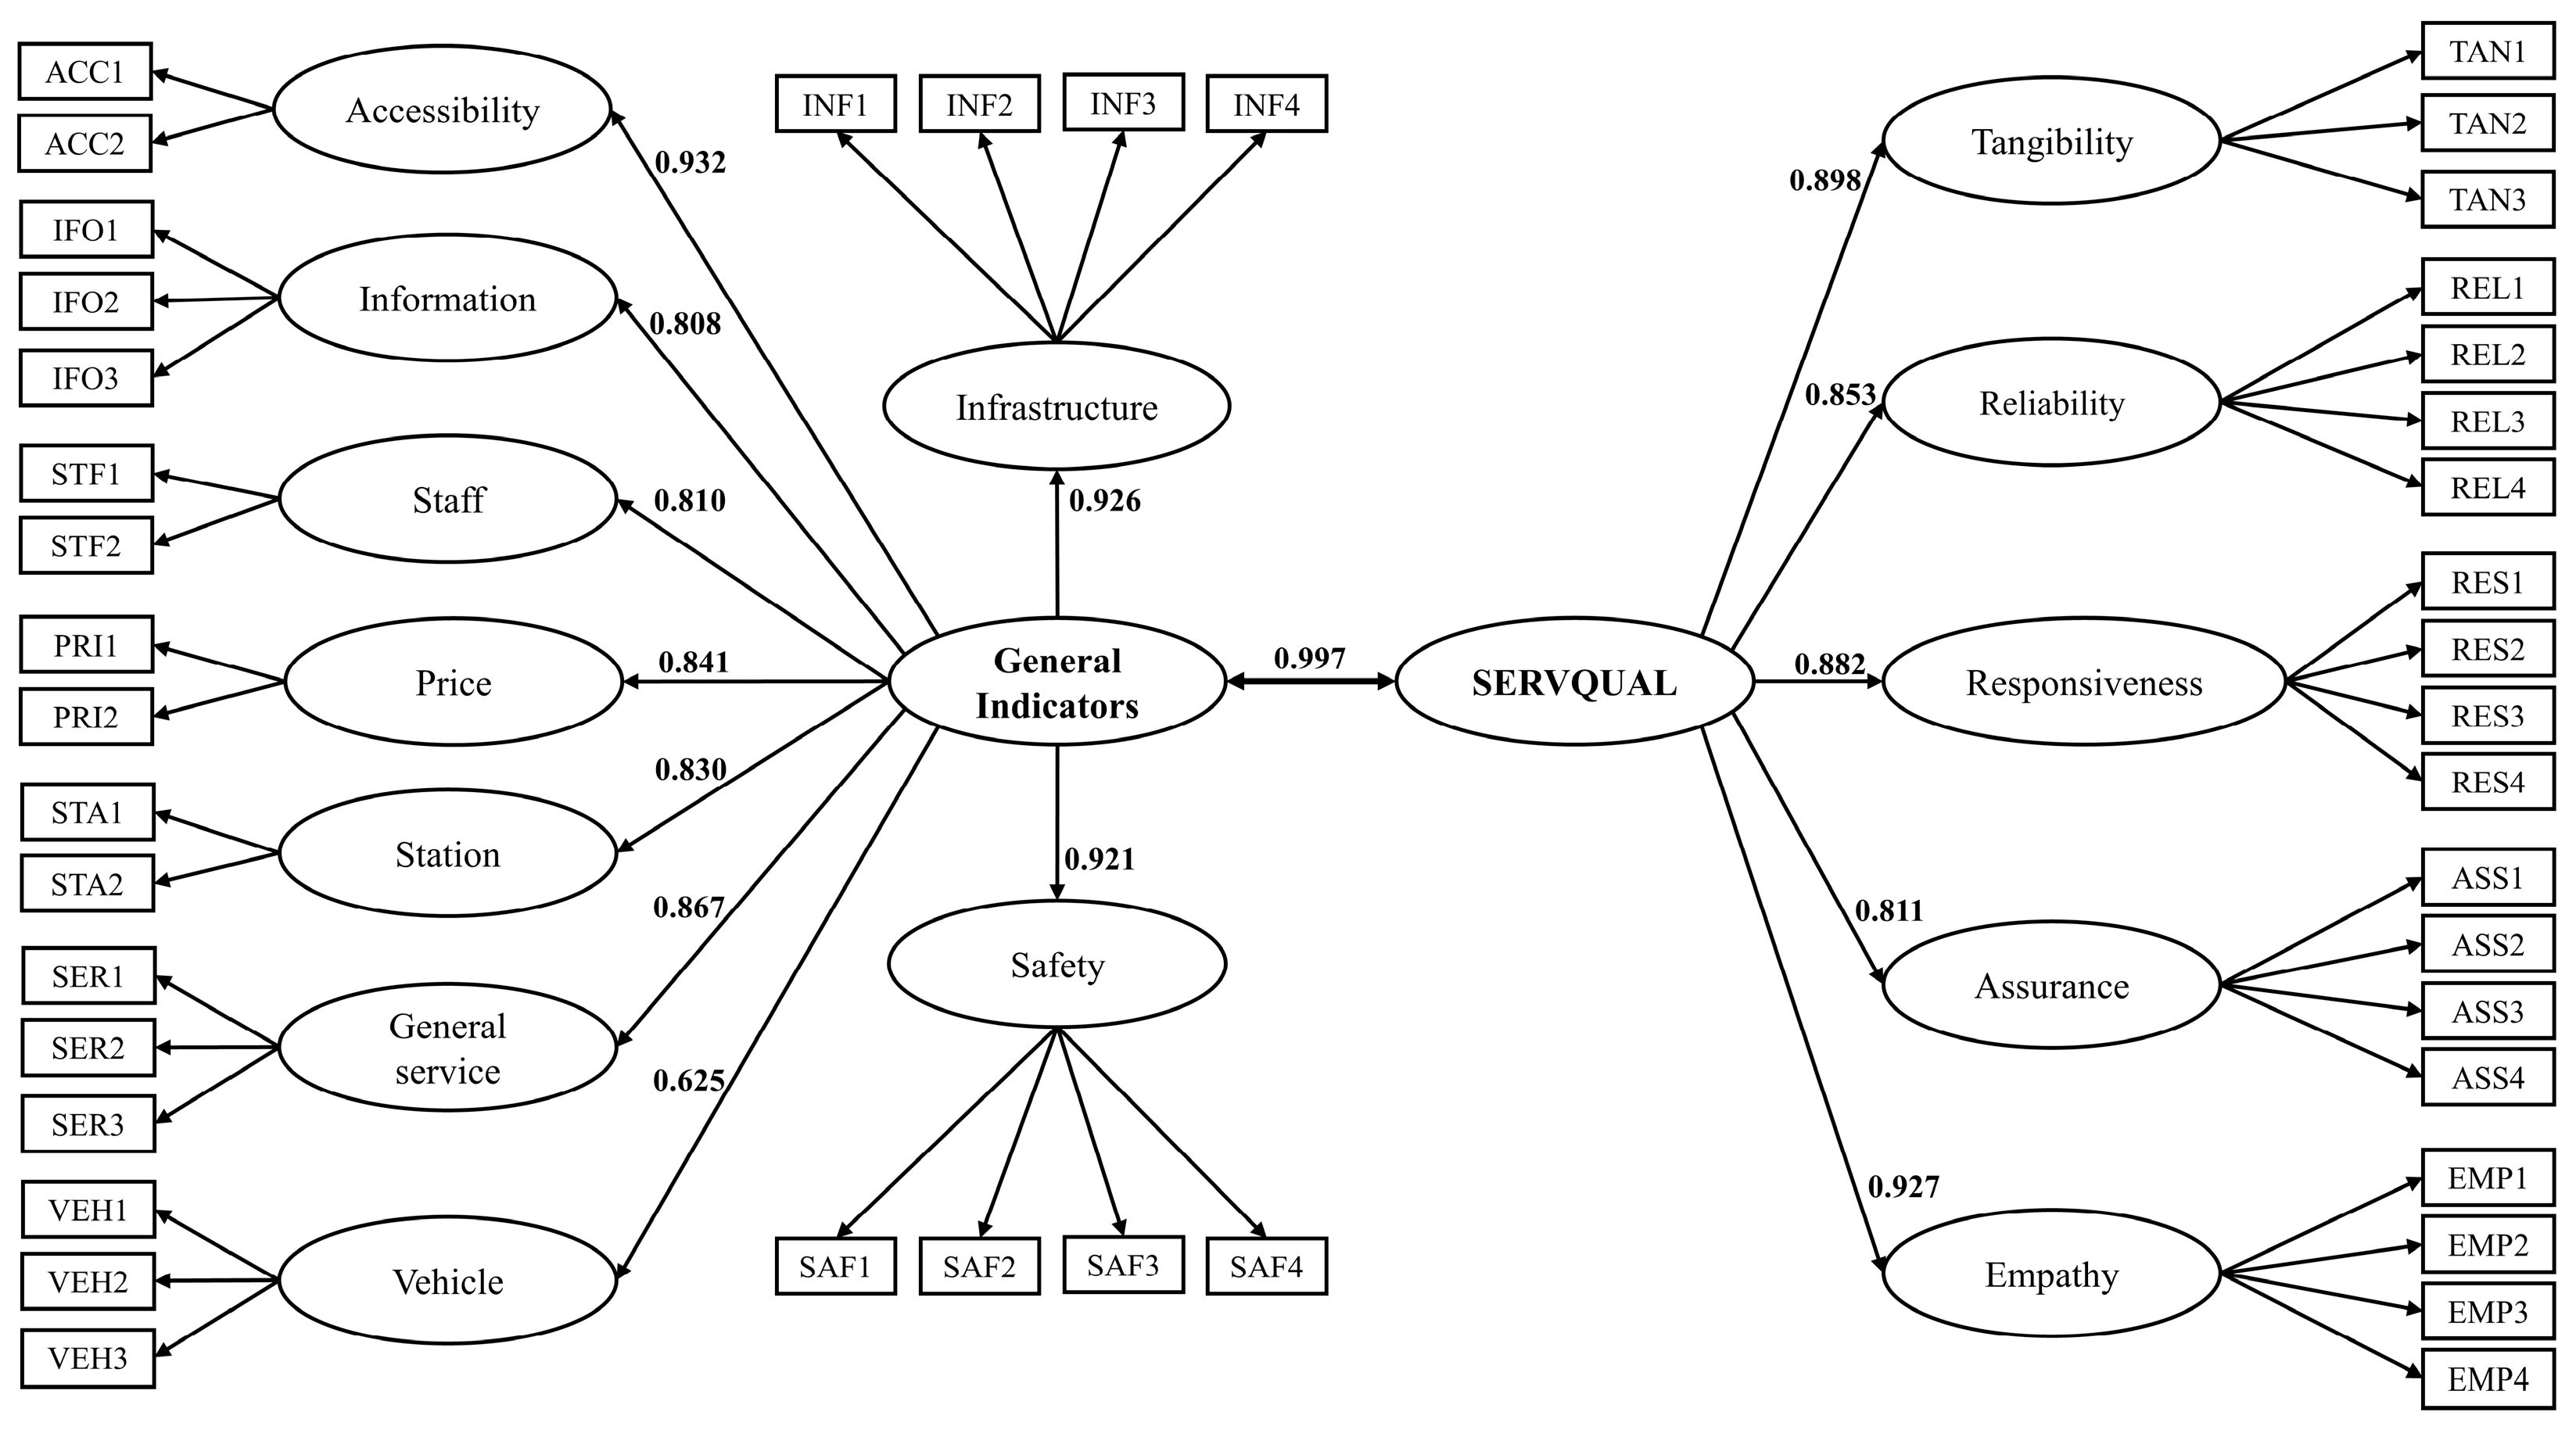
General Indicators measured by; [0.714] (0.995)General Indicators measured by; [0.775] (0.997)
Accessibility0.9320.037<0.0010.8530.024<0.001
Infrastructure0.9260.072<0.0010.8940.043<0.001
Safety0.9210.027<0.0010.8840.013<0.001
Price0.8410.034<0.0010.9140.024<0.001
General service0.8670.021<0.0010.8520.015<0.001
Staff0.8100.023<0.0010.9320.021<0.001
Vehicle0.6250.032<0.0010.8690.013<0.001
Station0.8300.024<0.0010.8800.013<0.001
Information0.8080.030<0.0010.8410.026<0.001
SERVQUAL measured by; [0.766] (0.994)SERVQUAL measured by; [0.716] (0.995)
Tangibility0.8980.021<0.0010.8320.023<0.001
Reliability0.8530.017<0.0010.8380.018<0.001
Responsiveness0.8820.035<0.0010.8450.017<0.001
Assurance0.8110.017<0.0010.8400.016<0.001
Empathy0.9270.026<0.0010.8750.018<0.001
Note: Std. Coef. = standardized coefficient; Std. Error = standard error; AVE presented in [bracket] and CR presented in (parentheses).

References

  1. Tsai, C.-A.; Ho, T.-H.; Lin, J.-S.; Tu, C.-C.; Chang, C.-W. Model for Evaluating Outsourcing Logistics Companies in the COVID-19 Pandemic. Logistics 2021, 5, 64. [Google Scholar] [CrossRef]
  2. Abdullah, M.; Ali, N.; Hussain, S.A.; Aslam, A.B.; Javid, M.A. Measuring changes in travel behavior pattern due to COVID-19 in a developing country: A case study of Pakistan. Transp. Policy 2021, 108, 21–33. [Google Scholar] [CrossRef] [PubMed]
  3. Kolarova, V.; Eisenmann, C.; Nobis, C.; Winkler, C.; Lenz, B. Analysing the impact of the COVID-19 outbreak on everyday travel behaviour in Germany and potential implications for future travel patterns. Eur. Transp. Res. Rev. 2021, 13, 27. [Google Scholar] [CrossRef]
  4. Negri, A.; Conte, F.; Caldiroli, C.L.; Neimeyer, R.A.; Castiglioni, M. Psychological Factors Explaining the COVID-19 Pandemic Impact on Mental Health: The Role of Meaning, Beliefs, and Perceptions of Vulnerability and Mortality. Behav. Sci. 2023, 13, 162. [Google Scholar] [CrossRef] [PubMed]
  5. Jomnonkwao, S.; Champahom, T.; Ratanavaraha, V. Methodologies for determining the service quality of the intercity rail service based on users’ perceptions and expectations in Thailand. Sustainability 2020, 12, 4259. [Google Scholar] [CrossRef]
  6. Roy, S.; Mazzulla, G.; Hore, S.; Mitra, S. Exploring the passengers’ socio-economic structure and its impact on the perception of railway infrastructures and services in Tripura, India. Public Transp. 2023, 1–28. [Google Scholar] [CrossRef]
  7. Thailand Board of Investment. Cost of Doing Business in Thailand 2020. 2020. Available online: https://www.boi.go.th/upload/content/Cost_of_Doing_Business2020.pdf (accessed on 29 September 2023).
  8. State Railway of Thailand. State Railway of Thailand: Annual Report 2021. Available online: https://www.railway.co.th/AboutUs/AnnualReport?value1 (accessed on 29 September 2023).
  9. Eboli, L.; Mazzulla, G. Relationships between rail passengers’ satisfaction and service quality: A framework for identifying key service factors. Public Transp. 2015, 7, 185–201. [Google Scholar] [CrossRef]
  10. Ibrahim, A.N.; Borhan, M.N.; Osman, M.H.; Khairuddin, F.H.; Zakaria, N.M. An Empirical Study of Passengers’ Perceived Satisfaction with Monorail Service Quality: Case of Kuala Lumpur, Malaysia. Sustainability 2022, 14, 6496. [Google Scholar] [CrossRef]
  11. Hundal, B.S.; Kumar, V. Assessing the service quality of Northern Railway by using SERVQUAL model. Pac. Bus. Rev. Int. 2015, 8, 82–88. [Google Scholar]
  12. Gopal Vasanthi, M.; Soundrarajan, V.; Nawaz, N.; Gajendran, V.; Parayitam, S. Passenger satisfaction with cleanliness and other service quality dimensions and gender as a moderator: Evidence from Indian Railways. Cogent Bus. Manag. 2023, 10, 2183568. [Google Scholar] [CrossRef]
  13. Antoniou, C. A stated-preference study of the willingness-to-pay to reduce traffic risk in urban vs. rural roads. Eur. Transp. Res. Rev. 2014, 6, 31–42. [Google Scholar] [CrossRef]
  14. Wu, B.; Wang, X.; Liu, T.; Dong, N.; Li, Y. Exploring Factors Contributing to Crash Injury Severity in the Rural-Urban Fringe of the Central City. J. Adv. Transp. 2021, 2021, 8453465. [Google Scholar] [CrossRef]
  15. Berg, J.; Ihlström, J. The Importance of Public Transport for Mobility and Everyday Activities among Rural Residents. Soc. Sci. 2019, 8, 58. [Google Scholar] [CrossRef]
  16. McDonagh, J. Transport policy instruments and transport-related social exclusion in rural Republic of Ireland. J. Transp. Geogr. 2006, 14, 355–366. [Google Scholar] [CrossRef]
  17. Grisé, E.; El-Geneidy, A. Where is the happy transit rider? Evaluating satisfaction with regional rail service using a spatial segmentation approach. Transp. Res. A Policy Pract. 2018, 114, 84–96. [Google Scholar] [CrossRef]
  18. State Railway of Thailand. Railway Passenger Satisfaction and Loyalty Surveying Project (SRT) 2022. 2022. Available online: https://www.railway.co.th/AboutUs/AnnualReport?value1 (accessed on 29 September 2023).
  19. Shen, W.; Xiao, W.; Wang, X. Passenger satisfaction evaluation model for Urban rail transit: A structural equation modeling based on partial least squares. Transp. Policy 2016, 46, 20–31. [Google Scholar] [CrossRef]
  20. Jamei, E.; Chan, M.; Chau, H.W.; Gaisie, E.; Lättman, K. Perceived Accessibility and Key Influencing Factors in Transportation. Sustainability 2022, 14, 10806. [Google Scholar] [CrossRef]
  21. Wonglakorn, N.; Ratanavaraha, V.; Karoonsoontawong, A.; Jomnonkwao, S. Exploring Passenger Loyalty and Related Factors for Urban Railways in Thailand. Sustainability 2021, 13, 5517. [Google Scholar] [CrossRef]
  22. Machado-León, J.L.; de Oña, R.; Baouni, T.; de Oña, J. Railway transit services in Algiers: Priority improvement actions based on users perceptions. Transp. Policy 2017, 53, 175–185. [Google Scholar] [CrossRef]
  23. Yang, W.; Chen, Q.; Yang, J. Factors Affecting Travel Mode Choice between High-Speed Railway and Road Passenger Transport—Evidence from China. Sustainability 2022, 14, 15745. [Google Scholar] [CrossRef]
  24. Eboli, L.; Fu, Y.; Mazzulla, G. Multilevel Comprehensive Evaluation of the Railway Service Quality. Procedia Eng. 2016, 137, 21–30. [Google Scholar] [CrossRef]
  25. Parasuraman, A.; Zeithaml, V.A.; Berry, L. SERVQUAL: A multiple-item scale for measuring consumer perceptions of service quality. J. Retail. 1988, 64, 12–40. [Google Scholar]
  26. Sama, H.R.; Chen, L.-S.; Nalluri, V.; Chendragiri, M. Enhancing service quality of rural public transport during the COVID-19 pandemic: A novel fuzzy approach. Public Transp. 2023, 15, 479–501. [Google Scholar] [CrossRef]
  27. Wan, D.; Kamga, C.; Hao, W.; Sugiura, A.; Beaton, E.B. Customer satisfaction with bus rapid transit: A study of New York City select bus service applying structural equation modeling. Public Transp. 2016, 8, 497–520. [Google Scholar] [CrossRef]
  28. Huang, X.; Dai, S.; Xu, H. Predicting tourists’ health risk preventative behaviour and travelling satisfaction in Tibet: Combining the theory of planned behaviour and health belief model. Tour. Manag. Perspect. 2020, 33, 100589. [Google Scholar] [CrossRef]
  29. Nguyen-Phuoc, D.Q.; Phuong Tran, A.T.; Nguyen, T.V.; Le, P.T.; Su, D.N. Investigating the complexity of perceived service quality and perceived safety and security in building loyalty among bus passengers in Vietnam—A PLS-SEM approach. Transp. Policy 2021, 101, 162–173. [Google Scholar] [CrossRef]
  30. Hamzah, M.I.; Wahab, S.N.; Abd Rashid, M.H.; Voon, B.H. Switching intention, WOM and quality of public transport services: A case of the Kuala Lumpur conurbation. Multimodal Transp. 2023, 2, 100082. [Google Scholar] [CrossRef]
  31. Joshi, A.; Kale, S.; Chandel, S.; Pal, D.K. Likert scale: Explored and explained. Br. J. Appl. Sci. Technol. 2015, 7, 396–403. [Google Scholar] [CrossRef]
  32. Data Innovation and Governance Institute. Open Thailand Railway Station Map User Statistics 2022. Available online: https://digi.data.go.th/showcase/train-station-thailand/ (accessed on 29 September 2023).
  33. State Railway of Thailand. Thai Railway Route Network. Available online: https://www.railway.co.th/More/Knowledge_Detail? (accessed on 29 September 2023).
  34. Golob, T.F. Structural equation modeling for travel behavior research. Transp. Res. B Methodol. 2003, 37, 1–25. [Google Scholar] [CrossRef]
  35. Pituch, K.A.; Stevens, J.P. Applied Multivariate Statistics for the Social Sciences: Analyses with SAS and IBM’s SPSS; Routledge: New York, NY, USA, 2015. [Google Scholar]
  36. Jöreskog, K.G. A general approach to confirmatory maximum likelihood factor analysis. Psychometrika 1969, 34, 183–202. [Google Scholar] [CrossRef]
  37. Kline, R.B. Principles and Practice of Structural Equation Modeling; Guilford Publications: New York, NY, USA, 2023. [Google Scholar]
  38. Fornell, C.; Larcker, D.F. Evaluating Structural Equation Models with Unobservable Variables and Measurement Error. J. Mark. Res. 1981, 18, 39–50. [Google Scholar] [CrossRef]
  39. Hair, J.F. Multivariate Data Analysis; Cengage: Boston, MA, USA, 2009. [Google Scholar]
  40. Brown, T.A. Confirmatory Factor Analysis for Applied Research; Guilford Publications: New York, NY, USA, 2015. [Google Scholar]
  41. Washington, S.; Karlaftis, M.F. Mannering. In Statistical and Econometric Methods for Transportation Data Analysis; CRC: Boca Raton, FL, USA, 2003. [Google Scholar]
  42. Sun, X.; Chi, C.G.-Q.; Xu, H. Developing destination loyalty: The case of Hainan Island. Ann. Tour. Res. 2013, 43, 547–577. [Google Scholar] [CrossRef]
  43. Steiger, J.H. Understanding the limitations of global fit assessment in structural equation modeling. Personal. Individ. Differ. 2007, 42, 893–898. [Google Scholar] [CrossRef]
  44. Hooper, D.; Coughlan, J.P.; Mullen, M.R. Structural equation modelling: Guidelines for determining model fit. Electron. J. Bus. Res. Methods 2008, 6, 53–60. [Google Scholar]
  45. Hu, L.T.; Bentler, P.M. Cutoff criteria for fit indexes in covariance structure analysis: Conventional criteria versus new alternatives. Struct. Equ. Model. Multidiscip. J. 1999, 6, 1–55. [Google Scholar] [CrossRef]
  46. Marsh, H.W.; Hau, K.-T.; Wen, Z. In search of golden rules: Comment on hypothesis-testing approaches to setting cutoff values for fit indexes and dangers in overgeneralizing Hu and Bentler’s (1999) findings. Struct. Equ. Model. Multidiscip. J. 2004, 11, 320–341. [Google Scholar] [CrossRef]
  47. Tavakol, M.; Dennick, R. Making sense of Cronbach’s alpha. Int. J. Med. Educ. 2011, 2, 53–55. [Google Scholar] [CrossRef]
  48. Liu, Y.; Long, C. Urban and Rural Income Gap: Does Urban Spatial Form Matter in China? SAGE Open 2021, 11, 21582440211002215. [Google Scholar] [CrossRef]
  49. Ma, X.; Wang, F.; Chen, J.; Zhang, Y. The Income Gap Between Urban and Rural Residents in China: Since 1978. Comput. Econ. 2018, 52, 1153–1174. [Google Scholar] [CrossRef]
  50. World Bank. Rural Thailand Faces the Largest Poverty Challenges with High Income Inequality. Available online: https://www.worldbank.org/en/news/press-release/2022/10/21/rural-thailand-faces-the-largest-poverty-challenges-with-high-income-inequality (accessed on 29 September 2023).
  51. Törnros, J.; Bolling, A. Mobile phone use—Effects of conversation on mental workload and driving speed in rural and urban environments. Transp. Res. Part F: Traffic Psychol. Behav. 2006, 9, 298–306. [Google Scholar] [CrossRef]
  52. Velloso, M.S.; Jacques, M.A.P. On-the-spot study of pedestrian crashes on Brazilian Federal District rural highways crossing urban areas. Transp. Res. Part F: Traffic Psychol. Behav. 2012, 15, 588–599. [Google Scholar] [CrossRef]
  53. Rasca, S.; Saeed, N. Exploring the factors influencing the use of public transport by commuters living in networks of small cities and towns. Travel Behav. Soc. 2022, 28, 249–263. [Google Scholar] [CrossRef]
  54. Xu, R.; Yue, W.; Wei, F.; Yang, G.; Chen, Y.; Pan, K. Inequality of public facilities between urban and rural areas and its driving factors in ten cities of China. Sci. Rep. 2022, 12, 13244. [Google Scholar] [CrossRef] [PubMed]
  55. Wang, M.; Kang, W.; Zhang, R. The Gap between Urban and Rural Development Levels Narrowed. Complexity 2020, 2020, 4615760. [Google Scholar] [CrossRef]
  56. de Oña, J.; de Oña, R.; Eboli, L.; Mazzulla, G. Heterogeneity in Perceptions of Service Quality among Groups of Railway Passengers. Int. J. Sustain. Transp. 2015, 9, 612–626. [Google Scholar] [CrossRef]
  57. Putra, K.E.; Sitanggang, J.M. The Effect of Public Transport Services on Quality of Life in Medan City. Procedia Soc. Behav. Sci. 2016, 234, 383–389. [Google Scholar] [CrossRef]
  58. Miranda, S.; Tavares, P.; Queiró, R. Perceived service quality and customer satisfaction: A fuzzy set QCA approach in the railway sector. J. Bus. Res. 2018, 89, 371–377. [Google Scholar] [CrossRef]
  59. Yuda Bakti, I.G.M.; Rakhmawati, T.; Sumaedi, S.; Damayanti, S. Railway commuter line passengers’ perceived service quality: Hedonic and utilitarian framework. Transp. Res. Procedia 2020, 48, 207–217. [Google Scholar] [CrossRef]
  60. Wang, Y.; Zhang, Z.; Zhu, M.; Wang, H. The Impact of Service Quality and Customer Satisfaction on Reuse Intention in Urban Rail Transit in Tianjin, China. SAGE Open 2020, 10, 2158244019898803. [Google Scholar] [CrossRef]
  61. Shi, R.; Feng, X.; Li, K.; Tao, Z. Evaluation of passenger service within the area of Beijing west railway station. Smart Resilient Transp. 2022, 4, 2–11. [Google Scholar] [CrossRef]
  62. Hidayat, A.M.; Choocharukul, K. Passengers’ Intentions to Use Public Transport during the COVID-19 Pandemic: A Case Study of Bangkok and Jakarta. Sustainability 2023, 15, 5273. [Google Scholar] [CrossRef]
Figure 1. Thai intercity train statistics.
Logistics 07 00093 g001
Figure 2. Intercity railway network of Thailand). (a) Main lines and stations; (b) Data collection site (station).
Logistics 07 00093 g002
Figure 3. Extended rail service quality for post-pandemic of urban users.
Logistics 07 00093 g003
Figure 4. Extended rail service quality for post-pandemic of rural users.
Logistics 07 00093 g004
Table 1. Characteristics of respondents.
CodeDefinitionUrban (n = 665)Rural (n = 935)
Frequency%Frequency%
GenderMale33750.749052.4
Female32849.344557.6
Marital statusMarried26840.339942.7
Otherwise39759.753657.3
EducationUneducated/Below bachelor37756.751154.7
Bachelor and above28843.342445.3
OccupationGovernment/State enterprise officer8913.410611.3
Private company15923.923525.1
Self-employed13620.518019.3
Student14021.121022.5
Others14021.120421.8
Note: Average age; Urban = 33.52 years (SD = 12.2), Rural = 33.49 years (SD = 11.9). Average personal income; Urban = 17,877 baht per month, Rural = 17,457.
Table 2. Model of fit statistical and multi-group analysis.
Description χ 2 df χ 2 / d f CFITLISRMRRMSEA (90% CI)Delta– χ 2 Delta–dfp-Value
Individual group;
Model 1: Urban1903.378202.320.9500.9420.0460.045 (0.042–0.048)
Model 2: Rural2708.728213.300.9400.9310.0470.050 (0.048–0.052)
Measurement of invariance;
Simultaneous model4959.9716023.100.9350.9230.0440.052 (0.050–0.054)218.99740.000
Factors loading, intercept, structural paths held equal across group5178.9616763.090.9320.9230.0490.052 (0.050–0.054)
Disclaimer/Publisher’s Note: The statements, opinions and data contained in all publications are solely those of the individual author(s) and contributor(s) and not of MDPI and/or the editor(s). MDPI and/or the editor(s) disclaim responsibility for any injury to people or property resulting from any ideas, methods, instructions or products referred to in the content.

