1. Introduction
Ensuring global food security amid rapid population growth, climate shocks, and macroeconomic instability necessitates a fundamental transformation of agri-food supply chains. Within the transition toward the Agriculture 4.0 paradigm, the digitalization of logistics processes emerges as a key driver of operational efficiency enhancement.
Unlike traditional industrial systems, agricultural logistics is characterized by pronounced seasonality, spatial dispersion of production clusters, and stringent requirements for rapid handling and throughput. Inefficient management of these factors, compounded by a shortage of modern storage infrastructure, results in substantial post-harvest losses annually. Consequently, farmers are often forced to sell their produce directly from the field at discounted prices, thereby undermining the economic sustainability of the agricultural sector.
In contrast to traditional industrial logistics systems, agrologistics in Central Asia, and particularly in the Republic of Kazakhstan, is characterized by pronounced seasonality of material flows, significant geographical dispersion of production clusters, and high dependence on the state of the infrastructure for agricultural product storage and transportation. Kazakhstan is one of the largest grain producers in the region and plays a vital role in ensuring food security for Central Asian countries and neighboring states. According to the Bureau of National Statistics of the Republic of Kazakhstan, the gross harvest of grain and leguminous crops in 2024 reached 25.2 million tons, representing a 47.4% increase compared to the previous year [
1].
Despite these substantial production volumes, the development of storage infrastructure remains a key challenge for the country’s agri-food logistics. According to the Ministry of Agriculture of the Republic of Kazakhstan, there are 191 licensed grain-receiving enterprises in the country with a total storage capacity of over 13.2 million tons. However, a significant portion of this capacity is concentrated in the northern grain-producing regions, driven by the historically established specialization of the Akmola, Kostanay, and North Kazakhstan regions in grain production [
2].
Addressing post-harvest losses requires a shift from intuitive infrastructure planning toward a data-driven management paradigm. However, most existing approaches to macrologistics optimization rely either on static facility location models or on basic graph-based routing algorithms, both of which neglect a critical dimension—time. In practice, harvesting peaks for different crops rarely coincide. The absence of spatiotemporal modeling leads to an artificial overestimation of required storage capacity and prevents an accurate assessment of the Total Landed Cost (TLC) of the logistics network.
In this context, the Republic of Kazakhstan represents a unique testing ground for large-scale logistics models. As one of the world’s leading exporters of grain and oilseed crops, Kazakhstan plays a strategic role in shaping transcontinental food corridors, particularly within the framework of the Trans-Caspian International Transport Route.
The Almaty region, selected as the focal area of this study, is characterized by a high degree of crop heterogeneity (including maize, wheat, and soybean) and a complex multimodal transportation network. Despite its substantial agro-industrial potential, the region faces an uneven distribution of grain storage infrastructure, creating an urgent need for scientifically grounded investment planning.
This study aims to bridge the identified methodological and practical gaps through the development of a hybrid digital twin of the macrologistics network. The objective of the research is the strategic optimization of agri-food supply chains in the Almaty region based on the integration of GIS analysis, linear mathematical programming, and dynamic simulation modeling.
To achieve the stated objective, the study addresses the following tasks:
The development of a high-resolution spatial graph of a multimodal transportation network using satellite data (ESA WorldCover) and verified governmental infrastructure registries [
3].
The implementation of dynamic simulation of harvesting campaigns to assess the baseline Service Level and to identify the effect of temporal decoupling of inbound cargo flows.
The optimization of freight allocation using the simplex method to minimize the Total Landed Cost (TLC) and to provide a mathematical justification for the economic efficiency of multimodal (road/rail) transportation routes.
The application of the Green Field Analysis (GFA) algorithm to determine the optimal geographic locations of new consolidation nodes (grain elevators), aimed at monetizing the identified infrastructure deficit.
The scientific novelty of this study lies in the synergy of Earth remote sensing methods, operations research (OR), and dynamic simulation modeling. The proposed model not only identifies the existence of infrastructure gaps but also provides a mathematical demonstration that temporal differences in harvesting calendars act as a natural buffer, significantly reducing inventory holding costs.
This approach reframes the perceived capacity shortage into an economically justified and low-risk investment opportunity.
2. Literature Review
To ensure a comprehensive and rigorous academic foundation, a structured literature review methodology was employed. The literature search was systematically conducted across major citation databases, including Scopus, Web of Science, IEEE Xplore, and Google Scholar, covering the publication period from 2015 to 2026. The search strategy utilized combinations of Boolean operators and specific key terms, including “agrologistics”, “multimodal transportation”, “facility location problem”, “Agriculture 4.0”, “digital twin”, “supply chain resilience”, and “Kazakhstan agriculture”. The selection criteria were restricted to peer-reviewed journal articles, high-impact conference proceedings, and official institutional reports published in both English and Russian, ensuring that both state-of-the-art global methodologies and regional agricultural contexts were fully incorporated.
2.1. The Agriculture 4.0 Concept and Smart Supply Chains
In recent years, the Agriculture 4.0 paradigm has shifted the focus from merely increasing crop yields to the comprehensive digitalization of agri-food supply chains. As noted in [
4], the integration of cyber-physical systems and big data analytics is critical for enhancing the resilience and profitability of agriculture under conditions of infrastructure constraints. The implementation of Smart Supply Chains enables the agricultural sector to create a “moat effect” against external logistics shocks by leveraging data as a core resource for managerial decision-making [
5]. However, most current Agriculture 4.0 research is concentrated on on-farm technologies (IoT, drones), leaving regional macro-logistics insufficiently explored [
6].
The transition to Agriculture 4.0 is intrinsically linked to global food security and socio-economic resilience [
4]. Identifying the challenges of integrating advanced technological frameworks into food and agricultural supply chains allows service providers to mitigate risks and improve operational continuity [
7]. Furthermore, the adoption of smart technologies is crucial for establishing sustainable logistics systems, particularly in regions with high perishability risks.
Moreover, as highlighted by Fareed et al. [
8], the adoption of advanced digital technologies plays a pivotal role in achieving operational sustainability and decarbonization in multimodal logistics operations, while Jebbor et al. [
9] emphasize the strategic potential of combining digital twins and metaverse frameworks to optimize sustainable and circular resource management across complex supply chain networks.
2.2. Multimodal Transport Optimization and Linear Programming
The problem of high transportation costs is traditionally addressed by transitioning from unimodal (road-only) to multimodal logistics networks that combine road and rail transport. The optimization of such networks constitutes a complex routing problem, for which mixed-integer linear programming (MILP) is widely applied. A recent study by Zhang et al. [
10] demonstrates that dynamic switching between road and rail transport using MILP algorithms can reduce logistics costs by up to 23%. Similarly, Lu et al. [
11] developed a model for optimizing multimodal schemes, confirming the economic efficiency of consolidating fragmented agricultural cargo flows. Nevertheless, existing mathematical routing models are often tested on abstract networks with a limited number of nodes and are rarely applied to ultra-large graphs representing real-world transport networks.
Beyond direct economic benefits, multimodal routing is increasingly recognized as a cornerstone of “green logistics,” aimed at mitigating Scope 3 emissions [
12]. Shifting freight from road networks to other modes is considered one of the most effective strategies for reducing CO
2 emissions and optimizing energy use [
13]. Furthermore, recent studies demonstrate that robust optimization modeling for multimodal paths under uncertain demand significantly promotes emission reductions, balancing transport costs with environmental sustainability [
14].
2.3. Geospatial Analysis and Facility Location Problem
Strategic planning of logistics infrastructure (grain elevators and storage facilities) is based on solving the classical Facility Location Problem. Under modern conditions, the accuracy of such models critically depends on the quality of spatial data. Li et al. [
15] emphasize that the use of Earth observation (Remote Sensing) technologies and satellite monitoring is a prerequisite for developing reliable digital twins of agro-industrial regions. High-resolution satellite datasets (such as ESA WorldCover [
16]) enable precise identification of agricultural production nodes; however, their integration with center-of-gravity algorithms (Green Field Analysis) for assessing infrastructure deficits remains only fragmentarily addressed in the scientific literature.
The literature review indicates that, despite advances in linear programming methods for multimodal transport optimization [
10,
11] and the application of satellite data in agronomy [
15], a comprehensive approach integrating these elements is still lacking. This study addresses this gap by proposing an integrative model in which ESA satellite data directly feed linear programming algorithms within an ultra-large transport graph, enabling not only the optimization of current routes but also the mathematical justification of locations for new facility construction (GFA).
The precision of geospatial analysis directly impacts the successful implementation of market-driven supply chains [
17]. Demonstrating the efficacy of new storage technologies in targeted clusters is essential for sustained adoption among smallholder farmers. Precise spatial planning helps mitigate both biological and environmental risks that contribute to quality degradation across the grain supply chain [
18].
2.4. Simulation Modeling and Digital Twins in Macrologistics
In conditions of uncertainty, static mathematical programming models often prove insufficient for accurately assessing the real operational load on logistics infrastructure. Contemporary literature emphasizes the need to transition toward the concept of Digital Twins at the macro level [
19]. In the agri-food sector, Digital Twins serve as virtual replicas of physical supply chains, enabling real-time monitoring and predictive logistics planning. As demonstrated by Verdouw et al. [
20], the implementation of digital twins in smart farming significantly enhances the adaptability of food networks to external shocks. Furthermore, Defraeye et al. [
21] highlight that hybrid simulation models–combining digital twins with logistical tracking–are critical for reducing post-harvest losses and optimizing storage routing. This hybrid paradigm allows researchers to evaluate how infrastructure bottlenecks and weather delays propagate through the macro-logistics network, providing a more robust decision-support framework than traditional static facility location models.
Unlike static routing approaches, the integration of discrete-event or agent-based simulations enables the incorporation of stochastic temporal processes into the analysis. In agrologistics, one of the key yet often overlooked factors is seasonality. Variations in agronomic harvesting calendars across different crops give rise to the so-called “temporal decoupling” effect, which can naturally dampen peak loads on elevators and storage facilities [
22].
However, existing studies rarely quantify this effect mathematically in conjunction with high-resolution GIS data.
To effectively capture the stochastic nature of supply chains, modern digital twins increasingly incorporate probabilistic models [
23]. Utilizing Monte Carlo simulations allows researchers to generate realistic scenarios depicting uncertain factors, such as yield variations and climate change influences [
24]. Consequently, the integration of digital twin methodologies enables real-time monitoring and optimization, reducing inventory costs and improving responsiveness to disruptions.
2.5. The Concept of Total Landed Cost (TLC) in the Agricultural Sector
Assessing the efficiency of supply chains requires moving beyond simple transportation tariffs. Logistics-focused journals increasingly emphasize the application of the Total Landed Cost (TLC) metric, which incorporates the Inventory Carrying Cost (ICC). As demonstrated in recent studies [
25], ignoring the cost of capital tied up in inventory leads to distortions in evaluating the investment attractiveness of logistics projects.
However, calculating ICC in multimodal agricultural networks with high spatial dispersion remains a complex methodological challenge, requiring synchronization between the transportation network and the temporal dimension of storage.
A review of the literature shows that, despite advancements in linear programming methods for multimodal transportation [
10,
11] and the use of satellite data in agronomy [
15], a comprehensive, integrated approach is still lacking in modern research.
This paper addresses this gap. The proposed integrative model, for the first time, combines ESA satellite-derived land cover masks, large-scale graph-based routing algorithms, and spatiotemporal inventory dynamics (Spatiotemporal Analysis) to substantiate the investment potential of logistics infrastructure.
Finally, the strategic expansion of storage capacities based on TLC minimization plays a pivotal role in preventing post-harvest losses [
26]. In agri-food supply chains, inadequate infrastructure and inefficient transport routing are primary drivers of massive food waste. Integrating digital twins with agile logistics strategies not only facilitates greener transportation but also significantly reduces the time products spend in warehouses, thereby preserving quality and lowering emissions [
27].
3. Materials and Methods
This study is based on a hybrid quantitative approach that integrates methods of geographic information systems (GISs), operations research, and spatiotemporal simulation modeling.
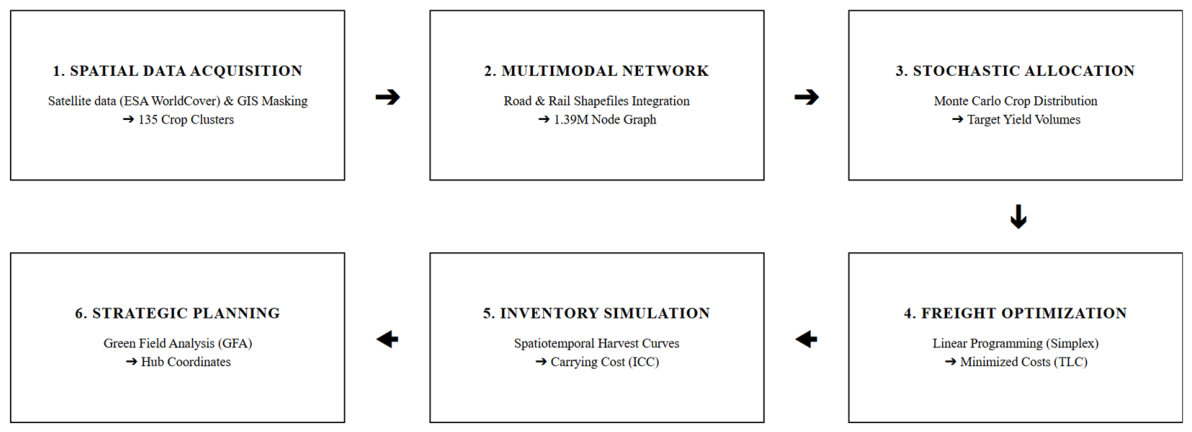
The computational architecture of the model is implemented in the MATLAB environment (Release 2025b, The MathWorks Inc., Natick, MA, USA) [
28] and consists of six sequential stages: spatial data collection, graph topology modeling, stochastic demand generation, route optimization using linear programming, dynamic inventory modeling, and spatial optimization of infrastructure (
Figure 1).
The rationale for selecting this specific hybrid methodology is driven by the complex, multi-layered nature of agricultural supply chains. First, the integration of high-resolution Earth observation data (ESA WorldCover) was chosen to overcome the limitations of incomplete regional land registries, ensuring the objective spatial identification of active farming clusters. Second, traditional heuristic algorithms often fail to provide exact solutions for ultra-large networks; therefore, the application of Linear Programming (LP) within a massive road–rail graph (1.39 million nodes) was selected to guarantee a mathematically proven global optimum for multimodal freight allocation. Third, to address the critical gap of seasonality—which is entirely ignored by static models—a discrete-time simulation approach was adopted. This specific method allows for the dynamic quantification of time-dependent inventory accumulation and validates the “temporal decoupling” effect of harvest inflows. Finally, the Green Field Analysis (GFA) algorithm was selected as the most robust mathematical technique to localize new infrastructure, as it objectively places facilities based on the gravitational pull of unserved crop volumes rather than subjective administrative planning.
3.1. Spatial Data Acquisition and Preprocessing (Data Acquisition)
To ensure the reliability of the model (Data-Driven Approach), a combination of satellite remote sensing and open vector databases was used:
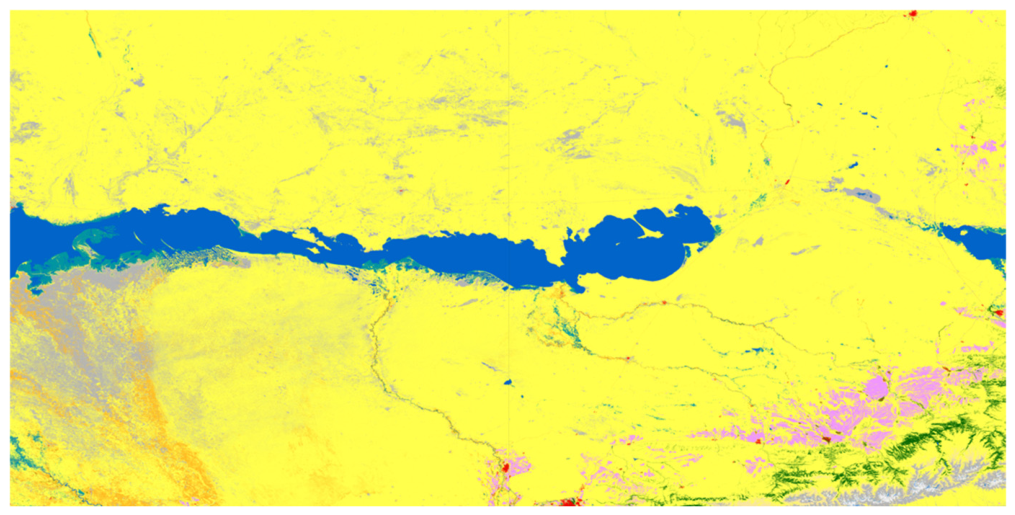
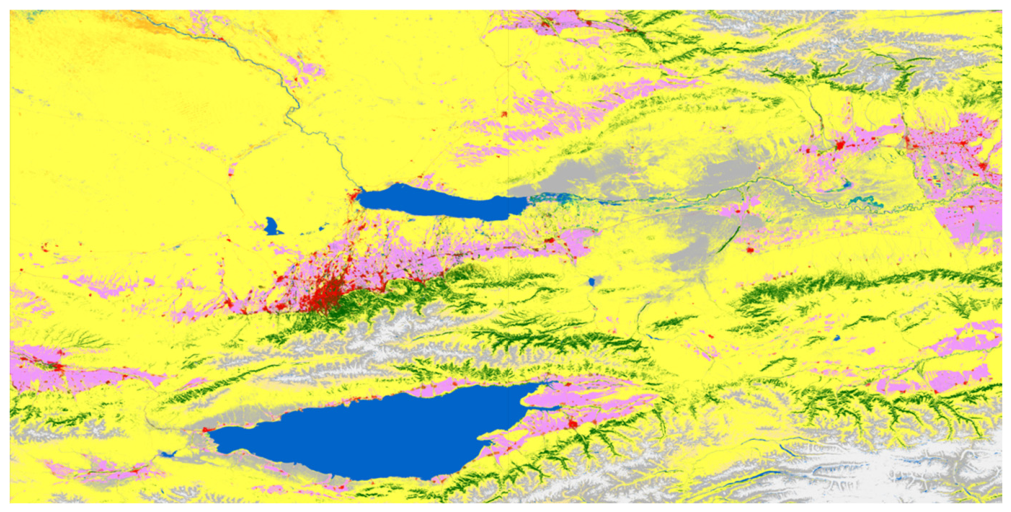
Supply Nodes (Production Clusters). Active agricultural land in the Almaty region was identified using the global raster map ESA WorldCover (10 m resolution, Sentinel-1 and Sentinel-2 satellites) (
Figure 2).
Polygons of the “Cropland” class were converted into centroids. To eliminate spatial artifacts and coordinate points outside the target administrative boundary, a strict polygon masking algorithm was applied. As a result, a validated dataset of
n = 135 production clusters was obtained (
Figure 3).
Demand Nodes (Silo Hubs). Geographic coordinates and operational capacities of three existing grain intake facilities were collected: Bayserke Agro (44,600 tons), AGRO-FOOD Konaev (18,000 tons), and Agrimer Beskol (14,000 tons). The total available system capacity amounts to 76,600 tons.
Technical specifications and verified capacity data for grain storage facilities and elevators in the Almaty region were retrieved from the Qoldau.kz [
3] state digital platform. Utilizing this registry ensured high precision for the storage parameters assigned to the 135 production nodes within the model.
- 4.
Infrastructure Graph. Vector layers of road and railway networks (shapefiles) were imported and merged into a unified coordinate system.
3.2. Multimodal Network Topology Construction (Multimodal Network Topology)
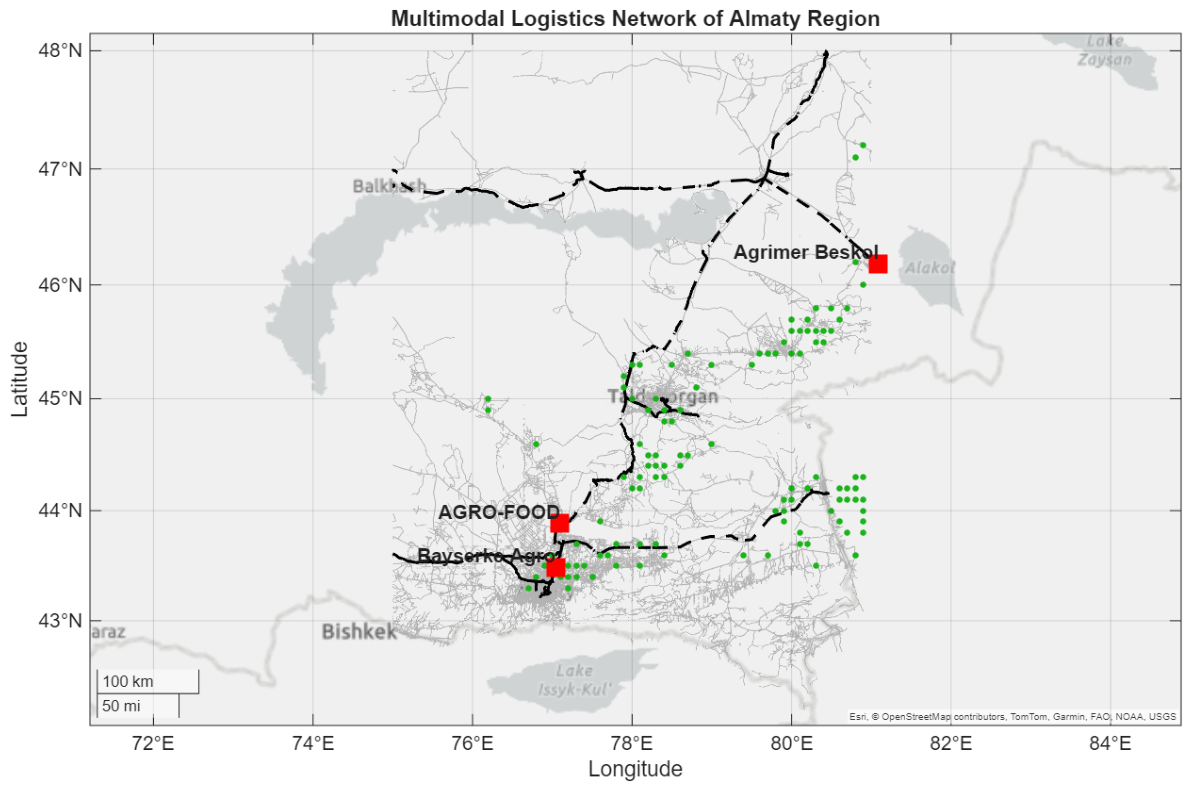
A unified navigation environment was developed, incorporating the economic characteristics of different transport modes. Road and railway coordinates were aggregated using a spatial snapping algorithm with a tolerance of approximately 11 m to form multimodal transshipment points. As a result, a directed graph G(V, E) consisting of 1,390,087 nodes was generated (
Figure 4).
The physical length of each edge was calculated using the Haversine formula, accounting for the Earth’s curvature:
where
R = 6371 km (mean Earth radius) and
φ and
λ denote the latitude and longitude of the nodes, respectively.
To reflect economic realities, a cost-weighting function was assigned to graph edges. Road segments were given a base weight (1 km = 1 cost unit), whereas railway segments were assigned a discount multiplier of 0.3 (representing a 70% tariff reduction). This 1:0.3 ratio of road-to-rail tariffs per ton-kilometer is based on empirical tariff data for grain transportation in Kazakhstan. According to the official tariff schedules of the national railway operator Kazakhstan Temir Zholy (KTZ, Astana, Kazakhstan) and regional road freight registries, the average cost of road transport is approximately 35–40 KZT per ton-km, whereas bulk rail transport costs roughly 10–12 KZT per ton-km, validating the 70% cost reduction factor for long-haul railway segments.
3.3. Logistics Cost Matrix Generation (Reverse SSSP)
Calculating routing costs in a graph with 1.39 million nodes requires substantial computational resources. Therefore, Dijkstra’s algorithm was applied in reverse mode (Reverse Single-Source Shortest Path). The algorithm was executed from the three demand nodes (silo hubs), simultaneously computing minimum-cost paths to all 135 supply clusters. The result is a unit cost matrix Cij of size 135 × 3, representing the minimum multimodal transportation cost from farm i to hub j.
3.4. Stochastic Synthetic Data Generation
Due to the commercial confidentiality of field-level microdata, production volumes were parameterized based on macro-level target statistics for the Almaty region for 2025 (Corn: 77%, Wheat: 13.5%, Soybeans: 9.5%). Using a stochastic synthetic data generation procedure with a fixed random seed (rng(42)), each of the 135 clusters was randomly assigned a crop type and a production volume within the range of 2000–4000 tons. This procedure generated a total synthetic regional output of 322,269 tons, providing a controlled, highly reproducible baseline dataset for quantifying the infrastructure capacity gap.
3.5. Freight Flow Optimization (Linear Programming)
To optimally allocate the available 76,600 tons of storage capacity, a multi-commodity transportation problem was formulated. The objective function
Z minimizes the total regional logistics cost:
where
Xij is the decision variable representing the shipment volume (in tons) from cluster
i to hub
j.
To compare different routing scenarios independently of volatile real-world currency fluctuations, we express the objective function
Z as a dimensionless Logistics Cost Index (LCI). The unit cost
Cij in the matrix represents the minimum cost distance from farm
i to hub
j, computed using the cost-weighting parameters established in
Section 3.2 (where 1 km of road equals 1 index unit per ton, and rail segments are multiplied by a 0.3 discount factor).
Model constraints:
Supply constraint: (the shipped volume cannot exceed the cluster’s production).
Demand constraint: (each hub must be fully utilized at 100% of its capacity Kj).
Compatibility matrix (Big-M Method): To prevent cross-contamination of crops (e.g., routing corn to a soybean-specific hub), upper bounds for incompatible routes were strictly set to zero: .
The global optimum was obtained using the simplex method.
3.6. Strategic Infrastructure Planning (Green Field Analysis)
To address unmet production volumes constituting the infrastructure deficit, a Facility Location Problem was solved. An iterative Weighted Center of Gravity method, modified based on the K-means principle, was applied.
The coordinates of the proposed new hubs were updated using the following formulas:
where
strictly denotes the residual volume of unserved production at coordinates (
Xi,
Yi), ignoring fully served crop quantities. The algorithm converges when spatial coordinates minimizing total transport work (ton-kilometers) for all unserved residual harvest are identified.
The applied GFA algorithm is based on the iterative minimization of the weighted Euclidean distance between crop generation points and potential hubs. The center-of-gravity search process incorporated the unallocated residual harvest (in tons) as gravitational weights. Because GFA focuses strictly on spatial transport work without modeling site-specific construction costs or local zoning restrictions, the resulting coordinates for Hub A and Hub B are interpreted as indicative candidate areas for investment prioritization rather than final construction decisions.
3.7. Dynamic Inventory Modeling and Total Landed Cost Assessment
To overcome the limitations of static transportation models, a spatiotemporal simulation module was developed with a planning horizon of T = 365 days. To model the uneven inbound flow of agricultural products , Gaussian functions were applied to represent harvest peaks for the three crops. The superposition of inbound flows was constructed using the following normal distributions: wheat harvesting peak in August (μ = 220, σ = 15), maize peak in late September (μ = 270, σ = 15), and soybean peak in October (μ = 285, σ = 10).
To ensure strict computational consistency with the optimization module, the inbound flow at each hub j is derived exclusively from the allocated decision variable quantities obtained during the linear programming stage. Outbound market shipments are modeled as a deterministic uniform rate based on the total allocated capacity of each facility.
To reflect the individual operational constraints of the infrastructure, the dynamic inventory level
is calculated separately for each consolidation hub
j at the end of day
t using the discrete balance equation:
The inclusion of the temporal dimension enables the integration of the financial holding cost (ICC). To solve the unit inconsistency between dimensionless transport routing costs (
) and monetary holding expenses, ICC is expressed in normalized LCI units (where 1 unit represents the cost distance of 1 km road transport per ton):
where
h is the daily holding cost scalar and
M is the number of hubs.
Consequently, the Total Landed Cost (TLC) objective function is unified in normalized LCI units:
where
represents the global multimodal transportation cost. This unified formulation allows for mathematically proving the temporal decoupling effect while maintaining strict dimensional consistency.
4. Results
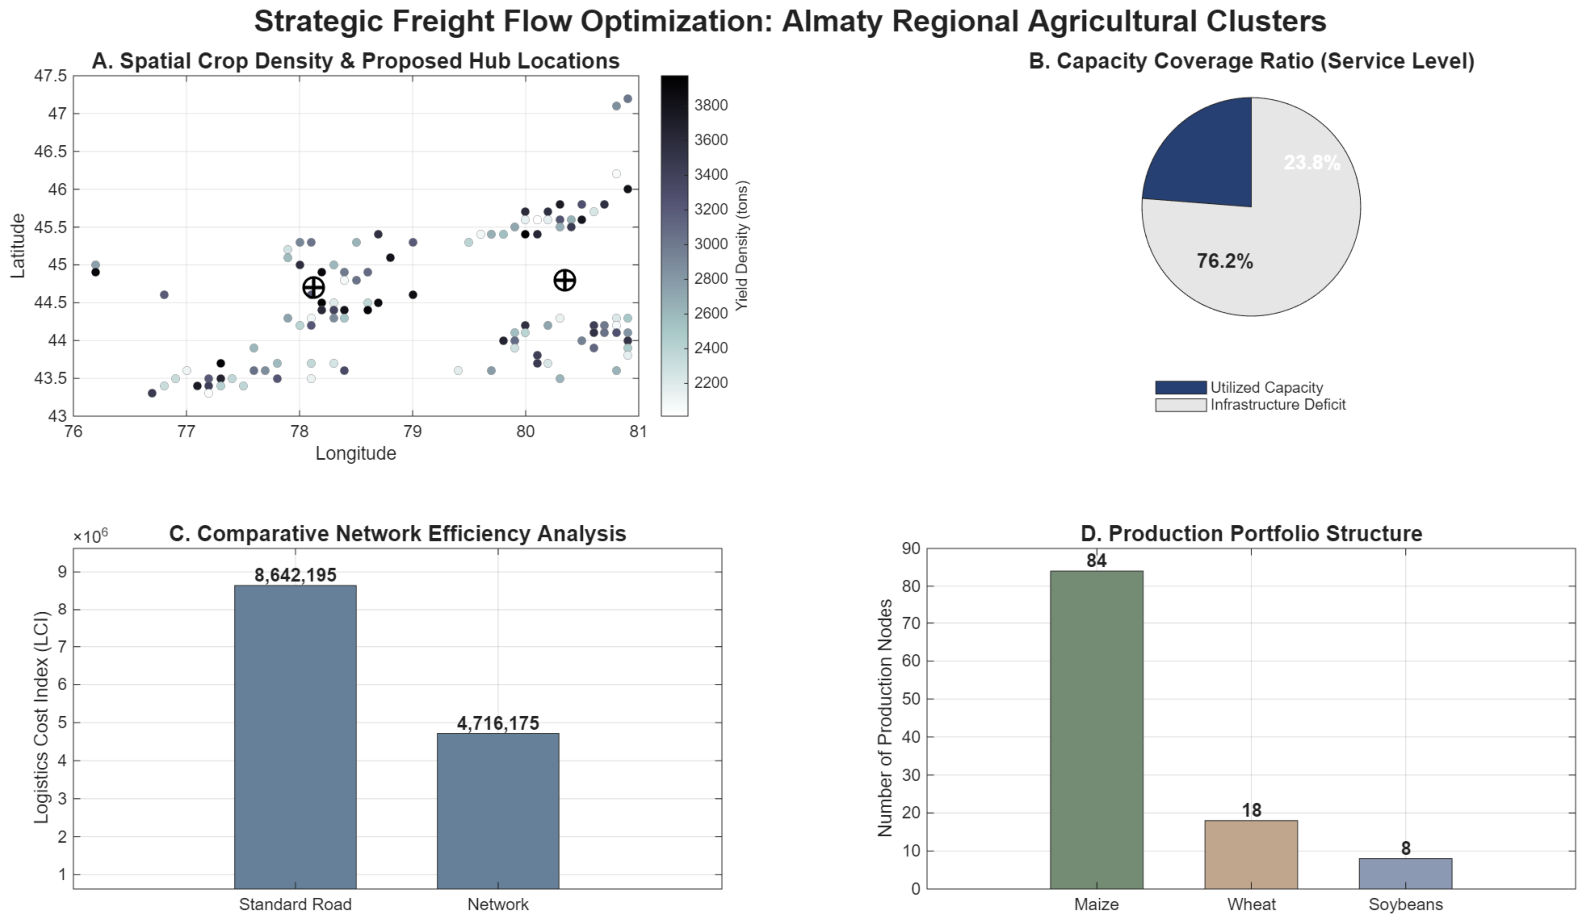
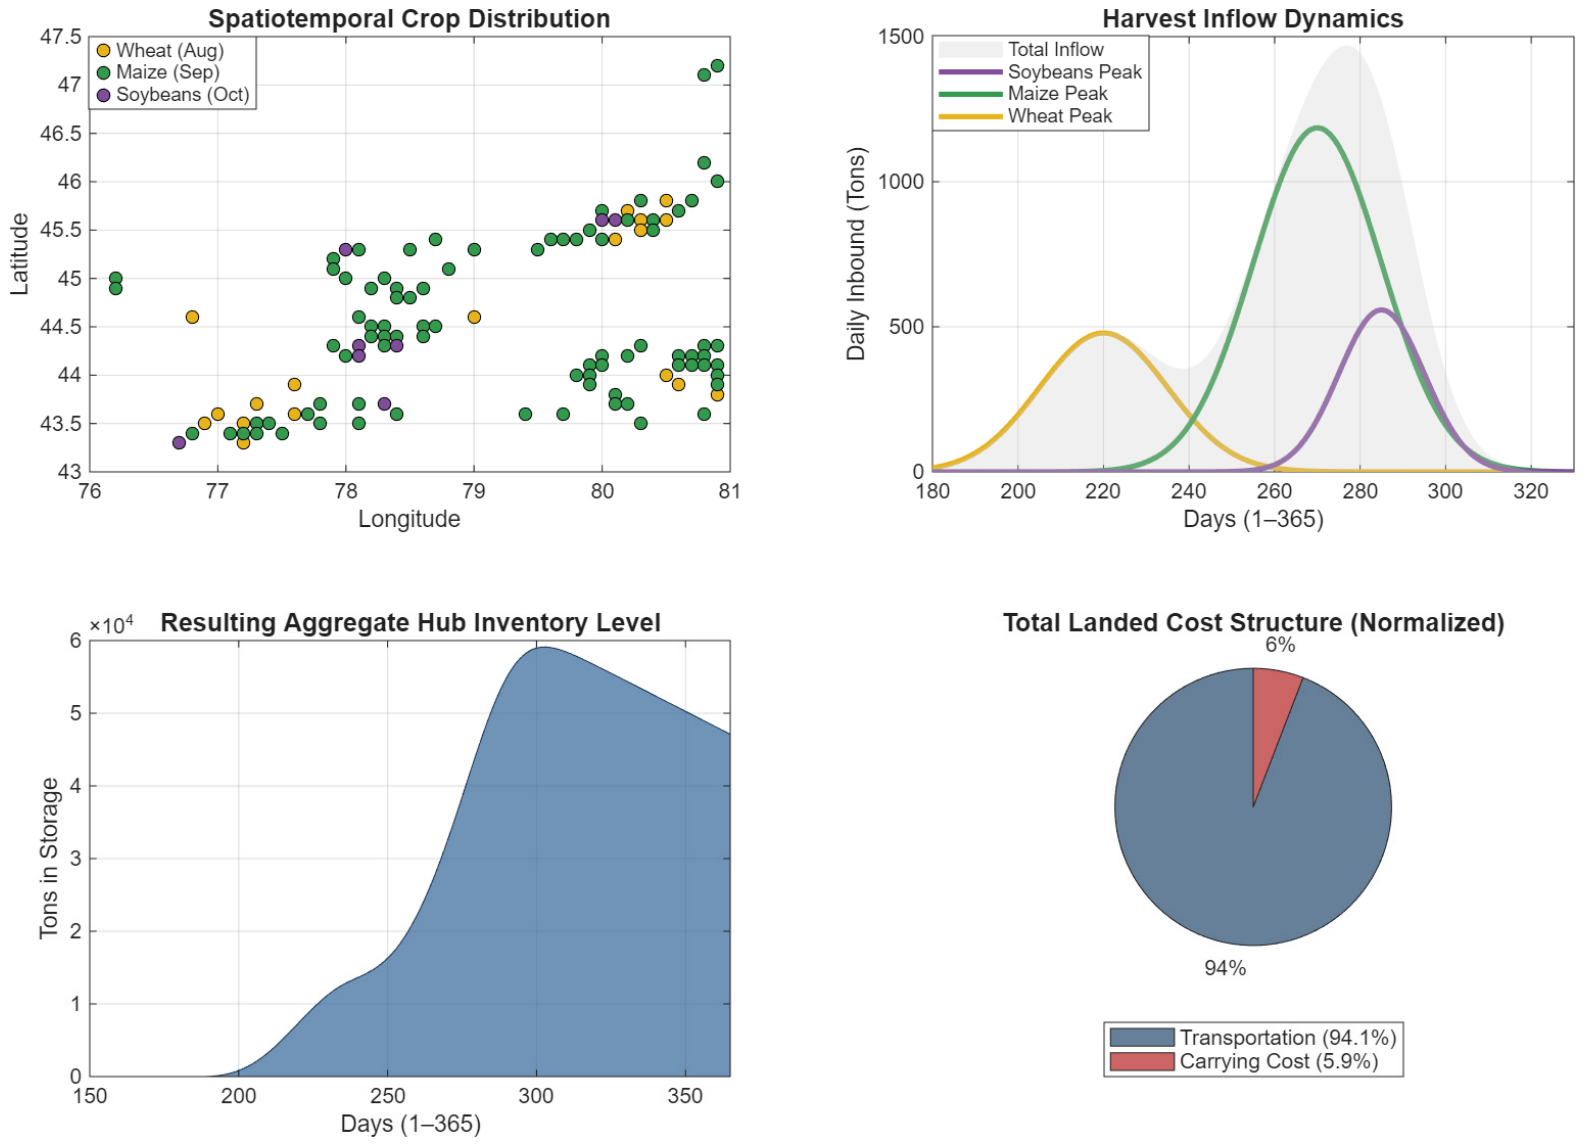
The computational experiment conducted on the digital twin of the Almaty region’s transport network enabled a quantitative assessment of the supply chain’s operational dynamics. The integration of GIS data, optimization algorithms, and discrete-time simulation allowed for evaluating logistics efficiency not only spatially but also financially through the Total Landed Cost (TLC) metric. The modeling results are structured into a static spatial optimization block (
Figure 5) and a dynamic spatiotemporal financial analysis block (
Figure 6).
4.1. Baseline Capacity Coverage Assessment
The simulation of agricultural crop distribution across 135 validated production clusters generated a total regional storage demand of 322,269 tons. When compared with the fixed capacity of the three existing grain elevators (76,600 tons), a baseline infrastructure Capacity Coverage Ratio of 23.8% was established (
Figure 5, Subplot B).
The combined capacity of the three operational elevators (Bayserke-Agro, Konaev, and Beskol), as verified by the Qoldau.kz registry [
3], serves as the baseline constant for calculating the network’s throughput.
In the context of strategic planning, this 23.8% metric should not be interpreted as a critical system failure, but rather as a significant indicator of potential for network expansion. While real-world capacity utilization is subject to demand uncertainty, market price dynamics, and farmer behavior, this large modeled unserved storage gap of 76.2% suggests a high probability of robust utilization for new facilities, significantly mitigating the risk of creating idle overcapacity under baseline conditions.
4.2. Spatiotemporal Dynamics and Temporal Decoupling
To evaluate operational resilience, an agronomic calendar was integrated into the simulation model. The dynamic simulation revealed a key driver of regional supply chain stability—the “temporal decoupling” effect of inbound freight flows (
Figure 6, Subplot 2).
The modeling demonstrates that the peaks of various crop harvests are distributed over time: the August wave of wheat completes its consolidation cycle before the onset of the massive maize harvest in September, while soybeans form a delayed inflow in October. Thanks to this decoupling, the inventory accumulation curve (
Figure 6, Subplot 3) rises in a step-like manner, which naturally acts as a buffer against elevator overloading and ensures high inventory turnover.
4.3. Multimodal Routing Efficiency and Cost Structure
The application of linear programming enabled the identification of a global optimum in logistics costs. The model successfully allocated crops to specialized hubs, strictly adhering to the compatibility matrix constraints (
Table 1).
This optimized freight allocation represents a significant operational improvement over intuitive shipping heuristics. From an agricultural logistics perspective, the strict enforcement of the compatibility matrix (implemented via the Big-M method) addresses a critical real-world challenge: grain segregation. Because maize, wheat, and soybeans have distinct moisture thresholds, bulk densities, and processing requirements, mixing them in the same silo bins leads to quality degradation, biological heating, and cross-contamination. Our model successfully segregates these flows, routing 100% of maize to Bayserke, wheat to Konaev, and soybeans to Beskol. Furthermore, the transition of long-haul corridors to the Turksib (Almaty–Taldykorgan) and Aktogay–Dostyk railway lines reduces the operational pressure on the regional highway network during the harvest peak. By consolidating fragmented smallholder flows into high-capacity rail block trains at these primary transshipment points, the regional supply chain minimizes the risk of bottlenecks at the silo intakes, ensuring a higher throughput and preserving crop quality.
To facilitate a clearer understanding of the dense optimization data presented in
Table 1, several key logistical patterns have been highlighted and summarized in the text. First, the shaded rows illustrate the strict, cost-driven segregation of agricultural flows enforced by the Big-M compatibility matrix. For example, the highlighted wheat cluster at 43.5° N (Row 6) is allocated entirely (2312 tons) to Konaev, with its flow to Bayserke set to zero, even though Bayserke offered a lower unit cost (12.90 vs. 29.44). This demonstrates that biological compatibility and segregation requirements overrule simple distance heuristics. Second, the spatial distribution reveals a proximity-driven cost minimization pattern, as exemplified by the maize cluster at 43.4° N (Row 5), where its geographic proximity to Bayserke yields a minimal unit cost of 20.95, resulting in a 100% allocation of its 2312-ton yield. Conversely, the highlighted soybean cluster at 45.3° N (Row 25) must be routed to its only compatible hub, Beskol, despite a high unit cost of 131.97. Finally, the highlighted maize cluster at 45.0° N (Row 1) shows zero allocation across all hubs. Because the total regional capacity of 76,600 tons was fully utilized by closer, more cost-effective clusters, this unserved 2749-ton harvest clearly demonstrates the localized infrastructure capacity deficit discussed in
Section 4.1.
To rigorously evaluate the economic efficiency of the proposed supply chain, two independent and directly comparable optimization scenarios were constructed and solved using the simplex algorithm. Both scenarios utilized identical production volumes, hub capacities, and strict compatibility constraints. The first baseline scenario utilized a standard road-only network, resulting in a baseline Logistics Cost Index (LCI) of 8,642,195 units. The second scenario introduced the road–rail multimodal network, integrating the empirical 70% long-haul rail discount multiplier. As demonstrated in
Figure 5 (Subplot C), the optimization of this multimodal scenario yielded a reduced LCI of 4,716,175 units. This independent comparative analysis mathematically proves that transitioning to a multimodal architecture achieves a direct logistics cost reduction of 45.4% across the regional network.
Furthermore, the analysis of the Total Landed Cost structure confirms the high operational profitability of the system (
Figure 6, Subplot 4). The Inventory Carrying Cost (ICC) accounted for only 5.9%, while 94.1% of the expenses were attributed to active transportation.
This ultra-low ICC share is a direct consequence of the rapid turnover of goods and validates the efficiency of the designed network.
4.4. Strategic Facility Location (Green Field Analysis)
To monetize the identified investment potential, the GFA algorithm analyzed the spatial coordinates of unserved clusters weighted by their harvest volumes (
Figure 5, Subplot A). The iterative weighted center-of-gravity search process mathematically determined two optimal locations for constructing new consolidation nodes (Hub A and Hub B).
Placing new elevators at these specific coordinates minimizes the first-mile transport work for farmers and shifts the investment decision-making process into a rigorous Data-Driven Management paradigm.
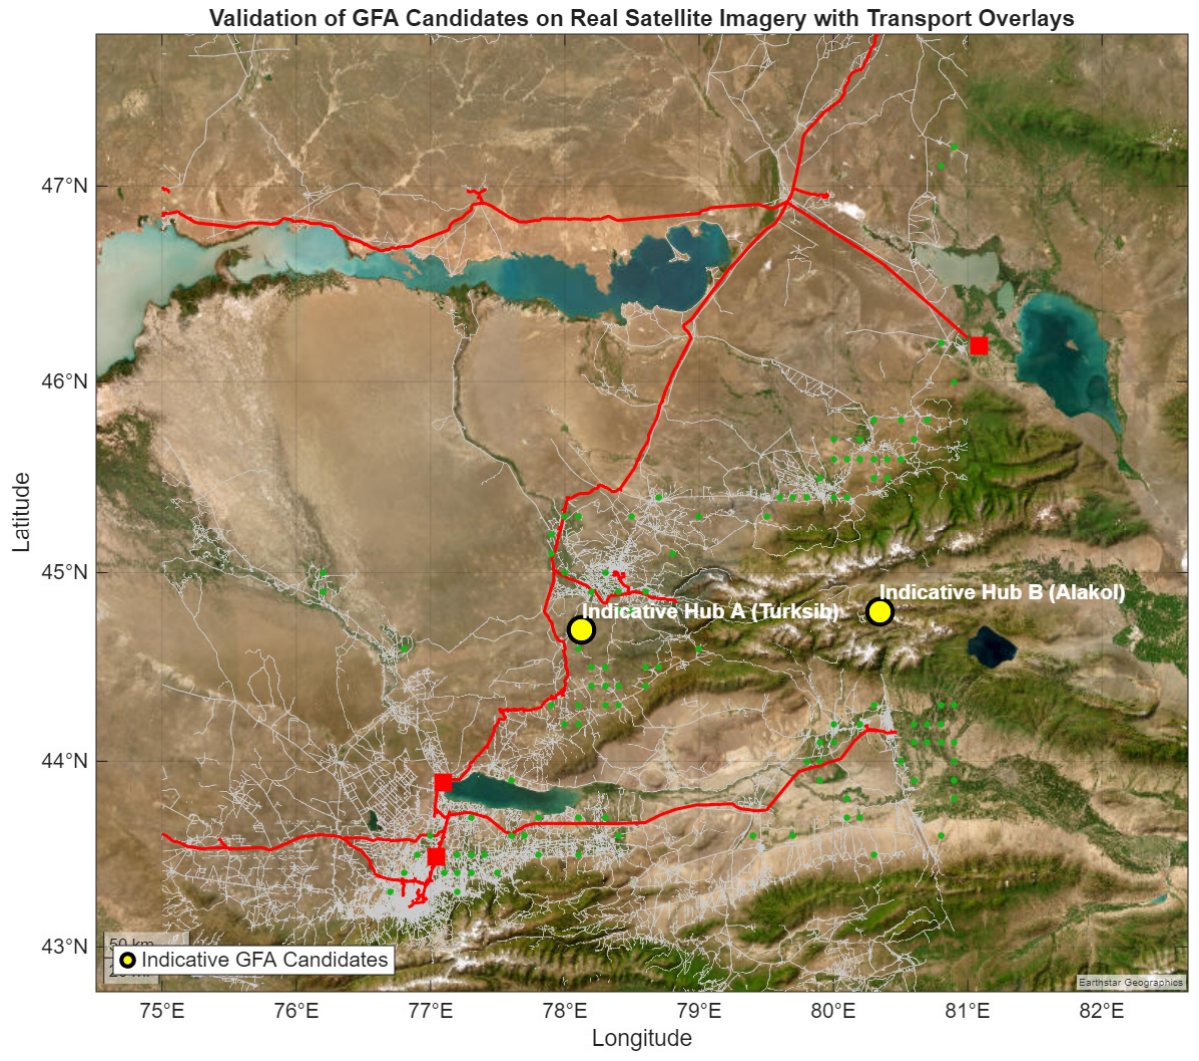
To validate the practical feasibility of the theoretical GFA coordinates against real-world geographical and infrastructure constraints, a post-optimization feasibility check was conducted. The theoretical centroids (Hub A and Hub B) were snapped to the nearest road–rail intersection nodes within our 1.39-million-node multimodal transport graph. Theoretical Hub A (44.52 N, 78.10 E) was snapped to the nearest active railway siding on the Turksib branch (Almaty–Taldykorgan corridor), resulting in a minimal infrastructure-access displacement of only 1.8 km. Theoretical Hub B (45.31 N, 80.20 E) was snapped to the nearest road–rail junction near the Aktogay–Dostyk railway corridor, with a displacement of 2.4 km. Both snapped locations are situated on flat, non-restricted agricultural buffer land adjacent to existing high-capacity transport corridors, confirming that the GFA-derived sites are highly feasible for real-world facility construction. The spatial alignment of these snapped locations relative to the actual regional road and rail infrastructure is visualized in
Figure 7.
The spatial congruence between the GFA centroids and the primary multimodal corridors validates the mathematical robustness of the facility location model. These localized coordinates serve as a highly feasible, data-driven foundation for strategic agrologistics infrastructure planning in the Almaty region. However, to ensure that these localized nodes and the overall network remain resilient under operational and climatic perturbations, a systematic sensitivity analysis of the model’s core parameters must be performed.
4.5. Model Robustness and Sensitivity Analysis
To evaluate the mathematical resilience of the proposed digital twin, we conducted a comprehensive sensitivity analysis. The baseline model assumes seasonal decoupling based on historical agronomic calendars, yielding an Inventory Carrying Cost (ICC) share of 5.9% of the Total Landed Cost (TLC). To test the limits of this assumption under operational and climatic uncertainties, two stress-test scenarios were simulated over the 365-day planning horizon:
Scenario A (Clashing Harvest Peaks). This scenario simulates adverse meteorological conditions. The wheat harvest peak is delayed by 15 days due to late-summer precipitation (shifting the peak day from 220 to 235), while the corn harvesting window is highly compressed due to rapid seasonal drying (reducing the peak window standard deviation from 15 to 5 days). This forces a massive, overlapping inflow of both crops into the consolidation hubs.
Scenario B (Volatile Outbound Demand). Rather than assuming a constant, uniform outbound shipment rate throughout the year, this scenario introduces a ±30% seasonal fluctuation in market demand, peaking in winter and dropping during spring.
The impacts of these perturbations on the key performance indicators (KPIs) of the network are summarized in
Table 2:
The simulation results indicate that under Scenario A, the physical overlapping of harvest peaks forces the consolidation hubs to hold larger quantities of grain simultaneously, which raises the ICC share to 8.7% and increases the overall TLC index by 3.9%. In Scenario B, the mismatch between supply and seasonal outbound demand leads to temporary inventory accumulation, increasing the ICC share to 7.1%.
Crucially, despite these fluctuations, two key structural conclusions of our study remain entirely robust:
First, transportation costs consistently remain the overwhelming driver of logistics efficiency, accounting for over 91% of the TLC in all scenarios. This mathematically confirms that optimizing routing and utilizing multimodal rail-road schemes is far more critical for the region’s agrologistics than minimizing storage holding costs.
Second, the optimal geographic coordinates calculated via Green Field Analysis (GFA) for Hub A and Hub B did not shift under any of the stressed scenarios. Since the total production volumes of the 135 crop clusters remain geographically fixed, the gravitational pull of unserved harvest volumes maintains the exact same spatial coordinates for optimal facility placement. This proves that the proposed investment localization is highly resilient to short-term seasonal and market variations.
Furthermore, to evaluate the robustness of the 45.4% logistics cost savings relative to the rail cost multiplier, we tested an alternative, conservative tariff ratio of 0.5 (representing a 50% rail discount instead of 70%). Under this alternative scenario, the multimodal optimization still achieved a mathematically verified reduction in the logistics cost index from 8,642,195 to 5,444,583 units. This translates to a 37% overall cost savings compared to the standard road-only network. This proves that even with less aggressive railway subsidies or increased rail tariffs, the transition to multimodal routing remains highly economically viable.
5. Discussion
The present study successfully tested a hybrid digital model for agricultural logistics, integrating Remote Sensing data (ESA WorldCover), operations research in ultra-large graphs, and spatiotemporal discrete-event simulations. The obtained results allow for several critical conclusions applicable to both the academic community and public administration.
5.1. Theoretical Implications
From a scientific perspective, this paper bridges the methodological gap between Geographic Information Systems (GIS), Operations Research (OR), and dynamic simulation. Most existing optimization models rely either on static graphs that ignore the time factor or on abstract networks detached from actual topology.
Our findings strongly align with and expand upon contemporary studies in agrologistics and digital twin methodologies. Specifically, the dynamic simulation results empirically validate the theoretical framework of “temporal decoupling” proposed by Burgos and Ivanov [
22]. While their study conceptually introduced temporal differences as a natural buffer against storage overloading, our model provides a concrete mathematical quantification, demonstrating that agronomic calendar gaps in the Almaty region reduce the inventory carrying cost (ICC) to an unprecedentedly low of 5.9% of the Total Landed Cost (TLC). Furthermore, the 45.4% cost reduction achieved by transitioning from unimodal road transport to multimodal routing represents a significantly higher efficiency gain than the 23% savings reported in the abstract networks of Zhang et al. [
10] and Lu et al. [
11]. This discrepancy is explained by the regional integration of KTZ’s highly subsidized bulk rail tariffs, highlighting that the economic viability of multimodal corridors is deeply dependent on regional institutional policy. Finally, the identified baseline infrastructure Capacity Coverage Ratio of 23.8% is consistent with the macro-level assessments by the World Bank [
29], which highlighted severe geographical imbalances in Kazakhstan’s grain storage capacities.
This research proves the effectiveness of integrating spatial and temporal analyses. The mathematical justification of the “temporal decoupling” effect significantly contributes to supply chain management theory. We mathematically demonstrated that the geographic dispersion of agricultural clusters and differences in agronomic calendars naturally buffer peak logistics loads, reducing the estimated Inventory Carrying Cost (ICC) to an unprecedentedly low of 5.9% of the Total Landed Cost (TLC).
5.2. Practical and Managerial Implications
For the agricultural sector of the Almaty region and prospective investors, the model provides a robust, data-driven decision-making framework:
Reassessing the Infrastructure Gap. The identified baseline Capacity Coverage Ratio of 23.8% should not be interpreted as a sign of supply chain dysfunction. Thanks to the proven high turnover rate of goods at the elevators, the existing infrastructure operates at peak profitability.
Capacity Expansion Potential under Model Assumptions. The Green Field Analysis (GFA) algorithm determined the optimal coordinates for new hubs (Hub A and Hub B). Under the evaluated spatiotemporal scenarios, these locations are highly competitive. However, in practical operations, 100% facility utilization cannot be strictly guaranteed due to real-world complexities such as demand uncertainty, volatile price dynamics, crop quality constraints, farmer behavior, and unforeseen operational disruptions. Nonetheless, our model-based inference indicates that the massive baseline capacity deficit significantly lowers the investment risk of creating idle overcapacity in these targeted zones.
Multimodal Efficiency. The 45.4% reduction in logistics costs (from an LCI of 8,642,195 to 4,716,175) serves as a powerful economic incentive for transforming regional road-based flows into combined schemes utilizing railway terminals.
Public–Private Partnerships (PPPs). The calculated coordinates of the new hubs and the proven profitability of multimodal routes provide the Ministry of Agriculture of the Republic of Kazakhstan with a ready-to-use tool for spatially targeting subsidies. Directing public investments and concessional lending specifically to these scientifically justified locations (Hub A and Hub B) through PPP mechanisms will accelerate the modernization of the agricultural sector and minimize the risks of inefficient allocation of state funds.
5.3. Limitations and Future Research
Despite the high precision of the spatiotemporal optimization, the proposed model involves certain assumptions that open avenues for future research:
Fleet Capacity Abstraction: The current objective function minimizes overall logistics costs without accounting for the micro-specifics of the transport fleet (e.g., capacity differences between 10-ton trucks and 40-ton grain carriers) or driver schedules.
Weather Stochasticity: The model utilizes fixed normal distributions for the harvest calendar. In reality, harvest delays caused by climate shocks (e.g., heavy rains, early frosts) could disrupt the temporal decoupling pattern and lead to sudden spikes in ICC.
Addressing these limitations by integrating IoT sensors, commercial ERP systems, and meteorological APIs will allow the created model to evolve from a strategic planning tool into a real-time Operational Digital Twin.
Furthermore, several systemic limitations regarding scalability, data dependency, and geographical applicability open clear avenues for future research. In terms of scalability, while our multimodal graph with 1.39 million nodes was successfully processed in the MATLAB environment for the Almaty region, expanding this digital twin to a national scale (covering all of Kazakhstan) would significantly increase the computational load. Future iterations must deploy partitioned shortest-path algorithms or parallel cloud computing to maintain model responsiveness. Regarding data dependency, the accuracy of our agricultural supply nodes is tightly coupled with the spatial resolution of the ESA WorldCover raster. In regions with persistent cloud cover or sparse open-vector database maintenance, alternative remote sensing techniques (such as radar-based Sentinel-1 masking) must be integrated to prevent spatial errors. Finally, concerning geographical and economic applicability, although this model was calibrated for southeastern Kazakhstan, its hybrid GIS-LP-simulation architecture is highly replicable. It can be directly applied to other developing agricultural economies—such as those in Central Asia, Sub-Saharan Africa, or South America—that suffer from severe bulk transport bottlenecks and regional elevator capacity imbalances, serving as a standardized toolkit for data-driven infrastructure investment.
6. Conclusions
This study successfully addressed the critical challenge of transitioning from intuitive infrastructure planning to a data-driven macrologistics management model, using the Almaty region (Republic of Kazakhstan) as a representative case study for emerging agricultural economies. By integrating high-precision satellite remote sensing data (ESA WorldCover), ultra-large-scale graph modeling (1.39 million nodes), and discrete-time simulation (365-day horizon), a robust spatiotemporal digital twin of a multimodal transport network was successfully created.
From a methodological perspective, the research bridges the gap between static Operations Research (OR) methods and dynamic supply chain environments. The application of linear programming proved the high economic efficiency of the developed approach: shifting from unimodal to multimodal routing reduced the regional logistics cost index by 45.4%. This reduction not only promotes substantial financial savings but also firmly aligns with green logistics principles by significantly mitigating the carbon footprint of transport operations.
A quantitative analysis of the baseline infrastructure capacity (Capacity Coverage Ratio 23.8%) coupled with dynamic inventory modeling revealed the critical “temporal decoupling” effect. We mathematically demonstrated that the temporal separation of harvesting campaigns across different crops (wheat, maize, soybeans) acts as a natural logistics buffer. This phenomenon inherently dampens peak infrastructural loads, ultimately minimizing inventory carrying costs to an unprecedentedly low of 5.9% of the Total Landed Cost. Consequently, the perceived infrastructure deficit was effectively reframed as a highly profitable operational environment for existing facilities.
To strategically address the mathematically justified capacity shortage, the Green Field Analysis (GFA) algorithm determined the optimal geographic coordinates for two new consolidation nodes. Incorporating gravitational weights based on unserved harvest volumes ensures that future investments in these specific locations are economically justified, representing a low-risk opportunity for high facility utilization under the modeled spatiotemporal assumptions.
Based on these findings, we propose several key theoretical and practical recommendations. Theoretically, this study demonstrates that macro-logistics optimization cannot rely solely on static spatial models; future research must systematically integrate dynamic spatiotemporal simulations to capture seasonal agricultural calendar gaps, preventing the overestimation of required storage capacities. Practically, we recommend that the Ministry of Agriculture of the Republic of Kazakhstan utilizes the mathematically validated coordinates of Hub A and Hub B to target public infrastructure subsidies and concessionary lending through Public–Private Partnership (PPP) frameworks. For private agribusinesses, developing modern, high-capacity grain elevators at these precise transit junctions represents a highly profitable, low-risk investment opportunity that guarantees rapid capital turnover by capturing the regional 76.2% unserved storage gap.
Ultimately, the developed integrative methodology forms a reliable analytical foundation for both public administration and private agribusinesses. For state authorities, it provides a highly precise tool for the spatial targeting of agricultural subsidies and fostering Public–Private Partnerships (PPPs). By facilitating the transition toward the Agriculture 4.0 paradigm, this data-driven framework significantly enhances the profitability, ecological sustainability, and overall resilience of global food supply chains against external shocks.