1. Introduction
Inventory classification constitutes a fundamental decision-support mechanism in supply chain and operations management. Modern organizations frequently manage thousands or even hundreds of thousands of stock-keeping units (SKUs), making it impractical to apply identical inventory control policies to every item [
1,
2]. In this context, the integration of Industry 4.0 and Internet of Things (IoT) technologies has driven a significant transition from static, manual replenishment policies toward dynamic, data-driven systems [
3]. Consequently, inventory classification systems are employed to prioritize managerial attention, allocate limited resources efficiently, and design differentiated replenishment policies across groups of items with similar characteristics.
Among these approaches, the classical ABC classification method remains the most widely adopted technique in industrial practice. Rooted in the Pareto principle, ABC analysis categorizes inventory items based on their annual consumption value, typically defined as the product of annual demand and unit cost [
4,
5]. The underlying assumption is that a small fraction of items accounts for the majority of the financial impact of inventory operations. Accordingly, firms concentrate tighter control and higher service levels on the most economically significant items while managing lower-value items with more relaxed policies.
Despite its widespread adoption, the traditional ABC approach exhibits important structural limitations when applied to modern supply chains characterized by uncertainty and operational complexity. In particular, ABC classification relies on a single financial metric and does not explicitly consider critical operational factors such as demand variability, supply lead times, or the functional importance of components within production systems [
6,
7]. As a result, inexpensive items with high operational criticality or long procurement lead times may be incorrectly assigned to low-priority classes, potentially increasing the risk of disruptive stockouts.
To address these limitations, researchers have proposed numerous extensions to the classical ABC framework. Multi-criteria inventory classification (MCIC) methods incorporate additional quantitative and qualitative variables—such as lead time, demand variability, or item criticality—into the classification process using decision-making models including the Analytic Hierarchy Process, TOPSIS, and mathematical programming approaches [
8,
9,
10]. These approaches aim to generate a more comprehensive representation of inventory importance by integrating multiple operational dimensions.
More recently, advances in data-driven analytics and machine learning have enabled the use of clustering algorithms to segment inventory items based on multidimensional operational characteristics. Unsupervised learning techniques such as K-means clustering can identify homogeneous groups of items without relying on predefined managerial thresholds, thereby providing a statistically grounded alternative to traditional rule-based classifications [
6,
11]. However, while clustering-based segmentation has shown promise in identifying operationally meaningful inventory groups, relatively few studies have evaluated the practical impact of such classifications on inventory policy performance.
Another important limitation in the existing literature concerns the validation of inventory classification methods. Many studies focus on developing classification models without systematically evaluating how these classifications influence key operational performance metrics such as service levels, stockout frequencies, or average inventory investment. Discrete-event simulation has emerged as a powerful tool for analyzing stochastic inventory systems and assessing the operational consequences of alternative classification policies under uncertain demand and lead-time conditions [
12,
13]. Nevertheless, simulation-based validation of data-driven classification approaches remains relatively limited.
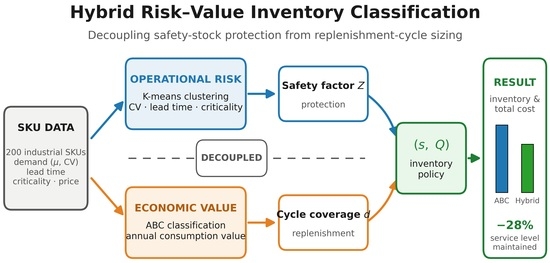
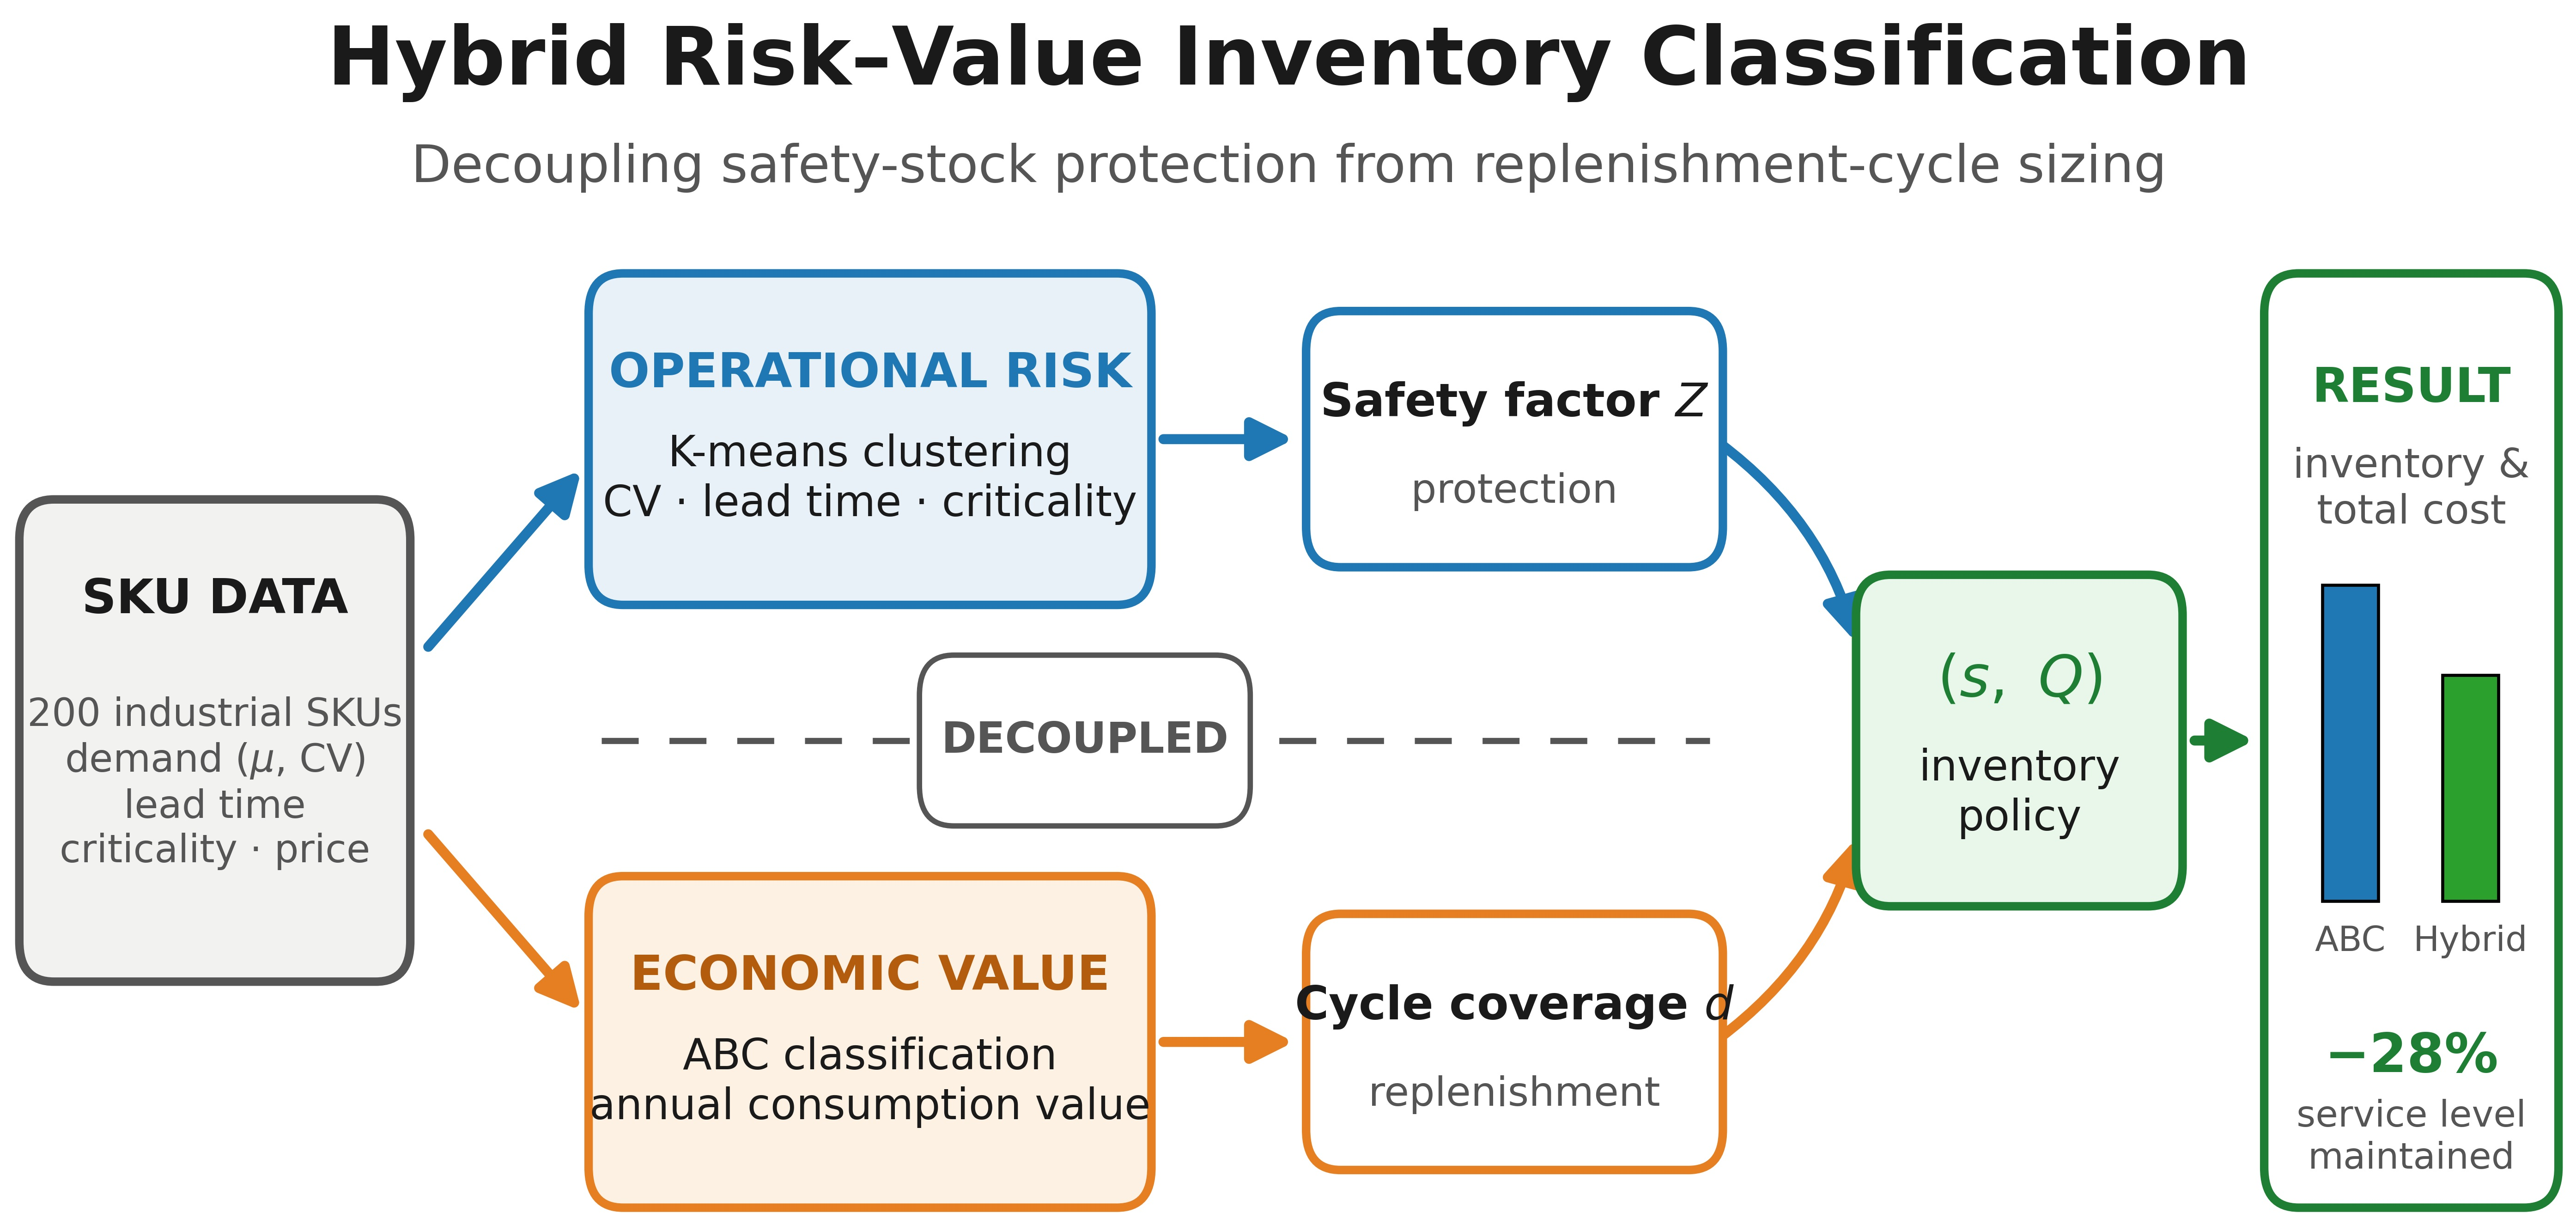
Motivated by these gaps, this study proposes a Hybrid Risk-Value inventory classification framework that segments items using operational risk clustering to guide safety stock levels, while using annual consumption value (ABC) to determine cycle inventory coverage. By decoupling these two decisions, the proposed framework combines the strengths of risk-aware protection with value-aware purchasing cycles. The proposed framework is evaluated using stochastic simulation to assess the operational and economic trade-offs in terms of service level, stockouts, and total logistical costs.
Specifically, the contributions of this research are threefold. First, the study introduces an objective, data-driven inventory classification framework that leverages multivariate clustering to identify latent risk profiles, moving beyond the subjective weighting procedures common in the existing Multi-Criteria Inventory Classification (MCIC) literature. Second, by decoupling safety stock (parametrized via multivariate operational risk clusters) and replenishment order quantities (parametrized via financial ABC classes), the proposed Hybrid Risk-Value framework provides a more capital-efficient inventory policy than traditional value-based ABC analysis; our benchmarking against a coupled ABC-XYZ policy further indicates that these gains are attributable to the decoupling itself rather than to the specific segmentation variables used. Third, the framework is validated through a comprehensive stochastic simulation study using a real-world industrial dataset, providing empirical evidence of the operational benefits in terms of service-level stability and inventory investment efficiency.
Conceptually, the central contribution of this work is not a particular clustering algorithm but the
decoupling principle itself: separating the protective logic of safety stock—a response to operational and supply risk [
14]—from the economic logic of replenishment-cycle sizing. The multivariate clustering is the data-driven, threshold-free instrument through which this principle is operationalized, and it is expected to be most beneficial in environments where operational risk is genuinely multidimensional rather than dominated by a single factor such as demand variability.
The remainder of this paper is structured as follows.
Section 2 reviews the relevant literature on inventory classification, multi-criteria decision models, clustering-based approaches, and simulation-based evaluation of inventory systems.
Section 3 presents the proposed methodology, including the clustering framework and the simulation model.
Section 4 reports the experimental results and comparative performance analysis.
Section 5 discusses the managerial implications and limitations of the proposed approach. Finally,
Section 6 concludes the study and outlines directions for future research.
2. Literature Review
2.1. ABC Inventory Classification: Foundations and Extensions
The ABC inventory classification method represents one of the earliest and most widely adopted techniques for inventory prioritization in supply chain and operations management. Its theoretical foundation is derived from the Pareto principle, which states that a relatively small proportion of causes often accounts for the majority of effects in many economic and operational systems. When applied to inventory management, this principle suggests that a limited subset of stock-keeping units (SKUs) typically generates the largest share of the total inventory value or consumption volume [
4,
5,
15,
16]. Despite its simplicity, the ABC method plays a central role in inventory control because it enables firms to allocate managerial attention and control policies according to the economic importance of items [
17,
18].
In operational practice, ABC classification ranks inventory items according to their annual consumption value, commonly defined as the product of the annual demand rate and the unit acquisition cost. Formally, the annual consumption value for item
i can be expressed as
where
denotes the annual demand quantity of item
i, and
represents its average unit cost. Once this metric is computed for all items, the SKUs are sorted in descending order according to
, and cumulative percentages of total inventory value are calculated. Based on predefined Pareto thresholds, items are then assigned to three primary categories: Class A, Class B, and Class C.
Typically, Class A contains approximately 10–20% of the items that account for roughly 70–80% of the total consumption value, while Class B represents an intermediate group with moderate financial impact. Class C usually comprises the majority of inventory items but contributes only a small proportion of the total value [
5,
19]. This hierarchical segmentation enables firms to allocate managerial attention and operational resources more efficiently, focusing stricter control policies and higher service targets on the economically most significant items.
The practical attractiveness of ABC classification lies primarily in its simplicity and ease of implementation. The method requires minimal computational effort and relies on readily available accounting data, which explains its widespread adoption across manufacturing, retail, and service industries [
4,
7]. In many organizations, ABC analysis serves as the initial step in inventory policy design, guiding decisions regarding safety stock levels, replenishment frequencies, and monitoring intensity.
Despite these advantages, the classical ABC framework has been subject to significant criticism in the operations research literature. A fundamental limitation arises from its reliance on a single financial metric to represent inventory importance. By focusing exclusively on annual consumption value, the method implicitly assumes that economic expenditure directly reflects operational risk and system criticality [
4]. However, in complex supply chains, inexpensive items may still play crucial functional roles, particularly when their absence disrupts production processes or delays customer orders. Several studies have pointed out that the traditional ABC approach may overlook important operational factors such as demand variability, lead time, or supply uncertainty, which can significantly influence inventory performance [
8,
20].
Furthermore, traditional ABC analysis does not explicitly account for stochastic characteristics of demand or supply processes. Variables such as demand variability, procurement lead times, and component criticality can substantially influence the appropriate inventory control policy for an item, yet they are not incorporated into the classical ranking procedure [
6]. Consequently, items with relatively low financial value but high uncertainty or long replenishment lead times may be misclassified into lower priority categories, potentially increasing the likelihood of costly stockouts.
In response to these structural limitations, numerous extensions of the ABC framework have been proposed in the literature. Early developments introduced multi-dimensional classification matrices that combined financial value with additional operational attributes. One widely adopted extension is the ABC-XYZ matrix, which incorporates demand variability into the classification process by evaluating the coefficient of variation of demand alongside annual consumption value [
5]. This approach enables organizations to differentiate between items with stable demand patterns and those exhibiting high volatility. Empirical case studies in manufacturing environments have demonstrated that integrating ABC-XYZ classifications can reduce dead stock and significantly optimize safety-stock levels under realistic logistics constraints [
21].
Subsequent research has expanded these ideas through the development of multi-criteria inventory classification models that integrate multiple quantitative and qualitative variables within a unified decision framework. These models frequently employ multi-criteria decision-making (MCDM) techniques, mathematical programming, or machine learning methods to construct more comprehensive representations of inventory importance [
6,
8,
9]. Such approaches attempt to capture the multidimensional nature of inventory risk by considering factors such as procurement lead time, demand uncertainty, and operational criticality.
Table 1 summarizes several representative methodological extensions that have been proposed to overcome the limitations of traditional ABC classification.
Although these methodological advances have substantially expanded the analytical capabilities of inventory classification systems, an important limitation remains. Many proposed models primarily focus on improving the classification process itself without systematically evaluating the operational consequences of the resulting segmentation on inventory policy performance. In particular, the extent to which alternative classification schemes influence the trade-off between service levels and inventory investment remains insufficiently explored.
This limitation motivates the growing interest in integrating data-driven classification approaches with simulation-based evaluation frameworks. By combining classification models with stochastic simulation, researchers can analyze how alternative segmentation strategies affect key operational performance indicators such as fill rates, stockout frequencies, and average inventory levels. The following sections review the literature on multi-criteria inventory classification methods, clustering-based segmentation approaches, and simulation-based validation techniques.
2.2. Multi-Criteria Inventory Classification Approaches
The limitations of traditional ABC classification have motivated the development of multi-criteria inventory classification (MCIC) approaches that incorporate multiple operational attributes into the segmentation process. Unlike the classical ABC method, which relies exclusively on annual consumption value, MCIC frameworks recognize that inventory importance is inherently multidimensional and cannot be adequately represented by a single financial metric [
2,
4,
8,
23,
24]. These approaches integrate factors such as demand variability, procurement lead times, or component criticality through multi-criteria decision-making techniques.
In practical supply chain environments, several factors beyond financial consumption influence the operational significance of inventory items. Procurement lead time determines the exposure of the system to supply disruptions, while demand variability affects the magnitude of safety stock required to maintain a target service level. Similarly, component criticality measures the operational impact of a stockout, particularly in production systems where the absence of a single component may halt an entire assembly process [
7]. By incorporating these and other criteria, MCIC models attempt to provide a more comprehensive representation of inventory risk and operational importance.
A large portion of the literature on MCIC relies on multi-criteria decision-making (MCDM) techniques to integrate heterogeneous criteria into a unified evaluation framework. Various MCDM methods have been applied, including the Analytic Hierarchy Process (AHP), fuzzy logic models, and optimization-based weighting schemes [
25,
26,
27]. For example, AHP structures the decision problem as a hierarchy of criteria and uses pairwise comparisons to determine their relative importance [
25]. Through this process, both quantitative and qualitative criteria can be incorporated into a composite priority score that reflects the overall relevance of each inventory item.
Another widely used class of MCIC models is based on distance-based decision methods, such as the Technique for Order Preference by Similarity to Ideal Solution (TOPSIS). In this approach, items are evaluated according to their geometric proximity to an ideal solution that simultaneously maximizes beneficial attributes and minimizes undesirable ones [
10]. By comparing each item with both an ideal and a negative-ideal reference point, TOPSIS identifies inventory priorities based on their relative closeness to optimal operational performance.
Optimization-based models have also been proposed to overcome the subjectivity associated with predefined criteria weights. Ramanathan [
8] introduced a weighted linear optimization model that determines optimal criteria weights for each item by maximizing its composite performance score across multiple dimensions. This formulation, inspired by principles of Data Envelopment Analysis, generates a ranking that reflects the most favorable combination of criteria for each inventory item.
Subsequent research has refined these optimization-based frameworks in order to improve their discriminatory power and structural consistency. For example, Ng [
22] proposed a simplified classifier model that avoids complex optimization procedures while maintaining the ability to integrate multiple criteria. Similarly, Hadi-Vencheh [
9] introduced a nonlinear programming formulation designed to ensure that criteria weights remain influential in the final classification results. These methodological developments attempt to balance computational tractability with robust representation of inventory characteristics.
Beyond traditional MCDM techniques, recent research has also incorporated soft computing and artificial intelligence approaches into multi-criteria inventory classification. Methods based on fuzzy logic allow the representation of linguistic and imprecise criteria, such as substitutability or obsolescence risk, which cannot be easily quantified through conventional numerical metrics [
28,
29]. Similarly, machine learning methods have been explored to automatically learn classification patterns from historical operational data.
Despite the methodological diversity of MCIC approaches, several structural limitations remain. Many models require subjective judgments regarding criteria selection and weighting, which may introduce managerial bias into the classification process. Additionally, most MCIC methods focus primarily on improving the ranking of items rather than evaluating how the resulting classifications influence inventory policy performance. As a consequence, relatively limited attention has been devoted to analyzing the operational consequences of alternative classification schemes in terms of service levels, stockout risk, and inventory investment.
Table 2 summarizes several representative methodological approaches that have been proposed for multi-criteria inventory classification.
Although MCIC models significantly improve the descriptive representation of inventory importance, they generally remain rooted in deterministic ranking frameworks. Most methods ultimately produce a priority score or ordered list of items, which is subsequently used to define inventory classes through predefined thresholds. This approach still requires managerial decisions regarding class boundaries and may fail to capture latent structural patterns present in multidimensional inventory datasets.
These limitations have motivated the exploration of data-driven segmentation techniques capable of automatically identifying homogeneous groups of inventory items based on operational characteristics. In particular, clustering algorithms have emerged as a promising alternative for inventory classification, as they allow the formation of statistically coherent groups without relying on predefined ranking thresholds. The following section reviews the application of clustering and machine learning techniques in inventory segmentation.
2.3. Clustering and Machine Learning in Inventory Segmentation
The increasing availability of operational data has stimulated the application of data-driven methods for inventory segmentation. In contrast to traditional classification approaches that rely on deterministic ranking procedures, clustering algorithms, as unsupervised machine learning techniques, enable the automatic identification of homogeneous groups of inventory items based on multidimensional characteristics. By partitioning a dataset into groups whose internal similarity is maximized and separation is preserved, these algorithms provide a natural mechanism for grouping inventory items with similar operational characteristics without imposing predefined classification thresholds [
1,
6,
11].
One of the earliest attempts to apply clustering concepts in inventory management was proposed by Cohen and Ernst [
30], who introduced the notion of operations-related groups in order to categorize inventory items according to production, distribution, and financial attributes. This approach aimed to capture structural similarities between items that could not be detected through traditional value-based ranking procedures. By grouping items with similar operational characteristics, firms could design differentiated control policies more effectively.
More recent studies have explored the use of standard clustering algorithms such as the K-means method to segment inventory datasets. The K-means algorithm partitions a set of observations into
k clusters by minimizing the within-cluster sum of squared distances between observations and their corresponding cluster centroids. Formally, given a dataset of
n items represented by feature vectors
, the algorithm solves the following optimization problem:
where
represents cluster
j and
denotes the centroid of that cluster.
Within the context of inventory management, clustering variables typically include financial attributes such as unit cost or annual consumption value, as well as operational characteristics such as demand variability, forecast accuracy, lead times, and service performance indicators [
1,
6]. By jointly analyzing these variables, clustering algorithms can reveal latent structures in inventory datasets and identify groups of items sharing similar operational risk profiles.
Hybrid approaches combining clustering with multi-criteria decision models have also been proposed in the literature. For example, Lolli et al. [
6] developed a methodology in which the Analytic Hierarchy Process is first used to compute priority scores for inventory items, after which K-means clustering is applied to partition items into coherent classes. This hybrid strategy reduces the subjectivity associated with manually defining classification thresholds while maintaining the ability to incorporate multiple operational criteria. Furthermore, recent research has integrated machine learning clustering with multi-criteria decision-making (MCDM) methods to optimize critical warehouse processes like cycle counting, showing that grouping SKUs dynamically based on risk and operational features outperforms traditional rigid structures [
31].
Recent studies have also explored more advanced machine learning techniques to improve the interpretability and predictive power of clustering-based inventory segmentation. For instance, Keskin and Taskin [
11] discuss the integration of clustering algorithms with explainable artificial intelligence frameworks, allowing decision makers to understand which variables drive the formation of specific clusters. Such developments aim to address the common criticism that machine learning models behave as “black-box” decision systems.
Despite these advances, several challenges remain in the application of clustering methods to inventory classification. First, many clustering-based approaches emphasize the statistical properties of the segmentation rather than its operational implications. In other words, clusters are often evaluated based on internal metrics such as cohesion or silhouette scores without assessing how the resulting groups influence inventory policy performance. Second, the selection of clustering variables varies considerably across studies, which may limit the comparability of results and the generalizability of conclusions.
Another important limitation is that clustering methods are rarely validated through comprehensive operational experiments. While clustering can reveal meaningful structural patterns in inventory datasets, the practical value of these classifications ultimately depends on their impact on inventory control policies and supply chain performance. In particular, it remains unclear whether data-driven clustering approaches can improve the fundamental trade-off between service level and inventory investment when compared with traditional classification methods such as ABC.
These limitations suggest that clustering-based inventory classification should not be evaluated solely as a statistical segmentation tool but rather as a decision-support mechanism whose effectiveness must be assessed through operational performance metrics. In this context, simulation-based experimentation provides a suitable framework for evaluating how alternative classification strategies affect service levels, stockout frequencies, and average inventory levels under stochastic demand conditions.
The next section therefore reviews the use of simulation models as an evaluation framework for inventory policies and classification strategies.
Table 3 summarizes representative studies that apply clustering techniques to inventory classification and highlights their methodological focus and validation approaches.
Previous studies have incorporated a wide variety of financial, operational, and risk-related variables in inventory classification models.
Table 4 summarizes some of the most commonly used variables in the literature and their operational interpretations.
These variables typically capture three major dimensions of inventory behavior: financial importance, demand uncertainty, and supply risk. The proposed framework builds upon this literature by integrating demand variability, procurement lead time, and assembly criticality to construct a risk-oriented clustering representation of inventory items.
2.4. Simulation-Based Evaluation of Inventory Policies
Analytical models in inventory management have traditionally relied on simplifying assumptions in order to obtain closed-form solutions for optimal replenishment policies. Classical models typically assume stationary demand distributions, deterministic lead times, or simplified cost structures. While such assumptions enable tractable mathematical formulations, they often fail to capture the stochastic and dynamic characteristics of real-world supply chains [
13,
32]. In particular, when both demand and lead times exhibit uncertainty, analytical solutions become increasingly difficult to derive and may no longer accurately represent operational behavior.
Simulation techniques are widely used to evaluate stochastic inventory systems when analytical solutions become intractable. Discrete-event simulation, in particular, enables the modeling of complex operational environments in which demand arrivals, replenishment processes, and inventory decisions evolve over time. By explicitly representing these temporal dynamics, simulation models can capture phenomena that are difficult to analyze analytically, such as overlapping replenishment orders, random lead-time variability, and nonlinear service level responses, allowing researchers to evaluate the operational consequences of alternative inventory classification strategies under realistic uncertainty conditions [
12,
13,
32,
33,
34].
Within the context of inventory classification research, simulation has been widely used to evaluate the operational consequences of alternative classification strategies. Instead of relying solely on theoretical ranking metrics, simulation experiments allow researchers to measure the actual impact of classification schemes on key performance indicators such as service levels, stockout frequencies, and average inventory investment. This approach provides a more realistic assessment of how classification decisions influence the behavior of inventory control policies in stochastic environments.
Service level metrics constitute the most common performance indicators used in such evaluations. Among these, the fill rate represents the proportion of total demand satisfied directly from available inventory, while the cycle service level measures the probability that no stockout occurs during a replenishment cycle [
35]. These metrics are frequently analyzed alongside measures of inventory efficiency, such as average on-hand inventory or safety stock levels, in order to evaluate the trade-off between service performance and capital investment [
12].
Several studies have employed simulation models to validate inventory classification methods and their associated replenishment policies. For example, Babai et al. [
12] used simulation to analyze the inventory performance of multiple multi-criteria classification models under continuous review policies, demonstrating that classification methods directly influence both service levels and holding costs. Similarly, large-scale simulation experiments have been used to evaluate inventory control strategies across thousands of stock-keeping units, enabling researchers to examine the system-wide implications of classification and policy decisions.
Despite these advances, simulation-based validation remains relatively limited in studies that incorporate data-driven classification techniques. While clustering algorithms can reveal meaningful structural patterns within inventory datasets, relatively few studies evaluate how such classifications affect operational performance when implemented within stochastic inventory control policies. In particular, there is limited empirical evidence regarding the effectiveness of clustering-based segmentation in improving the service–inventory trade-off when compared to traditional value-based classification methods.
These observations highlight the importance of combining data-driven segmentation approaches with simulation-based evaluation frameworks in order to assess their practical implications for inventory management.
2.5. Literature Synthesis and Research Gap
The literature on inventory classification has evolved significantly in recent decades. Yet, several important gaps remain in the existing literature. First, many proposed classification methods focus primarily on improving the descriptive accuracy of inventory segmentation rather than evaluating their operational consequences. Second, while clustering techniques have been increasingly applied to inventory classification, their operational impact has rarely been evaluated through systematic simulation experiments. Third, relatively few studies evaluate classification strategies across multiple uncertainty environments.
More fundamentally, a critical conceptual gap in the existing literature concerns the coupling of replenishment cycle and safety stock decisions. Traditional ABC and multi-criteria methods (including ABC-XYZ and conventional MCIC models) apply coupled policy rules, where an item’s class determines both its safety factor Z (for stockout protection) and its cycle coverage d (for replenishment batch size). This coupling creates severe structural inefficiencies:
ABC-XYZ Matrix: While it incorporates demand variability ( dimensions), it still uses rigid, coupled logic (e.g., Class AX gets tight safety stock and short cycles, while CX gets loose safety stock and long cycles). It does not explicitly account for lead times or assembly criticality, and it still ties safety stock protection to economic value.
Multi-Criteria Inventory Classification (MCIC): These models integrate multiple operational criteria (lead time, criticality, CV) using weighting schemes (e.g., AHP, TOPSIS). However, by combining financial and operational attributes into a single composite index, the distinct physics of cycle stock (driven by transaction costs and unit price) and safety stock (driven by variance and lead-time exposure) are conflated. An item with high unit price and low volatility may end up with the same high safety stock as an inexpensive item with extreme volatility, leading to capital inefficiency.
This study addresses these gaps by proposing a Hybrid Risk-Value inventory classification framework that formally decouples safety stock and replenishment decisions. We argue that safety stock is conceptually a protective mechanism against uncertainty (variance in demand and supply), which should be sized strictly based on multivariate operational risk clusters (). Conversely, replenishment order quantity () is an economic mechanism balancing ordering cost and holding cost, which should be sized strictly based on the annual consumption value () via ABC analysis. By dividing these dimensions, the proposed framework combines risk-aware protection with value-aware purchasing cycles. We validate this decoupling framework via stochastic discrete-event simulation under multiple experimental scenarios, and compare its performance directly against the classical ABC method on a real-world industrial dataset.
3. Methodology
3.1. Problem Formulation
Inventory classification methods aim to support managerial decisions by grouping stock-keeping units (SKUs) according to their relative importance. The classical ABC method prioritizes items based on their annual consumption value, which implicitly assumes that economic impact is the main driver of operational risk. However, in environments characterized by demand uncertainty, heterogeneous lead times, and functional criticality, value-based classification may fail to reflect the true risk associated with stockouts.
This study compares two inventory classification schemes: (i) the traditional ABC method, and (ii) the proposed Hybrid Risk-Value classification framework that decouples safety stock and replenishment decisions by combining multivariate operational risk clustering with economic value (ABC) classification.
The objective is to evaluate both approaches in terms of operational performance, measured by the service level (fill rate), while considering average inventory value and total logistical costs as secondary efficiency criteria. The central hypothesis is that decoupling safety stock (sized by operational risk) and replenishment quantities (sized by financial value) enables a more efficient allocation of replenishment policies than traditional value-based or pure risk-based models.
3.2. Data Description
Each SKU
is characterized by the vector
where
denotes the mean daily demand,
the coefficient of variation of demand,
the replenishment lead time (days),
the quantity required per assembly (criticality indicator),
the initial inventory level, and
the unit price.
The experimental evaluation is based on an anonymized dataset of 200 stock-keeping units (SKUs) obtained from an industrial automotive supplier. This real-world dataset captures the inherent heterogeneity of industrial components, including stable items, volatile components, critical low-cost items, and high-value parts, representing the joint covariance structure of the key features (, , , q).
For the purpose of performance analysis, items are grouped into five representative categories based on their operational profiles: Low-Cost Critical, Low-Cost Stable, Low-Cost Unstable, High-Cost Stable, and High-Cost Unstable.
3.3. Inventory Simulation Model
To evaluate operational performance, a discrete-time inventory simulation model with a continuous-review replenishment policy is employed. Each day, the inventory position—defined as the on-hand inventory plus all outstanding replenishment orders in transit—is reviewed; whenever it falls to or below the reorder point s, an order of size Q is placed and arrives after a fixed lead time . Because the reorder trigger is based on the inventory position rather than on-hand stock, more than one order may be in transit simultaneously for fast-moving or long-lead-time SKUs, which prevents systematic under-ordering during the lead-time window. Demand that cannot be served from on-hand inventory on a given day is treated as lost sales (it is not backordered).
Daily demand is modeled as a continuous, non-negative stochastic variable following a Gamma distribution, which naturally handles skewed behaviors and avoids negative demand:
where the shape parameter
and scale parameter
are defined in terms of the SKU’s mean daily demand
and coefficient of variation
:
On-hand inventory evolves according to the lost-sales recursion
where
represents the replenishment quantity received at the start of day
t. The
operator enforces the lost-sales assumption, as on-hand inventory cannot become negative; the unmet portion of demand,
, is recorded as a lost sale. The complete per-SKU simulation logic is summarized in Algorithm 1.
| Algorithm 1 Simulation of a single SKU under policy
|
- 1:
Initialize on-hand ; in-transit pipeline ; outstanding-order list - 2:
for to T do - 3:
Receive arrivals scheduled for day t: , - 4:
Generate demand - 5:
Record lost sales ; serve demand - 6:
Accumulate on-hand inventory I for the period average - 7:
Compute inventory position - 8:
if then - 9:
Place order of size Q (arrival at ): - 10:
end if - 11:
end for
|
3.4. Calibration of Parameters and Policies
The
replenishment policy is calibrated dynamically for each SKU
i. The order quantity
and the reorder point
are defined as:
where
denotes the cycle coverage (replenishment frequency in days), and
represents the safety stock, formulated as:
where
is the safety factor and
is the standard deviation of demand over the (constant) lead time, obtained from the daily demand standard deviation
scaled by
under the assumption of independent daily demands.
Under the traditional ABC classification, parameters are assigned strictly based on financial class boundaries (A: top 20%, B: next 30%, C: rest 50% based on annual consumption value). The safety factors are set to (corresponding to target service levels of 99%, 95%, and 90%) and cycle coverages are set to days for classes A, B, and C, respectively.
Under the proposed Hybrid Risk-Value framework, safety stocks and cycle coverages are decoupled. The safety factors are determined by the operational risk cluster of the SKU, while the replenishment cycle coverages are governed by its economic ABC class. In the final calibrated configuration, the safety factors are set to for the High Risk, Medium Risk, and Low Risk operational clusters, respectively, ensuring high protection for volatile and long-lead-time items. Replenishment cycle coverages are set to days for economic classes A, B, and C, respectively, to limit the capital tied up in cycle stock.
The safety factors are not chosen arbitrarily: the values
correspond to standard one-sided normal service-level targets of approximately 90%, 95%, 97.7%, 99%, and 99.87%, respectively. The cycle coverages were obtained through preliminary calibration on the dataset. To verify that the reported results do not depend on these specific choices,
Section 4.7 reports a sensitivity analysis that varies both
Z and
d around the calibrated configuration.
4. Results and Performance Analysis
4.1. Operational Risk Clustering Results
The K-means clustering algorithm was executed on the three standardized operational risk features—demand variability (
), lead time (
), and assembly criticality (
q)—of the 200 SKUs. A structure with
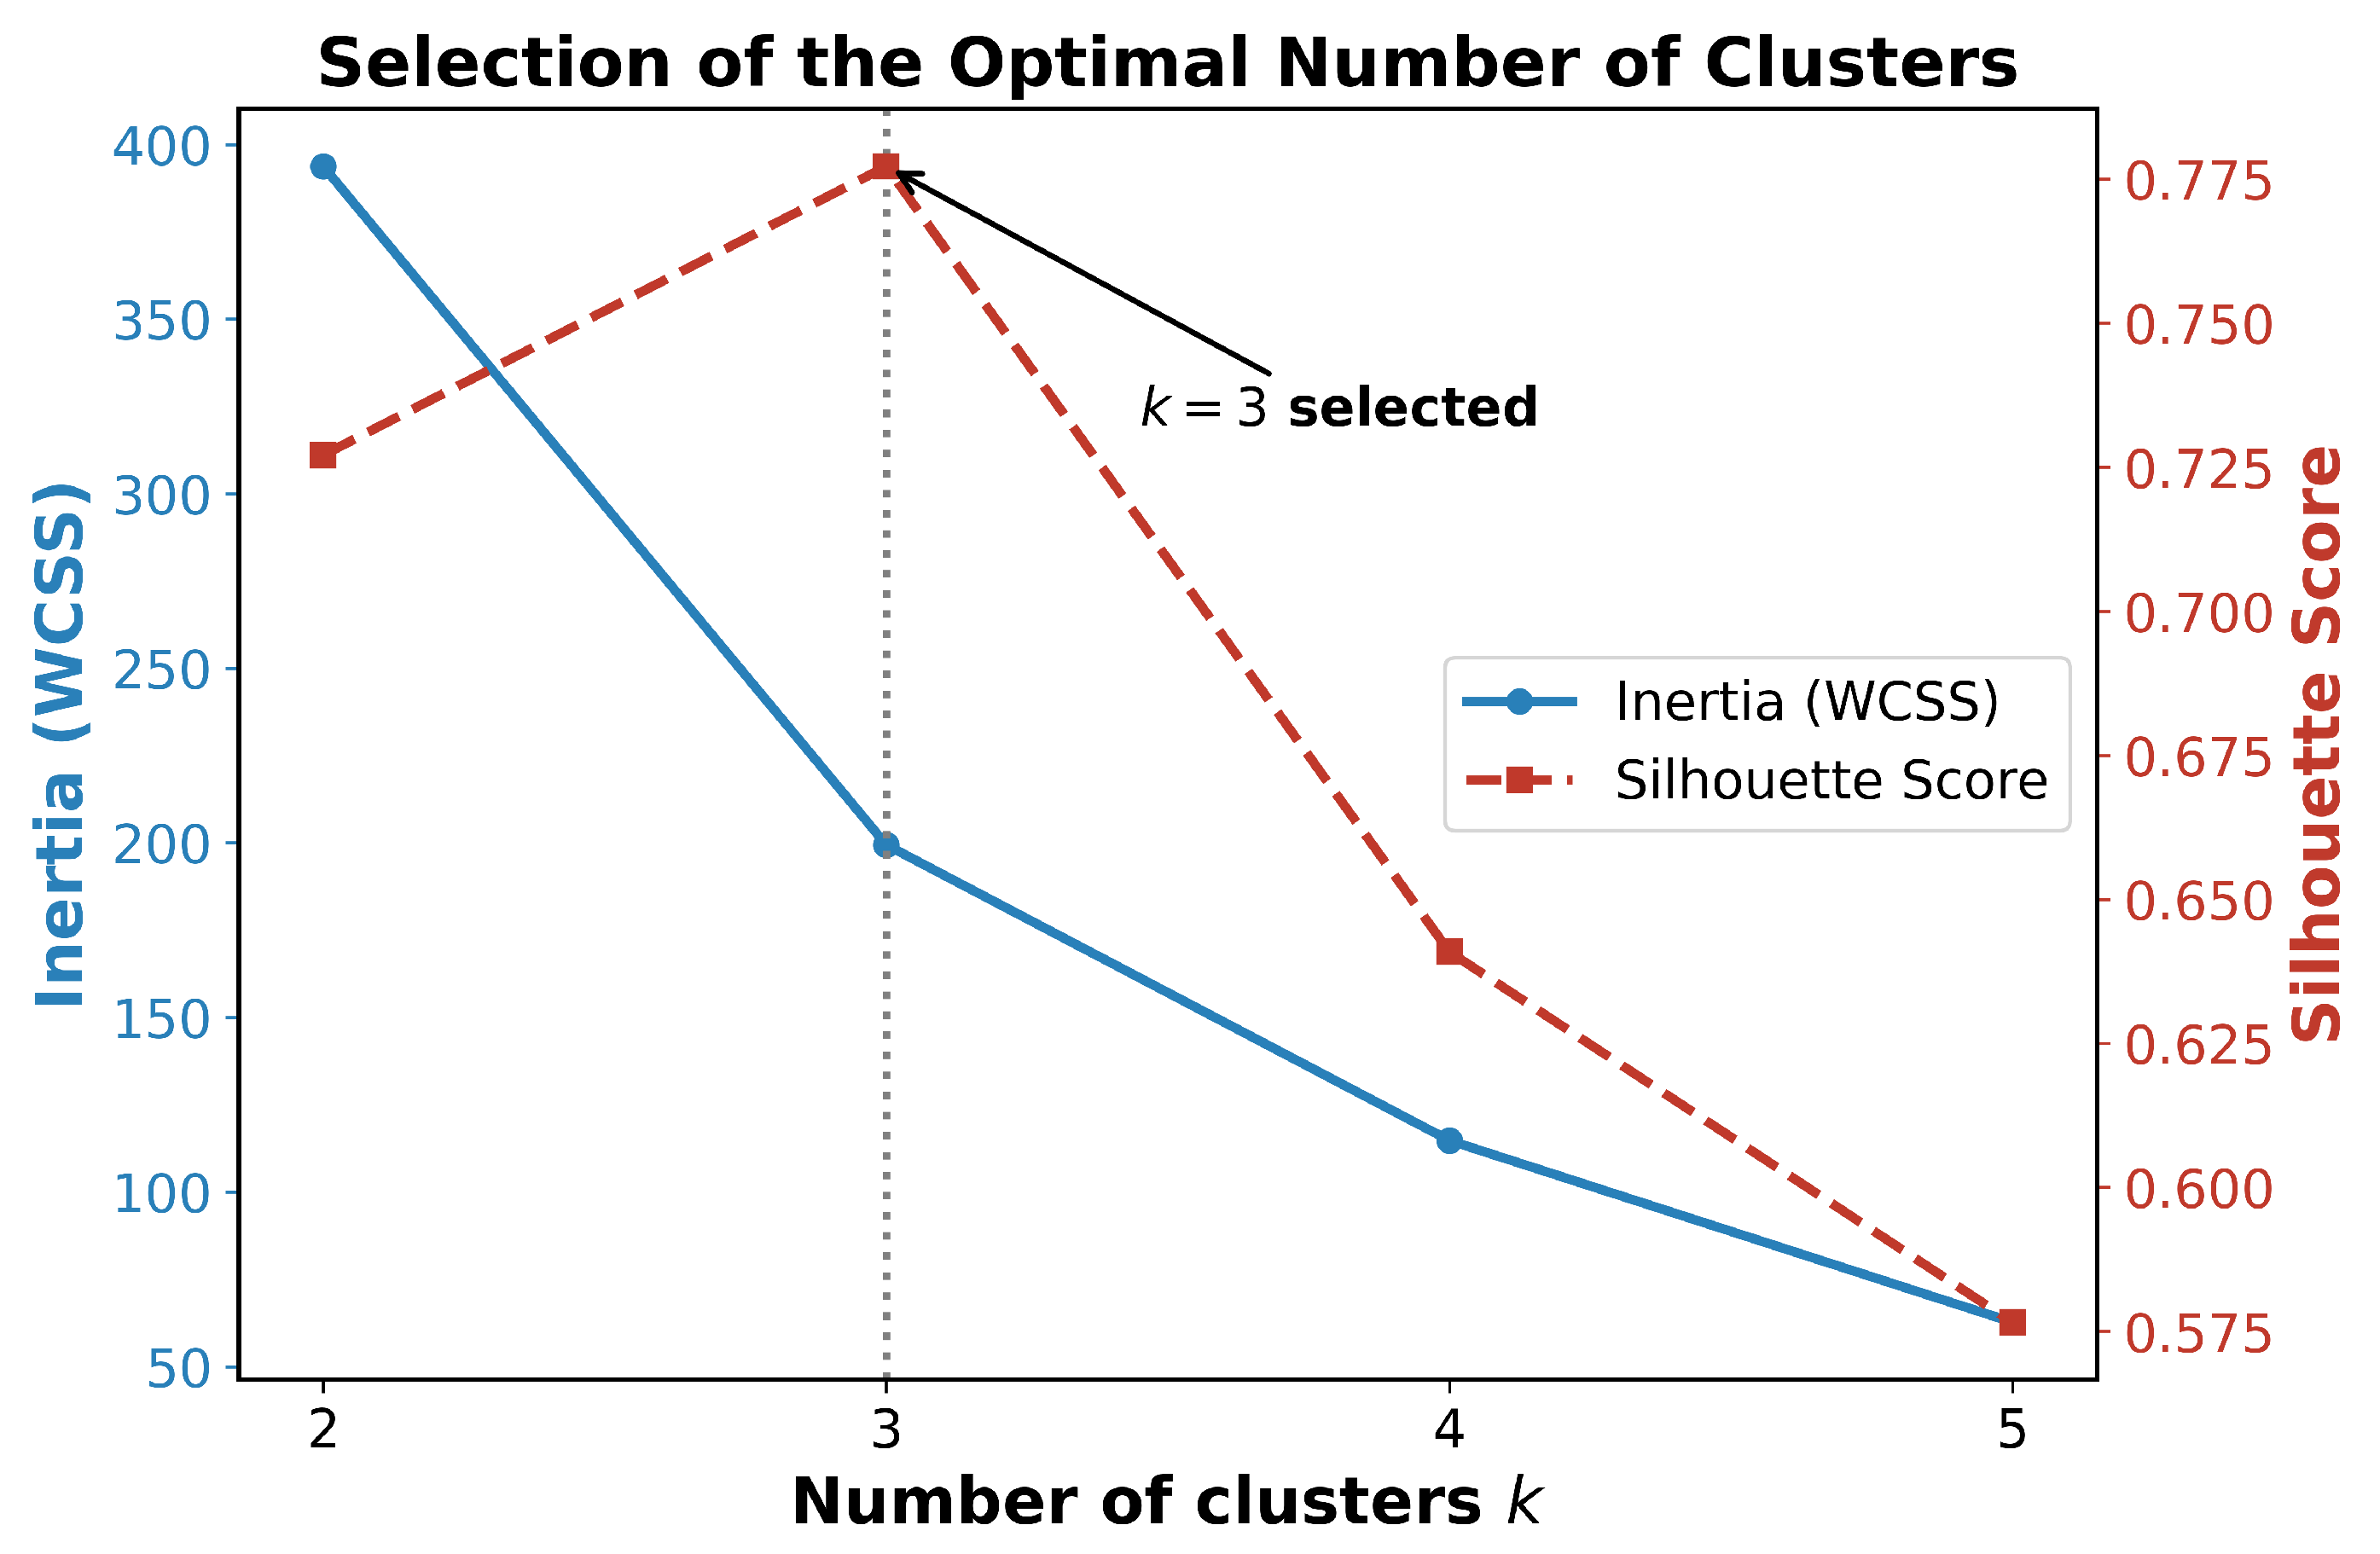
groups was selected on the basis of both internal validation indices and managerial interpretability (see
Section 4.2), yielding a silhouette score of 0.7772.
Table 5 reports the centroids of the operational variables for each of the three resulting risk clusters.
4.2. Validation and Characterization of Operational Risk Clusters
Table 5 reports the centroids of the three clustering variables for each cluster, together with the corresponding cluster sizes. As illustrated in
Figure 1, the selection of
is supported by the intersection of the elbow method (inertia reduction) and the internal validation metrics. We evaluate the clustering quality for
using three standard validation indices: the Silhouette Score, the Davies–Bouldin (DB) Index (where lower values indicate better partition separation and compactness), and the Calinski–Harabasz (CH) Index (where higher values indicate better-defined clusters).
Specifically, for , the Silhouette score is , the DB Index is , and the CH Index is . For , the Silhouette score is , the DB Index is , and the CH Index is . For , the Silhouette score falls to (DB Index , CH Index ), and for , it drops to (DB Index , CH Index ). Thus, among the low-k options, attains the best Silhouette score () and the best Davies–Bouldin Index (), in addition to a substantially higher CH Index than . We emphasize, however, that the choice of rests on both statistical and managerial considerations: beyond the favorable validation indices, three clusters yield operationally distinct and actionable risk profiles (a volatility-driven group, a lead-time/criticality-driven group, and a stable bulk group), which two clusters cannot represent. We therefore do not present as a purely mathematically optimal solution, but as the configuration best balancing statistical separation and operational interpretability.
Regarding the size distribution of the clusters, the resulting segmentation yields 182 SKUs in the Low Risk cluster, 10 in the High Risk cluster, and 8 in the Medium Risk cluster. While this distribution is imbalanced, it represents a natural and expected phenomenon in industrial supply chains. In real-world automotive parts distribution, the vast majority of items are highly stable standard components, whereas only a small fraction of parts exhibit extreme demand volatility or highly critical, long-lead-time assembly requirements. Rather than an algorithmic flaw, this imbalance reflects the long-tailed (Pareto-like) distribution of risk factors in industrial inventories, which the clustering algorithm isolates for targeted managerial protection.
Robustness of the Clustering Solution
Because the high-risk clusters are small, we assessed the stability of the partition with several complementary tests, all reproducible with the accompanying code. First, re-running K-means under 50 random seeds yields a mean Adjusted Rand Index (ARI) of
relative to the reference partition, indicating that the three-group structure is highly reproducible. Second, both hierarchical (Ward) and Gaussian-mixture clustering recover the same three-group structure (ARI
against K-means) and agree exactly on the volatility-driven cluster. Third, a bootstrap analysis (200 resamples, cluster-wise Jaccard stability) shows that the
Low Risk and
Medium Risk (volatile) clusters are reasonably stable (Jaccard
), whereas the small
High Risk (long-lead-time/critical) cluster is boundary-sensitive (Jaccard
) and its exact size varies across methods (3–10 SKUs). We report this transparently: these long-lead-time critical items are genuinely rare, and we therefore recommend that this small high-risk segment be subject to managerial review rather than fully automated assignment (
Section 5.2). The efficiency gains reported below do not depend on the exact membership of this small cluster, since they are driven primarily by the decoupling of cycle and safety stock across the broad item base.
The first cluster, labeled High Risk, is characterized by long procurement lead times (22.5 days) combined with high assembly criticality ( units per assembly) and only moderate demand variability. This group captures items whose operational risk derives jointly from extended supply exposure and high operational impact upon stockout—precisely the dimensions that value-based ABC ignores.
The second cluster, denoted as Medium Risk, exhibits extreme demand variability () with short lead times and low criticality. These are volatile items for which consumption uncertainty is the dominant source of operational risk.
The third cluster, identified as Low Risk, accounts for 91.0% of the 200 SKUs. Items in this group show stable demand (), short lead times, and low criticality. Their operational risk is comparatively low, justifying leaner inventory policies.
Overall, the clustering procedure produces interpretable groups reflecting distinct operational risk profiles rather than purely economic distinctions, supporting its use as a basis for differentiated replenishment policies.
4.3. Base Scenario Performance
The simulation was executed over a horizon of
days with
independent replications for the Base Scenario.
Table 6 summarizes the global performance metrics for the traditional ABC method, the coupled ABC-XYZ benchmark, and the proposed Hybrid Risk-Value classification.
Table 6.
Global performance comparison, base scenario (means over replications) a.
Table 6.
Global performance comparison, base scenario (means over replications) a.
| Metric | ABC | ABC-XYZ | Hybrid | Hybrid vs. ABC |
|---|
| Fill Rate (%) | 97.62 | 97.66 | 97.65 | pp |
| Stockout Days | 1799 | 1786 | 1797 | |
| Avg. Inventory Value ($M) | 1125.98 | 1129.37 | 804.86 | |
| Total Logistical Cost ($M) | 225.44 | 226.12 | 161.30 | |
Table 7.
Stress scenario performance: high demand CV and extended lead times.
Table 7.
Stress scenario performance: high demand CV and extended lead times.
| Scenario/Metric | ABC | ABC-XYZ | Hybrid | Hybrid vs. ABC |
|---|
| High Demand CV |
| Fill Rate (%) | 97.57 | 97.63 | 97.61 | pp |
| Stockout Days | 1814 | 1794 | 1805 | |
| Avg. Inventory Value ($M) | 1177.16 | 1182.25 | 849.22 | |
| Total Logistical Cost ($M) | 235.68 | 236.70 | 170.17 | |
| Extended Lead Times |
| Fill Rate (%) | 95.67 | 95.72 | 95.71 | pp |
| Stockout Days | 3225 | 3197 | 3207 | |
| Avg. Inventory Value ($M) | 1165.96 | 1169.97 | 863.07 | |
| Total Logistical Cost ($M) | 233.44 | 234.24 | 172.95 | |
Table 8.
Statistical validation of performance differences (Hybrid vs. ABC) over replications.
Table 8.
Statistical validation of performance differences (Hybrid vs. ABC) over replications.
| Scenario/Metric | Mean ABC | Mean Hybrid | Mean Diff. | t-Test p | Wilcoxon p | Cohen’s d |
|---|
| 1. Base Scenario |
| Fill Rate (%) | 97.62 | 97.65 | pp | <0.001 | <0.001 | 0.952 |
| Inventory Value ($M) | 1125.98 | 804.86 | −321.12 | <0.001 | <0.001 | −5.635 |
| Stockout Days | 1799.45 | 1797.20 | −2.25 | 0.348 | 0.295 | −0.215 |
| Total Cost ($M) | 225.44 | 161.30 | −64.14 | <0.001 | <0.001 | −5.627 |
| 2. High Demand CV |
| Fill Rate (%) | 97.57 | 97.61 | pp | <0.001 | <0.001 | 1.179 |
| Inventory Value ($M) | 1177.16 | 849.22 | −327.95 | <0.001 | <0.001 | −5.478 |
| Stockout Days | 1813.50 | 1805.20 | −8.30 | 0.054 | 0.062 | −0.460 |
| Total Cost ($M) | 235.68 | 170.17 | −65.50 | <0.001 | <0.001 | −5.471 |
| 3. Extended Lead Times |
| Fill Rate (%) | 95.67 | 95.71 | pp | <0.001 | <0.001 | 1.081 |
| Inventory Value ($M) | 1165.96 | 863.07 | −302.89 | <0.001 | <0.001 | −5.963 |
| Stockout Days | 3224.55 | 3207.25 | −17.30 | 0.002 | 0.003 | −0.818 |
| Total Cost ($M) | 233.44 | 172.95 | −60.49 | <0.001 | <0.001 | −5.954 |
In the base scenario, the Hybrid framework reduces average inventory investment by 28.5% and total logistical cost by 28.4% relative to ABC operated at its conventional service-level parameters (the configuration used in practice; a fair, parameter-optimized comparison is presented in
Section 4.6), while maintaining the service level (fill rate
pp) and leaving stockout days essentially unchanged (
). The coupled ABC-XYZ benchmark performs almost identically to classic ABC (within 0.3%), which confirms that the efficiency gains stem from
decoupling safety stock and replenishment decisions rather than from incorporating demand-variability information per se.
4.4. Uncertainty Scenario Analysis
To test the robustness of the proposed framework under adverse operational conditions, two stress scenarios were evaluated: (i) High Demand Variability, in which the demand CV of every item is multiplied by a factor of 1.4 (a 40% increase in relative variability); and (ii) Extended Lead Times, in which procurement lead times are increased by 75% (multiplied by 1.75) across all items.
Table 7 presents the comparison under these uncertainty conditions.
Under both stress conditions, the Hybrid framework sustains its efficiency advantage. In the High Demand CV scenario it reduces average inventory by 27.9% and total cost by 27.8%, and in the Extended Lead Times scenario by 26.0% and 25.9%, respectively, in both cases while maintaining the service level (fill rate within pp of ABC) and slightly reducing stockout days (about ). As in the base case, ABC-XYZ remains close to classic ABC, underscoring that the gains arise from decoupling rather than from variability-based segmentation alone.
4.5. Statistical Validation of Simulation Results
To establish the scientific validity of the performance differences observed between the traditional ABC method and the proposed Hybrid Risk-Value framework, a formal statistical analysis was conducted on the results of the independent simulation replications. Given that both inventory classification schemes were evaluated using the exact same demand paths (via synchronized random number generator seeds), we employed paired statistical tests: the paired t-test for parametric hypothesis testing, and the Wilcoxon signed-rank test as a non-parametric alternative. We also computed the 95% confidence intervals (CI) for the mean differences and Cohen’s d effect sizes to assess the magnitude of the impact.
Table 8 details the statistical results across the three experimental scenarios.
The statistical tests confirm that the reductions in inventory investment and total logistical cost are large and highly significant across all three scenarios (; Cohen’s d between and ), corresponding to approximately 26–28% less capital. The fill-rate differences are small but consistently positive and statistically significant ( to pp; ). In contrast, the change in stockout days is not statistically significant in the Base scenario (, ) and only marginal in the High Demand CV scenario (). The Hybrid framework therefore achieves the same level of stockout protection as ABC while using roughly 28% less inventory; it does not systematically reduce stockouts in these settings.
Only under Extended Lead Times does the reduction in stockout days reach significance, and even then the magnitude is modest (a change, i.e., days; , ). This indicates that the benefit of risk-based safety stock on stockouts materializes primarily when supply exposure is high. Overall, the most accurate characterization of the Hybrid framework is that it substantially reduces inventory investment and total cost while maintaining—and in some scenarios slightly improving—service performance, rather than consistently reducing stockouts across all settings.
4.6. Parameter Fair Comparison and Pareto Frontiers
A common concern in inventory classification evaluations is whether a new method outperforms a baseline simply because its parameters (safety factor
Z and cycle coverage
d) are better tuned. To address this concern and ensure a completely fair comparison, we perform a grid-search optimization for the traditional ABC method, the coupled ABC-XYZ benchmark, and the proposed Hybrid Risk-Value framework. The ABC and Hybrid policies are evaluated over the exact same multi-dimensional parameter space:
yielding 1960 feasible policy configurations per scheme, all evaluated under identical simulation conditions. The coupled ABC-XYZ benchmark is optimized analogously, by scaling its safety-stock matrix over a range of factors together with the same cycle-coverage grid. For each configuration we record the average inventory value and the mean fill rate, and we extract the non-dominated points to construct the Pareto frontier of each method.
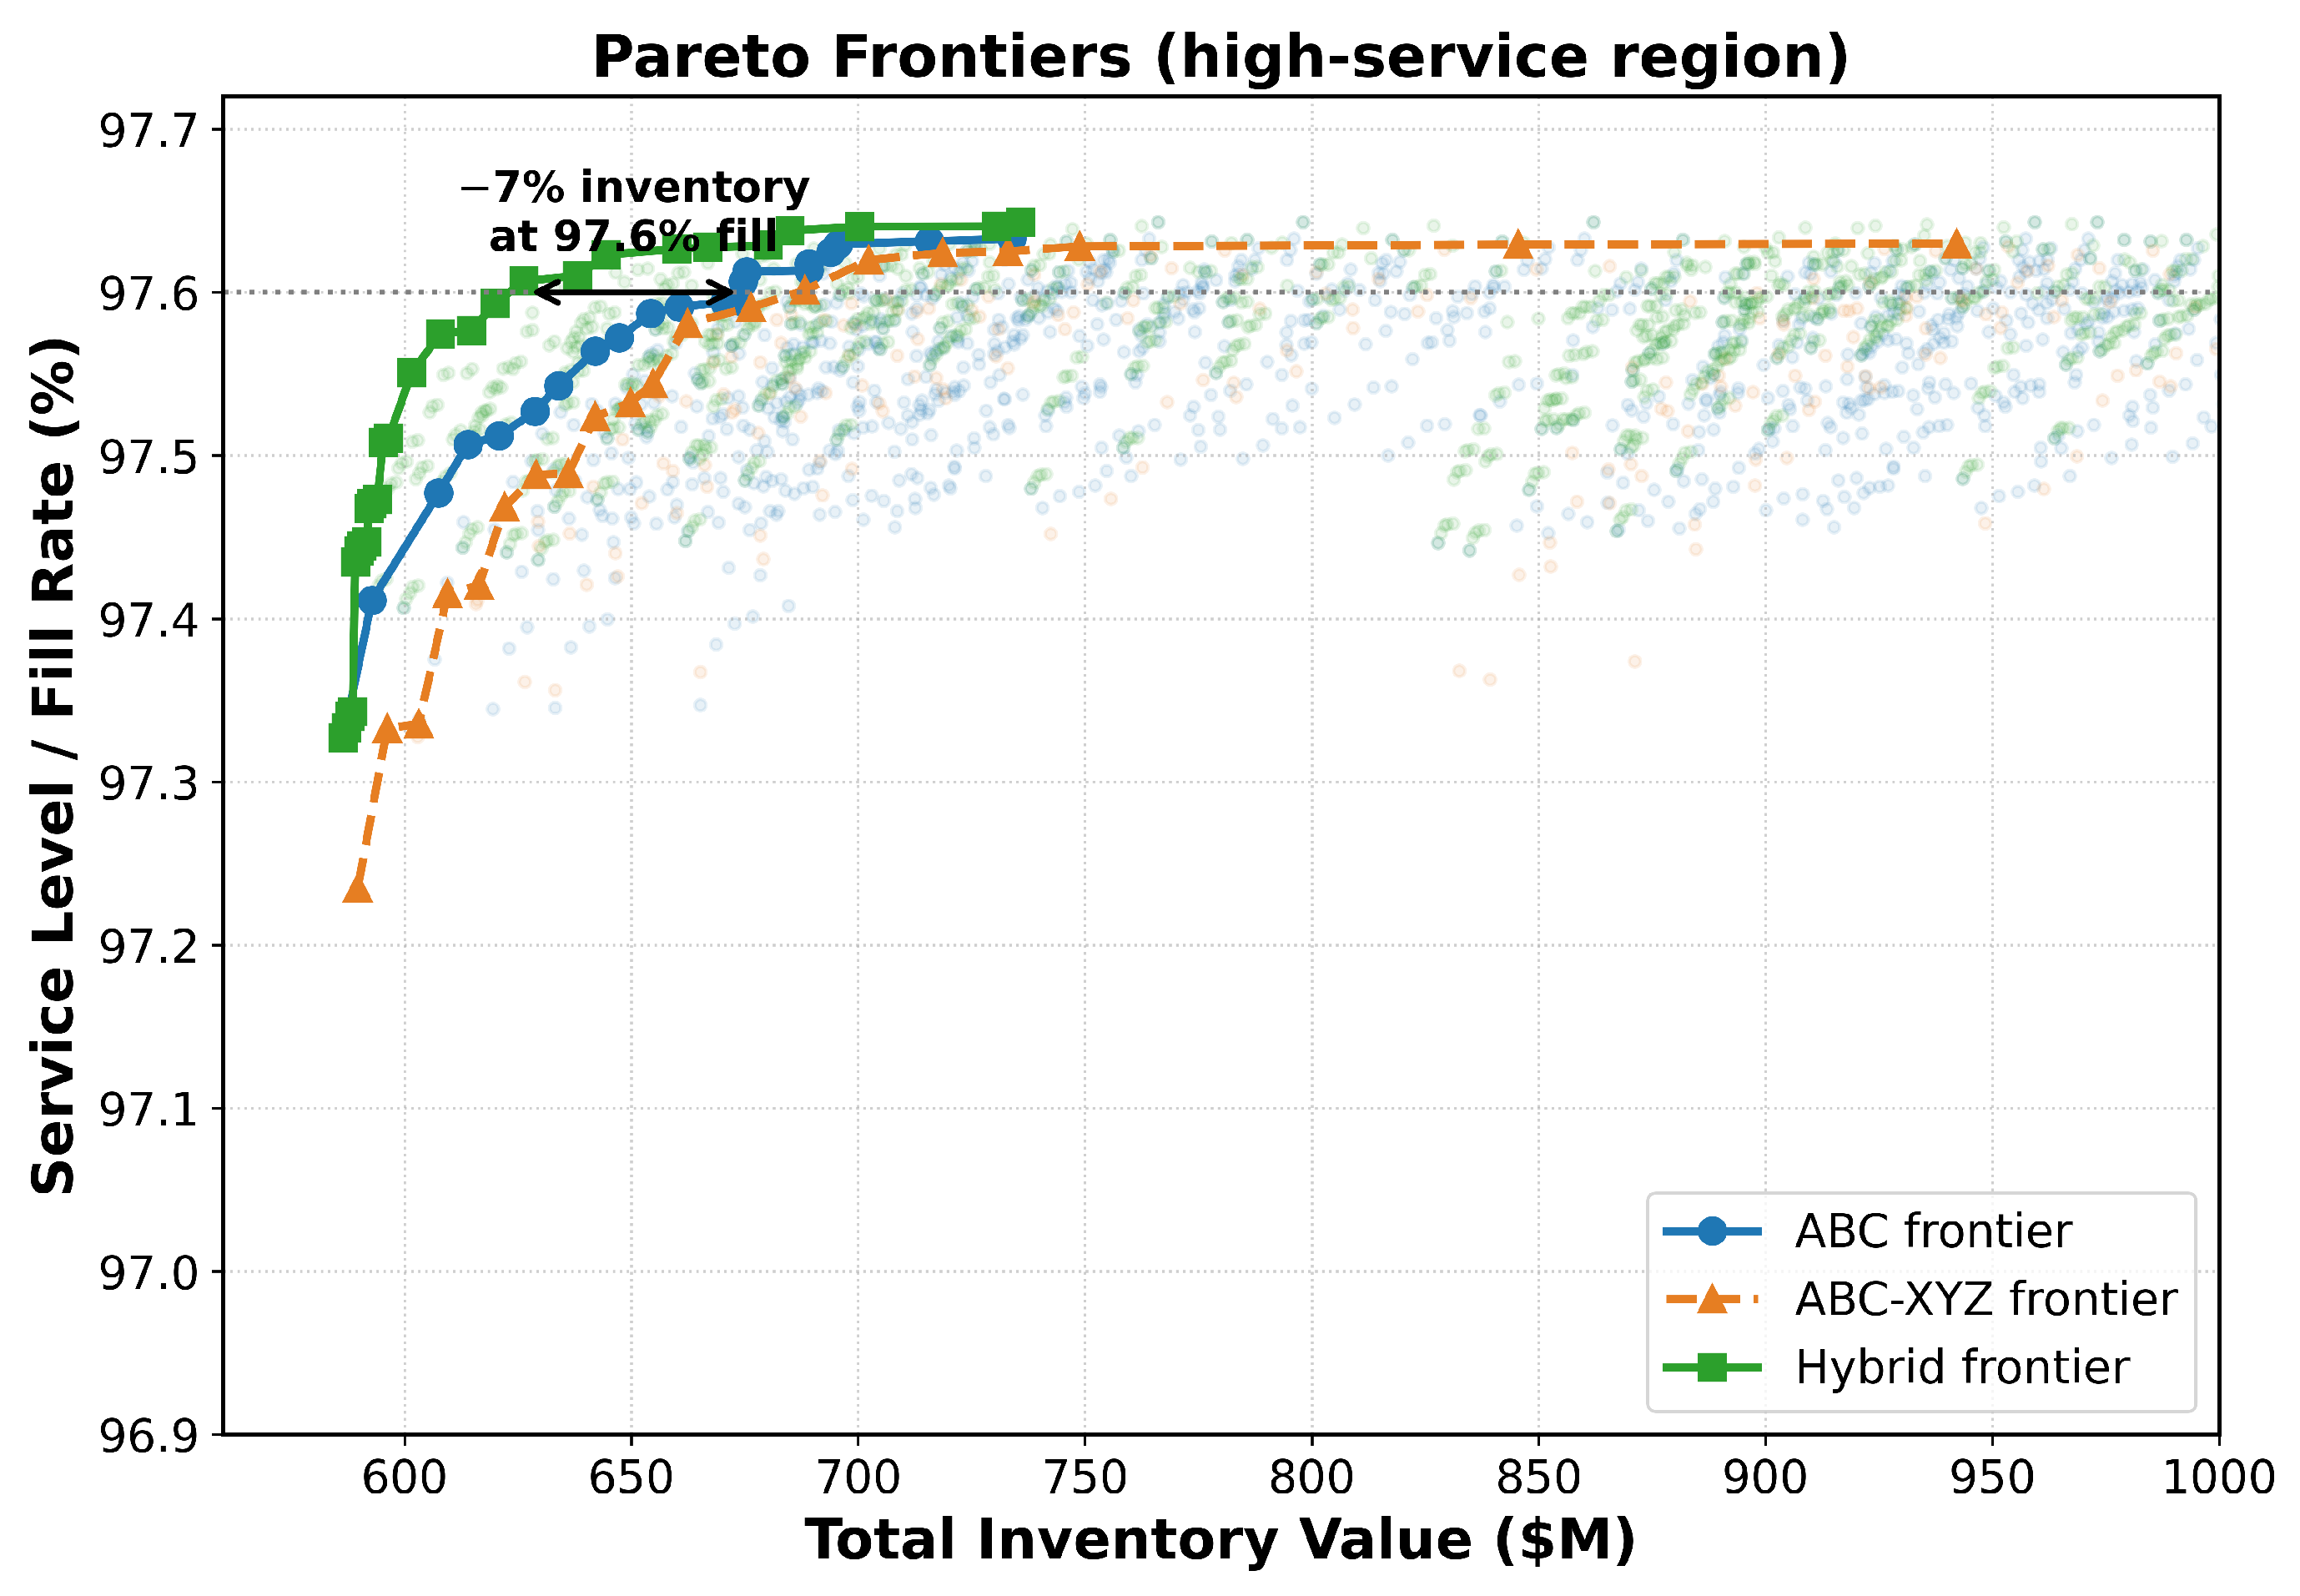
Table 9 reports, for several target service levels, the minimum inventory investment required by each method on its own frontier. Two regimes emerge. At moderate service targets (fill
) the ABC and Hybrid frontiers essentially coincide: both reach the same service at the same minimum inventory (about
$587M) because at these targets the cycle-stock policy dominates and the allocation of safety stock matters little. At high service targets, however, the Hybrid frontier dominates: it attains a 97.5% fill rate with 3.0% less inventory and a 97.6% fill rate with 7.2% less inventory than the best ABC configuration. This is the operationally relevant region, where risk-based allocation of safety stock allows the system to reach high service without over-investing in stable, high-value items.
The coupled ABC-XYZ benchmark, whose safety stock remains tied to economic value, traces a frontier that coincides with (and is in fact marginally above, i.e., slightly less efficient than) that of ABC across the entire range, and never reaches the Hybrid frontier. Because ABC-XYZ uses the same demand-variability information as the Hybrid framework but keeps safety stock coupled to value, this result isolates the decoupling itself, rather than the use of variability information, as the source of the Hybrid advantage.
Figure 2 visualizes this high-service region of the two frontiers.
We emphasize the distinction between this structural comparison and the headline figures of
Table 6 and
Table 7. The ∼26–28% reductions reported there are measured against ABC operated at
conventional service-level parameters (
,
)—the configuration most firms use in practice, but which is not itself Pareto-efficient. When ABC is allowed to optimize its own parameters, the gap narrows to the 3–7% structural advantage reported above. Both results are informative: the former quantifies the improvement a typical practitioner would realize by adopting the framework, whereas the latter isolates the genuine structural benefit of decoupling. Consistent with this interpretation, the synthetic experiments of
Appendix A, in which operational risk is more multidimensional, exhibit a markedly larger Hybrid advantage.
4.7. Sensitivity to Policy Parameters
To confirm that the performance of the Hybrid framework is robust to the chosen safety factors and cycle coverages, we vary both around the calibrated configuration (
,
) by multiplicative factors and re-evaluate the base scenario over
replications, comparing against ABC at its conventional parameters.
Table 10 reports the resulting change in average inventory value relative to ABC.
Two observations stand out. First, the service level is essentially invariant to these parameters: across the entire grid the fill rate remains within pp of ABC. Second, the inventory savings are governed primarily by the cycle coverage d (the decoupling lever) rather than by the safety factor Z: for cycle coverages at or below the calibrated value the Hybrid framework saves 27–60% of inventory, and the calibrated point lies on a broad, stable plateau rather than a fortuitous optimum. Only when cycle coverages are inflated well beyond the baseline ( and above) does the advantage disappear, as expected, since larger batches mechanically increase cycle stock. This confirms that the reported gains are not an artefact of parameter tuning.
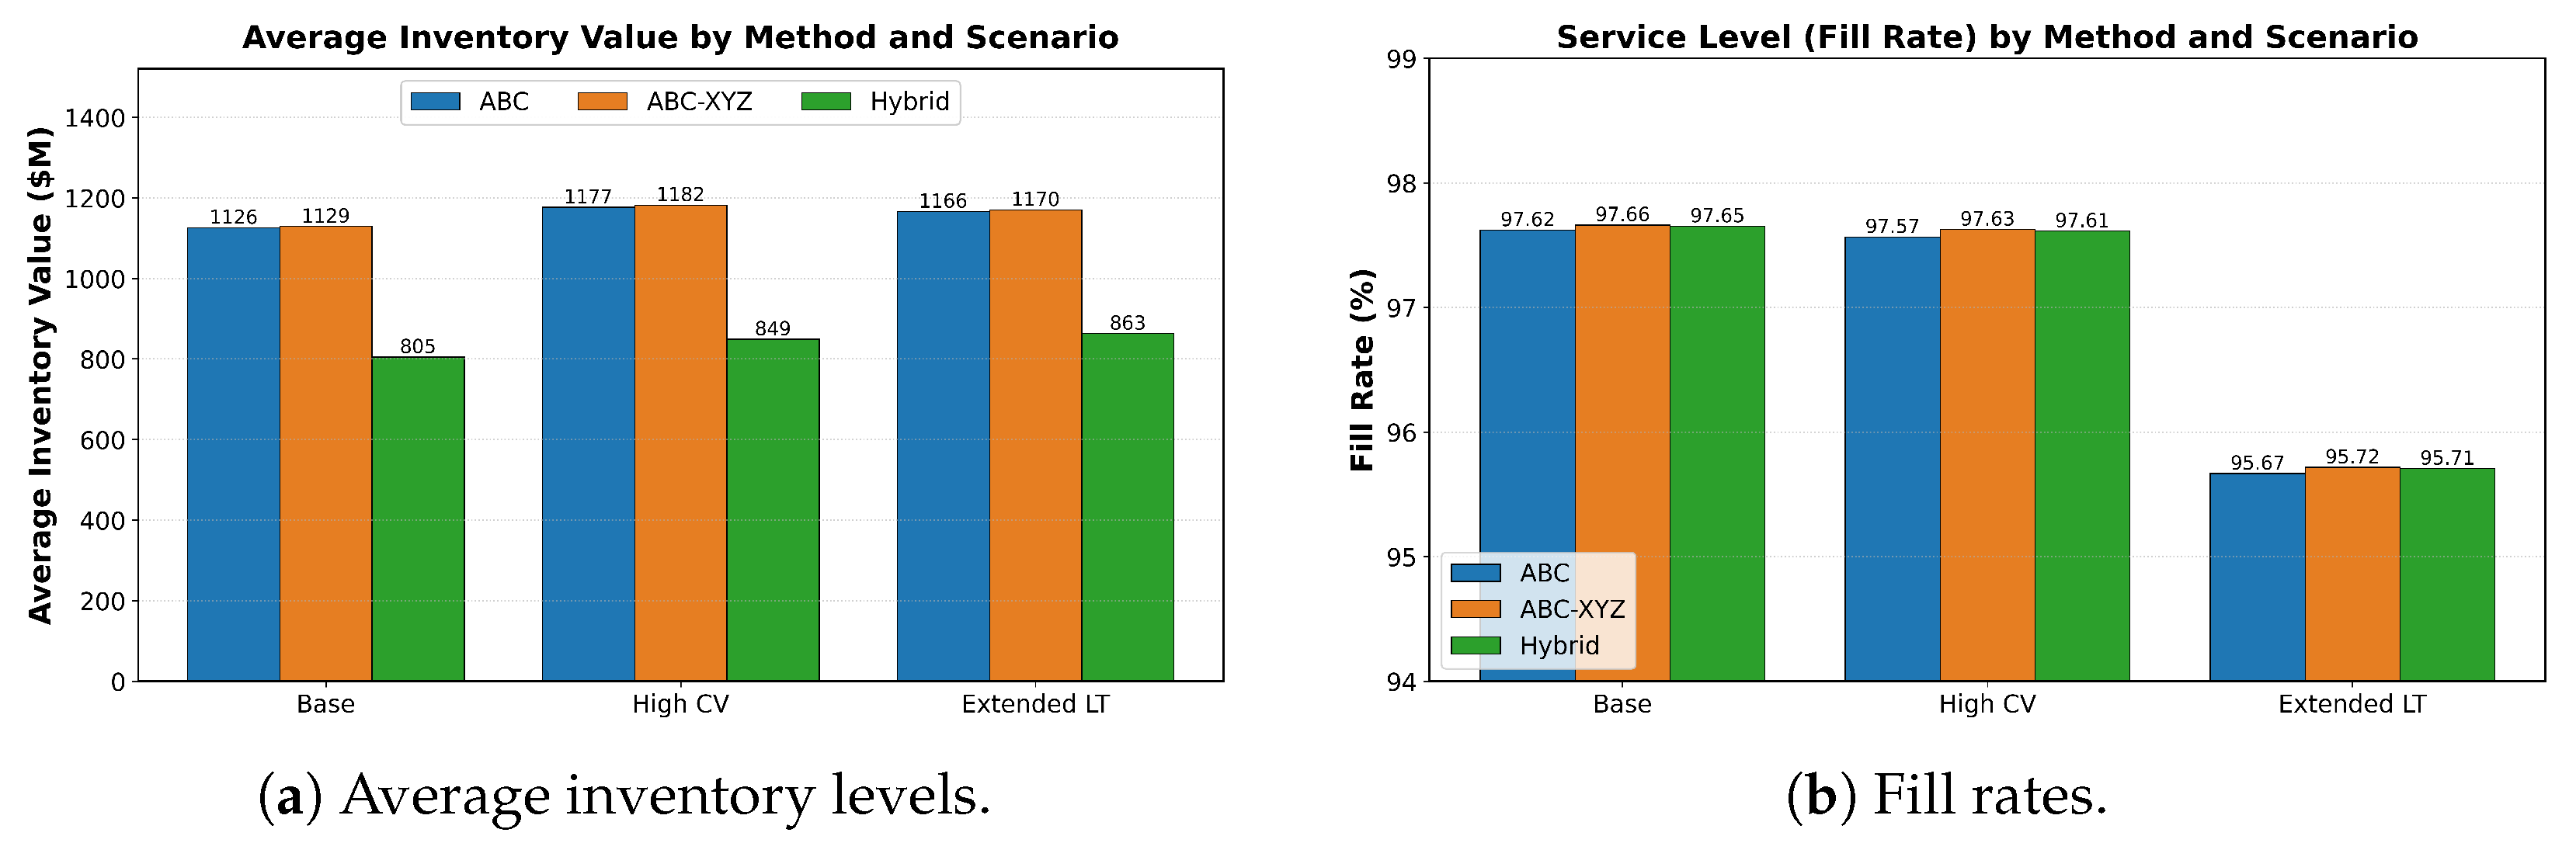
4.8. Visual Comparison of Key Performance Indicators
Figure 3a,b provide a visual summary of the main results.
Figure 3a compares average inventory levels by scenario and method, while
Figure 3b compares service levels.
5. Discussion
5.1. Performance Trade-Offs and Pareto Efficiency
The simulation results provide empirical evidence supporting the capital efficiency of the proposed Hybrid Risk-Value inventory classification framework. In stochastic inventory theory, the relationship between safety stock investment and customer service levels is characterized by a non-linear, concave trade-off curve. Traditionally, value-based classification methods such as ABC attempt to navigate this trade-off by concentrating higher safety factors and safety stocks on the most expensive items. However, the findings of this study indicate that this approach is structurally inefficient in multi-item systems subject to operational uncertainty.
By decoupling the safety stock and cycle replenishment decisions, the proposed Hybrid method addresses this structural limitation. In the proposed framework, safety stock is sized based on multivariate operational risk clusters, so that items facing the highest operational risk—long procurement lead times combined with high assembly criticality—are assigned the highest protection factor (), while highly volatile items receive elevated protection (), in both cases regardless of unit price. Conversely, cycle stock is sized based on economic value (ABC), allowing low-value items to be ordered in larger batches ( days) to minimize order processing overhead, while high-value items are ordered in small, frequent batches ( days) to minimize capital tied up in cycle stock.
The experimental results across all three scenarios (Base, High Demand CV, and Extended Lead Times) show that this decoupled configuration consistently outperforms the traditional ABC method on the inventory–service trade-off. Average inventory investment and total logistical cost are reduced by approximately 26–28% while the service level is maintained (fill rate within pp of ABC). Stockout days are statistically unchanged relative to ABC in the base and high-variability scenarios and only modestly reduced under extended lead times, so the dominant benefit is a substantial release of working capital at iso-service rather than a reduction in stockouts.
These results indicate that the traditional ABC method suffers from two distinct forms of operational inefficiency: 1. Over-protection of low-risk high-value items: The ABC method allocates high safety factors () to all Class A items. However, many Class A items are operationally stable (), meaning they do not require substantial safety stock to achieve high service levels. Concentrating safety stock on these stable items inflates the average inventory value without contributing to stockout protection. 2. Under-protection of high-risk low-value items: The ABC method assigns low safety factors () to Class C items. Yet some Class C items exhibit extreme demand volatility (the volatile cluster centroid is ) or high assembly criticality. When a stockout occurs for these low-value but critical components, it can halt an entire assembly line, with substantial logistical consequences. By raising the safety factors for these items, the Hybrid method keeps them adequately protected against such disruptions without inflating the overall inventory.
The Pareto charts and sensitivity results indicate that by shifting from a value-based to a risk-based safety stock allocation and decoupling it from the replenishment cycle, the Hybrid method relaxes the traditional conflict between service level and inventory holding cost, establishing a more capital-efficient operating frontier.
Despite these advantages, the proposed method has some limitations. First, the success of the clustering approach relies on the availability and accuracy of multivariate operational data. In contexts with sparse or highly non-stationary data, the stability of cluster centroids may be compromised, potentially requiring more frequent re-training of the model.
Second, the current study assumes stationarity in the demand distribution (Gamma), which may not fully capture seasonal trends or structural shifts in the market. Furthermore, the Gamma demand model may underrepresent the behavior of High Risk items (), whose demand patterns are consistent with intermittent or lumpy demand. Methods specifically designed for intermittent demand—such as Croston’s method or the ADIDA framework—could be explored in future extensions to improve simulation realism for this specific cluster. Third, the dataset is derived from a single automotive supplier, which means that the generalizability of these findings to other industrial sectors (e.g., retail or perishables) should be validated through further empirical research.
Finally, while the simulation model incorporates a total logistical cost function for evaluation and calibration, future research could explore a joint optimization of the safety factors and cycle coverage parameters—for example, via mathematical programming or metaheuristics—to find the exact global optimum, rather than relying on a discrete grid search.
5.2. Managerial Implications and Implementation Guidelines
The results of this study offer several practical insights for supply chain managers and inventory controllers. First, the capital efficiency of the Hybrid Risk-Value approach suggests that firms can release substantial working capital—on the order of one quarter of the average inventory value in our case—without degrading service, by decoupling safety-stock protection from replenishment-cycle sizing. While the Pareto principle remains a useful heuristic for general resource allocation, value alone does not capture the operational risks (lead time, criticality) that drive stockouts in complex assembly systems.
Second, we outline a concrete implementation path. (i)
Data requirements: the framework needs, per SKU, the mean and coefficient of variation of demand, the procurement lead time, the assembly criticality (quantity per assembly), and the unit price—fields routinely available in ERP/MRP systems. (ii)
Procedure: standardize the three risk variables, fit the K-means clustering to assign each SKU a safety factor
Z, classify SKUs by annual consumption value (ABC) to assign a cycle coverage
d, and combine them into the
policy of
Section 3.4. (iii)
Update cadence: because the partition is stable across seeds and resampling, re-clustering quarterly—or whenever demand or supplier lead-time profiles shift materially—is sufficient; continuous re-fitting is unnecessary.
Third, managers should treat the small high-risk segment with care. As shown in the robustness analysis, the long-lead-time/critical cluster is small and its exact membership is boundary-sensitive. We therefore recommend that items flagged into this cluster be reviewed manually (or governed by a conservative default policy) rather than assigned fully automatically, since the cost of misclassifying a genuinely critical component is high. Conversely, the large low-risk segment, which is stable and accounts for the bulk of SKUs, is well suited to fully automated policy assignment, freeing managerial attention for the high-risk tail.
Finally, the transition to data-driven clustering facilitates the automation of inventory review processes. Unlike traditional MCIC methods that require manual criteria weighting—often subjective and time-consuming—the clustering algorithm can be periodically retrained on fresh operational data, allowing the classification to adapt to changes in market demand or supplier performance.
6. Conclusions
In this study, we introduced a Hybrid Risk-Value inventory classification framework that decouples safety stock and replenishment decisions by combining multivariate operational risk clustering (using demand variability, lead times, and component criticality) with economic value (ABC classification). While safety stocks are sized based on operational risk to protect the assembly system, cycle replenishment quantities are scaled based on financial value to optimize capital allocation. We validated this approach by integrating it into a stochastic discrete-event simulation model across multiple scenarios and compared its performance directly with the classical ABC method.
The experimental results support our hypothesis that decoupling safety and cycle stock decisions enables a more efficient allocation of control policies. Across all three tested environments, the proposed Hybrid framework reduced average inventory value and total logistical cost by approximately 26% to 28% relative to ABC while maintaining—and in some cases slightly improving—the service level, with stockout days statistically unchanged except under extended lead times. A comparison against a coupled ABC-XYZ benchmark, which performed almost identically to classic ABC, indicates that these gains stem specifically from decoupling rather than from incorporating demand-variability information. We therefore present the framework as a promising, data-driven decision-support approach rather than as a universally superior classification method, given that the evidence derives from a single industrial dataset evaluated through simulation. The value of the multivariate clustering, specifically, is expected to grow in settings where operational risk is multidimensional—driven jointly by demand variability, lead time, and criticality rather than by a single factor—a pattern clearly observed in the synthetic experiments of
Appendix A, where the framework’s advantage is markedly larger.
These findings carry practical implications for operations management, showing that data-driven clustering techniques can address the structural limitations of traditional value-based inventory classification. By focusing managerial control on operational risk factors, firms can maintain protection for operationally critical items while eliminating excess safety stock on highly predictable high-value components.
Future research could explore several extensions of this framework. First, the proposed approach could be integrated into dynamic, online clustering systems that periodically update item assignments as demand or lead time profiles evolve over time. Second, the framework could be tested in complex, multi-echelon supply chain networks to assess its systemic impact on downstream and upstream nodes. Finally, incorporating supplier capacity constraints and non-stationary demand patterns could further validate the robustness of the Hybrid Risk-Value framework in highly dynamic industrial environments.





 ,
,