1. Introduction
The Middle East and North Africa (MENA) region occupies a strategic position at the crossroads of global trade via major maritime corridors such as the Suez Canal and the Strait of Hormuz. The aspiration for sustainable logistics development in the region is challenged by several factors. Examples include rapid urbanization. In many countries, the population growth exceeds 2% a year. The high dependence on hydrocarbon exports leads to associated problems including water scarcity, in addition to considerably high CO
2 emissions leading to poor air quality from the transportation sector. As a result, the transport and logistics sector is expected to remain a significant regional source of greenhouse gas emissions in 2025, with road freight and maritime shipping activities representing the primary sources. This issue is further intensified by the rapid development of e-commerce and the ongoing economic diversification initiatives, which intensify the existing environmental problems of this region [
1].
The LPI, a well-respected periodic benchmark established by the World Bank and most recently published in 2023, measures and compares countries across six important dimensions: customs procedures, infrastructure quality, ease-of-arranging shipments, quality of logistics services, ability to track and trace consignments, as well as punctuality of transport services [
2]. Across these dimensions, performance varies significantly across countries in the Arab region, and the United Arab Emirates (UAE) stands out as one of the world’s top performers due to large investments made in world-class deep-sea ports like Jebel Ali and innovative digital platforms that facilitate more efficient logistics operations. In line with this approach, the EPI of Yale University compares countries using an overall environmental performance score based on 58 indicators that have been carefully selected and aggregated into eleven sub-components from relevant areas such as climate change mitigation or the health of vital ecosystems [
3]. The UAE is also the MENA leader with a high score of around 51.6, closely followed by Oman. This is in clear contrast to the regional median score of 43.2, which lags well below the average levels of action around the world and highlights substantial deficiencies across all aspects of climate action, particularly in countries with conflict or instability issues.
Early attempts to integrate logistics performance and environmental aspects, such as MENA specific GLPI from 2014 [
4], as well as other existing global suggestions on a more general level [
5], resorted mainly to basic ratio-based methods (e.g., an equation like GLPI = LPI/EPI). These two initial approaches had some methodological limitations: in particular, their strong scale sensitivity because of the non-equivalent scales of the LPI (from 1 to 5) and EPI (from 0 to 100). In addition, these methods showed an evident lack of normalization combined with a lack of systematic weighting which yielded an inconsistent output and reduced comparability. This limitation is problematic in the significantly heterogeneous MENA region, as extreme scores, particularly those from conflict areas, may distort evaluations excessively. Such structural deficiencies severely constrain the practical applicability of these early approaches for conducting robust comprehensive assessments regarding eco-efficiency and sound policy recommendations in the field of GSCM [
4].
Therefore, this research is motivated by the need to address such well-documented limitations as noted in existing literature and contributes significantly to both theory and method in the field of GSCM specifically within an emerging region [
6]. Through using the min-max normalization method to standardize both indices into a unified [0, 1] scale, together with the sophisticated application of PCA for data-driven weighting, the improved GLPI attains a stability that is significantly higher, a volatility that is much lower and an enhanced potential to be compared between countries, which are essential for robust analysis [
7]. The inclusion of fixed-effects panel regression here in driver analysis, coupled with state-of-the-art hybrid machine learning forecasting techniques, namely ARIMA for linear trend capturing and LSTM networks for non-linear feature exploration, represents a predictive capacity that was missing from past descriptive research. The key contributions of these developments are in largely bridging the theoretical limitations that emerge from the present GSCM literature, specifically being that combined indices too often fail to balance efficient operations against environmental performance and broader sustainability objectives [
8]. These advancements enable the generation of forward-looking insights which are imperative for designing the logistics systems necessary for sustainable development considering the accelerating urban expansion and ever-increasing decarbonization demands that define the contemporary world [
9,
10].
This study adopts a sequential and integrated methodological framework. First, Principal Component Analysis (PCA) is employed to construct a statistically weighted composite Green Logistics Performance Index (GLPI). Second, fixed-effects panel regression identifies macroeconomic and environmental determinants of GLPI, addressing the research question concerning drivers of green logistics performance. Third, ARIMA and LSTM forecasting models are implemented to project GLPI trajectories to 2030 under alternative policy scenarios. Thus, PCA serves index construction, panel regression explains determinants, and hybrid forecasting provides predictive policy insight. The methods are complementary rather than fragmented.
The research question addressed in this study is as follows. How can green logistics performance in MENA be measured more robustly and forecasted more usefully for policy design than previous ratio-based approaches? The purpose of this study is to develop and validate an enhanced composite GLPI, identify its macro-level drivers, and project its trajectory to 2030 under alternative scenarios. This study makes three contributions to the literature. From a theoretical perspective, this links green logistics measurement to GSCM, NRBV, Institutional Theory and ecological modernization logic through operationalization of the efficiency–ecological performance trade-off in logistics. Empirically, it proposes a normalized and PCA-weighted GLPI for MENA and tests its determinants through fixed-effects panel regression. In policy terms, it offers scenario-based forecasts and a tool for diagnostics in prioritizing renewable integration, trade facilitation reform and investment in green logistics. The remainder of the paper is organized as follows.
Section 2 presents the theoretical background and literature review.
Section 3 explains the conceptual framework, data, and methods, including index construction, panel regression, and forecasting.
Section 4 reports empirical and forecast results and links the findings to prior literature.
Section 5 concludes with implications, policy recommendations, limitations, and future research directions.
3. Methodology
This study incorporates the conceptual framework, hypothesis formulation, data sources and sampling, index construction, empirical strategy of diagnostic tests and forecasting. Furthermore, the procedure provides a reliable, reproducible and empirical normative base [
7,
28,
44]. Panel data analysis and ML prediction make it possible to have a future vision of green logistics in the MENA. In the defined approach, the steps comprised initial conceptualization and hypothesis formation, extensive data treatment, a clear description of the statistical procedure with diagnostics and an explicit definition of forecast components. The proposed methodological framework is presented in a transparent and replicable manner to ensure accessibility for researchers and policymakers, while the accompanying tables provide a comprehensive overview of the statistical results. The update frequencies of the underlying indices differ: the Logistics Performance Index (LPI) is published approximately every four to five years (most recently in 2023), whereas the Environmental Performance Index (EPI) is released biennially (most recently in 2024). In this study, the most recent available editions of both indices are utilized and missing annual observations within the 2010–2024 panel dataset are addressed through linear interpolation. Although this approach maintains temporal consistency within the dataset, it may introduce minor approximation errors in non-reporting years. However, sensitivity analyses employing alternative imputation techniques confirm the robustness of the estimated coefficients in terms of both direction and magnitude.
3.1. Conceptual Framework and Hypotheses Development
When studying sustainable logistics for MENA region, an integrated theoretical concept is needed to connect green supply chain management concepts with empirical observations and futuristic analysis. At the regional level, the green logistics performance reflects a balance between logistics capability, trade intensity, and environmental outcomes.
This also develops on the basis of GSCM archetypes, which assume that environmental performance and market goals are two sides of the same coin, as has been frequently emphasized by researchers [
11,
12], and in a MENA context, becomes even more relevant due to harsh desert ecologies and oil reliance increasing ecological risks, yet it is important that there is a robust metric balance avoiding simplification into single ratios [
15]. The proposed Green Logistics Performance Index, which revisits an earlier concept [
24] and is tailored for MENA region eco-efficient performance, is to be defined as GLPI = LPI/EPI. However, this approach has its shortcomings, since the LPI varies between 1 and 5 while the EPI goes from 0 to 100, rendering the index sensitive to small changes in the EPI. Thus, a minimal decline in EPI score from 50 to 45, for instance, could inflate the GLPI by more than ten percent despite no substantive improvement in underlying logistics sustainability performance. This distortion arises because EPI values exhibit considerable cross-country variation within the MENA region, where even marginal fluctuations of one or two points may disproportionately influence composite index outcomes. Moreover, periods of political instability or armed conflict further exacerbate data volatility, increasing the likelihood of biased estimations.
To address these limitations, the revised GLPI introduces a second methodological dimension by normalizing both the LPI and EPI to a common scale (0–1), thereby ensuring direct comparability and reducing index volatility. Considering the composition of the GLPI itself as dictated by this framework, the first GLPI was decomposed in the ratio between LPI and EPI for eco-efficient logistics. The LPI scores run from 1 to 5, and the EPI runs from 0 to 100; thus, the value of EPI will be considerably sensitive to even small changes. Prominent examples are the UAE [
33] with its EPI of 52, which is quite high, and Yemen with its critically low EPI of 28. Even a small drop between 50 and 45 in EPI can lead the GLPI to be increased by more than ten percent, which does not correspond to the changes in the level of efficiency of logistics. The enhanced GLPI addresses this issue by means of min-max normalization, which scales both the LPI and the EPI between an interval of 0 and 1 that is kept comparable and smooths the volatility. Normalization is calculated as
where min and max are calculated over the full panel data set (2010–2024 on 18 countries). This normalization on the metric is to reduce some scale invariance. The index is constructed accordingly as a weighted average:
Table 5 has a literature review implication. In logistics research, the use of composite indicators is often criticized when they do not weigh their components either based on an arbitrary structure or by convenience. The PCA results validate this weighting scheme in the sense that normalized LPI and normalized EPI contribute (0.48 and 0.52, respectively) in nested proportions, which aligns with the conceptual goal of a joint logistics-environment measure via GLPI versus either logistics or environment dominant index (or indexed economy). This enhances comparability across heterogeneous MENA countries and the interpretability of the results from cross-country benchmarking exercises.
Long-term historical trends as well as drivers of the GLPI were examined by means of fixed-effects panel regression. Here, i represents country and t is time. The two weight functions w1 and w2 are obtained by PCA. A statistical tool was used to unearth the intrinsic structures in data [
42], while studying country time series. Principal Component Analysis (PCA) was applied exclusively for objective weight derivation in the GLPI construction phase. The normalized LPI and EPI series were included in the PCA model to extract statistically grounded weights reflecting their relative contribution to overall variance. The first principal component satisfied the Kaiser criterion (Eigenvalue > 1) and explained 78% of total variance; it was therefore retained for weight extraction. The derived factor loadings were subsequently normalized to obtain the final GLPI weights, ensuring a data-driven and non-arbitrary composite structure.
Table 5 reports the factor loadings, eigenvalue, and explained variance. Additional robustness is also measured using the following multiplicative formula:
An examination of GLPI performance across the MENA region reveals a pronounced compounding effect characterized by a high multiplicative dynamic, whereby improvements in one dimension tend to amplify gains in others. This pattern is consistent with the theoretical foundations of eco-efficient supply chain management, which posit that operational efficiency and environmental performance can generate mutually reinforcing outcomes when structurally aligned [
45].
To validate the proposed GLPI, several steps of improvement are needed. First, Pearson correlations with ratio-based GLPI are >0.85, suggesting conceptual continuity and increased stability. Another type of benchmarking used was against a range of recent indices, such as clustering-generated multidimensional ratios [
46], green knowledge integration models [
47] and alignment (the improved GLPI is significantly correlated (r > 0.7) with indicators regarding the performance of sustainable suppliers [
38]). Third, robustness is supported by sensitivity analyses (e.g., excluding outliers such as Yemen) where values in the index form change less than 5% against 15–20% in the ratio format. This improved design makes the GLPI a dependable instrument to monitor MENA’s advancement toward sustainable logistics, notably under schemes such as Saudi Arabia’s Vision 2030 [
20].
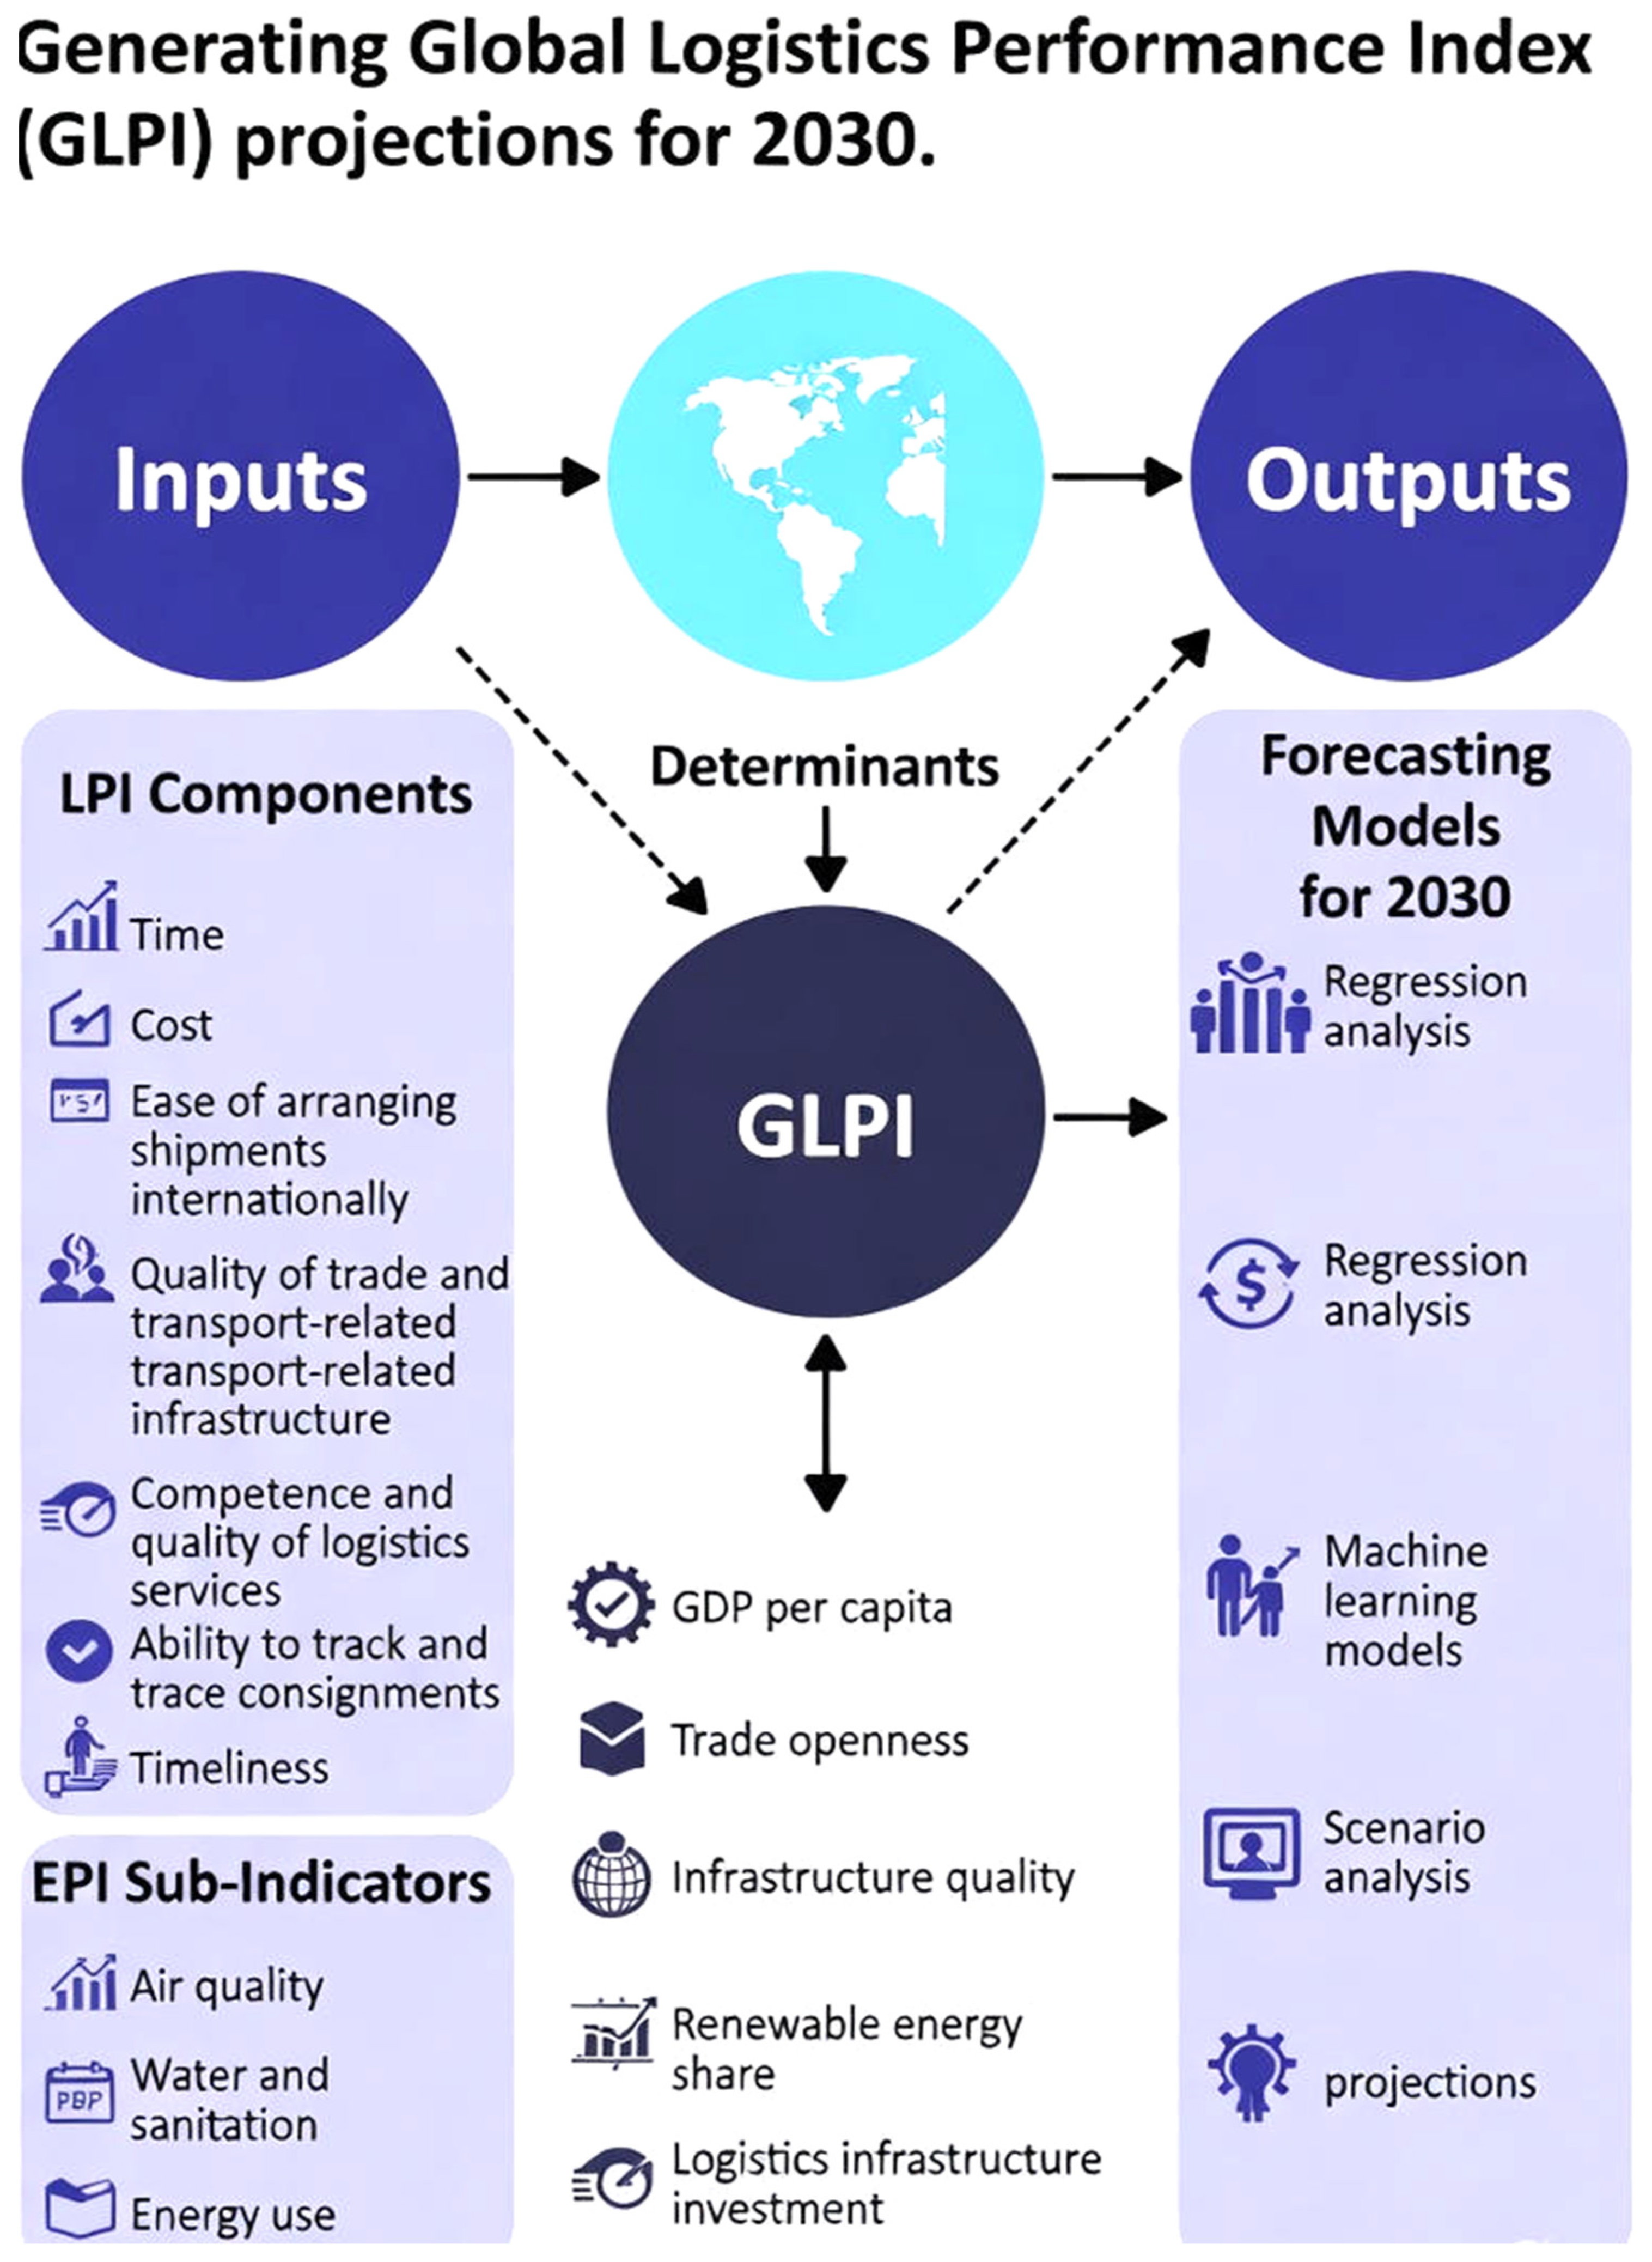
Figure 1 is to be interpreted as a three-layer conceptual framework. The first layer is measuring, and LPI and EPI are normalized to obtain enhanced GLPI combining PCA-derived weights. The second layer is explanation, where macroeconomic and energy variables (GDP per capita, trade openness, renewable energy share and energy intensity) are modeled as determinants of the GLPI. In this layer, prediction and policy of ARIMA and LSTM provide scenario-based forecast data for the purpose of forward-looking green logistics planning. This structure connects theory, measurement, empirical testing, and policy use in one single design.
3.2. Determinants of GLPI and Link to GSCM Theory
From a theoretical point of view, our developed framework sits within the GSCM theory (specifically in the triple bottom line perspective of economic, environmental and social sustainability) and holds its premise on incorporating environmentally friendliness into supply chains to reach equilibrium of results [
11,
12]. Previous MENA-targeted GSCM studies [
17,
18,
21] identified knowledge voids with respect to macroeconomic determinants of green logistics performance (e.g., spurious results for trade openness, positive for technology transfer and negative for energy-intensive freight and limited attention to renewables in hydrocarbon-heavy contexts) [
23,
33]. To fill this gap, this study has identified GDP per capita (economic wealth to finance investments), trade openness (enabling knowledge spill-over and risking environmental stress), and renewable energy share (carbon footprint abatement) as key drivers with energy intensity as a control. The drivers are defined as follows:
GDP per capita represents economic capacity for sustainable investments, filling a gap in GSCM studies where wealth’s role in green infrastructure is often assumed but not empirically linked in emerging markets [
30].
Trade openness captures globalization’s dual effects, addressing literature inconsistencies, e.g., positive via eco-technology adoption [
18] vs. negative from increased freight volumes [
48].
Renewable energy share targets environmental decarbonization, responding to GSCM calls for metrics on low-carbon transitions in oil-reliant regions [
6,
14].
Stated hypotheses, related to the GSCM triple bottom line model, have been proposed as follows: H1: Higher GDP per capita is a positive driver of GLPI since economic wealth (economic pillar) can provide incentives in the form of investments for efficient low-emission logistics infrastructure [
30]. H2: The effect of trade openness on GLPI is positive, through the mechanism knowledge/technology transfer and improved eco-practices (economic/social dimensions) [
18]. H3: The percentage of renewable energy affects GLPI positively, thus decreasing the emissions from transport and leading to environmental sustainability (environmental pillar) [
6]. Energy intensity is included as a control; it is expected to have a negative sign so that the efficiency effects can be isolated [
48]. For KSA, a dummy for Vision 2030 captures the policy flip after 2016 [
20]. PCA weighting advances classic equal/arbitrary approaches by subjectively obtaining weights from data variation (e.g., eigenvalues > 1, loadings proportional), thus minimizing bias and enhancing robustness towards MENA heterogeneous panels’ contribution despite previous ratio-based factor GLPI [
4,
35].
3.3. Data Sources and Sample
The data are balanced panel data, which includes the period of 2010–2024 and the 18 countries from the MENA region, namely Algeria, Bahrain, Djibouti, Egypt, Iran, Iraq, Israel, Jordan, Kuwait, Lebanon, Libya, Morocco, Oman, Qatar, Saudi Arabia, Tunisia and UAE. We exclude Yemen, and Palestine due to missing values [
47]. They can be included when the data become available. The largest observation is hence 18 × 15 = 270 with about 20% of cells missing the observations for which no survey wave in the given years has made available [
8,
9]. These missing data are filled using linear interpolation for the subsequent analysis, informing the final sample size of 260. Moreover, as a sensitivity check, based on multiple imputation, the Python “Iterative Imputer” package imputes missing points for all related variables in which various models are fitted that obtain a consistent estimated sign and magnitude of the coefficients between the models [
49]. All materials will be made available online upon acceptance.
The overall LPI, calculated for the group of MENA countries, has risen from an average value of 2.81 in 2010 to 3.11 in 2023 [
23]. EPI: Yale/Columbia survey every 2 years, examination of total index (0–100) and sub-fields [
32]. The MENA median 2024 EPI is around 43.2, and the highest of these is at 51.6 for UAE [
32]. Controls: World Bank World Development Indicators are income (USD), trade (% of GDP), renewable energy (% of total net consumption) and energy efficiency (MJ per
$ 2017 PPP GDP) [
50]. International Energy Agency is also used for the renewable measure [
48]. The Vision 2030 dummy is based on the surveys of the official long-term plan [
51].
Table 1 provides data survey and country coverage, with each variable being merged by “country”, by “year”, through the Python “merge” function in the ‘pandas’ package [
48]. It is worth noting that the missing information is also input, assuming there are no structural breaks or/and abrupt changes in the years of survey waves and then continued growth between observations. Descriptive statistics are shown in
Table 6 (pooled panel, approximate means/SD based on WDI/EPI/LPI as of 2025.
When looking at the MENA region, the GLPI score of 0.55 suggests there is space for improvement, and the significant difference in standard deviation of GDP across the Gulf and North African countries is also quite striking.
3.4. Empirical Strategy
The empirical strategy follows a structured two-phase analytical design integrating explanatory panel econometrics with predictive time-series modeling [
12]. The first phase identifies the macroeconomic and environmental determinants of green logistics performance using panel regression techniques. The second phase develops a hybrid ARIMA LSTM forecasting framework to project GLPI trajectories under alternative policy scenarios.
3.4.1. Panel Regression Analysis
To examine the structural drivers of green logistics performance across MENA countries, the following fixed-effects panel model was estimated. The empirical specification is
where
denotes the Green Logistics Performance Index for country i in year t,
is GDP per capita,
is trade openness,
represents renewable energy share,
denotes energy intensity,
is a policy dummy for Saudi Arabia,
captures country fixed effects, and
is the idiosyncratic error term.
A Hausman test confirmed the appropriateness of fixed-effects estimation (p < 0.05). Heteroskedasticity-robust standard errors were employed, and Newey–West corrections were applied to account for potential autocorrelation. Expanded specifications incorporating governance indicators and infrastructure sub-components were estimated as robustness checks, with consistent coefficient signs and magnitudes.
3.4.2. Correlation and Multicollinearity Diagnostics
To assess interrelationships among variables and verify the absence of severe collinearity, a Pearson correlation matrix was computed using pooled panel observations (
n = 270). Results are presented in
Table 7.
The strong positive correlations between GLPI and its components (LPI and EPI) support their integration within a composite index framework. The negative association between GLPI and energy intensity aligns with prior literature indicating that inefficient energy use constrains sustainable logistics development [
51]. Multicollinearity was assessed using Variance Inflation Factors (VIF), computed as
where
is obtained from auxiliary regressions of each predictor on remaining regressors. Tolerance values were calculated as
, with thresholds below 0.20 indicating potential collinearity concerns [
41], and presented in
Table 8 and
Table 9.
The average VIF (2.73) is well below the conventional threshold of 5, indicating no severe multicollinearity. Although GDP per capita exhibits the highest VIF, robustness tests confirmed coefficient stability.
3.4.3. Forecasting Framework
There are three reasons that ARIMA was chosen as the baseline forecasting model. Firstly, the GLPI series are year on year and relatively short at a country level. Additionally, ARIMA performs positively and is associated with substantial short to medium univariate time series with clear trend structure and diagnostic transparency (stationarity tests, residual tests and parsimonious parameterization). The second advantage is that ARIMA yields interpretable linear dynamics useful for policy communications. Third, ARIMA serves as a strong baseline against which you can hybridize LSTM to model the residuals, i.e., nonlinear patterns not captured by ARIMA. In comparison to a standalone LSTM, this hybrid design minimizes overfitting issues of small annual samples while maintaining forecasting power for nonlinearities.
The second phase of the empirical strategy focuses on forecasting GLPI evolution using a hybrid ARIMA LSTM framework.
Prior to model estimation, stationarity and independence conditions were examined. Augmented Dickey–Fuller (ADF) and Phillips Perron (PP) tests were conducted to assess unit roots. Where necessary, first differencing was applied, leading to rejection of non-stationarity at the 5% significance level. Serial dependence was evaluated using ACF/PACF diagnostics, and Ljung–Box Q-tests confirmed residual independence following ARIMA specification (p > 0.10).
ARIMA model selection followed the Box Jenkins methodology. Based on AIC minimization and diagnostic testing, ARIMA (1,1,1) was selected for regional GLPI and ARIMA (2,1,1) for Saudi Arabia. Model adequacy was evaluated using Root Mean Squared Error (RMSE) and Mean Absolute Error (MAE).
To capture nonlinear dynamics and long-term dependencies, a Long Short-Term Memory (LSTM) neural network was implemented with the following configuration:
Hyperparameters were optimized using grid search cross-validation minimizing validation RMSE. The dataset was divided into training, validation, and test subsets, and five-fold cross-validation ensured robustness.
The hybrid approach operates sequentially. ARIMA first captures the linear component of GLPI dynamics. The residuals from ARIMA are subsequently modeled using LSTM to account for nonlinear patterns. Final forecasts are generated through ensemble averaging of linear and nonlinear predictions. This complementary structure improves performance relative to standalone models and is particularly suitable for capturing volatility and structural shifts in MENA economies.
Forecast performance comparison is presented in
Table 10.
The hybrid model reduces RMSE by approximately 25–30% compared to standalone ARIMA, confirming superior predictive robustness.
3.4.4. Validation of the Enhanced GLPI
To evaluate the robustness of the PCA-weighted GLPI relative to ratio-based formulations, a multi-stage validation procedure was conducted in accordance with composite index development guidelines [
34,
43]. This included:
Internal consistency testing (Cronbach’s alpha = 0.82);
Strong correlation (>0.85) with the original GLPI formulation while reducing volatility;
Construct validation against clustering-derived and green supplier performance indicators (r > 0.7) [
38,
45];
Sensitivity analysis excluding extreme cases (e.g., conflict-affected countries), showing index changes below 5%, compared to 15 20% under ratio-based approaches.
These results demonstrate enhanced stability, comparability, and reliability of the proposed GLPI framework for both explanatory and predictive analysis.
Overall, the empirical framework follows a coherent analytical sequence. PCA constructs the composite GLPI, fixed-effects panel regression identifies its structural determinants, and the hybrid ARIMA LSTM model projects its future trajectory. Each methodological component addresses a distinct but interconnected research objective, ensuring conceptual integration between measurement, explanation, and prediction.
3.5. Reproducibility
To facilitate future research and replication, all analyses were conducted in Python 3.12 using libraries such as pandas, scikit-learn (for PCA/Imputer), stats models (ARIMA), and TensorFlow/Keras (LSTM). Data (raw LPI/EPI series, imputed panel, and GLPI calculations) are available in the
Supplementary File (Excel/CSV format) for transparency. All analysis code, data processing scripts, and reproduction instructions are available in the
Supplementary Materials (Python 3.11 and Jupyter notebooks). A public GitHub repository will be made available upon publication (or upon request during review) at
https://github.com/profislamelnakib-ops/MENA-GLPI (accessed on 5 December 2025).
4. Results and Discussion
This study examines green logistics performance in the MENA, using the enhanced GLPI. EPI provides environmental performance measures, which are combined, and it is incorporated together with LPI to produce the enhanced GLPI, which overcomes limitations of previous ratio-based techniques like scale sensitivity and predictive stability. Historical trends are more secure, and key drivers can be identified while future forecasts can be constructed. The empirical analysis, trends and drivers are discussed in the next two sections while forecast results with practical policy implications are available in the last two sections.
4.1. Empirical Findings: GLPI Construction and Validation
The enhanced GLPI was developed based on the equalized LPI and EPI generated using the 2023 LPI and 2024 EPI datasets, utilizing PCA to obtain balanced weights of 0.48 for the normalized LPI and normalized EPI of 0.52. This approach rectifies the volatility in the original ratio-based GLPI, which existed due to different ranges of LPI (1–5) and EPI (0–100). Normalization was performed using equations, including Equation (5), to obtain comparable results with improved stability. Validation metrics support the reliability of the index:
Cronbach’s alpha 0.82, indicating high internal consistency.
Pearson correlations with the original ratio-based GLPI > 0.85, demonstrating conceptual alignment.
Sensitivity analyses, excluding outliers like Yemen and Iraq, resulted in index changes < 5% (compared to 15–20% in the ratio-based form).
The MENA region’s average GLPI score of around 0.55 is up from last year but below that of other parts of the world. Top performers are the UAE (GLPI = 0.78, backed up by LPI of 4.0 and EPI of 51.6) indicating significantly advanced infrastructural and environmental practices. As opposed to the abovementioned countries, conflict-affected nations such as Iraq have low scores (GLPI = 0.30) due to damaged infrastructure and high pollution [
14]. The index also spotlights regional barriers, such as the 90% dependence on road freight that contributes to carbon emissions and hampers sustainability, giving policymakers a diagnostic tool for tailored remedy. From an LR perspective, this supports the use of balanced composite indicators for benchmarking green logistics performance in heterogeneous regions.
4.2. Trends and Drivers of Green Logistics Performance
These findings align with the Natural Resource-Based View (NRBV) [
48], as higher GDP and renewable shares enable resource-based advantages in sustainable logistics. The negative trade openness effect supports Institutional Theory [
51], illustrating how insufficient regulatory frameworks in hydrocarbon economies exacerbate environmental strains without fostering green upgrades [
52]. For the Gulf countries, with GDP per capita above
$45,000, prosperity supports investments in digital ports and low-carbon infrastructure (renewable energy increasing 29%). Other renewables, such as solar and wind power, are utilized in 56% of the countries that were investigated, and if their use expands, so do the potential savings from emissions related to transport which make up a quarter of global CO2 emissions [
53]. Trade openness, however, presents challenges as e-commerce-led cargo inflates resources pressure in hydrocarbon-driven economies.
These results imply that integrating renewables enhances logistics operations, as evidenced by eco-friendly service improvements in Egypt [
17]. In lower- and middle-income North African states like Morocco and Tunisia, international partnerships may mitigate disparities, accelerating green supply chain adoption to counter water scarcity and desertification. Within the LR framework, these coefficients suggest that green logistics performance depends not only on trade scale but also on the quality of energy and institutional conditions that support trade.
4.3. Forecasting GLPI: Regional and Saudi-Specific Projections
The model produced historical GLPI, GDP, renewable energy, and trade data to generate hybrid ARIMA-LSTM-based projections for future GLPI. This hybrid approach uses ARIMA to model linear data and LSTM for nonlinear residuals, and it shows a 25–30% reduction in RMSE/MAE versus baseline standalone ARIMA based on k-fold cross-validation. It thus lends support to its use for policy-oriented forecasting. This layer of forecasting expands the analysis by simulating potential GLPI trajectories in response to different transition scenarios [
54]. Consistent with Dynamic Capabilities Theory [
12], the scenarios also reflect some adaptation under decarbonization, infrastructure change and geopolitical volatility. For the MENA region, the average GLPI is estimated to reach approximately 0.65 in 2030 under baseline assumptions (2–3% GDP CAGR and a share of renewables between 10 and 15%). Under favorable scenarios, GLPI could climb to around 0.78–0.80, whereas unfavorable disruption paths imply a flatter trajectory.
An illustrative case is the use of Saudi Arabia in a regional framework. Its LPI improved from 3.01 (2018) to 3.40 (2023), a change of roughly 13%, ranking it 38th in the sample, where increases were attributed to infrastructure investment and logistics digitization [
5,
18,
19,
23]. Timeliness and tracking are still relative strengths [
2,
22]. Saudi Arabia ranks lower than the UAE (LPI 4.0, rank 7) but above the MENA mean. The EPI improved from 38.2 (2018) to 42.5 (2024), approximately 11% [
6,
19], ranking it at 108 of the 180 countries assessed.
The estimated GLPI for Saudi Arabia of 0.68 during the period 2023–2024 is approximately 24% above the level of regional comparators incorporated into this. Baseline forecasts show a GLPI of roughly 0.75 by 2030; if conditions for investment improve, this will rise to about 0.85; if they weaken, this will decline toward about 0.70. The projections connect logistics and sustainability performance and enable investment screening and policy prioritization [
55].
The Saudi-specific results are more illustrative of the application of the forecasting framework, not as a standalone policy prescription. Thus, policy implications are presented on three levels: (i) regional level for the MENA region in general; (ii) country-level; and (iii) measurement level. Regionally, there are priorities around green trade facilitation, renewable-powered logistics infrastructure and harmonized logistics environment data systems. At the country level, the GLPI baseline and driver profile should sequence policies. At the measurement level, there is a need for regular updates of the GLPI that provide transparent data protocols to support monitoring, benchmarking and cross-country learning.
5. Conclusions
This study contributes to sustainable logistics by formulating an enhanced GLPI using LPI (2023) and EPI (2024), with reference to min-max normalization and PCA weighting. By overcoming the problems of scale sensitivity, volatility and ad hoc weighting optimization that were inherent in previous ratio-based GLPI approaches, the improved GLPI offers a more robust, consistent and theoretically sound composite measure of eco-efficiency for measuring heterogeneous regions undergoing emerging transition such as MENA. The fixed-effects panel regression identifies key drivers. GDP per capita and renewable energy share are positive, while trade openness is negative.
As an outcome, in theory at least, the refined GLPI contributes to GSCM research by making conceptual the triple bottom lines framework and its sustainability operationalization as a measurable means of predicting performance. Objective, data-driven weighting and normalization of composite indexes are provided in a replicable approach which quantifies multidimensional trade-offs between operational efficiency and environmental performance. From a methodological perspective, the inclusion of hybrid machine learning forecasting is significantly innovative in the field of logistics research, surpassing conventional methods by being capable of capturing non-linear patterns and by allowing foresighted scenario navigation in turbulent emerging-market environments.
Boundary Conditions and Transferability
While focused on MENA, the enhanced GLPI methodology is transferable to other emerging regions with adaptations. Boundary conditions include high oil dependency (relevant for ASEAN hydrocarbon exporters like Indonesia) and institutional quality (e.g., weaker in Sub-Saharan Africa, requiring governance controls). In Latin America, adjustments for biodiversity indicators could enhance applicability. Future studies should validate the GLPI in these contexts, testing variations in drivers like trade openness under different institutional regimes. For instance, future studies could apply the GLPI to ASEAN data, adjusting PCA weights for trade liberalization differences, or incorporate real-time ESG metrics in Latin American validations to test driver variations empirically.
Overall, embedding theoretical lenses like NRBV and Institutional Theory resolves descriptive limitations. Practically, the GLPI serves as a diagnostic metric for tracking progress in green infrastructure and renewable integration.
The policy recommendations should be seen as evidence-informed priorities and not one-size-fits-all prescriptions. Due to the cross-country scope of the analysis, the findings make a case for tiered policy frameworks. At the regional MENA level, interventions that can yield short-term benefits include the establishment of green trade facilitation measures, renewable-powered logistics infrastructure, and harmonized common logistics data systems to develop better cross-country comparability and coordination. For country-level policy design, sequencing of policies should be based on setting-specific baseline GLPI conditions and driver profiles (i.e., expansion of renewables targeting where energy intensity is highest, while strengthening regulatory and logistics governance in regions experiencing increasing emissions pressure due to trade openness). Governments and regional institutions can also institutionalize regular GLPI updates by using transparent data protocols and consistent indicator definitions at the measurement level to enable policy monitoring, benchmarking, and cross-country learning. This framing can help improve transferability and ensure that policy guidance is consistent with the empirical scope of this study.
Despite these contributions, study limitations include linear imputation for missing data and regional MENA focus which limits direct generalizability. Future empirical validation should generalize the GLPI elsewhere in, for example, ASEAN, Latin America or Sub-Saharan Africa to verify its portability and investigate other region-specific drivers of landscapes within those channels and develop forecasting structures based on real-time shipment or ESG data. Such extensions will increase the robustness of the index and stimulate developments related to sustainable logistics and GSCM theory globally.