Enlarging Knowledge on Lager Beer Volatile Metabolites Using Multidimensional Gas Chromatography


Abstract
:
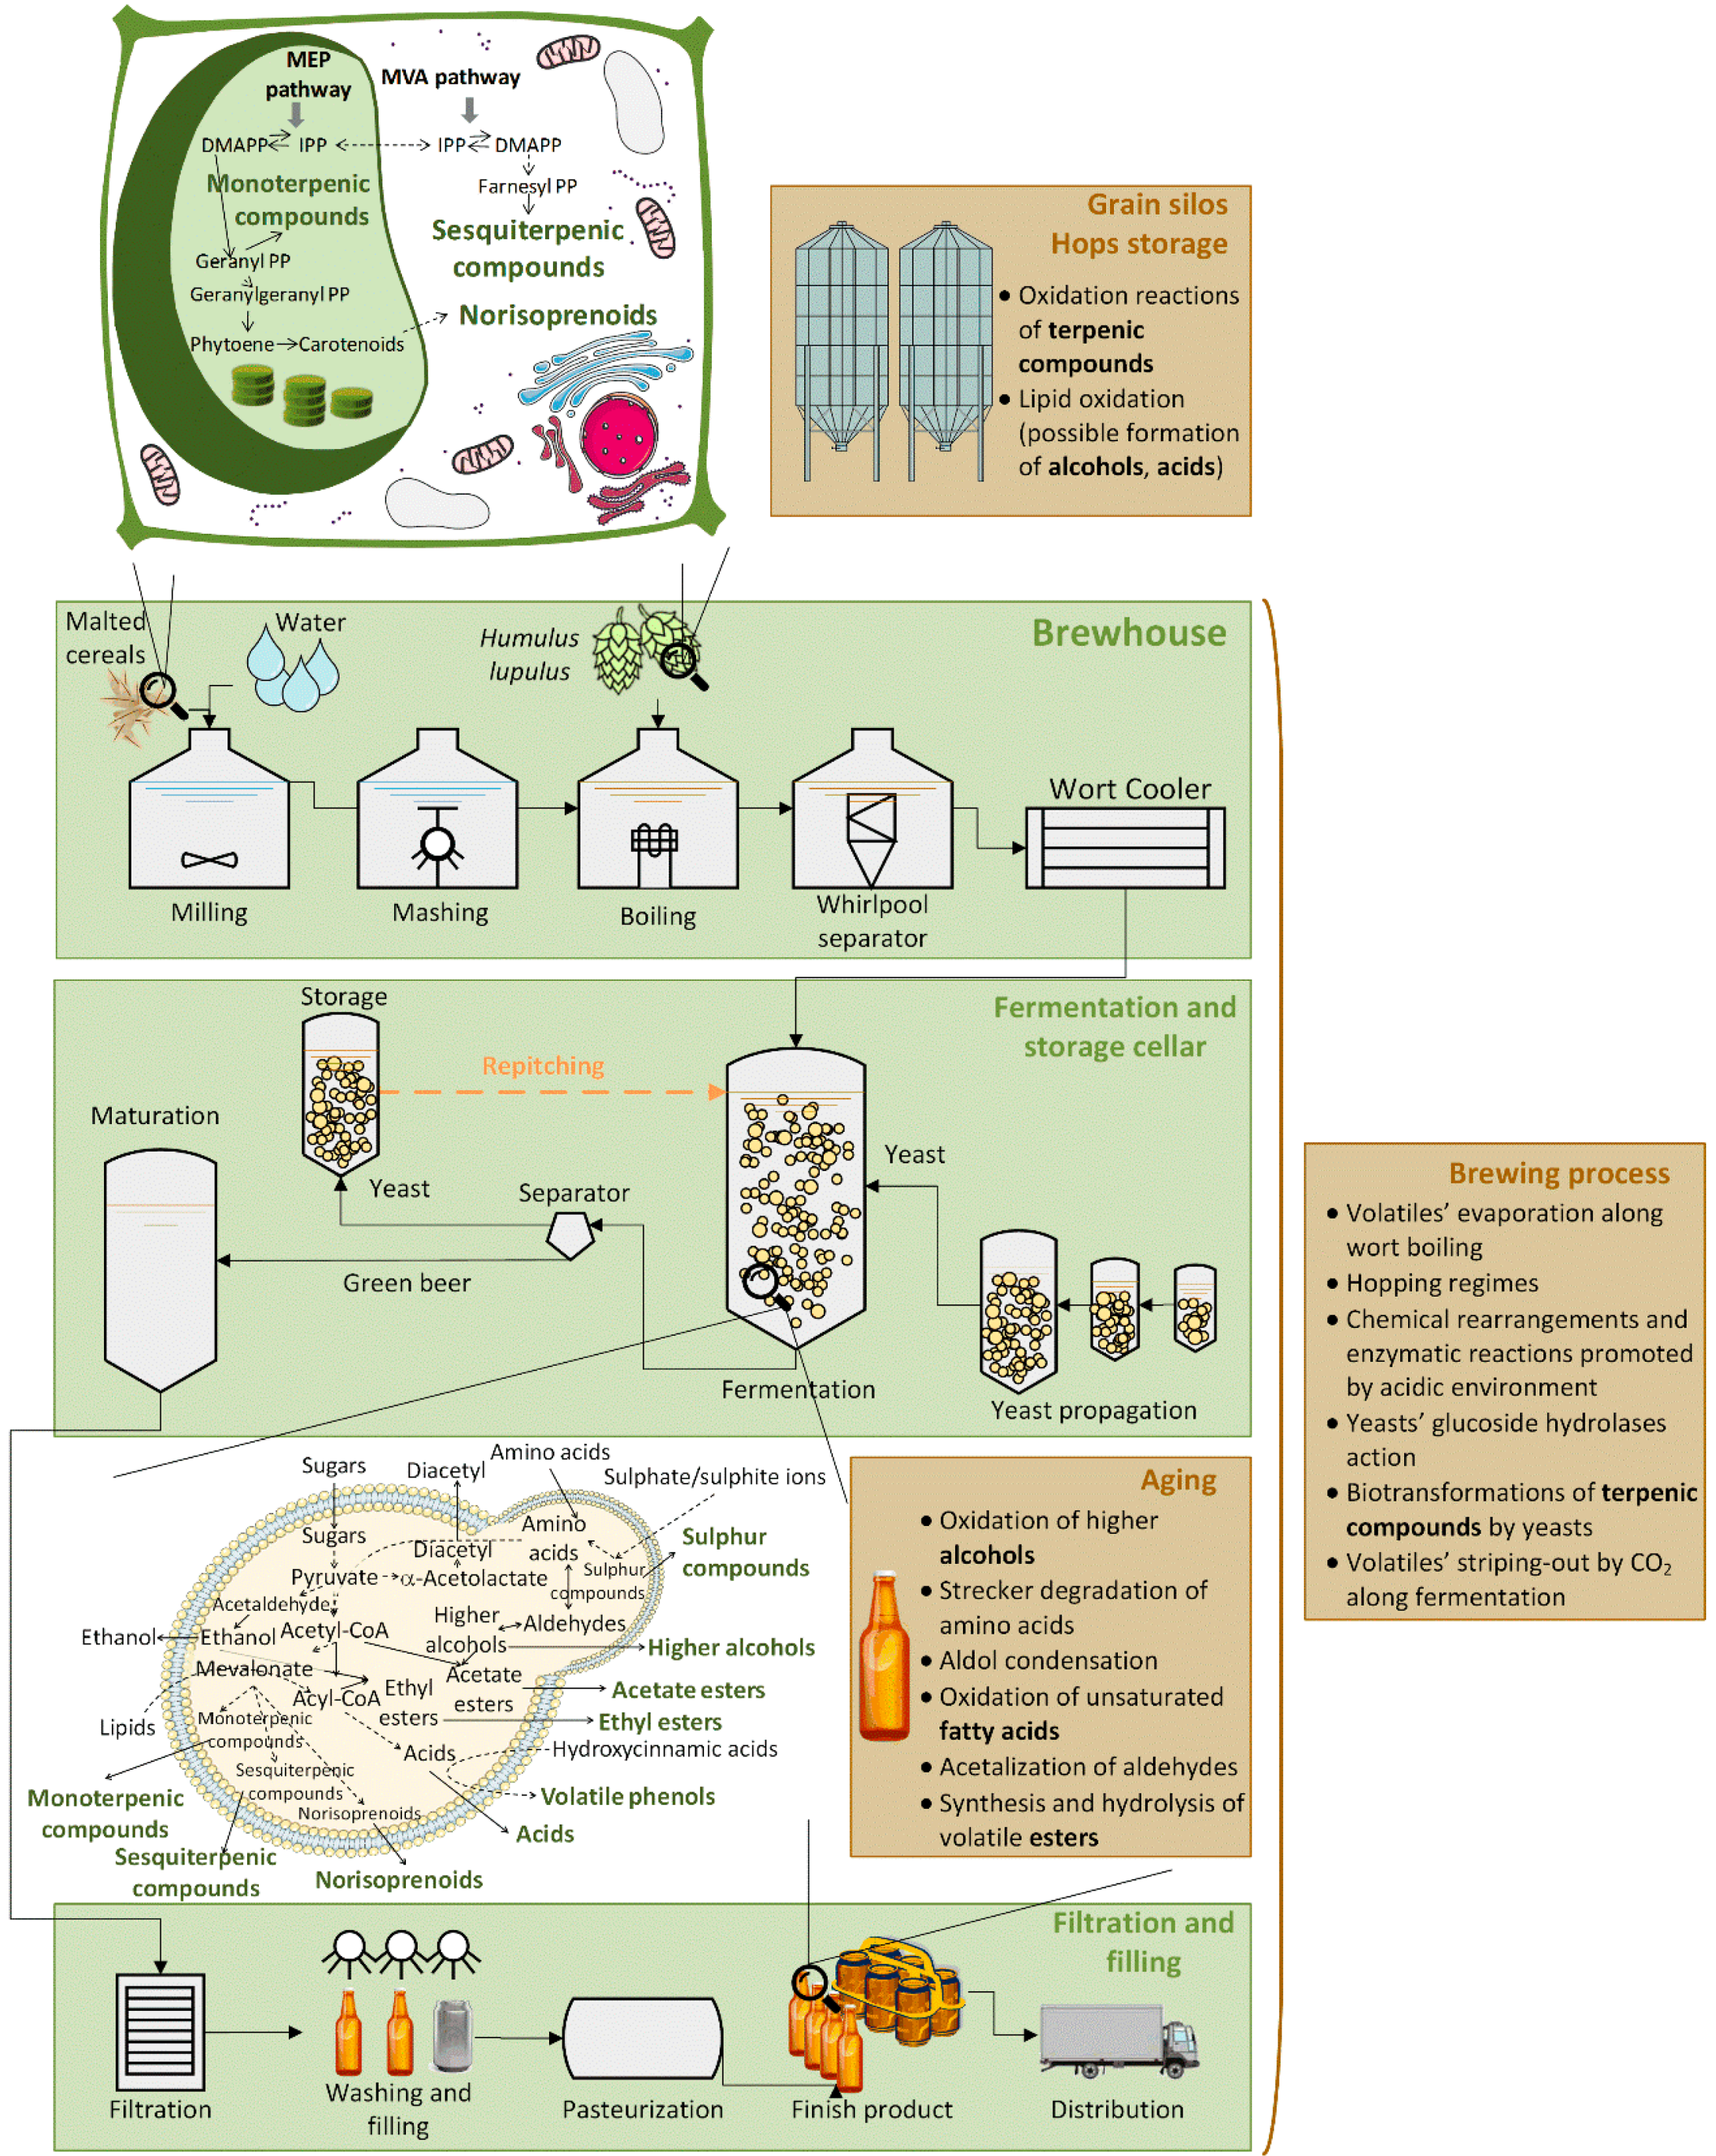
1. Introduction
2. Materials and Methods
2.1. Materials and Reagents
2.2. Samples
- A total of 15 beers from 9 macrobreweries (P1–P9)—macro-bbs, which were available on the Portuguese market, from different countries (Portugal, France, Spain, and Germany) and batches, with alcohol contents from 4.2–5.2%, with shelf-life from 1–10 months;
- A total of 3 beers from 3 microbreweries (P10–P12)—micro-bbs, which were available on the Portuguese market, produced in Portugal, with alcohol contents from 5.0–5.5%, with shelf-life from 4–10 months.
2.3. Beer Volatile Metabolites’ Determination by HS-SPME/GC×GC-ToFMS
2.4. Statistical Analysis
3. Results and Discussion
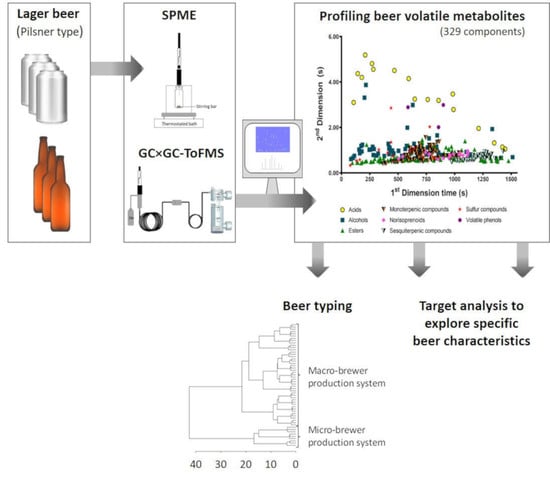
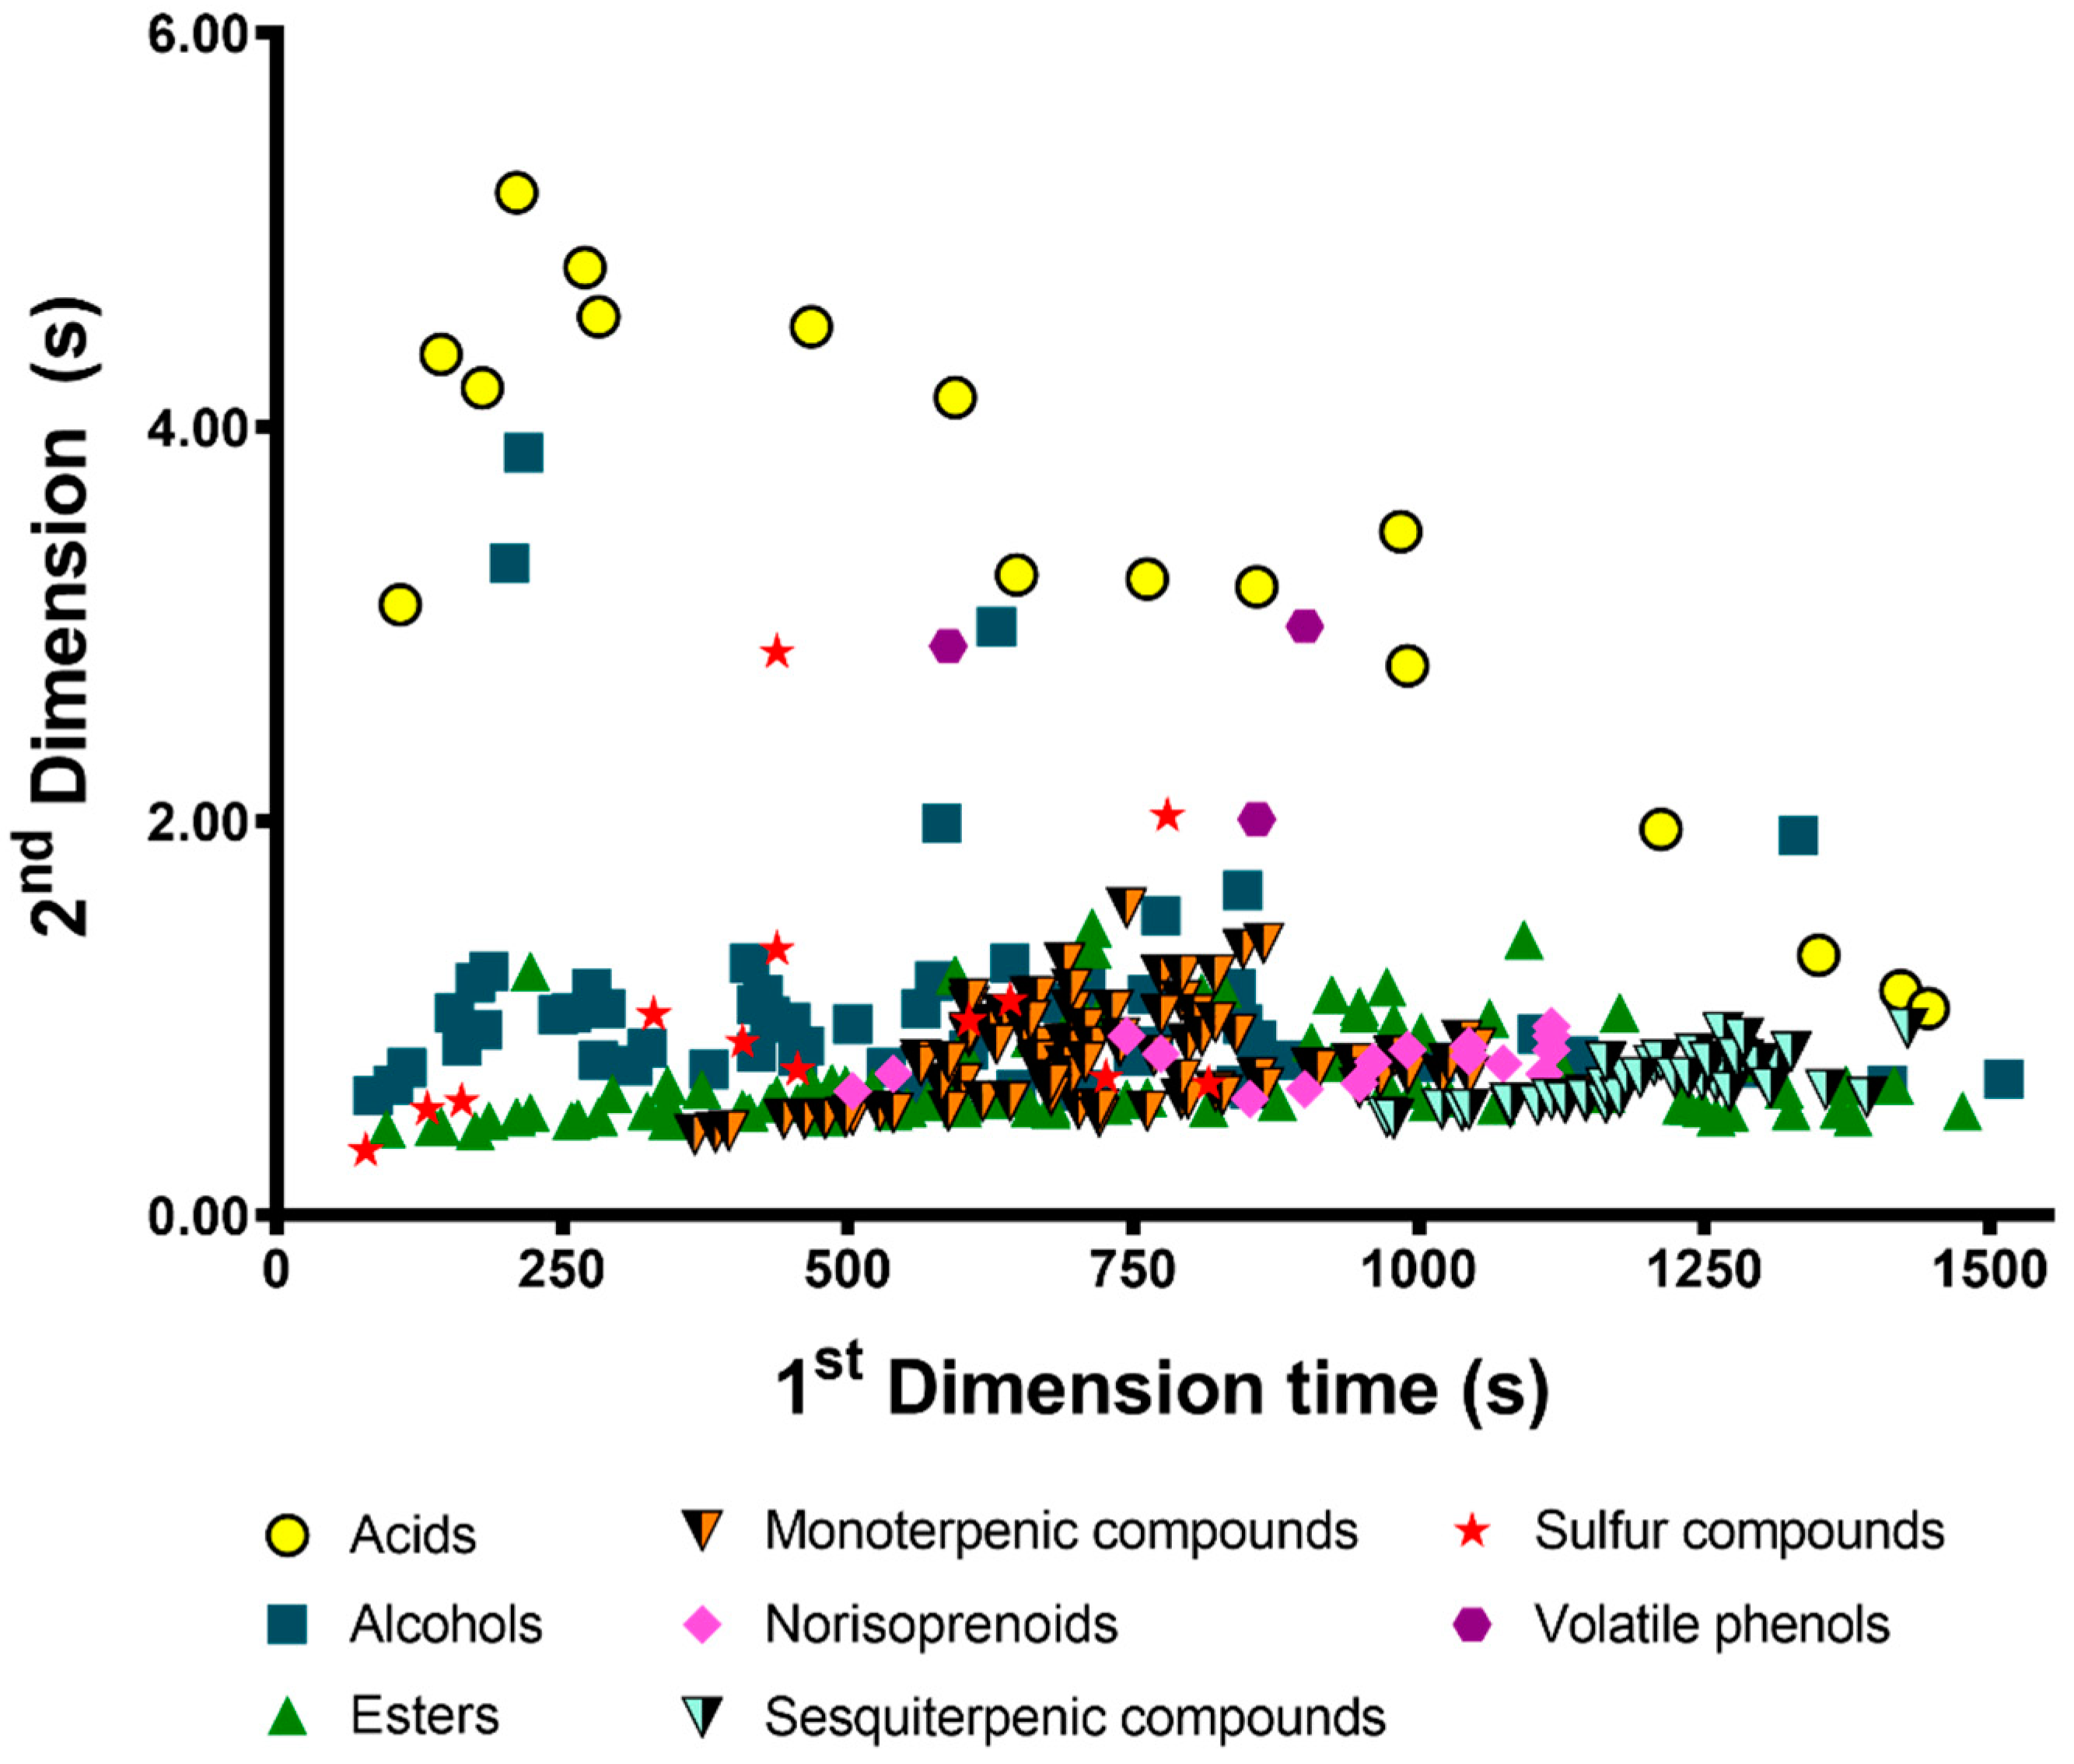
3.1. Chromatogram Contour Plot Analysis
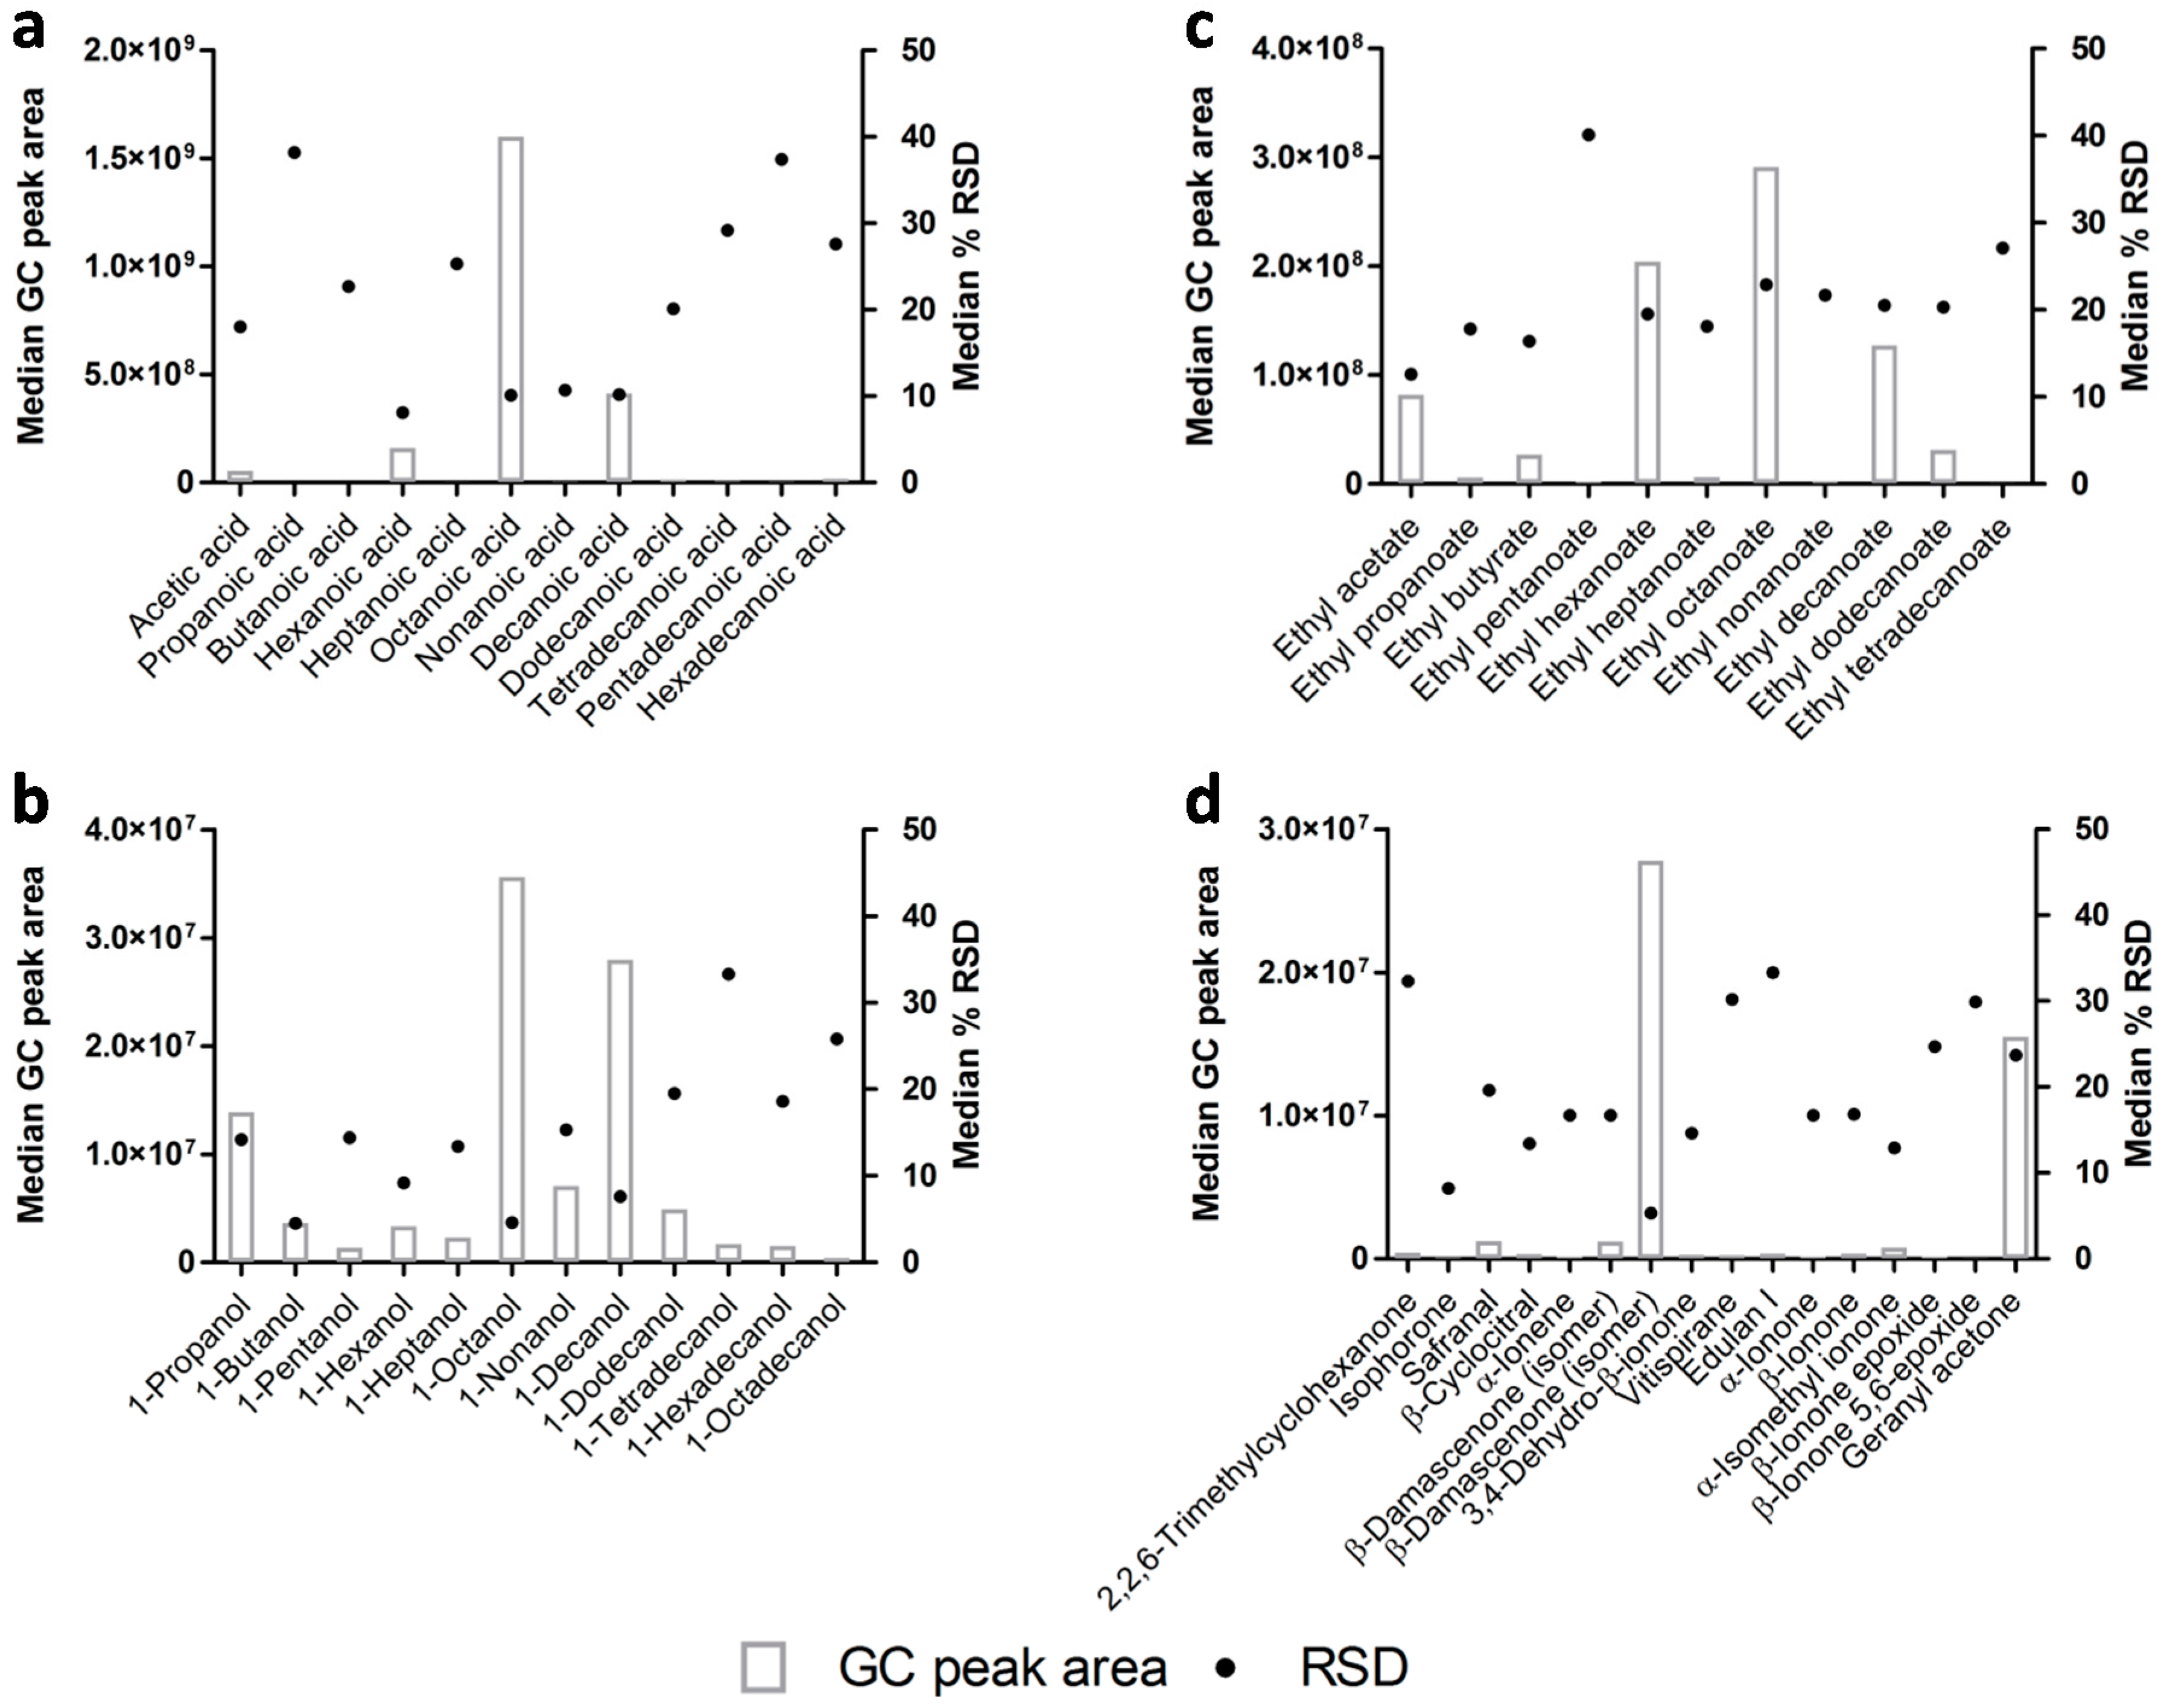
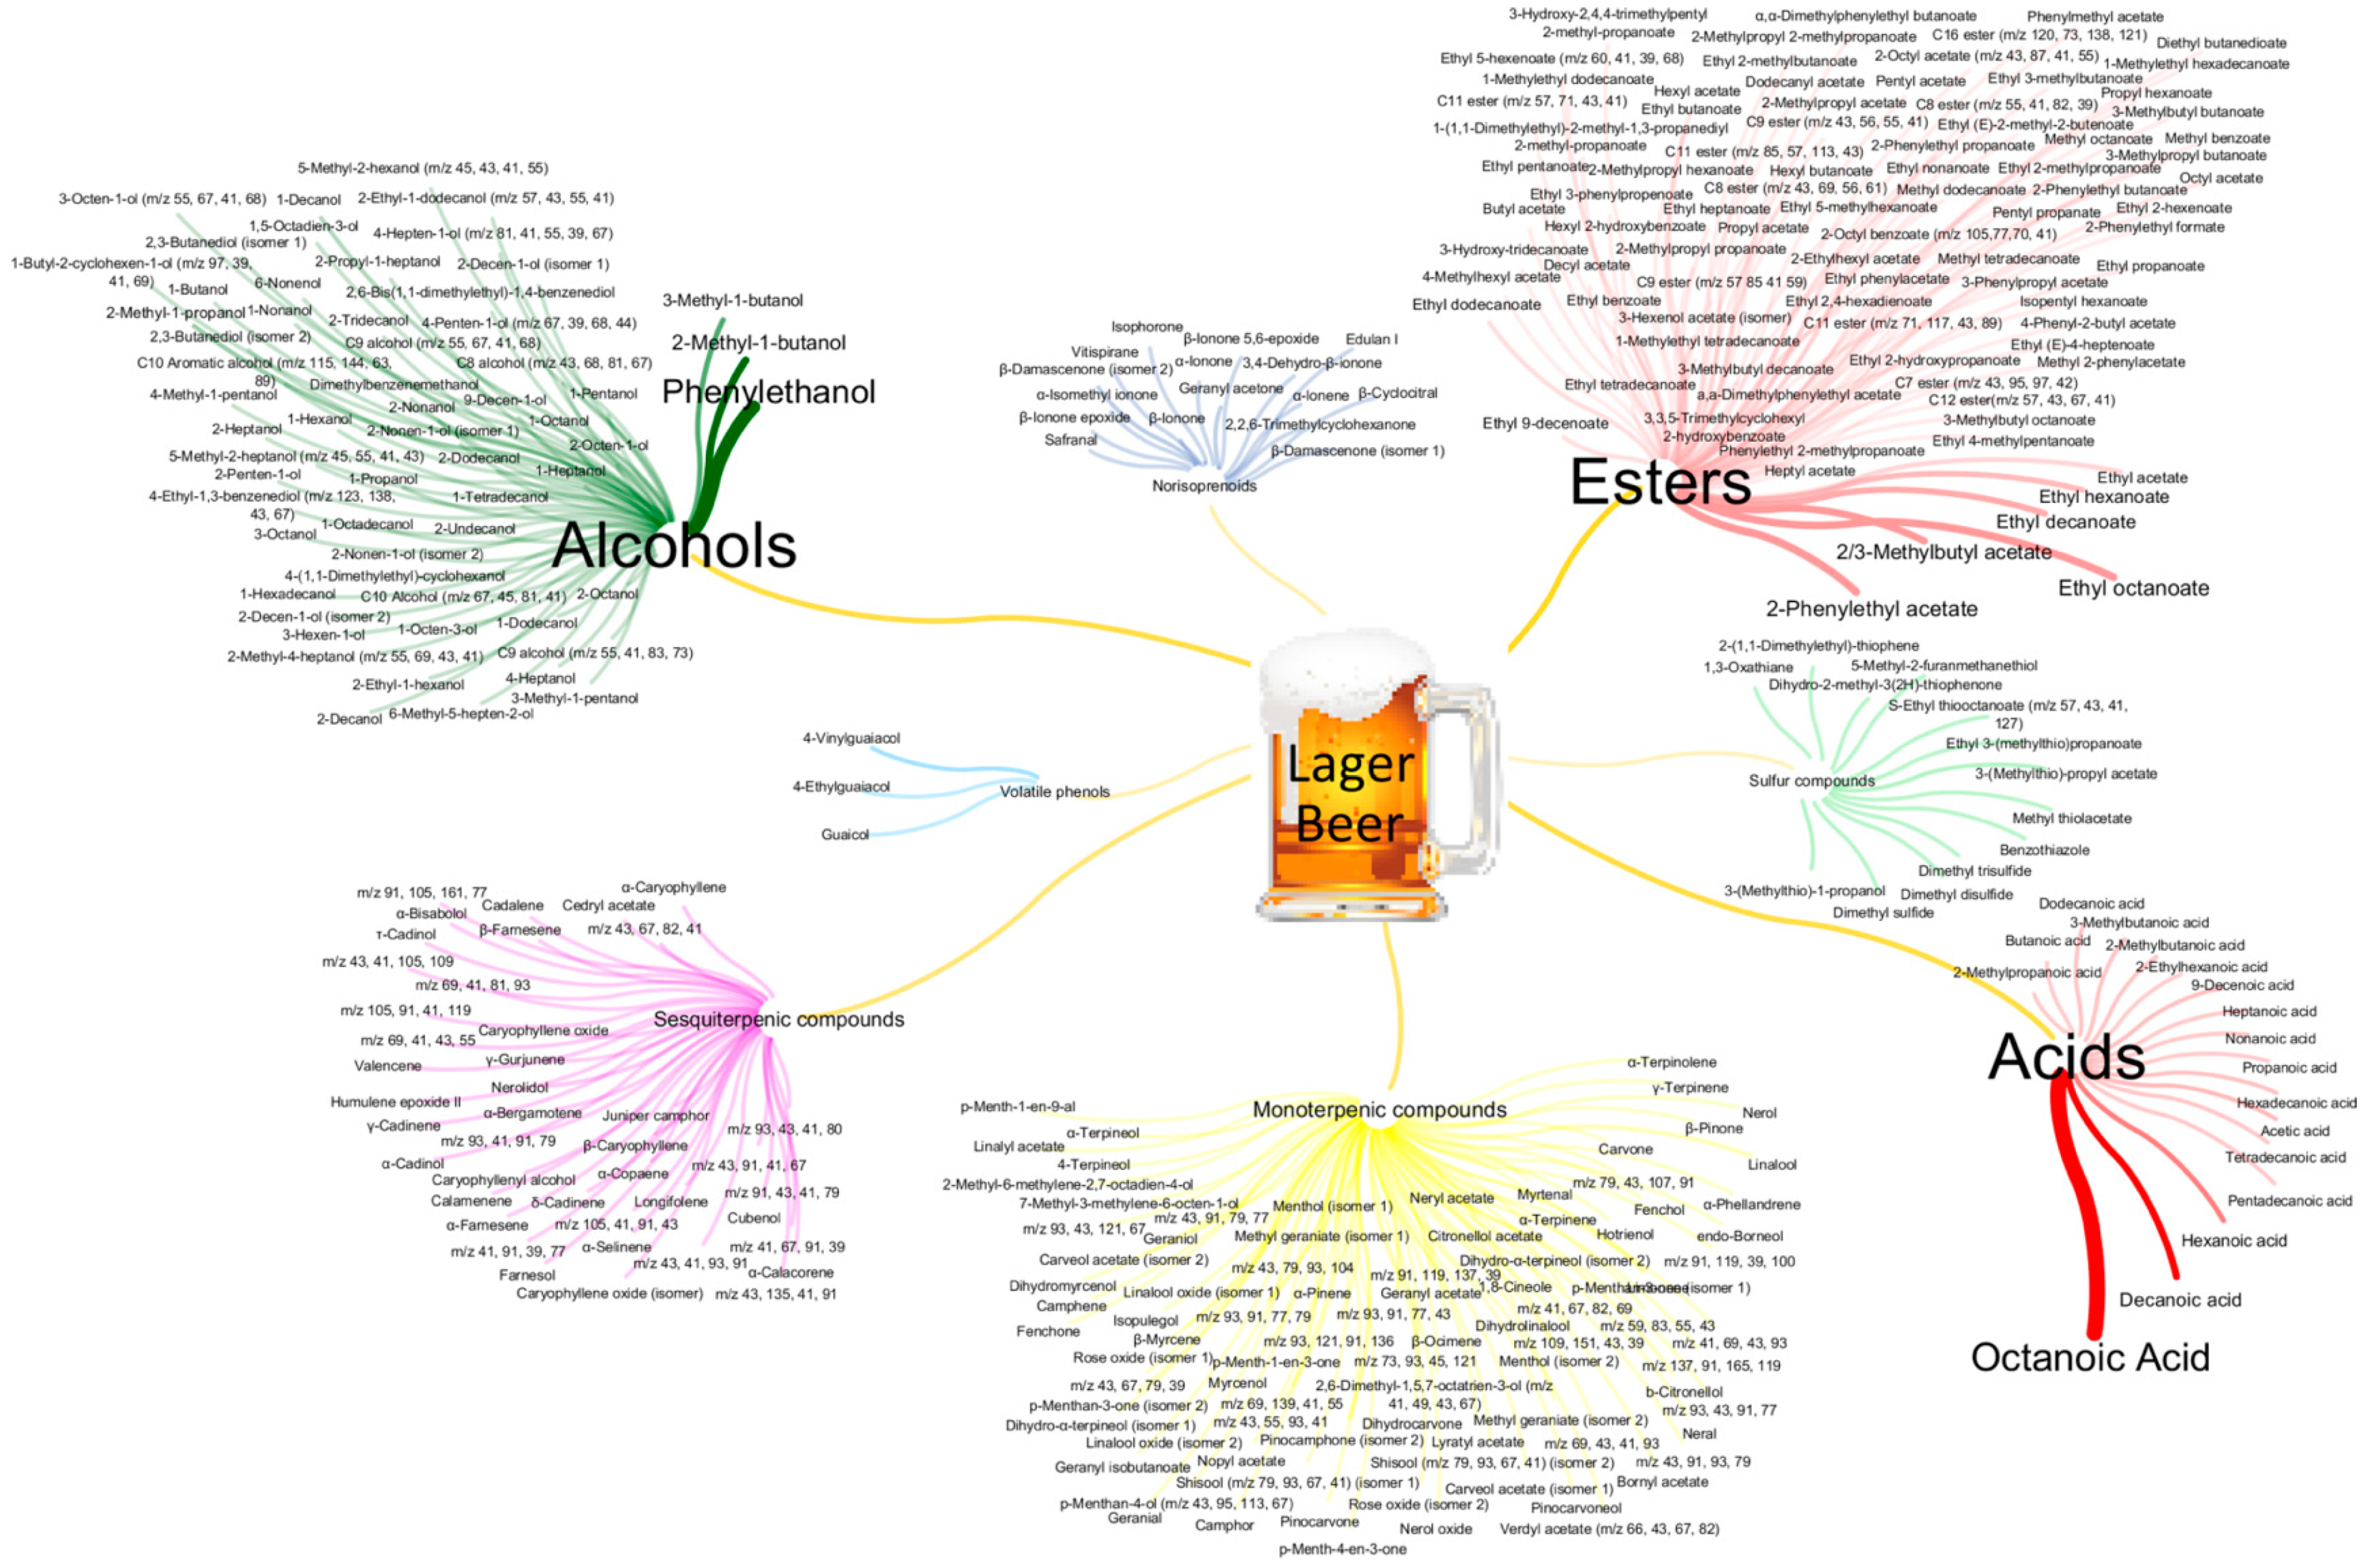
3.2. Profiling the Lager Beer Volatile Metabolites
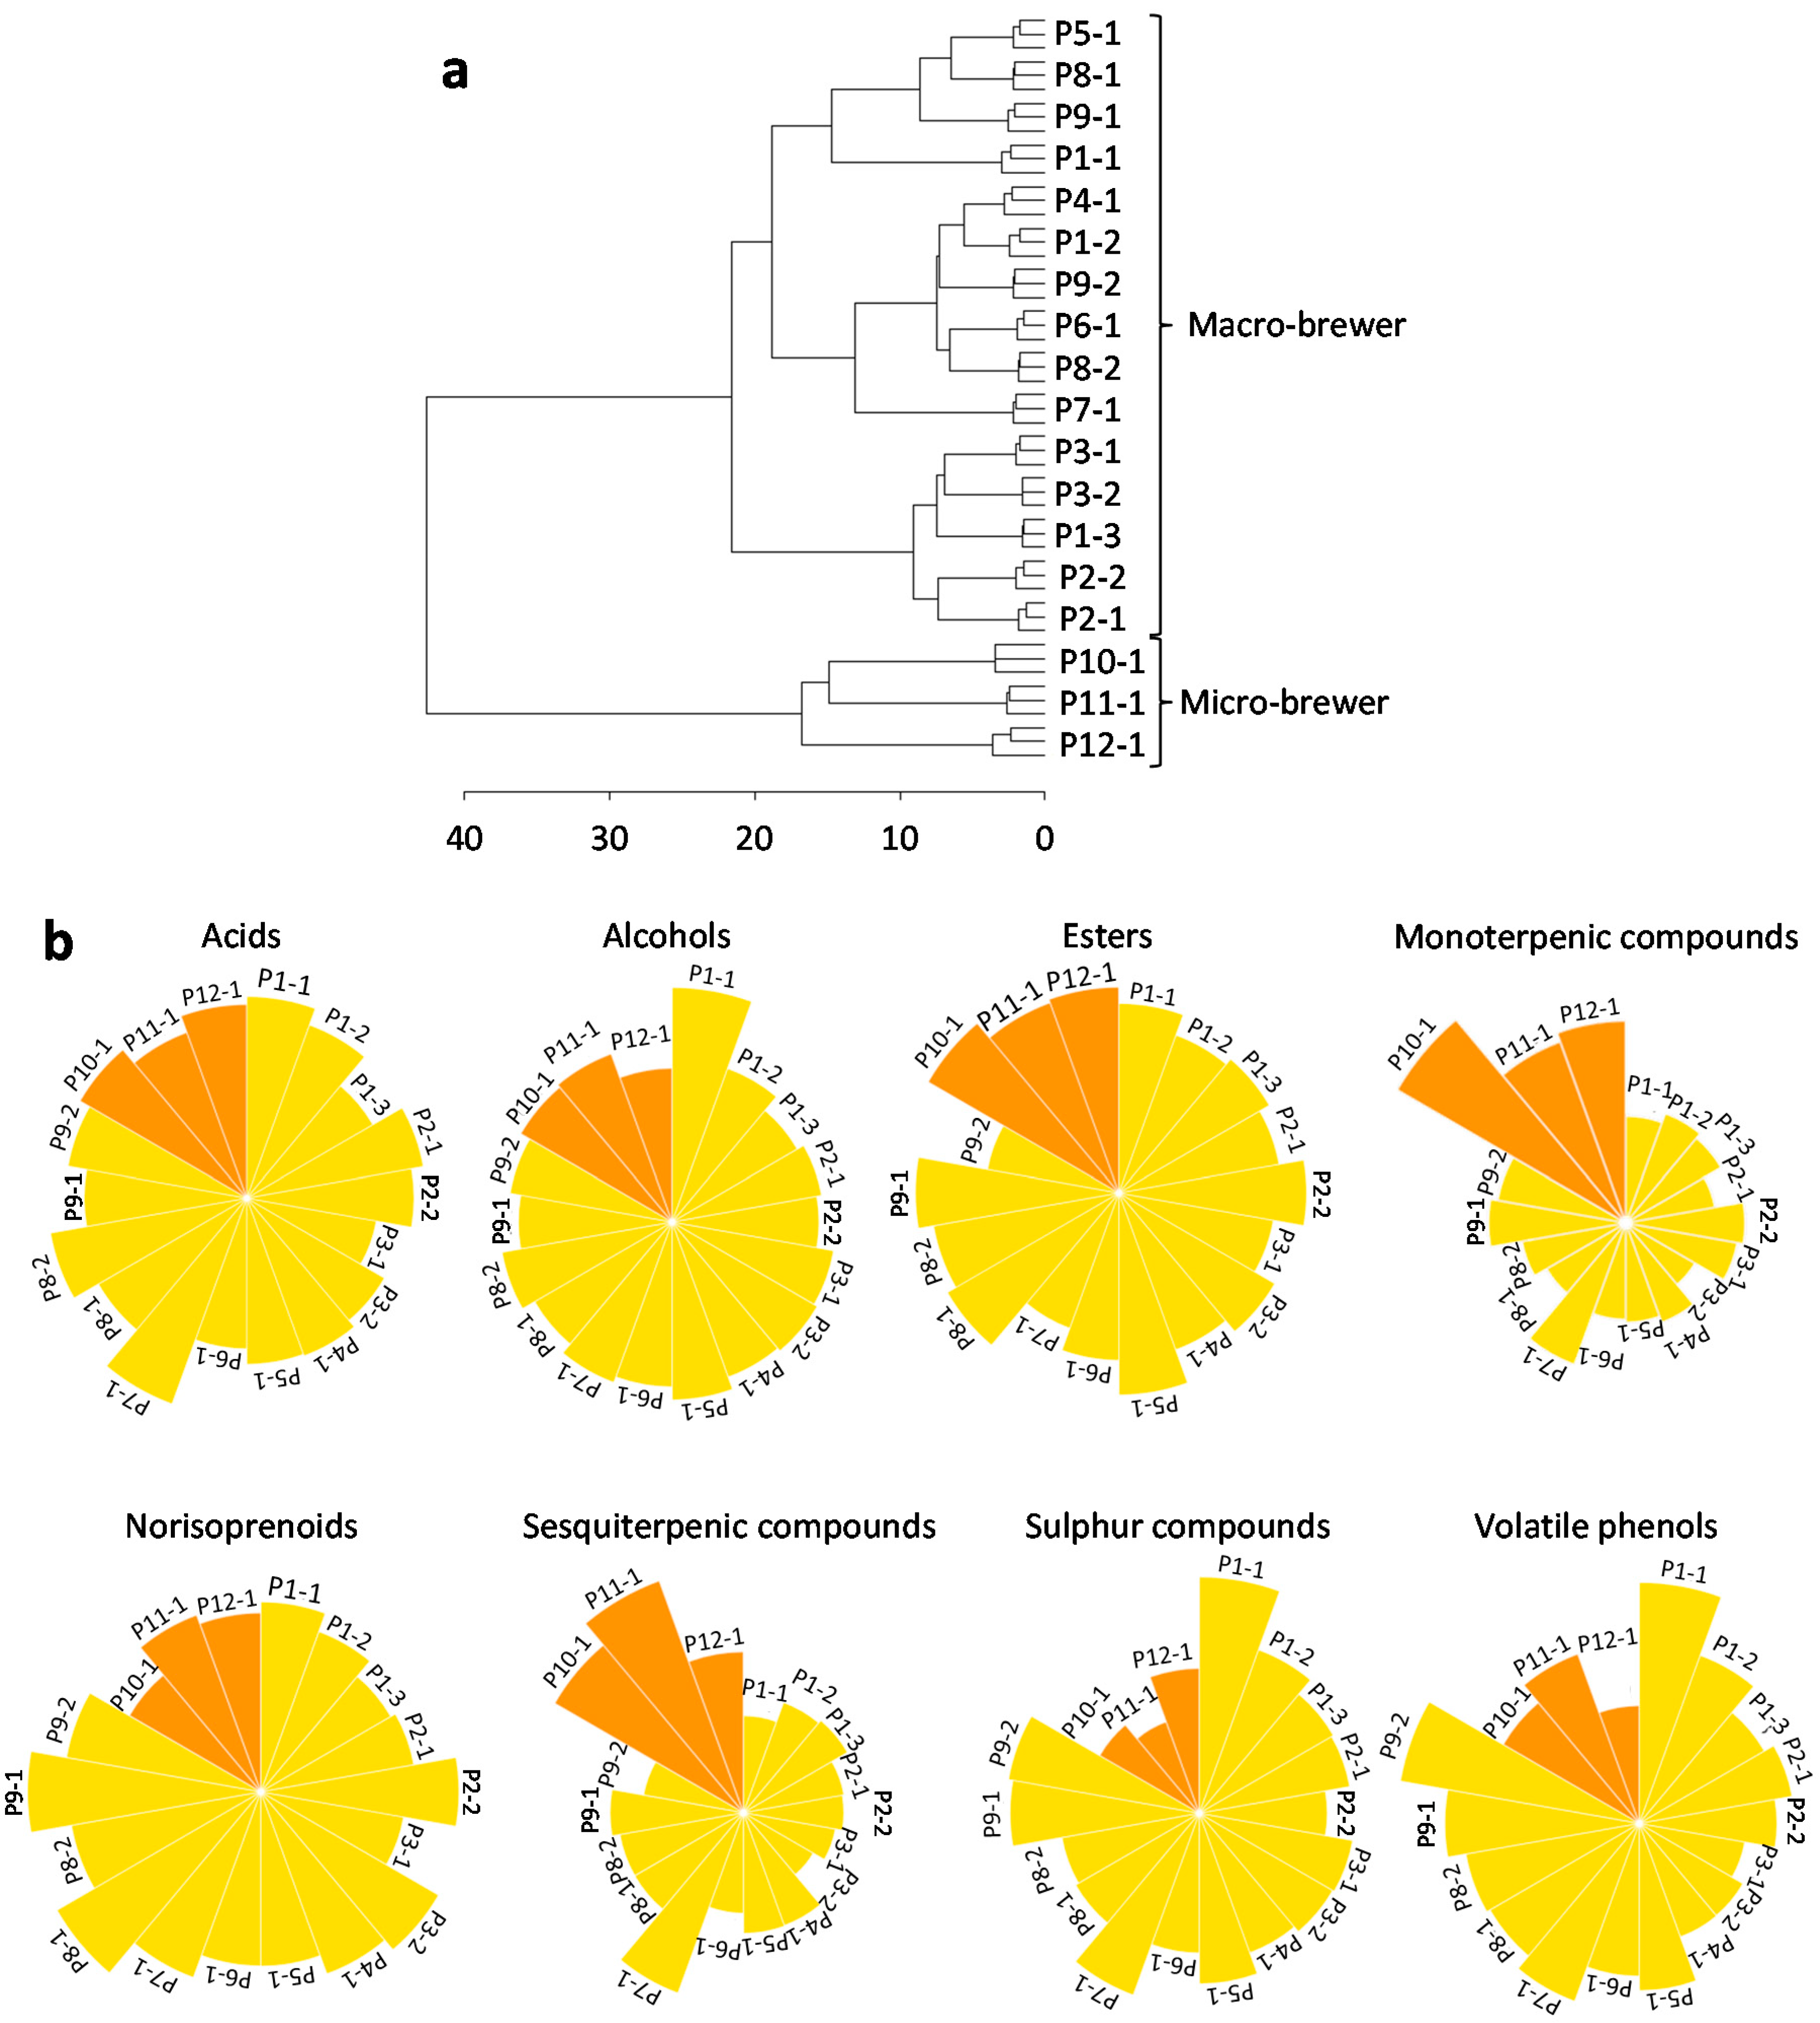
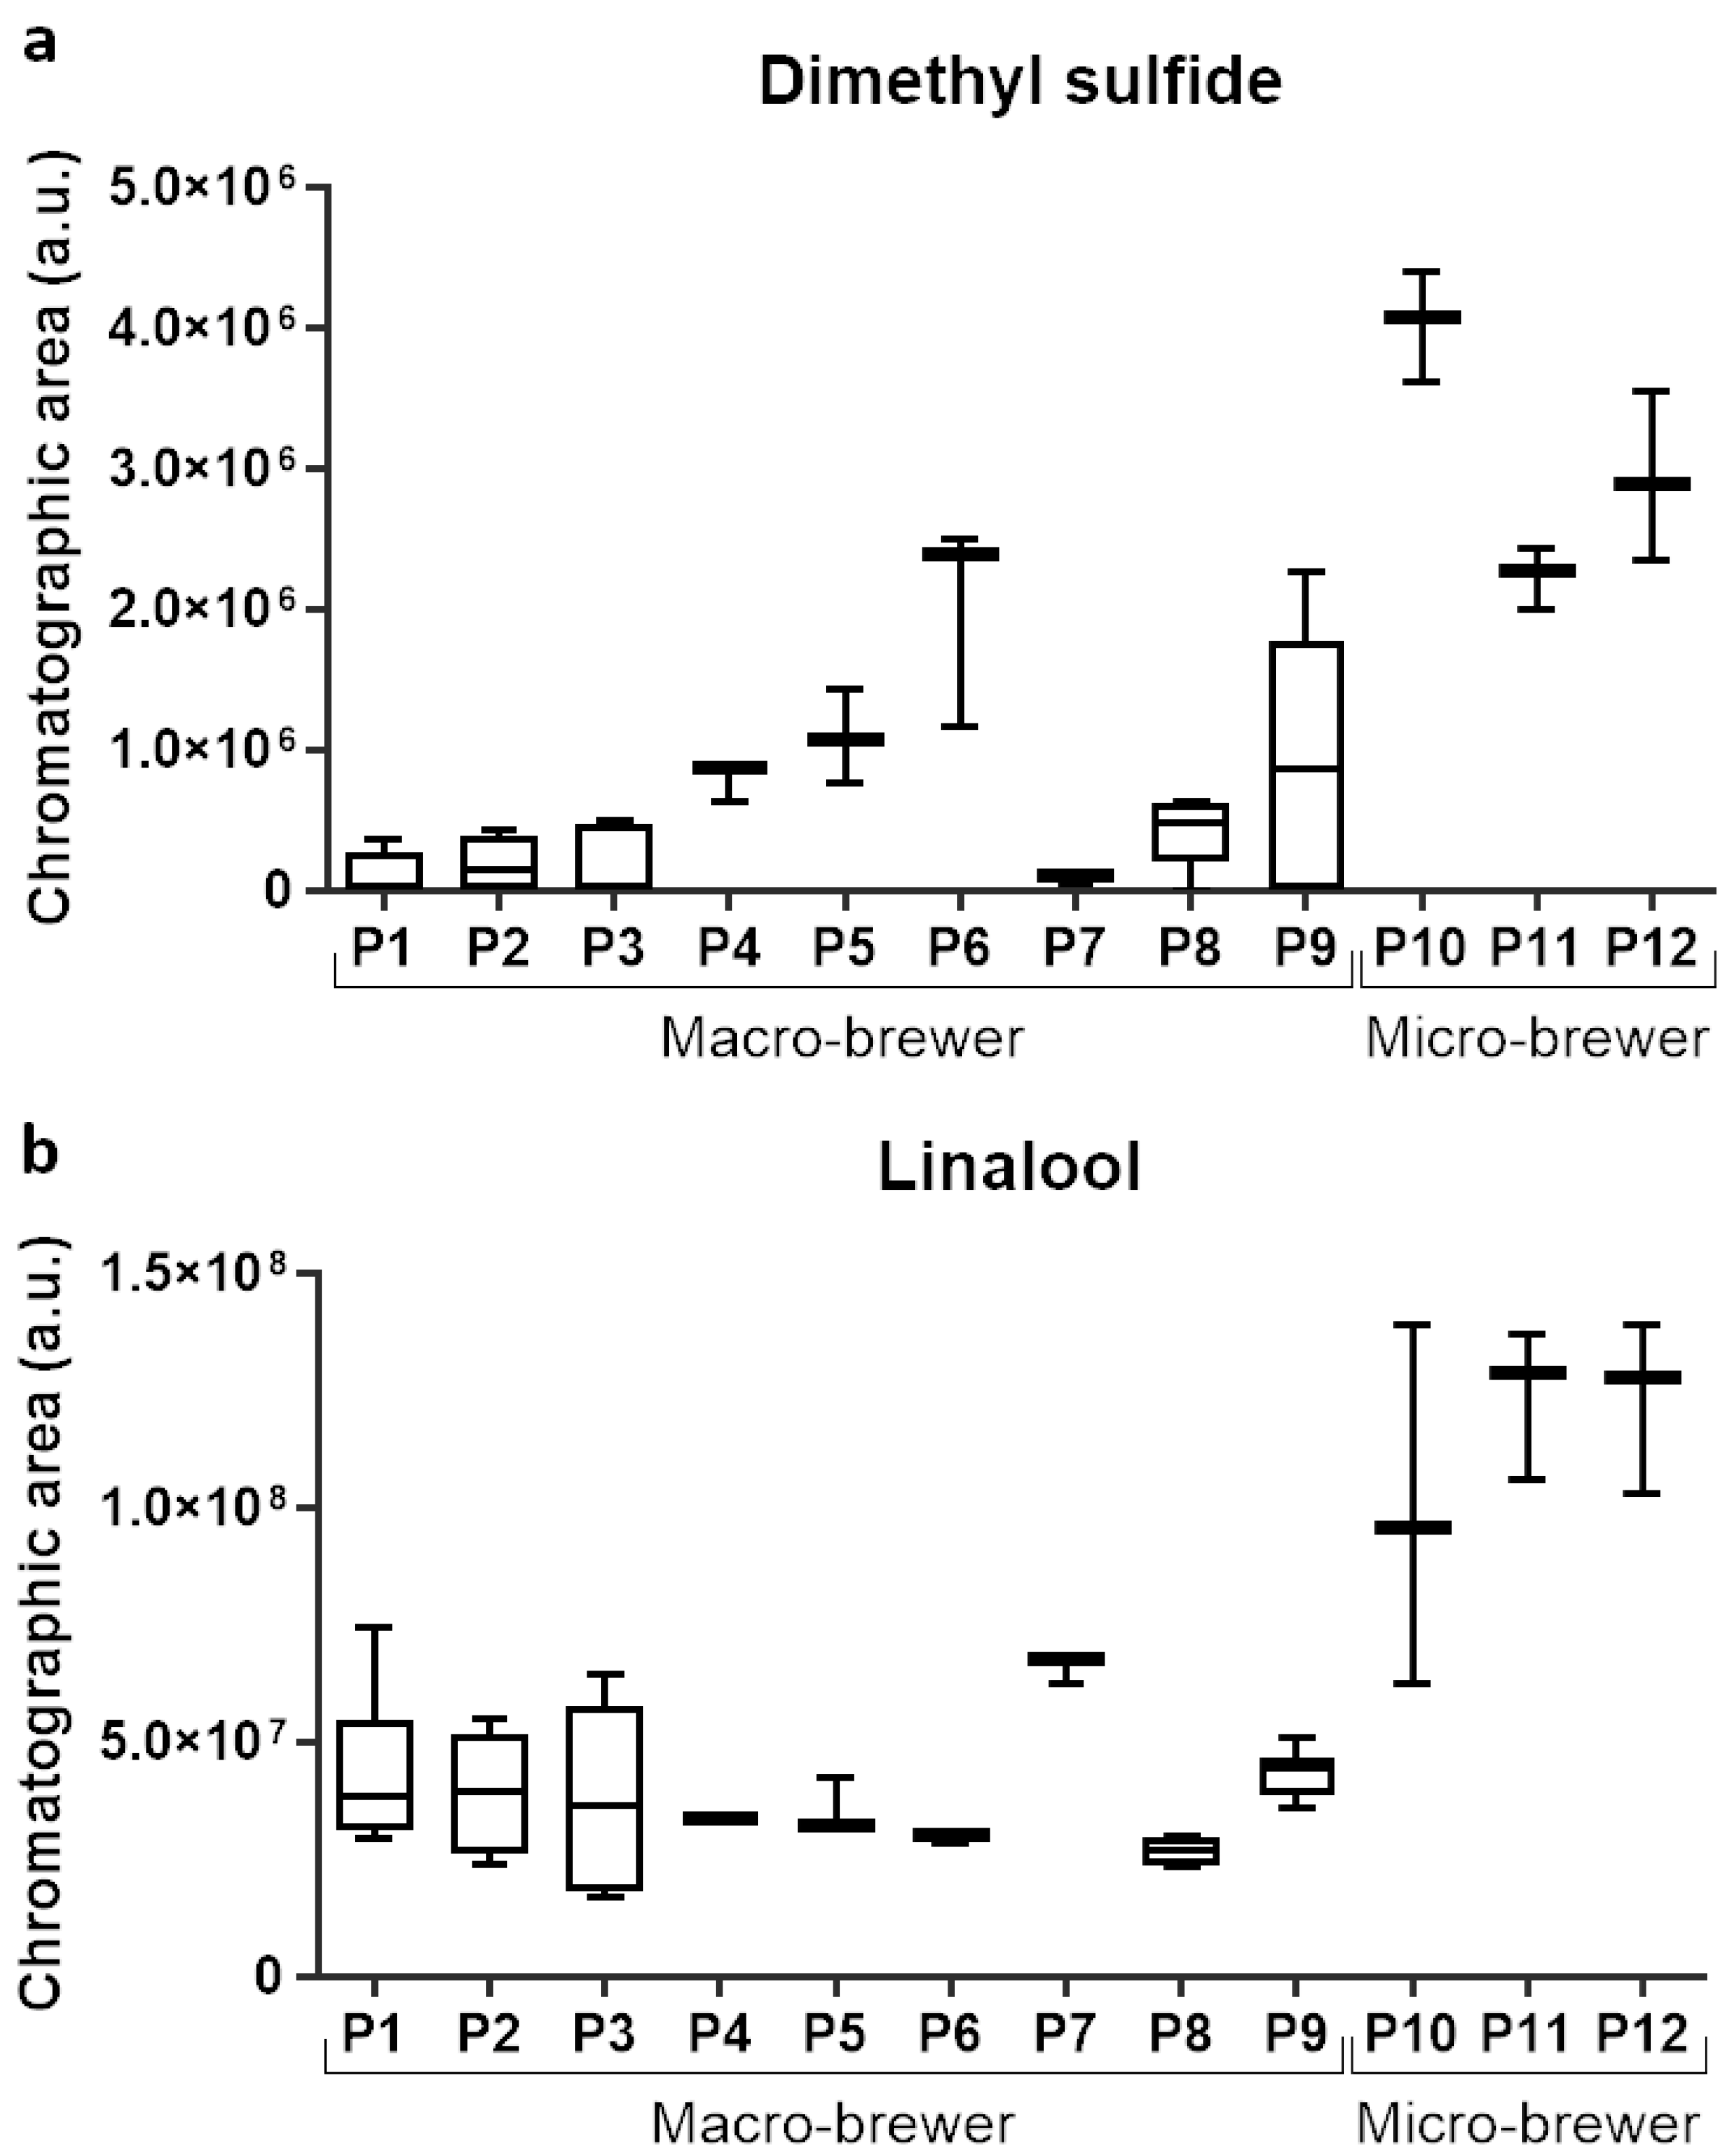
3.3. Lager Beer Typing
4. Conclusions
Supplementary Materials
Author Contributions
Funding
Conflicts of Interest
References
- World Health Organization. Global Status Report on Alcohol and Health 2018; Poznyak, V., Rekve, D., Eds.; World Health Organization: Geneva, Switzerland, 2018; ISBN 978-92-4-156563-9. [Google Scholar]
- The Economics of Beer; Swinnen, J.F.M. (Ed.) Oxford University Press: New York, NY, USA, 2011; ISBN 978-0-19-969380-1. [Google Scholar]
- Gonçalves, J.L.; Figueira, J.A.; Rodrigues, F.P.; Ornelas, L.P.; Branco, R.N.; Silva, C.L.; Câmara, J.S. A powerful methodological approach combining headspace solid phase microextraction, mass spectrometry and multivariate analysis for profiling the volatile metabolomic pattern of beer starting raw materials. Food Chem. 2014, 160, 266–280. [Google Scholar] [CrossRef]
- Alves, Z.; Melo, A.; Figueiredo, A.R.; Coimbra, M.A.; Gomes, A.C.; Rocha, S.M. Exploring the Saccharomyces cerevisiae volatile metabolome: Indigenous versus commercial strains. PLoS ONE 2015, 10, e0143641. [Google Scholar] [CrossRef] [Green Version]
- Lodolo, E.J.; Kock, J.L.F.; Axcell, B.C.; Brooks, M. The yeast Saccharomyces cerevisiae—The main character in beer brewing. FEMS Yeast Res. 2008, 8, 1018–1036. [Google Scholar] [CrossRef] [Green Version]
- Hoff, S.; Lund, M.N.; Petersen, M.A.; Jespersen, B.M.; Andersen, M.L. Quality of pilsner malt and roasted malt during storage. J. Inst. Brew. 2014, 120, 331–340. [Google Scholar] [CrossRef]
- Almaguer, C.; Schönberger, C.; Gastl, M.; Arendt, E.K.; Becker, T. Humulus lupulus—A story that begs to be told. A review. J. Inst. Brew. 2014, 120, 289–314. [Google Scholar] [CrossRef]
- Vanderhaegen, B.; Neven, H.; Verachtert, H.; Derdelinckx, G. The chemistry of beer aging—A critical review. Food Chem. 2006, 95, 357–381. [Google Scholar] [CrossRef]
- Boulton, C. Encyclopaedia of Brewing; Wiley-Blackwell: West Sussex, UK, 2013; ISBN 9781118598115. [Google Scholar]
- Kanehisa, M.; Sato, Y.; Kawashima, M.; Furumichi, M.; Tanabe, M. KEGG as a reference resource for gene and protein annotation. Nucleic Acids Res. 2016, 44, D457–D462. [Google Scholar] [CrossRef] [Green Version]
- Cuadros-Rodríguez, L.; Ruiz-Samblás, C.; Valverde-Som, L.; Péez-Castaño, E.; González-Casado, A. Chromatographic fingerprinting: An innovative approach for food “identitation” and food authentication—A tutorial. Anal. Chim. Acta 2016, 909, 9–23. [Google Scholar] [CrossRef]
- Putignani, L.; Dallapiccola, B. Foodomics as part of the host-microbiota-exposome interplay. J. Proteom. 2016, 147, 3–20. [Google Scholar] [CrossRef]
- Andrés-Iglesias, C.; Blanco, C.A.; Blanco, J.; Montero, O. Mass spectrometry-based metabolomics approach to determine differential metabolites between regular and non-alcohol beers. Food Chem. 2014, 157, 205–212. [Google Scholar] [CrossRef]
- Stefanuto, P.-H.; Perrault, K.A.; Dubois, L.M.; L’Homme, B.; Allen, C.; Loughnane, C.; Ochiai, N.; Focant, J.-F. Advanced method optimization for volatile aroma profiling of beer using two-dimensional gas chromatography time-of-flight mass spectrometry. J. Chromatogr. A 2017, 1507, 45–52. [Google Scholar] [CrossRef] [PubMed]
- Lachenmeier, D.W.; Frank, W.; Humpfer, E.; Schäfer, H.; Keller, S.; Mörtter, M.; Spraul, M. Quality control of beer using high-resolution nuclear magnetic resonance spectroscopy and multivariate analysis. Eur. Food Res. Technol. 2005, 220, 215–221. [Google Scholar] [CrossRef]
- Romero-Medina, A.; Estarrón-Espinosa, M.; Verde-Calvo, J.R.; Lelièvre-Desmas, M.; Escalona-Buendía, H.B. Renewing traditions: A sensory and chemical characterisation of mexican pigmented corn beers. Foods 2020, 9, 886. [Google Scholar] [CrossRef] [PubMed]
- Inui, T.; Tsuchiya, F.; Ishimaru, M.; Oka, K.; Komura, H. Different beers with different hops. Relevant compounds for their aroma characteristics. J. Agric. Food Chem. 2013, 61, 4758–4764. [Google Scholar] [CrossRef]
- Pope, G.A.; Mackenzie, D.A.; Defernez, M.; Aroso, M.A.M.M.; Fuller, L.J.; Mellon, F.A.; Dunn, W.B.; Brown, M.; Goodacre, R.; Kell, D.B.; et al. Metabolic footprinting as a tool for discriminating between brewing yeasts. Yeast 2007, 24, 667–679. [Google Scholar] [CrossRef]
- Krogerus, K.; Magalhães, F.; Vidgren, V.; Gibson, B. New lager yeast strains generated by interspecific hybridization. J. Ind. Microbiol. Biotechnol. 2015, 42, 769–778. [Google Scholar] [CrossRef] [Green Version]
- Callejo, M.J.; García Navas, J.J.; Alba, R.; Escott, C.; Loira, I.; González, M.C.; Morata, A. Wort fermentation and beer conditioning with selected non-Saccharomyces yeasts in craft beers. Eur. Food Res. Technol. 2019, 245, 1229–1238. [Google Scholar] [CrossRef]
- Paiva, A.C.; Oliveira, D.S.; Hantao, L.W. A bottom-up approach for data mining in bioaromatization of beers using flow-modulated comprehensive two-dimensional gas chromatography/mass spectrometry. Separations 2019, 6, 46. [Google Scholar] [CrossRef] [Green Version]
- Spevacek, A.R.; Benson, K.H.; Bamforth, C.W.; Slupsky, C.M. Beer metabolomics: Molecular details of the brewing process and the differential effects of late and dry hopping on yeast purine metabolism. J. Inst. Brew. 2016, 122, 21–28. [Google Scholar] [CrossRef] [Green Version]
- Alves, V.; Gonçalves, J.; Figueira, J.A.; Ornelas, L.P.; Branco, R.N.; Câmara, J.S.; Pereira, J.A.M. Beer volatile fingerprinting at different brewing steps. Food Chem. 2020, 326, 126856. [Google Scholar] [CrossRef]
- Heuberger, A.L.; Broeckling, C.D.; Lewis, M.R.; Salazar, L.; Bouckaert, P.; Prenni, J.E. Metabolomic profiling of beer reveals effect of temperature on non-volatile small molecules during short-term storage. Food Chem. 2012, 135, 1284–1289. [Google Scholar] [CrossRef]
- Hughey, C.A.; McMinn, C.M.; Phung, J. Beeromics: From quality control to identification of differentially expressed compounds in beer. Metabolomics 2016, 12, 1–13. [Google Scholar] [CrossRef]
- Andrés-Iglesias, C.; Blanco, C.A.; García-Serna, J.; Pando, V.; Montero, O. Volatile compound profiling in commercial lager regular beers and derived alcohol-free beers after dealcoholization by vacuum distillation. Food Anal. Methods 2016, 9, 3230–3241. [Google Scholar] [CrossRef]
- Martins, C.; Brandão, T.; Almeida, A.; Rocha, S.M. Insights on beer volatile profile: Optimization of solid-phase microextraction procedure taking advantage of the comprehensive two-dimensional gas chromatography structured separation. J. Sep. Sci. 2015, 38, 2140–2148. [Google Scholar] [CrossRef]
- Martins, C.; Brandão, T.; Almeida, A.; Rocha, S.M. Unveiling the lager beer volatile terpenic compounds. Food Res. Int. 2018, 114, 199–207. [Google Scholar] [CrossRef]
- Sumner, L.; Amberg, A.; Barret, D.; Beale, M.; Beger, R.; Daykin, C.; Fan, T.W.-M.; Fiehn, O.; Goodacre, R.; Griffin, J.L.; et al. Proposed minimum reporting standards for chemical analysis. Metabolomics 2007, 3, 211–221. [Google Scholar] [CrossRef] [Green Version]
- Van Den Dool, H.; Kratz, D.J.A. Generalization of the retention index system including linear temperature programmed gas—Liquid partition chromatography. J. Chromatogr. A 1963, 11, 463–471. [Google Scholar] [CrossRef]
- Xia, J.; Sinelnikov, I.V.; Han, B.; Wishart, D.S. MetaboAnalyst 3.0- making metabolomics more meaningful. Nucleic Acids Res. 2015, 43, W251–W257. [Google Scholar] [CrossRef] [Green Version]
- U.S. Department of Health and Human Services; Food and Drug Administration; Center for Drug Evaluation and Researc; Center for Veterinary Medicin. Guidance for Industry: Bioanalytical Method Validation. Draft Guidance. Available online: http://www.fda.gov/downloads/drugs/guidancecomplianceregulatoryinformation/guidances/ucm368107 (accessed on 27 June 2019).
- Kim, S.; Kim, J.; Yun, E.J.; Kim, K.H. Food metabolomics: From farm to human. Curr. Opin. Biotechnol. 2016, 37, 16–23. [Google Scholar] [CrossRef]
- Cordente, A.G.; Curtin, C.D.; Varela, C.; Pretorius, I.S. Flavour-active wine yeasts. Appl. Microbiol. Biotechnol. 2012, 96, 601–618. [Google Scholar] [CrossRef] [Green Version]
- Hazelwood, L.A.; Daran, J.M.; van Maris, A.J.A.; Pronk, J.T.; Dickinson, J.R. The Ehrlich pathway for fusel alcohol production: A century of research on Saccharomyces cerevisiae metabolism. Appl. Environ. Microbiol. 2008, 74, 2259–2266. [Google Scholar] [CrossRef] [Green Version]
- Rodríguez-Bustamante, E.; Sánchez, S. Microbial production of C13-norisoprenoids and other aroma compounds via carotenoid cleavage. Crit. Rev. Microbiol. 2007, 33, 211–230. [Google Scholar] [CrossRef]
- Chemler, J.A.; Yan, Y.; Koffas, M.A.G. Biosynthesis of isoprenoids, polyunsaturated fatty acids and flavonoids in Saccharomyces cerevisiae. Microb. Cell Fact. 2006, 5, 20. [Google Scholar] [CrossRef] [Green Version]
- Siddiqui, M.S.; Thodey, K.; Trenchard, I.; Smolke, C.D. Advancing secondary metabolite biosynthesis in yeast with synthetic biology tools. FEMS Yeast Res. 2012, 12, 144–170. [Google Scholar] [CrossRef]
- Takoi, K.; Koie, K.; Itoga, Y.; Katayama, Y.; Shimase, M.; Nakayama, Y.; Watari, J. Biotransformation of hop-derived monoterpene alcohols by lager yeast and their contribution to the flavor of hopped beer. J. Agric. Food Chem. 2010, 58, 5050–5058. [Google Scholar] [CrossRef]
- Lambrechts, M.G.; Pretorius, I.S. Yeast and its importance to wine aroma. S. Afr. J. Enol. Vitic. 2000, 21, 97–129. [Google Scholar] [CrossRef] [Green Version]
- King, A.J.; Dickinson, J.R. Biotransformation of hop aroma terpenoids by ale and lager yeasts. FEMS Yeast Res. 2003, 3, 53–62. [Google Scholar] [CrossRef]
- Dresel, M.; Praet, T.; Van Opstaele, F.; Van Holle, A.; Naudts, D.; De Keukeleire, D.; De Cooman, L.; Aerts, G. Comparison of the analytical profiles of volatiles in single-hopped worts and beers as a function of the hop variety. Brew. Sci. 2015, 68, 8–28. [Google Scholar]
- Tsuji, H.; Mizuno, A. Volatile compounds and the changes in their concentration levels during storage in beers containing varying malt concentrations. J. Food Sci. 2010, 75, C79–C84. [Google Scholar] [CrossRef]
- Castro, L.F.; Ross, C.F.; Vixie, K.R. Optimization of a solid phase dynamic extraction (SPDE) method for beer volatile profiling. Food Anal. Methods 2015, 8, 2115–2124. [Google Scholar] [CrossRef]
- Giannetti, V.; Boccacci Mariani, M.; Torrelli, P.; Marini, F. Flavour component analysis by HS-SPME/GC–MS and chemometric modeling to characterize Pilsner-style Lager craft beers. Microchem. J. 2019, 149, 103991. [Google Scholar] [CrossRef]
- Riu-Aumatell, M.; Miró, P.; Serra-Cayuela, A.; Buxaderas, S.; López-Tamames, E. Assessment of the aroma profiles of low-alcohol beers using HS-SPME–GC-MS. Food Res. Int. 2014, 57, 196–202. [Google Scholar] [CrossRef]
- Rendall, R.; Reis, M.S.; Pereira, A.C.; Pestana, C.; Pereira, V.; Marques, J.C. Chemometric analysis of the volatile fraction evolution of Portuguese beer under shelf storage conditions. Chemom. Intell. Lab. Syst. 2015, 142, 131–142. [Google Scholar] [CrossRef]
- Harayama, K.; Hayase, F.; Kato, H. New method for analyzing the volatiles in beer. Biosci. Biotechnol. Biochem. J. 1994, 58, 2246–2247. [Google Scholar] [CrossRef]
- Ruvalcaba, J.E.; Durán-Guerrero, E.; Barroso, C.G.; Castro, R. Development of head space sorptive extraction method for the determination of volatile compounds in beer and comparison with stir bar sorptive extraction. Foods 2020, 9, 255. [Google Scholar] [CrossRef] [Green Version]
- Rodriguez-Bencomo, J.J.; Muñoz-González, C.; Martín-Álvarez, P.J.; Lázaro, E.; Mancebo, R.; Castañé, X.; Pozo-Bayón, M.A. Optimization of a HS-SPME-GC-MS procedure for beer volatile profiling using response surface methodology: Application to follow aroma stability of beers under different storage conditions. Food Anal. Methods 2012, 5, 1386–1397. [Google Scholar] [CrossRef] [Green Version]
- Fritsch, H.T.; Schieberle, P. Identification based on quantitative measurements and aroma recombination of the character impact odorants in a Bavarian Pilsner-type beer. J. Agric. Food Chem. 2005, 53, 7544–7551. [Google Scholar] [CrossRef]
- Vera, L.; Aceña, L.; Guasch, J.; Boqué, R.; Mestres, M.; Busto, O. Characterization and classification of the aroma of beer samples by means of an MS e-nose and chemometric tools. Anal. Bioanal. Chem. 2011, 399, 2073–2081. [Google Scholar] [CrossRef]
- Rossi, S.; Sileoni, V.; Perretti, G.; Marconi, O. Characterization of the volatile profiles of beer using headspace solid-phase microextraction and gas chromatography-mass spectrometry. J. Sci. Food Agric. 2014, 94, 919–928. [Google Scholar] [CrossRef]
- Castro, L.F.; Ross, C.F. Determination of flavour compounds in beer using stir-bar sorptive extraction and solid-phase microextraction. J. Inst. Brew. 2015, 121, 197–203. [Google Scholar] [CrossRef]
- Brányik, T.; Vicente, A.A.; Dostálek, P.; Teixeira, J.A. A review of flavour formation in continuous beer fermentations. J. Inst. Brew. 2008, 114, 3–13. [Google Scholar] [CrossRef] [Green Version]
- Pires, E.J.; Teixeira, J.A.; Brányik, T.; Vicente, A.A. Yeast: The soul of beer’s aroma—A review of flavour-active esters and higher alcohols produced by the brewing yeast. Appl. Microbiol. Biotechnol. 2014, 98, 1937–1949. [Google Scholar] [CrossRef] [Green Version]
- Meilgaard, M.C.; Dalgliesh, C.E.; Clapperton, J.F. Beer flavour terminology. J. Inst. Brew. 1979, 85, 38–42. [Google Scholar] [CrossRef]
- Eßlinger, H.M. (Ed.) Handbook of Brewing; John Wiley & Sons: Hoboken, NJ, USA, 2009; ISBN 978-3-527-31674-8. [Google Scholar]
- Preedy, V.R. (Ed.) Beer in Health and Disease Prevention; Elsevier Inc.: Burlington, MA, USA, 2009; ISBN 978-0-12-373891-2. [Google Scholar]


| Sample | Category of Beer | Composition | Alcohol Content (%) | Shelf-Life at Analysis (Months) | Country of Production | |||
|---|---|---|---|---|---|---|---|---|
| Malt | Unmalted Cereals | Hops | Others | |||||
| P1-1 | Macrobrewer | Barley | Corn and barley | Extract | Glucose syrup | 5.2 | 3 | Portugal |
| P1-2 | Macrobrewer | Barley | Corn and barley | Extract | Glucose syrup | 5.2 | 5 | Portugal |
| P1-3 | Macrobrewer | Barley | Corn and barley | Extract | Glucose syrup | 5.2 | 2 | Portugal |
| P2-1 | Macrobrewer | Barley | Maize or rice and barley | Extract | – | 5.0 | 10 | Portugal |
| P2-2 | Macrobrewer | Barley | Maize or rice and barley | Extract | – | 5.0 | 8 | Portugal |
| P3-1 | Macrobrewer | Barley | – | Extract | – | 5.0 | 8 | France |
| P3-2 | Macrobrewer | Barley | – | Extract | – | 5.0 | 5 | France |
| P4-1 | Macrobrewer | Barley | Maize and barley | Extract | E150c and E450 | 4.8 | 7 | Portugal |
| P5-1 | Macrobrewer | Barley | Corn and barley | Extract | – | 5.1 | 3 | Portugal |
| P6-1 | Macrobrewer | Barley | Corn and barley | Extract | E150c and E405 | 5.0 | 1 | Portugal |
| P7-1 | Macrobrewer | Barley | Maize or rice and barley | Extract | – | 4.2 | 9 | Portugal |
| P8-1 | Macrobrewer | Barley | Corn and barley | Extract | E150c and E405 | 5.0 | 3 | Spain |
| P8-2 | Macrobrewer | Barley | Corn and barley | Extract | E150c and E405 | 5.0 | 3 | Spain |
| P9-1 | Macrobrewer | Barley | – | Extract | – | 5.0 | 6 | Germany |
| P9-2 | Macrobrewer | Barley | – | Extract | – | 5.0 | 5 | Germany |
| P10-1 | Microbrewer (fresh) | Barley | – | Pellet | – | 5.0 | 6 | Portugal |
| P11-1 | Microbrewer (fresh) | Barley | – | Pellet | – | 5.5 | 4 | Portugal |
| P12-1 | Microbrewer (pasteurized) | Barley | – | Pellet | – | 5.1 | 10 | Portugal |
| 1tR (s) a | 2tR (s) a | Compound | CAS Number | MSI Level b | RI Calc.c | RI Lit d | Previously Reported on Lager Beer |
|---|---|---|---|---|---|---|---|
| Monoterpenic compounds | |||||||
| 606 | 0.91 | Linalool | 78-70-6 | 1 | 1101 | 1101 | [28,42,43,44,45] |
| 624 | 0.97 | Fenchol | 1632-73-1 | 2 | 1113 | 1118 | [28,45,46] |
| 636 | 1.02 | Myrcenol | 543-39-5 | 2 | 1122 | 1103 | [28,47] |
| 696 | 1.15 | Borneol | 507-70-0 | 1 | 1163 | 1166 | [28,46] |
| 708 | 0.95 | Menthol | 1490-04-6 | 1 | 1172 | 1174 | [28] |
| 714 | 0.86 | (−)-Terpinen-4-ol | 20126-76-5 | 1 | 1176 | 1180 | [28,45,48] |
| 732 | 1.04 | α-Terpineol | 98-55-5 | 1 | 1192 | 1195 | [28,42] |
| 774 | 1.22 | 7-Methyl-3-methylene-6-octen-1-ol | 13066-51-8 | 2 | 1219 | 1222 | [28] |
| 792 | 1.09 | (+)-β-Citronellol | 106-22-9 | 1 | 1233 | 1234 | [28,42,43,45,47] |
| 792 | 1.22 | Nerol | 106-25-2 | 1 | 1233 | 1237 | [28] |
| 864 | 0.65 | Bornyl acetate | 76-49-3 | 2 | 1287 | 1288 | [28] |
| 912 | 0.74 | Methyl geraniate (isomer) | 2349-14-6 | 1 | 1323 | 1324 | [28,47] |
| 948 | 0.65 | Citronellol acetate | 150-84-5 | 2 | 1353 | 1354 | [28,47] |
| 966 | 0.70 | Neryl acetate | 141-12-8 | 2 | 1364 | 1362 | [28,42] |
| 444 | 0.49 | β-Myrcene | 123-35-3 | 1 | 988 | 988 | [28,42,43,45,47] |
| 582 | 0.67 | Fenchone | 7787-20-4 | 2 | 1084 | 1093 | [28] |
| 666 | 0.79 | (1R)-(+)-Camphor | 464-49-3 | 1 | 1142 | 1147 | √ [28] |
| 810 | 0.91 | p-Menth-4-en-3-one | 5113-66-6 | 2 | 1246 | 1251 | √ [28] |
| 618 | 0.58 | Rose oxide (isomer) | 16409-43-1 | 1 | 1109 | 1114 | √ [28,46] |
| 720 | 0.54 | m/z 91, 119, 39, 100 | – | 3 | 1180 | – | √ [28] |
| Sesquiterpenic compounds | |||||||
| 1206 | 0.76 | Nerolidol | 7212-44-4 | 1 | 1571 | 1573 | [28,43,47,49] |
| 1212 | 0.79 | Caryophyllenyl alcohol | – | 2 | 1577 | 1569 | [28,43,45] |
| 1242 | 0.82 | m/z 43, 67, 82, 41 | – | 3 | 1610 | – | [28] |
| 1260 | 0.68 | Cubenol | 21284-22-0 | 2 | 1634 | 1643 | [28] |
| 1272 | 0.75 | τ-Cadinol | 5937-11-1 | 2 | 1651 | 1651 | [28,42] |
| 1080 | 0.57 | α-Caryophyllene (α-Humulene) | 6753-98-6 | 1 | 1456 | 1456 | [28,42,45] |
| 1104 | 0.56 | γ-Gurjunene | 22567-17-5 | 2 | 1476 | 1472 | [28] |
| 1164 | 0.57 | δ-Cadinene | 483-76-1 | 2 | 1530 | 1524 | [28,42,45] |
| 1164 | 0.65 | Calamenene | 72937-55-4 | 2 | 1530 | 1528 | [28,42] |
| 1266 | 0.93 | m/z 41, 67, 91, 39 | – | 3 | 1643 | – | [28] |
| 1164 | 0.78 | m/z 91, 43, 41, 79 | – | 3 | 1530 | – | [28] |
| 1236 | 0.70 | m/z 93, 43, 41, 80 | – | 3 | 1601 | – | [28] |
| 1308 | 0.65 | m/z 43, 135, 41, 91 | – | 3 | 1701 | – | [28] |
| 1392 | 0.60 | m/z 69, 41, 43, 55 | – | 3 | 1851 | – | [28] |
| Norisoprenoids | |||||||
| 504 | 0.63 | 2,2,6-Trimethylcyclo-hexanone | 2408-37-9 | 2 | 1034 | 1051 | – |
| 744 | 0.91 | Safranal | 116-26-7 | 2 | 1197 | 1201 | – |
| 774 | 0.82 | β-Cyclocitral | 432-25-7 | 2 | 1219 | 1225 | – |
| 852 | 0.59 | Vitispirane | 65416-59-3 | 2 | 1278 | 1289 | – |
| 900 | 0.64 | Edulan I | 41678-29-9 | 2 | 1314 | 1314 | – |
| 960 | 0.78 | β-Damascenone (isomer) | 23726-93-4 | 2 | 1360 | 1383 | [43,45,46,47,49,50,51] |
| 990 | 0.84 | β-Damascenone (isomer) | 23726-93-4 | 2 | 1383 | 1383 | [43,45,46,47,49,50,51] |
| 1074 | 0.77 | Geranyl acetone | 689-67-8 | 1 | 1451 | 1455 | [47] |
| 1110 | 0.72 | α-Isomethyl ionone | 127-51-5 | 2 | 1481 | 1487 | – |
| Esters | |||||||
| Aliphatics | |||||||
| 96 | 0.44 | Ethyl acetate | 141-78-6 | 2 | 611 | 611 | [23,42,46,47,50,52,53] |
| 138 | 0.45 | Ethyl propanoate | 105-37-3 | 1 | 685 | 696 | [50] |
| 174 | 0.43 | Ethyl 2-methylpropanoate | 97-62-1 | 2 | 748 | 751 | [51] |
| 186 | 0.48 | 2-Methylpropyl acetate | 110-19-0 | 2 | 769 | 769 | [42,43,45,47,50,52,53] |
| 210 | 0.50 | Ethyl butanoate | 105-54-4 | 1 | 806 | 806 | [23,42,43,45,46,47,49,50,51,52,53] |
| 222 | 0.52 | Butyl acetate | 123-86-4 | 2 | 816 | 819 | [53] |
| 222 | 1.24 | Ethyl 2-hydroxypropanoate | 97-64-3 | 2 | 817 | 819 | [48] |
| 258 | 0.48 | Ethyl 2-methylbutanoate | 7452-79-1 | 1 | 848 | 851 | [52,53] |
| 264 | 0.49 | Ethyl 3-methylbutanoate | 108-64-5 | 2 | 853 | 857 | [43,49] |
| 294 | 0.62 | 2/3-Methylbutyl acetate | 123-92-2 | 2 | 879 | 877 | [23,42,43,45,46,47,49,50,52,53] |
| 324 | 0.53 | Ethyl pentanoate | 539-82-2 | 2 | 905 | 906 | [47,49,51] |
| 342 | 0.57 | Pentyl acetate | 628-63-7 | 2 | 917 | 916 | [54] |
| 342 | 0.66 | C7 ester (m/z 43, 95, 97, 42) | - | 3 | 917 | - | – |
| 372 | 0.64 | Ethyl (E)-2-methyl-2-butenoate | 5837-78-5 | 2 | 938 | 943 | – |
| 408 | 0.54 | Ethyl 4-methylpentanoate | 25415-67-2 | 2 | 963 | 967 | [51] |
| 414 | 0.52 | Pentyl propanate | 624-54-4 | 2 | 967 | 969 | [54] |
| 432 | 0.57 | C8 ester (m/z 43, 69, 56, 61) | - | 3 | 980 | - | – |
| 456 | 0.57 | Ethyl hexanoate | 123-66-0 | 1 | 996 | 996 | [23,42,43,45,46,47,48,49,50,51,52,53] |
| 480 | 0.59 | Hexyl acetate | 142-92-7 | 1 | 1013 | 1006 | [23,43,45,46,47,48,49,50,53] |
| 522 | 0.65 | Ethyl 2-hexenoate | 1552-67-6 | 2 | 1042 | 1045 | – |
| 552 | 0.55 | Ethyl 5-methylhexanoate | 10236-10-9 | 2 | 1063 | 1072 | [45,47] |
| 570 | 0.58 | C9 ester (m/z 43, 56, 55, 41) | - | 3 | 1075 | - | – |
| 600 | 0.55 | Propyl hexanoate | 626-77-7 | 2 | 1096 | 1101 | – |
| 600 | 0.57 | Ethyl heptanoate | 106-30-9 | 1 | 1096 | 1095 | [23,43,45,48,50] |
| 624 | 0.59 | Heptyl acetate | 112-06-1 | 2 | 1113 | 1113 | [23,43,45,46,47,48,50] |
| 642 | 0.60 | Methyl octanoate | 111-11-5 | 2 | 1125 | 1130 | – |
| 660 | 0.55 | 2-Octyl acetate (m/z 43, 87, 41, 55) | 2051-50-5 | 3 | 1138 | - | – |
| 660 | 0.90 | C9 ester (m/z 57 85 41 59) | - | 3 | 1138 | - | – |
| 678 | 0.54 | 2-Methylpropyl hexanoate | 105-79-3 | 2 | 1150 | 1154 | – |
| 678 | 0.56 | 2-Ethylhexyl acetate | 103-09-3 | 2 | 1150 | 1159 | – |
| 744 | 0.59 | Ethyl octanoate | 106-32-1 | 1 | 1196 | 1196 | [23,43,45,46,47,49,50,51,52,53,54] |
| 762 | 0.60 | Octyl acetate | 112-14-1 | 2 | 1210 | 1211 | [23,43,45,47,49] |
| 876 | 0.58 | Ethyl nonanoate | 123-29-5 | 1 | 1296 | 1295 | [43,45,47] |
| 924 | 1.12 | C11 ester (m/z 71, 117, 43, 89) | - | 3 | 1333 | - | – |
| 948 | 1.03 | C11 ester (m/z 57, 71, 43, 41) | - | 3 | 1351 | - | – |
| 972 | 0.66 | C12 ester (m/z 57, 43, 67, 41) | - | 3 | 1369 | - | – |
| 978 | 0.93 | 3-Hydroxy-2,4,4-trimethylpentyl 2-methyl-propanoate | 74367-34-3 | 2 | 1373 | 1364 | [43] |
| 996 | 0.64 | Ethyl 9-decenoate | 67233-91-4 | 2 | 1387 | 1388 | [43,45,47,50] |
| 1008 | 0.58 | Ethyl decanoate | 110-38-3 | 1 | 1396 | 1396 | [23,42,43,45,46,48,49,50,52,53,54] |
| 1068 | 0.56 | 3-Methylbutyl octanoate | 2035-99-6 | 2 | 1446 | 1447 | [43] |
| 1164 | 0.62 | Methyl dodecanoate | 111-82-0 | 2 | 1530 | 1526 | – |
| 1176 | 1.03 | 3-Hydroxytridecanoate | 107141-15-1 | 2 | 1542 | 1539 | – |
| 1230 | 0.56 | Ethyl dodecanoate | 106-33-2 | 2 | 1595 | 1594 | [42,43,46,49,50,53] |
| 1236 | 0.56 | 1-(1,1-Dimethylethyl)-2-methyl-1,3-propanediyl 2-methyl-propanoate | 74381-40-1 | 2 | 1601 | 1607 | – |
| 1260 | 0.50 | 1-Methylethyl dodecanoate | 10233-13-3 | 2 | 1634 | 1632 | – |
| 1296 | 0.78 | Hexyl 2-hydroxybenzoate | 6259-76-3 | 2 | 1684 | 1678 | – |
| 1326 | 0.53 | Methyl tetradecanoate | 124-10-7 | 2 | 1731 | 1726 | – |
| 1368 | 0.54 | Ethyl tetradecanoate | 124-06-1 | 2 | 1801 | 1801 | [43] |
| 1374 | 0.66 | C16 ester (m/z 120, 73, 138, 121) | - | 3 | 1814 | - | – |
| 1380 | 0.50 | 1-Methylethyl tetradecanoate | 110-27-0 | 2 | 1826 | 1834 | – |
| Aromatics | |||||||
| 594 | 1.22 | Methyl benzoate | 93-58-3 | 2 | 1093 | 1096 | – |
| 702 | 1.07 | Ethyl benzoate | 93-89-0 | 2 | 1167 | 1172 | [43,49] |
| 714 | 1.35 | Methyl 2-phenylacetate | 101-41-7 | 2 | 1176 | 1179 | – |
| 714 | 1.46 | 2-Phenylethyl formate | 104-62-1 | 2 | 1176 | 1174 | – |
| 810 | 1.13 | Ethyl phenylacetate | 101-97-3 | 1 | 1246 | 1248 | [43,45,47] |
| 828 | 1.15 | 2-Phenylethyl acetate | 103-45-7 | 2 | 1260 | 1260 | [23,42,43,45,46,47,48,49,50,51,52,53] |
| 906 | 0.88 | α,α-Dimethylphenylethyl acetate | 151-05-3 | 2 | 1319 | 1320 | – |
| 948 | 1.06 | 2-Phenylethyl propanoate | 122-70-3 | 2 | 1351 | 1357 | – |
| 972 | 1.16 | 3-Phenylpropyl acetate | 122-72-5 | 2 | 1369 | 1388 | – |
| 1002 | 0.93 | Phenylethyl 2-methylpropanoate | 103-48-0 | 2 | 1392 | 1395 | [46,49] |
| 1062 | 1.00 | 2-Phenylethyl butanoate | 103-52-6 | 2 | 1441 | 1441 | [45,46,47] |
| 1092 | 1.40 | Ethyl 3-phenylpropenoate | 103-36-6 | 2 | 1466 | 1480 | [43,50] |
| 1320 | 0.64 | 2-Octyl benzoate (m/z 105,77,70, 41) | 6938-51-8 | 3 | 1721 | - | – |
| 1416 | 0.66 | 3,3,5-Trimethylcyclohexyl 2-hydroxybenzoate | 118-56-9 | 2 | 1901 | 1904 | – |
| Acids | |||||||
| 108 | 3.10 | Acetic acid | 64-19-7 | 2 | 637 | 631 | [23,43,45,47] |
| 270 | 4.81 | 3-Methylbutanoic acid | 503-74-2 | 2 | 862 | 861 | [43,48] |
| 468 | 4.51 | Hexanoic acid | 142-62-1 | 1 | 1007 | 997 | [23,43,45,46,47,48,50] |
| 762 | 3.23 | Octanoic Acid | 124-07-2 | 2 | 1212 | 1210 | [23,43,45,46,47,48,49,50,53] |
| 858 | 3.19 | Nonanoic acid | 112-05-0 | 2 | 1284 | 1288 | [43,47,53] |
| 990 | 2.79 | Decanoic acid | 334-48-5 | 2 | 1384 | 1387 | [43,45,46,47,53] |
| 1212 | 1.96 | Dodecanoic acid | 143-07-7 | 2 | 1578 | 1609 | [43,53] |
| 1350 | 1.32 | Tetradecanoic acid | 544-63-8 | 2 | 1772 | 1788 | – |
| 1422 | 1.14 | Pentadecanoic acid | 1002-84-2 | 1 | 1915 | 1878 | – |
| 1446 | 1.05 | Hexadecanoic acid | 57-10-3 | 1 | 1965 | 1964 | – |
| Alcohols | |||||||
| Aliphatics | |||||||
| 84 | 0.61 | 1-Propanol | 71-23-8 | 2 | 591 | 589 | [23,42] |
| 102 | 0.66 | 2-Methyl-1-propanol | 78-83-1 | 2 | 622 | 613 | [23,42,43,45,46,47,50,51,52,53] |
| 114 | 0.75 | 1-Butanol | 71-36-3 | 2 | 643 | 639 | – |
| 156 | 1.03 | 3-Methyl-1-butanol | 123-51-3 | 1 | 718 | 718 | [23,42,43,45,46,47,48,49,50,51,52,53] |
| 162 | 0.86 | 2-Methyl-1-butanol | 137-32-6 | 2 | 728 | 728 | [42,50,52] |
| 174 | 1.18 | 4-Penten-1-ol (m/z 67, 39, 68, 44) | 821-09-0 | 3 | 749 | - | – |
| 204 | 3.31 | 2,3-Butanediol (isomer) | 513-85-9 | 2 | 803 | 796 | [45] |
| 216 | 3.87 | 2,3-Butanediol (isomer) | 513-85-9 | 2 | 814 | 796 | [45] |
| 246 | 1.02 | 4-Methyl-1-pentanol | 626-89-1 | 2 | 838 | 843 | – |
| 258 | 1.03 | 3-Methyl-1-pentanol | 589-35-5 | 2 | 848 | 851 | – |
| 288 | 1.05 | 1-Hexanol | 111-27-3 | 1 | 875 | 880 | [23,43,45,46,47,48,49,50] |
| 324 | 0.85 | 2-Heptanol | 543-49-7 | 2 | 905 | 907 | – |
| 420 | 1.07 | 1-Heptanol | 111-70-6 | 2 | 975 | 970 | [43,45,46,47,48,50] |
| 432 | 1.01 | 1-Octen-3-ol | 3391-86-4 | 1 | 980 | 982 | [45,52] |
| 450 | 0.98 | 6-Methyl-5-hepten-2-ol | 4630-06-2 | 2 | 996 | 996 | – |
| 456 | 0.81 | 3-Octanol | 589-98-0 | 1 | 996 | 1001 | – |
| 462 | 0.86 | 2-Octanol | 123-96-6 | 2 | 1001 | 1004 | [46] |
| 504 | 0.97 | 2-Ethyl-1-hexanol | 104-76-7 | 2 | 1030 | 1034 | [43,45,48] |
| 558 | 0.63 | 2-Octen-1-ol | 22104-78-5 | 2 | 1067 | 1074 | – |
| 564 | 1.05 | 1-Octanol | 111-87-5 | 1 | 1072 | 1074 | [23,43,45,46,47,48,49,50,53] |
| 606 | 0.84 | 2-Nonanol | 628-99-9 | 2 | 1101 | 1107 | [43,45] |
| 684 | 1.08 | C9 alcohol (m/z 55, 67, 41, 68) | - | 3 | 1159 | - | – |
| 702 | 0.63 | 2-Nonen-1-ol (isomer) | 22104-79-6 | 2 | 1167 | 1151 | – |
| 708 | 1.00 | 1-Nonanol | 143-08-8 | 2 | 1172 | 1174 | [43] |
| 714 | 0.64 | 2-Nonen-1-ol (isomer) | 22104-79-6 | 2 | 1175 | 1179 | – |
| 840 | 1.15 | 9-Decen-1-ol | 13019-22-2 | 2 | 1269 | 1272 | [43] |
| 846 | 0.97 | 1-Decanol | 112-30-1 | 1 | 1274 | 1265 | [43,45,46,47,49,50] |
| 888 | 0.79 | 2-Undecanol | 1653-30-1 | 1 | 1305 | 1309 | [43,45] |
| 1014 | 0.78 | 2-Dodecanol | 10203-28-8 | 1 | 1401 | 1413 | – |
| 1104 | 0.92 | 1-Dodecanol | 112-53-8 | 1 | 1476 | 1480 | [43,47,48] |
| 1410 | 0.66 | 1-Hexadecanol | 36653-82-4 | 2 | 1889 | 1884 | – |
| Aromatics | |||||||
| 582 | 1.99 | Dimethylbenzenemethanol | 617-94-7 | 2 | 1085 | 1086 | – |
| 630 | 2.99 | Phenylethanol | 60-12-8 | 1 | 1119 | 1122 | [23,42,43,45,46,47,48,50,51,52,53] |
| 642 | 1.28 | 4-Ethyl-1,3-benzenediol (m/z 123, 138, 43, 67) | 2896-60-8 | 3 | 1126 | - | – |
| 774 | 1.52 | C10 Aromatic alcohol (m/z 115, 144, 63, 89) | - | 3 | 1219 | - | – |
| 1332 | 1.93 | 2,6-Bis(1,1-dimethylethyl)-1,4-benzenediol | 1020-31-1 | 2 | 1743 | 1683 | – |
| Cyclics | |||||||
| 846 | 1.65 | 1-Butyl-2-cyclohexen-1-ol (m/z 97, 39, 41, 69) | 88116-46-5 | 3 | 1274 | - | – |
| Sulfur compounds | |||||||
| 78 | 0.33 | Dimethyl sulfide | 75-18-3 | 2 | 580 | 526 | [52] |
| 162 | 0.58 | Dimethyl disulfide | 624-92-0 | 2 | 727 | 731 | [52] |
| 330 | 1.02 | 1,3-Oxathiane | 646-12-8 | 2 | 909 | 913 | – |
| 408 | 0.88 | Dimethyl trisulfide | 3658-80-8 | 2 | 963 | 969 | [52] |
| 438 | 2.86 | 3-(Methylthio)-1-propanol | 505-10-2 | 2 | 985 | 989 | [43,46,50,51,52] |
| 456 | 0.74 | 5-Methyl-2-furanmethanethiol | 59303-05-8 | 2 | 996 | 995 | – |
| 606 | 0.99 | Ethyl 3-(methylthio)propanoate | 13327-56-5 | 2 | 1101 | 1098 | – |
| 642 | 1.09 | 3-(Methylthio)-propyl acetate | 16630-55-0 | 2 | 1126 | 1125 | – |
| 780 | 2.03 | Benzothiazole | 95-16-9 | 2 | 1224 | 1230 | – |
| 816 | 0.67 | 2-(1,1-Dimethylethyl)-thiophene | 1689-78-7 | 2 | 1251 | 1251 | – |
| Volatile phenols | |||||||
| 588 | 2.89 | Guaicol | 90-05-1 | 1 | 1090 | 1095 | [49] |
| 858 | 2.01 | 4-Ethylguaiacol | 2785-89-9 | 2 | 1283 | 1290 | [50] |
| 900 | 2.99 | 4-Vinylguaiacol | 7786-61-0 | 2 | 1316 | 1333 | [43,46,47,50,51] |
| Chemical Family | Number of Common Analytes | Number of Common Analytes within Each Chemical Family (%) | Chromatographic Area of the Common Analytes | Chromatographic Area of the Non-Common Analytes |
|---|---|---|---|---|
| Acids | 10 | 58.8 | >Microbrewer ** | >Microbrewer * |
| Alcohols | 37 | 61.7 | Equal | >Microbrewer *** |
| Esters | 64 | 73.4 | >Microbrewer *** | >Microbrewer *** |
| Monoterpenic compounds | 20 | 22.0 | >Microbrewer **** | >Microbrewer **** |
| Norisoprenoids | 9 | 56.3 | Equal | >Microbrewer *** |
| Sesquiterpenic compounds | 14 | 33.3 | >Microbrewer **** | >Microbrewer **** |
| Sulfur compounds | 10 | 76.9 | >Macrobrewer *** | >Macrobrewer *** |
| Volatile phenols | 3 | 100 | Equal | – |
| TOTAL | 167 | 50.8 | >Microbrewer **** | >Microbrewer **** |
© 2020 by the authors. Licensee MDPI, Basel, Switzerland. This article is an open access article distributed under the terms and conditions of the Creative Commons Attribution (CC BY) license (http://creativecommons.org/licenses/by/4.0/).
Share and Cite
Martins, C.; Brandão, T.; Almeida, A.; Rocha, S.M. Enlarging Knowledge on Lager Beer Volatile Metabolites Using Multidimensional Gas Chromatography. Foods 2020, 9, 1276. https://doi.org/10.3390/foods9091276
Martins C, Brandão T, Almeida A, Rocha SM. Enlarging Knowledge on Lager Beer Volatile Metabolites Using Multidimensional Gas Chromatography. Foods. 2020; 9(9):1276. https://doi.org/10.3390/foods9091276
Chicago/Turabian StyleMartins, Cátia, Tiago Brandão, Adelaide Almeida, and Sílvia M. Rocha. 2020. "Enlarging Knowledge on Lager Beer Volatile Metabolites Using Multidimensional Gas Chromatography" Foods 9, no. 9: 1276. https://doi.org/10.3390/foods9091276
APA StyleMartins, C., Brandão, T., Almeida, A., & Rocha, S. M. (2020). Enlarging Knowledge on Lager Beer Volatile Metabolites Using Multidimensional Gas Chromatography. Foods, 9(9), 1276. https://doi.org/10.3390/foods9091276