Food Security and Hygiene Practice among Adolescent Girls in Maiduguri Metropolitan Council, Borno State, Nigeria

 and
and
Abstract
:
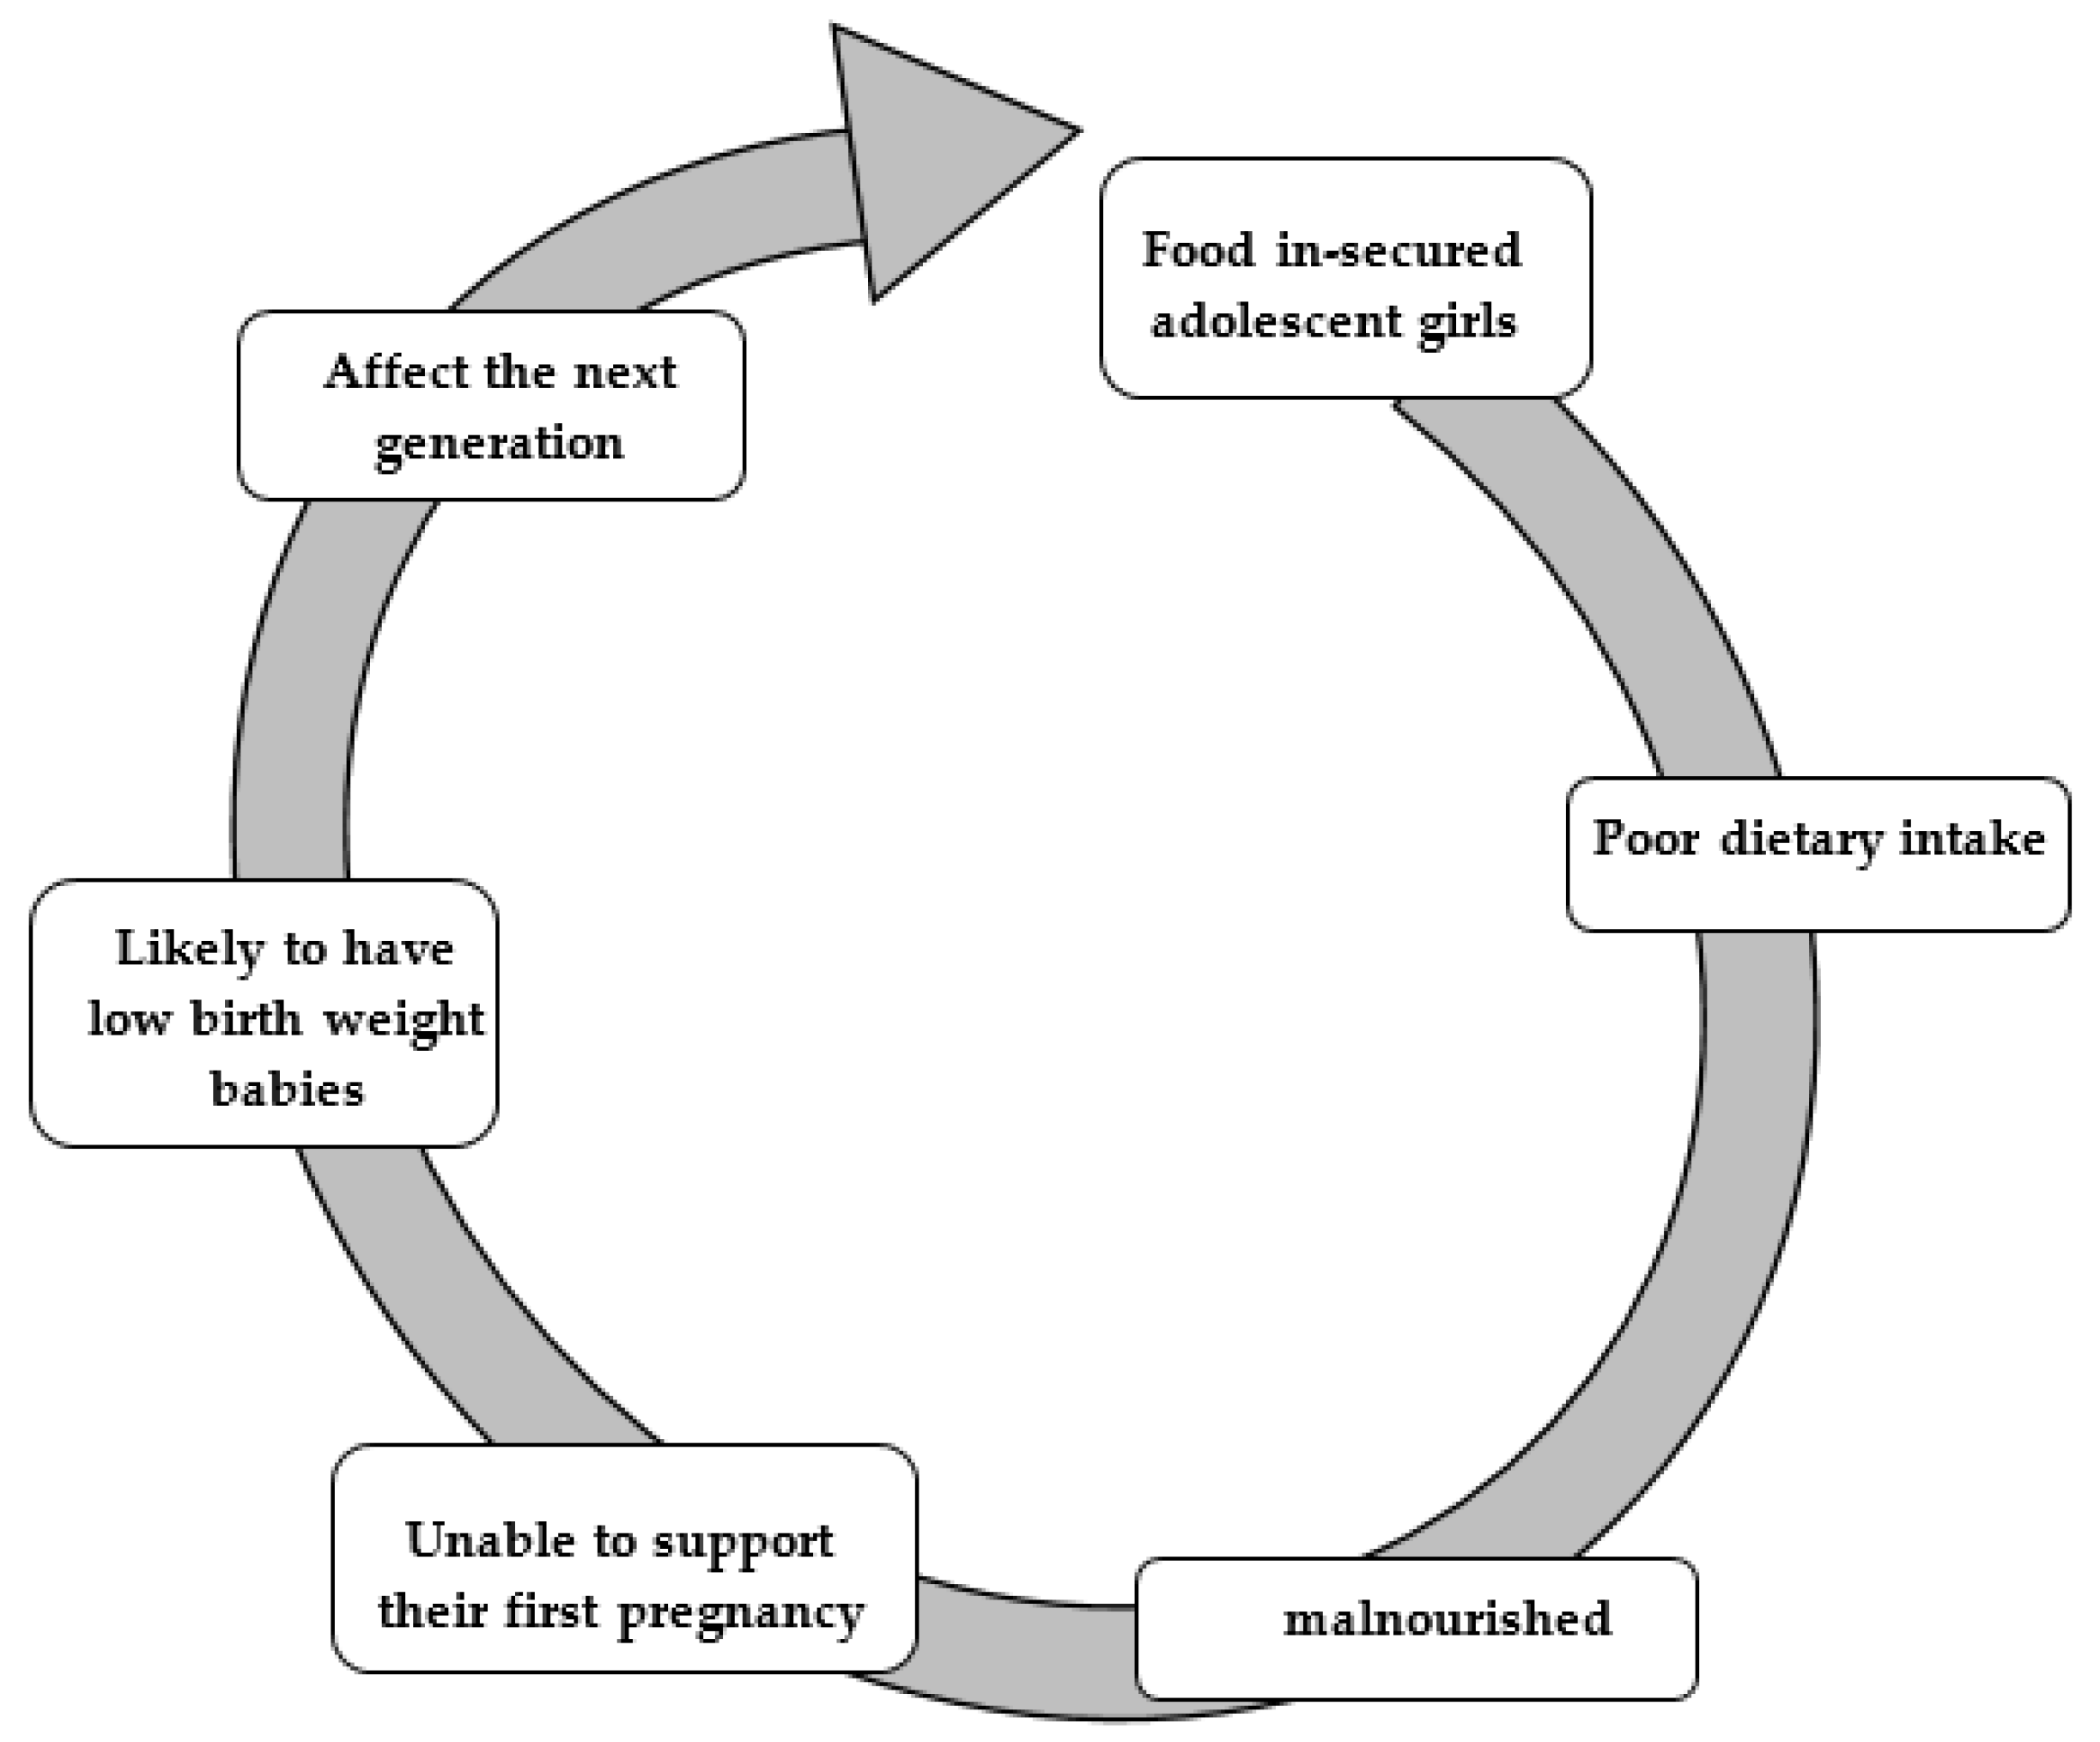
1. Introduction
2. Materials and Methods
3. Results
3.1. Food Security
3.1.1. Food Security Distribution of Respondents
3.1.2. Association and Predictors of Food Security among Respondents
Association between Sociodemographic Characteristics and Food Security
Predictors of Food Security among Respondents
3.2. Hygiene Practice
3.2.1. Hygiene Distribution of Respondents
3.2.2. Association and Predictors of Hygiene among Respondents
Association between Sociodemographic Characteristics and Hygiene
Predictors of Hygiene among Respondents
4. Discussion
Limitation
5. Conclusions
Author Contributions
Funding
Acknowledgments
Conflicts of Interest
References
- UNICEF. The State of the world’s Children 2011: Adolescence An Age of Opportunity; UNICEF: New York, NY, USA, 2011; ISBN 978-92-806-4555-2. [Google Scholar]
- FAO; IFAD; UNICEF; WFP; WHO. Food Security and Nutrition in the World the State of Building Climate Resilience for Food Security and Nutrition; FAO: Rome, Italy; IFAD: Rome, Italy; UNICEF: New York, NY, USA; WFP: Rome, Italy; WHO: Geneva, Switzerland, 2018; ISBN 9789251305713. [Google Scholar]
- Belachew, T.; Hadley, C.; Lindstrom, D.; Getachew, Y.; Duchateau, L.; Kolsteren, P. Food insecurity and age at menarche among adolescent girls in Jimma Zone Southwest Ethiopia: A longitudinal study. Reprod. Biol. Endocrinol. 2011, 9, 1–9. [Google Scholar] [CrossRef] [PubMed] [Green Version]
- FAO; IFAD; UNICEF. The State of Food Security and Nutrition in the World 2019. Safeguarding against Economic Slowdowns and Downturns, Rome, FAO; FAO: Rome, Italy; IFAD: Rome, Italy; UNICEF: New York, NY, USA, 2019; ISBN 9789251315705. [Google Scholar]
- FAO; IFAD; UNICEF. The State of Food Security and Nutrition in the World 2017. Building Resilience for Peace and Food Security. Rome, FAO; FAO: Rome, Italy; IFAD: Rome, Italy; UNICEF: New York, NY, USA, 2017. [Google Scholar]
- WFP. Global Report on Food Crisis 2018, Food Security Information Network; WFP: Rome, Italy, 2018. [Google Scholar]
- Alam, S.S.; Rahman, N.; Lima, L.S.; Haque, M.; Islam, K. Food security status of adolescent girls in selected urban slum. MOJ Public Heal. 2018, 7, 247–250. [Google Scholar] [CrossRef]
- International Food Policy Research Institute Food Security|IFPRI 2014; IFPRI: Washington, DC, USA, 2014.
- Gobal Network Against Food Crisis. In Global Report on Food Crises; FAO: Rome, Italy, 2020.
- Kirkpatrick, S.I.; Tarasuk, V. Food Insecurity Is Associated with Nutrient Inadequacies among Canadian Adults and Adolescents. J. Nutr. 2008, 138, 604–612. [Google Scholar] [CrossRef] [PubMed]
- Jacob, I. Food Insecurity in Nigeria: Way Forward. An Int. Multidiscip. J. Ethiop. 2013, 7, 26–35. [Google Scholar]
- Ukegbu, P.; Nwofia, B.; Ndudiri, U.; Uwakwe, N. Food Insecurity and Associated Factors Among University Students. Food Nutr. Bull. 2019, 40, 271–281. [Google Scholar] [CrossRef]
- Food and Agriculture Organization of the United Nations. The State of Food Insecurity in the World 2000; FAO: Rome, Italy, 2000; ISBN 9251044791. [Google Scholar]
- Food and Agriculture Organization of the United Nations. The State of Food Insecurity in the World; FAO: Rome, Italy, 2004. [Google Scholar]
- World Health Organization. Global Strategy for Infant and Young Child Feeding.; WHO: Geneva, Switzerland, 2003; pp. 1–30. [Google Scholar]
- Moffitt, R.A.; Ribar, D.C. Child age and gender differences in food security in a low-income U.S. inner-city population. Eur. Econ. Rev. 2018, 109, 1–19. [Google Scholar] [CrossRef]
- Fatmaningrum, D.; Roshita, A.; Februhartanty, J. Coping strategies for food insecurity among adolescent girls during the lean season in East Nusa Tenggara, Indonesia: A qualitative study. Br. J. Nutr. 2016, 116, 42–48. [Google Scholar] [CrossRef] [Green Version]
- Kersten, H.B.; Bennett, D. A Multidisciplinary Team Experience with Food Insecurity & Failure to Thrive. J. Appl. Res. Child. 2012, 3, 1–22. [Google Scholar]
- Hartline-Grafton, H. and Dean, O. The Impact of Poverty, Food Insecurity, and Poor Nutrition on Health and Well-Being. Washington, DC. Food Res. Action Cent. 2017, 7, 1–14. [Google Scholar]
- Gundersen, C.; Ziliak, J.P. Food insecurity and health outcomes. Health Affairs 2015, 34, 1830–1839. [Google Scholar] [CrossRef] [Green Version]
- Cordeiro, L.S.; Wilde, P.E.; Semu, H.; Levinson, F.J. Household Food Security Is Inversely Associated with Undernutrition among Adolescents from Kilosa, Tanzania. J. Nutr. 2012, 142, 1741–1747. [Google Scholar] [CrossRef] [PubMed] [Green Version]
- Sharma, A.K.; Chhabra, P.; Gupta, P.; Aggarwal, Q.P.; Lyngdoh, T. Pregnancy In Adolescents: A Community Based Study. Indian J. Prev. Soc. Med Vol. 2003, 34, 1–9. [Google Scholar]
- World Health Organization (WHO) and United Nations Children’s Fund (UNICEF). Progress on Drinking Water, Sanitation and Hygiene; WHO: Geneva, Switzerland; UNICEF: New York, NY, USA, 2017. [Google Scholar]
- Chattopadhyay, A.; Sethi, V.; Nagargoje, V.P.; Saraswat, A.; Surani, N.; Agarwal, N.; Bhatia, V.; Ruikar, M.; Bhattacharjee, S.; Parhi, R.N.; et al. WASH practices and its association with nutritional status of adolescent girls in poverty pockets of eastern India. BMC Womens. Health 2019, 19, 1–13. [Google Scholar] [CrossRef] [PubMed]
- Gottfried, M.A. Evaluating the Relationship Between Student Attendance and Achievement in Urban Elementary and Middle Schools: An Instrumental Variables Approach. Am. Educ. Res. J. 2010, 47, 434–465. [Google Scholar] [CrossRef] [Green Version]
- Shapu, R.C.; Ismail, S.; Ahmad, N.; Ying, L.P.; Abubakar, I. Knowledge, Attitude, and Practice of Adolescent Girls Towards Reducing Malnutrition in Maiduguri Metropolitan Council, Borno State, Nigeria: Cross-Sectional Study. Nutrients 2020, 12, 1–21. [Google Scholar]
- WFP-United Nations World Food Programme Emergency Food Security. In Assessment in Three North East of Nigeria Nigeria Data Collected in February, 2017 Emergency Food Security Assessment in Three North East States; WFP: Rome, Italy, 2017; pp. 1–38.
- Susan Paul, N.S.; Mathew, P.; Johns, F.; Abraham, J. The feasibility of using remote data collection tools in field surveys. Int. J. Community Med. Public Heal. 2018, 5, 81. [Google Scholar] [CrossRef]
- Carol, L.; Connell, M.N.; Kristi, L.; Lofton, K.Y. Self-Administered Food Security Survey Module for Children Ages 12 Years and Older. J. Nutr. 2006, 12, 134. [Google Scholar]
- Shtasel-Gottlieb, Z.; Palakshappa, D.; Yang, F.; Goodman, E. The Relationship Between Developmental Assets and Food Security In Adolescents From A Low-Income Community. J. Adolesc. Heal. 2016, 56, 215–222. [Google Scholar] [CrossRef] [Green Version]
- United nation. Transforming Our World: The 2030 Agenda for Sustainable Development; United nation: San Francisco, CA, USA, 2016. [Google Scholar]
- United Nations Research Institute for Social Development (UNRISD). Global Trends: Challenges and Opportunities in the Implementation of the Sustainable Development Goals; Global Trends: Geneva, Switzerland, 2017. [Google Scholar]
- Das, J.K.; Lassi, S.; Hoodbhoy, Z.; Salam, A. Nutrition for the Next Generation: Older Children and Adolescents. Ann. Nutr. Metab. 2018, 72, 56–64. [Google Scholar] [CrossRef]
- UNICEF. Food Systems for Children and Adolescents; UNICEF: New York, NY, USA, 2018. [Google Scholar]
- Bawadi, H.A.; Tayyem, R.F.; Dwairy, A.N.; Al-akour, N. Prevalence of Food Insecurity among Women in Northern Jordan Prevalence of Food Insecurity among Women in Northern Jordan. J. Heal. Popul. Nutr. 2012, 30, 49–55. [Google Scholar]
- Niclasen, B.; Petzold, M.; Schnohr, C.W. Adverse health effects of experiencing food insecurity among Greenlandic school children. Int. J. Circumpolar Health 2013, 72, 20849. [Google Scholar] [CrossRef] [PubMed]
- Lane, G.; Nisbet, C.; Vatanparast, H. Food insecurity and nutritional risk among canadian newcomer children in Saskatchewan. Nutrients 2019, 11, 1744. [Google Scholar] [CrossRef] [Green Version]
- Charles, U.; Josephine, O.; Ngozi, O.; Chidimma, O.; Charles, I. Factors that Enable Food Insecurity among Orphan and Vulnerable Households in South-East Nigeria. J. Food Secur. 2017, 5, 223–231. [Google Scholar]
- Tariku, A.; Gonete, K.A.; Bikes, G.A.; Alemu, K. Household food insecurity predisposes to undiversified diet in northwest Ethiopia: Finding from the baseline survey of nutrition project, 2016. BMC Res. Notes 2019, 12, 1–7. [Google Scholar] [CrossRef] [PubMed]
- Baer, T.E.; Scherer, E.A.; Fleegler, E.W.; Hassan, A. Food Insecurity and the Burden of Health-Related Social Problems in an Urban Youth Population. J. Adolesc. Heal. 2015, 57, 601–607. [Google Scholar] [CrossRef] [Green Version]
- Jebena, M.G.; Lindstrom, D.; Lachat, C.; Belachew, T.; Kolsteren, P. The effect of food insecurity on health status of adolescents in Ethiopia: Longitudinal study. BMC Public Health 2017, 17, 1–12. [Google Scholar] [CrossRef] [PubMed] [Green Version]
- Belachew, T.; Lindstrom, D.; Gebremariam, A.; Jira, C.; Hattori, M.K.; Lachat, C.; Huybregts, L.; Kolsteren, P. Predictors of chronic food insecurity among adolescents in Southwest Ethiopia: A longitudinal study. BMC Public Health 2012, 12, 604. [Google Scholar] [CrossRef] [PubMed] [Green Version]
- Belachew, T.; Hadley, C.; Lindstrom, D.; Gebremariam, A.; Michael, K.W.; Getachew, Y.; Lachat, C.; Kolsteren, P. Gender Differences in Food Insecurity and Morbidity Among Adolescents in Southwest Ethiopia. Pediatrics 2011, 127, e398–e405. [Google Scholar] [CrossRef] [PubMed]
- Whatnall, M.C.; Hutchesson, M.J.; Patterson, A.J. Predictors of food insecurity among Australian university students: A cross-sectional study. Int. J. Environ. Res. Public Health 2020, 17, 60. [Google Scholar] [CrossRef] [PubMed] [Green Version]
- Nikolaus, C.J.; Schierer, M.; Ellison, B.; Gundersen, C. Grit is Associated with Food Security among US Parents and Adolescents. Am. J. Heal. Behav. 2019, 43, 207–218. [Google Scholar] [CrossRef]
- Mortazavi, Z.; Dorosty, A.R.; Eshraghian, M.R.; Ghaffari, M.; Ansari-Moghaddam, A.; Mohammadi, M. Household Food Insecurity in Southeastern Iran: Severity and Related Factors. Int. J. Food Sci. 2017, 2017, 1–8. [Google Scholar] [CrossRef] [PubMed]
- Nakitto, M.; Asano, K.; Choi, I.; Yoon, J. Dietary intakes of adolescents from food insecure households: Analysis of data from the 6th(2013–2015) Korea national health and nutrition examination survey. Nutr. Res. Pract. 2017, 11, 507–516. [Google Scholar] [CrossRef]
- Weigel, M.M.; Armijos, R.X.; Racines, M.; Cevallos, W. Food insecurity is associated with undernutrition but not overnutrition in ecuadorian women from low-income urban neighborhoods. J. Environ. Public Health 2016, 2016, 1–15. [Google Scholar] [CrossRef] [PubMed] [Green Version]
- Motbainor, A.; Worku, A.; Kumie, A. Level and determinants of food insecurity in East and West Gojjam zones of Amhara Region, Ethiopia: A community based comparative cross-sectional study. BMC Public Health 2016, 16, 503. [Google Scholar] [CrossRef] [PubMed] [Green Version]
- Mohamadpour, M.; Sharif, Z.M.; Keysami, M.A. Food Insecurity, Health and Nutritional Status among Sample of Palm-plantation Households in Malaysia. Ournal Heal. Popul. Nutr. 2012, 30, 291–302. [Google Scholar] [CrossRef] [PubMed]
- Amadi, A.N.; Azuamah, Y. Assessment of Water Sanitation and Hygiene Practices in Ibadan, Nigeria. Int. J. Res. 2018, 2, 94–100. [Google Scholar]
- Demilew, Y.M.; Emiru, A.A. Under nutrition and associated factors among school adolescents in Dangila Town, Northwest Ethiopia: A cross sectional study. Afr. Health Sci. 2018, 18, 756–766. [Google Scholar] [CrossRef] [PubMed] [Green Version]
- Ismail, A.; Darling, A.M.; Mosha, D.; Fawzi, W.; Sudfeld, C.; Sando, M.M.; Noor, R.A.; Charles, J.; Vuai, S. Prevalence and risk factors associated with malnutrition among adolescents in rural Tanzania. Trop. Med. Int. Health 2020, 25, 89–100. [Google Scholar] [CrossRef]
- Besha, B.; Guche, H.; Chare, D.; Amare, A.; Kassahun, A.; Kebede, E.; Yesuf, A. Assessment of Hand Washing Practice and it’s Associated Factors among First Cycle Primary School Children in Arba Minch Town, Ethiopia, 2015. Epidemiology 2016, 6, 1–10. [Google Scholar] [CrossRef]
- Vivas, A.; Gelaye, B.; Aboset, N.; Kumie, A.; Berhane, Y.; Williams, M.A. Knowledge, Attitudes, and Practices (KAP) of Hygiene among School Children in Angolela, Ethiopia. J. Prev. Med. Hyg. 2010, 51, 73–79. [Google Scholar]
- Wolde, T.; Belachew, T. Predictors of thinness and improved dietary diversity among School Aged Children in Southern Ethiopia. Nutr. Diet. Suppl. 2019, 11, 49–58. [Google Scholar] [CrossRef] [Green Version]
- Saeed, S.; Ghebrehiwot, L.; Juni, M.H. Factors Associated With Hand Washing Practices Among Adolescents Yemeni Students in Klang Valley, Malaysia. Int. J. Public Heal. Clin. Sci. 2018, 5, 164–177. [Google Scholar]
- Sarkar, M. Personal hygiene among primary school children living in a slum of Kolkata, India. J. Prev. Med. Hyg. 2013, 54, 153–158. [Google Scholar] [PubMed]


| Food Security Statement | Never | Sometimes | A lot | |||
|---|---|---|---|---|---|---|
| n | % | n | % | n | % | |
| Did you worry that food at home would run out before your family got money to buy more? | 88 | 15.7 | 420 | 74.7 | 54 | 9.6 |
| Did the food that your family bought run out, and you did not have money to get more? | 119 | 21.2 | 393 | 69.9 | 50 | 8.9 |
| Did your meals only include a few kinds of cheap foods because your family was running out of money to buy food? | 65 | 11.6 | 394 | 70.1 | 103 | 18.3 |
| How often were you not able to eat a balanced meal because your family did not have enough money? | 68 | 12.1 | 427 | 76.0 | 67 | 11.9 |
| Did you have to eat less because your family did not have enough money to buy food? | 125 | 22.2 | 380 | 67.6 | 57 | 10.1 |
| Has the size of your meals been cut because your family did not have enough money for food? | 157 | 27.9 | 352 | 62.6 | 53 | 9.4 |
| Did you have to skip a meal because your family did not have enough money for food? | 162 | 28.8 | 354 | 63.0 | 46 | 8.2 |
| Were you hungry but didn’t eat because your family did not have enough food? | 160 | 28.5 | 354 | 63.0 | 48 | 8.5 |
| Did you not eat for a whole day because your family did not have enough money for food? | 247 | 44.0 | 276 | 49.1 | 39 | 6.9 |
| Food Security Level | Frequency (n) | Percentage (%) |
|---|---|---|
| Very low food security level | 413 | 73.5 |
| Low food security level | 108 | 19.2 |
| Food secured level | 41 | 7.3 |
| Variables | Very Low Food Security n (%)/Mean ± SD | Low Food Security n (%)/Mean ± SD | Food Secured n (%)/Mean ± SD | X2/t | p-Value |
|---|---|---|---|---|---|
| Name of school | |||||
| Yerwa | 76 (18.4) | 24 (22.2) | 8 (19.5) | 24.287 a | 0.007 * |
| GGC | 55 (13.3) | 19 (17.9) | 12 (29.3) | ||
| GGSS | 46 (11.1) | 14 (13.0) | 3 (7.3) | ||
| SGDSS | 51 (12.3) | 13 (12.0) | 8 (19.5) | ||
| BDSS | 128 (31.0) | 16 (14.8) | 5 (12.2) | ||
| ZDSS | 57 (13.8) | 22 (20.4) | 5 (12.2) | ||
| Age of Adolescent Girls (years) | 4.385 a | 0.356 | |||
| Early adolescents | 69 (16.7) | 25 (23.1) | 6 (14.6) | ||
| Middle adolescents | 213 (51.6) | 45 (41.7) | 22 (53.7) | ||
| Late adolescents | 131(31.7) | 38 (35.2) | 13 (31.7) | ||
| Class | 1.534 a | 0.957 | |||
| JSS1 | 94 (22.8) | 27 (25.0) | 11 (26.8) | ||
| JSS2 | 80 (19.4) | 21 (19.4) | 9 (22.0) | ||
| SS1 | 113 (27.4) | 25 (23.1) | 9 (22.0) | ||
| SS2 | 126 (30.5) | 35 (32.4) | 12 (29.3) | ||
| Ethnicity | 10.273 a | 0.852 | |||
| Bura | 33 (8.0) | 9 (8.3) | 6 (14.6) | ||
| Kanuri | 133 (32.2) | 30 (27.8) | 10 (24.4 | ||
| Hausa | 41 (9.9) | 12 (11.1) | 5 (12.2) | ||
| Marghi | 41 (9.9) | 8 (7.4) | 3 (7.3) | ||
| Shuwa | 21 (5.1) | 5 (4.6) | 2 (4.9) | ||
| Fulani | 40 (9.7) | 8 (7.4) | 4 (9.8) | ||
| Chibok | 16 (3.9) | 2 (1.9) | 1 (2.4) | ||
| Gwoza | 56 (13.6) | 24 (22.2) | 7 (17.1) | ||
| Other ethnic groups | 32(7.7) | 10 (9.3) | 3 (7.3) | ||
| Religion | 0.721 a | 0.697 | |||
| Christianity | 88 (21.3) | 20 (18.5) | 7 (17.1) | ||
| Islam | 325 (78.7) | 88 (81.5) | 34 (82.9) | ||
| Place of residence | 3.529 a | 0.171 | |||
| Rural | 50 (12.1) | 20 (18.5) | 4 (9.8) | ||
| Urban | 363 (87.9) | 88 (81.5 | 37 (90.2) | ||
| Household size | 1.067 a | 0.899 | |||
| ≤5 members | 34 (8.2) | 9 (8.3) | 3 (7.3) | ||
| 6–8 members | 151 (36.6) | 43 (39.8) | 13 (31.7) | ||
| ≥9 members | 228 (55.2) | 56 (51.9) | 25 (61.0) | ||
| Monthly income | 4.777 a | 0.573 | |||
| Less than ₦18,000 | 116 (28.1) | 31 (28.7) | 16 (39.0) | ||
| ₦18,000–₦30,000 | 143 (34.6) | 41 (38.0) | 16 (39.0) | ||
| ₦31,000–₦50,000 | 107 (25.9) | 25 (23.1) | 7 (17.1) | ||
| ₦51,000 and above | 47 (11.4) | 11 (10.2) | 2 (4.9) | ||
| Head of household | - | 0.330 | |||
| Father | 375 (90.8) | 96 (88.9) | 39 (95.1) | ||
| Mother | 25 (6.1) | 6 (5.6) | 0 (0.0) | ||
| Relations | 13 (3.1) | 6 (5.6) | 2 (4.9) | ||
| Age group of father (years) | 3.846 a | 0.146 | |||
| 35 to 44 | 33 (8.3) | 15 (14.7) | 4 (10.0) | ||
| ≥45 | 365 (91.7) | 87 (85.3) | 36 (90.0) | ||
| Education of father | 13.237 a | 0.104 | |||
| No education | 38 (9.3) | 17 (16.0) | 2 (4.9) | ||
| Informal education | 60 (14.7) | 12 (11.3) | 10 (24.4) | ||
| Primary education | 13 (3.2) | 1 (0.9) | 2 (4.9) | ||
| Secondary education | 137 (33.7) | 43 (40.6) | 13 (31.7) | ||
| Tertiary education | 159 (39.1) | 33 (31.1) | 14 (34.1) | ||
| Occupation of fathers | - | 0.942 | |||
| Civil service | 150 (37.2) | 33 (32.4) | 13 (31.7) | ||
| Trading/business | 207 (51.4) | 58 (56.9) | 23 (56.1) | ||
| Farming | 31 (7.7) | 7 (6.9) | 3 (7.3) | ||
| Other occupation c | 15 (3.7) | 4 (3.9) | 2 (4.9) | ||
| Age group of mother (years) | 15.495 a | 0.004 * | |||
| ≤34 | 76 (18.6) | 16 (15.2) | 8 (20.00) | ||
| 35 to 44 | 199 (48.8) | 68 (64.8) | 13 (32.5) | ||
| ≥45 | 133 (32.6) | 21 (20.0) | 19 (47.5) | ||
| Education of mothers | 8.711 a | 0.367 | |||
| No education | 72 (17.6) | 26 (24.5) | 3 (7.3) | ||
| Informal education | 89 (21.7) | 22 (20.8) | 12 (29.3) | ||
| Primary education | 40 (9.8) | 12 (11.3) | 6 (14.6) | ||
| Secondary education | 140 (34.1) | 32 (30.2) | 15 (36.6) | ||
| Tertiary education | 69 (16.8) | 14 (13.2) | 5 (12.2) | ||
| Occupation of mothers | 26.140 a | <0.001 * | |||
| Civil service | 51 (12.7) | 19 (18.1) | 16 (41.0) | ||
| Trading/business | 171 (42.4) | 50 (47.6) | 11 (28.2) | ||
| Farming | 23 (5.7) | 2 (1.9) | 2 (5.1) | ||
| Housewives | 158 (39.2) | 234 (32.4) | 10 (25.6) | ||
| Family type | 6.746 a | 0.150 | |||
| Monogamy | 218 (52.8) | 47 (43.5) | 16 (39.0) | ||
| Polygamy | 166 (40.2) | 50 (46.3) | 23 (56.1) | ||
| single parenting | 29 (7.0) | 11 (10.2) | 2 (4.9) | ||
| Hygiene | 5.811 a | 0.055 | |||
| Poor hygiene | 180 (43.6) | 60 (55.6) | 22 (53.7) | ||
| Good hygiene | 233 (56.4) | 48 (44.4) | 19 (46.3) |
| Variables | Low Food Secured | Food Secured | ||||||||||
|---|---|---|---|---|---|---|---|---|---|---|---|---|
| B | Crude Odds Ratio | SE | 95% CI | p-Value | B | Adjusted Odds Ratio | SE | 95% CI | p-Value | |||
| Lower Bound | Upper Bound | Lower Bound | Upper Bound | |||||||||
| Very low food secured | Ref | Ref | ||||||||||
| Intercept | −2.181 | 0.419 | <0.001 | −2.401 | 0.620 | <0.001 | ||||||
| Name of school | ||||||||||||
| Yerwa | −0.130 | 0.878 | 0.382 | 0.416 | 1.856 | 0.734 | −0.136 | 0.873 | 0.666 | 0.236 | 3.222 | 0.838 |
| GGC | −0.207 | 0.813 | 0.409 | 0.365 | 1.811 | 0.612 | 0.591 | 1.806 | 0.605 | 0.552 | 5.908 | 0.328 |
| GGSS | −0.356 | 0.701 | 0.455 | 0.287 | 1.710 | 0.435 | −0.450 | 0.638 | 0.775 | 0.140 | 2.910 | 0.561 |
| SGDSS | −0.375 | 0.688 | 0.426 | 0.299 | 1.583 | 0.379 | 0.165 | 1.179 | 0.643 | 0.335 | 4.156 | 0.797 |
| BDSS | −1.184 | 0.306 | 0.400 | 0.140 | 0.671 | 0.003 * | −0.852 | 0.427 | 0.670 | 0.115 | 1.586 | 0.204 |
| ZDSS | Ref | Ref | ||||||||||
| Age group of father (years) | ||||||||||||
| 35 to 44 | 0.959 | 2.610 | 0.402 | 1.187 | 5.736 | 0.017 * | 0.531 | 1.700 | 0.667 | 0.460 | 6.288 | 0.427 |
| ≥45 | Ref | Ref | ||||||||||
| Age group of mother (years) | ||||||||||||
| ≤34 | 0.123 | 1.131 | 0.424 | 0.493 | 2.597 | 0.771 | −0.424 | 0.654 | 0.528 | 0.232 | 1.842 | 0.422 |
| 35 to 44 | 0.779 | 2.180 | 0.309 | 1.191 | 3.993 | 0.012 * | −0.883 | 0.414 | 0.406 | 0.187 | 0.917 | 0.030 * |
| ≥45 | Ref | Ref | ||||||||||
| Occupation of mothers | ||||||||||||
| Civil service | 0.544 | 1.722 | 0.367 | 0.839 | 3.534 | 0.138 | 1.422 | 4.144 | 0.465 | 1.665 | 10.312 | 0.002 * |
| Trading/business | 0.495 | 1.640 | 0.274 | 0.960 | 2.804 | 0.070 | 0.089 | 1.093 | 0.460 | 0.443 | 2.696 | 0.846 |
| Farming | −0.860 | 0.423 | 0.790 | 0.090 | 1.989 | 0.276 | 0.245 | 1.278 | 0.849 | 0.242 | 6.750 | 0.773 |
| Housewives | Ref | Ref | ||||||||||
| Hygiene | ||||||||||||
| Poor hygiene | 0.682 | 1.979 | 0.243 | 1.228 | 3.187 | 0.005 * | 0.418 | 1.519 | 0.363 | 0.746 | 3.093 | 0.249 |
| Good knowledge | Ref | Ref | ||||||||||
| Hygiene Statement | Characteristics | Frequency (n) | Percentage (%) |
|---|---|---|---|
| What is your current source of drinking water | Tap | 93 | 16.5 |
| Borehole | 277 | 49.3 | |
| Well | 12 | 2.1 | |
| Dam | 154 | 27.4 | |
| Tanker | 5 | 0.9 | |
| Truck | 21 | 3.7 | |
| Where do you dispose human waste (defecate) at home | Private latrine | 305 | 54.3 |
| Shared latrine | 237 | 42.2 | |
| Open defaecation | 20 | 3.6 | |
| What are the times when you wash your hands with soap or ash or sand and clean water | Correct answer | 504 | 89.7 |
| Incorrect answer | 58 | 10.3 | |
| I keep my water in a | Clean container | 126 | 22.4 |
| Covered container | 221 | 39.3 | |
| A clean, covered container | 215 | 38.3 | |
| In which of the following ways do you treat your drinking water to make it safe at home | Boil the water | 39 | 6.9 |
| Use a clean cloth to strain it | 284 | 50.5 | |
| Allow the dirt to settle at the bottom of the container | 239 | 42.5 |
| Variables | Level of Hygiene | X2/t | p-Value | |
|---|---|---|---|---|
| Poor n (%) | Good n (%) | |||
| Name of school | 14.017 a | 0.016 * | ||
| Yerwa | 43 (16.4) | 65 (21.7) | ||
| GGC | 34 (13.0) | 52 (17.3) | ||
| GGSS | 27 (10.3) | 36 (12.0) | ||
| SGDSS | 42 (16.0) | 30 (10.0) | ||
| BDSS | 66 (25.2) | 83 (27.7) | ||
| ZDSS | 50 (19.1) | 34 (11.3) | ||
| Age of adolescent girls (years) | 2.663 a | 0.264 | ||
| Early adolescents | 54 (20.6) | 46 (15.3) | ||
| Middle adolescents | 126 (48.1) | 154 (51.3) | ||
| Late adolescents | 82 (31.3) | 100 (33.3) | ||
| Class | 3.679 a | 0.298 | ||
| JSS1 | 66 (25.2) | 66 (22.0) | ||
| JSS2 | 49 (18.7) | 61 (20.3) | ||
| SS1 | 75 (28.6) | 72 (24.0) | ||
| SS2 | 72 (27.5) | 101 (33.7) | ||
| Ethnicity | 3.198 a | 0.921 | ||
| Bura | 22 (8.4) | 26 (8.7) | ||
| Kanuri | 76 (29.0) | 97 (32.3) | ||
| Hausa | 27 (10.3) | 31 (10.3) | ||
| Marghi | 23 (8.8) | 29 (9.7) | ||
| Shuwa | 12 (4.6) | 16 (5.3) | ||
| Fulani | 23 (8.8) | 29 (9.7) | ||
| Chibok | 10 (3.8) | 9 (3.0) | ||
| Gwoza | 47 (17.9) | 40 (13.3) | ||
| Other tribes | 22 (8.4) | 23 (7.7) | ||
| Religion | 0.085 a | 0.771 | ||
| Christianity | 55 (21.0) | 60 (20.0) | ||
| Islam | 207 (79.0) | 240 (80.0) | ||
| Place of residence | 0.391 a | 0.532 | ||
| Rural | 37 (14.1) | 37 (12.3) | ||
| Urban | 225 (85.9) | 263 (87.7) | ||
| Household size | 0.269 a | 0.874 | ||
| ≤5 members | 22 (8.4) | 24 (8.0) | ||
| 6–8 members | 99 (37.8) | 108 (36.0) | ||
| ≥9 members | 141 (53.8) | 168 (56.0) | ||
| Monthly income | 2.181 a | 0.536 | ||
| Less than ₦18,000 | 72 (27.5) | 91 (30.3) | ||
| ₦18,000–₦30,000 | 97 (37.0) | 103 (34.3) | ||
| ₦31,000–₦50,000 | 61 (23.3) | 78 (26.0) | ||
| ₦51,000 and above | 32 (12.2) | 28 (9.3) | ||
| Variables | Level of Hygiene | X2/t | p-Value | Variables |
| Head of household | 0.159 a | 0.924 | ||
| Father | 238 (90.8) | 272 (90.7) | ||
| Mother | 15 (5.7) | 16 (5.3) | ||
| Relations | 9 (3.4) | 12 (4.0) | ||
| Age group of father (years) | 0.421 a | 0.517 | ||
| 35 to 44 | 26 (10.5) | 26 (8.9) | ||
| ≥45 | 221 (89.5) | 267 (91.1) | ||
| Education of father | 3.481 a | 0.481 | ||
| No education | 28 (10.9) | 29 (9.8) | ||
| Informal education | 45 (17.5) | 37 (12.5) | ||
| Primary education | 7 (2.7) | 9 (3.0) | ||
| Secondary education | 88 (34.2) | 105 (35.4) | ||
| Tertiary education | 89 (34.6) | 117 (39.4) | ||
| Occupation of fathers | 2.190 a | 0.534 | ||
| Civil service | 95 (37.8) | 101 (34.2) | ||
| Trading/business | 126 (50.2) | 162 (54.9) | ||
| Farming | 18 (7.2) | 23 (7.8) | ||
| Other occupations c | 12 (4.8) | 9 (3.1) | ||
| Age group of mother (years) | 0.549 a | 0.760 | ||
| ≤34 | 43 (16.8) | 57 (19.2) | ||
| 35 to 44 | 131 (51.2) | 149 (50.2) | ||
| ≥45 | 82 (32.0) | 91 (30.6) | ||
| Education of mothers | 2.334 a | 0.675 | ||
| No education | 49 (19.0) | 52 (17.4) | ||
| Informal education | 59 (22.9) | 64 (21.4) | ||
| Primary education | 25 (9.7) | 33 (11.0) | ||
| Secondary education | 90 (34.9) | 97 (32.4) | ||
| Tertiary education | 35 (13.6) | 53 (17.7) | ||
| Occupation of mothers | 4.120 a | 0.249 | ||
| Civil service | 48 (18.5) | 38 (13.2) | ||
| Trading/business | 102 (39.4) | 130 (45.1) | ||
| Farming | 11 (4.2) | 16 (5.6) | ||
| Housewives | 98 (37.8) | 104 (36.1) | ||
| Family type | 2.032 a | 0.362 | ||
| Monogamy | 128 (48.9) | 153 (51.0) | ||
| Polygamy | 110 (42.0) | 129 (43.0) | ||
| Single parenting | 24 (9.2) | 18 (6.0) | ||
| Food security | 5.811 a | 0.055 | ||
| Very low food secured | 180 (68.7) | 233 (77.7) | ||
| Low food secured | 60 (22.9) | 48 (16.0) | ||
| Food secured | 22 (8.4) | 19 (6.3) | ||
| Variables | Simple Logistic Regression | Multiple Logistic Regression | ||||||||||
|---|---|---|---|---|---|---|---|---|---|---|---|---|
| B | Crude Odds Ratio | SE | 95% CI | p-Value | B | Adjusted Odds Ratio | SE | 95% CI | p-Value | |||
| Lower Bound | Upper Bound | Lower Bound | Upper Bound | |||||||||
| Name of school | ||||||||||||
| Yerwa | Ref | Ref | ||||||||||
| GGC | 0.012 | 1.012 | 0.295 | 0.567 | 1.805 | 0.968 | −0.021 | 0.979 | 0.312 | 0.531 | 1.806 | 0.947 |
| GGSS | −0.126 | 0.882 | 0.322 | 0.470 | 1.657 | 0.696 | −0.344 | 0.709 | 0.334 | 0.368 | 1.366 | 0.304 |
| SGDSS | −0.750 | 0.473 | 0.309 | 0.258 | 0.867 | 0.015 * | −0.751 | 0.472 | 0.320 | 0.252 | 0.884 | 0.019 * |
| BDSS | −0.184 | 0.832 | 0.257 | 0.503 | 1.376 | 0.473 | −0.331 | 0.718 | 0.273 | 0.420 | 1.227 | 0.226 |
| ZDSS | −0.799 | 0.450 | 0.297 | 0.251 | 0.805 | 0.007 * | −0.876 | 0.416 | 0.309 | 0.227 | 0.762 | 0.005 * |
| Age of adolescent girls (years) | ||||||||||||
| Early adolescents | −0.359 | 0.699 | 0.250 | 0.428 | 1.140 | 0.151 | - | - | - | - | - | - |
| Middle adolescents | 0.002 | 1.002 | 0.191 | 0.689 | 1.458 | 0.991 | - | - | - | - | - | - |
| Late adolescents | Ref | - | - | - | - | - | - | |||||
| Class | ||||||||||||
| JSS1 | −0.338 | 0.713 | 0.233 | 0.452 | 1.125 | 0.146 | - | - | - | - | - | - |
| JSS2 | −0.119 | 0.887 | 0.246 | 0.548 | 1.438 | 0.628 | - | - | - | - | - | - |
| SS1 | −0.379 | 0.684 | 0.226 | 0.440 | 1.065 | 0.093 | - | - | - | - | - | - |
| SS2 | Ref | - | - | - | - | - | - | |||||
| Ethnicity | ||||||||||||
| Bura | Ref | - | - | - | - | - | - | |||||
| Kanuri | 0.077 | 1.080 | 0.328 | 0.568 | 2.053 | 0.814 | - | - | - | - | - | - |
| Hausa | −0.029 | 0.972 | 0.391 | 0.451 | 2.092 | 0.941 | - | - | - | - | - | - |
| Marghi | 0.065 | 1.067 | 0.402 | 0.485 | 2/347 | 0.872 | - | - | - | - | - | - |
| Shuwa | 0.121 | 1.128 | 0.479 | 0.441 | 2.887 | 0.801 | - | - | - | - | - | - |
| Fulani | 0.065 | 1.067 | 0.402 | 0.485 | 2.347 | 0.872 | - | - | - | - | - | - |
| Chibok | −0.272 | 0.762 | 0.543 | 0.263 | 2.208 | 0.616 | - | - | - | - | - | - |
| Gwoza | −0.328 | 0.720 | 0.361 | 0.355 | 1.461 | 0.363 | - | - | - | - | - | - |
| Other ethnic groups | −0.123 | 0.885 | 0.416 | 0.392 | 1.998 | 0.768 | - | - | - | - | - | - |
| Religion | ||||||||||||
| Christianity | Ref | - | - | - | - | - | - | |||||
| Islam | 0.061 | 1.063 | 0.209 | 0.705 | 1.602 | 0.771 | - | - | - | - | - | - |
| Place of residence | ||||||||||||
| Rural | Ref | - | - | - | - | - | - | |||||
| Urban | 0.156 | 1.169 | 0.250 | 0.717 | 1.906 | 0.532 | - | - | - | - | - | - |
| Household size | ||||||||||||
| ≤5 members | Ref | - | - | - | - | - | - | |||||
| 6–8 members | 0.001 | 1.000 | 0.326 | 0.528 | 1.896 | 1.000 | - | - | - | - | - | - |
| ≥9 members | 0.088 | 1.092 | 0.316 | 0.587 | 2.031 | 0.781 | - | - | - | - | - | - |
| Monthly income | ||||||||||||
| Less than ₦18,000 | Ref | - | - | - | - | - | - | |||||
| ₦18,000–₦30,000 | −0.174 | 0.840 | 0.212 | 0.555 | 1.273 | 0.411 | - | - | - | - | - | - |
| ₦31,000–₦50,000 | 0.012 | 1.012 | 0.233 | 0.641 | 1.596 | 0.960 | - | - | - | - | - | - |
| ₦51,000 and above | −0.368 | 0.692 | 0.303 | 0.382 | 1.254 | 0.225 | - | - | - | - | - | - |
| Head of household | ||||||||||||
| Father | Ref | - | - | - | - | - | - | |||||
| Mother | −0.069 | 0.933 | 0.370 | 0.452 | 1.928 | 0.852 | - | - | - | - | - | - |
| Relations | 0.154 | 1.167 | 0.450 | 0.483 | 2.817 | 0.732 | - | - | - | - | - | - |
| Age group of father (years) | ||||||||||||
| 35 to 44 | −0.189 | 0.828 | 0.292 | 0.467 | 1.467 | 0.517 | - | - | - | - | - | - |
| ≥45 | Ref | - | - | - | - | - | - | |||||
| Education of father | ||||||||||||
| No education | −0.238 | 0.788 | 0.300 | 0.438 | 1.418 | 0.427 | - | - | - | - | - | - |
| Informal education | −0.469 | 0.625 | 0.263 | 0.374 | 1.047 | 0.074 | - | - | - | - | - | - |
| Primary education | −0.022 | 0.978 | 0.523 | 0.351 | 2.727 | 0.966 | - | - | - | - | - | - |
| Secondary education | −0.097 | 0.908 | 0.202 | 0.611 | 1.348 | 0.631 | - | - | - | - | - | - |
| Tertiary education | Ref | - | - | - | - | - | - | |||||
| Occupation of fathers | ||||||||||||
| Civil service | 0.349 | 1.418 | 0.464 | 0.571 | 3.516 | 0.452 | - | - | - | - | - | - |
| Trading/business | 0.539 | 1.714 | 0.457 | 0.700 | 4.196 | 0.238 | - | - | - | - | - | - |
| Farming | 0.533 | 1.704 | 0.542 | 0.589 | 4.926 | 0.325 | - | - | - | - | - | - |
| Other occupations c | Ref | - | - | - | - | - | - | |||||
| Age group of mother (years) | ||||||||||||
| ≤34 | 0.178 | 1.194 | 0.253 | 0.728 | 1.961 | 0.482 | - | - | - | - | - | - |
| 35 to 44 | 0.025 | 1.025 | 0.194 | 0.701 | 1.498 | 0.899 | - | - | - | - | - | - |
| ≥45 | Ref | - | - | - | - | - | - | |||||
| Education of mothers | ||||||||||||
| No education | −0.356 | 0.701 | 0.295 | 0.393 | 1.250 | 0.228 | - | - | - | - | - | - |
| Informal education | −0.334 | 0.716 | 0.283 | 0.411 | 1.247 | 0.238 | - | - | - | - | - | - |
| Primary education | −0.137 | 0.872 | 0.343 | 0.445 | 1.708 | 0.689 | - | - | - | - | - | - |
| Secondary education | −0.340 | 0.712 | 0.262 | 0.426 | 1.190 | 0.195 | - | - | - | - | - | - |
| Tertiary education | Ref | - | - | - | - | - | - | |||||
| Occupation of mothers | ||||||||||||
| Civil service | Ref | - | - | - | - | - | - | |||||
| Trading/business | 0.476 | 1.610 | 0.254 | 0.978 | 2.650 | 0.061 | - | - | - | - | - | - |
| Farming | 0.608 | 1.837 | 0.448 | 0.764 | 4.420 | 0.174 | - | - | - | - | - | - |
| Housewives | 0.293 | 1.340 | 0.259 | 0.807 | 2.226 | 0.257 | - | - | - | - | - | - |
| Family type | ||||||||||||
| Monogamy | 0.466 | 1.594 | 0.334 | 0.828 | 3.067 | 0.163 | - | - | - | - | - | - |
| Polygamy | 0.447 | 1.564 | 0.338 | 0.807 | 3.031 | 0.186 | - | - | - | - | - | - |
| Single parenting | Ref | - | - | - | - | - | - | |||||
| Food security | ||||||||||||
| Very low food secured | Ref | Ref | ||||||||||
| Low food secured | −0.481 | 0.618 | 0.218 | 0.403 | 0.947 | 0.027 * | −0.622 | 0.537 | 0.237 | 0.337 | 0.855 | 0.009 * |
| Food secured | −0.405 | 0.667 | 0.329 | 0.350 | 1.270 | 0.218 | −0.473 | 0.623 | 0.347 | 0.316 | 1.230 | 0.173 |
| Constant | 0.655 | 1.925 | 0.215 | 0.002 | ||||||||
© 2020 by the authors. Licensee MDPI, Basel, Switzerland. This article is an open access article distributed under the terms and conditions of the Creative Commons Attribution (CC BY) license (http://creativecommons.org/licenses/by/4.0/).
Share and Cite
Charles Shapu, R.; Ismail, S.; Ahmad, N.; Lim, P.Y.; Abubakar Njodi, I. Food Security and Hygiene Practice among Adolescent Girls in Maiduguri Metropolitan Council, Borno State, Nigeria. Foods 2020, 9, 1265. https://doi.org/10.3390/foods9091265
Charles Shapu R, Ismail S, Ahmad N, Lim PY, Abubakar Njodi I. Food Security and Hygiene Practice among Adolescent Girls in Maiduguri Metropolitan Council, Borno State, Nigeria. Foods. 2020; 9(9):1265. https://doi.org/10.3390/foods9091265
Chicago/Turabian StyleCharles Shapu, Ruth, Suriani Ismail, Norliza Ahmad, Poh Ying Lim, and Ibrahim Abubakar Njodi. 2020. "Food Security and Hygiene Practice among Adolescent Girls in Maiduguri Metropolitan Council, Borno State, Nigeria" Foods 9, no. 9: 1265. https://doi.org/10.3390/foods9091265
APA StyleCharles Shapu, R., Ismail, S., Ahmad, N., Lim, P. Y., & Abubakar Njodi, I. (2020). Food Security and Hygiene Practice among Adolescent Girls in Maiduguri Metropolitan Council, Borno State, Nigeria. Foods, 9(9), 1265. https://doi.org/10.3390/foods9091265