Preparation and Evaluation of New Glycopeptides Obtained by Proteolysis from Corn Gluten Meal Followed by Transglutaminase-Induced Glycosylation with Glucosamine

Abstract
1. Introduction
2. Materials and Methods
2.1. Materials and Chemicals
2.2. CGM Purification
2.3. Preparation of CGM Hydrolysates
2.4. Preparation of GlcN–CGM Hydrolysates
2.5. HPLC Analyses
2.6. Fourier-Transform Infrared (FTIR) Spectra
2.7. ESI-TOF MS/MS Analysis Conditions
2.7.1. LC Chromatographic Conditions
2.7.2. Mass Conditions
2.8. Evaluation of Antioxidant Properties of Glcn–CGM Hydrolysates and their In Vitro Digestive Products
2.9. MTT Method for Antitoxicity Assay
2.10. Detection of Intracellular ROS Production
2.11. Solubility
2.12. Emulsifying Property
2.13. Surface Hydrophobicity
2.14. Statistical Analysis
3. Results and Discussion
3.1. Establishment of Glycosylation Reaction Conditions
3.2. Evaluation of Glycoconjugation
3.2.1. HPLC
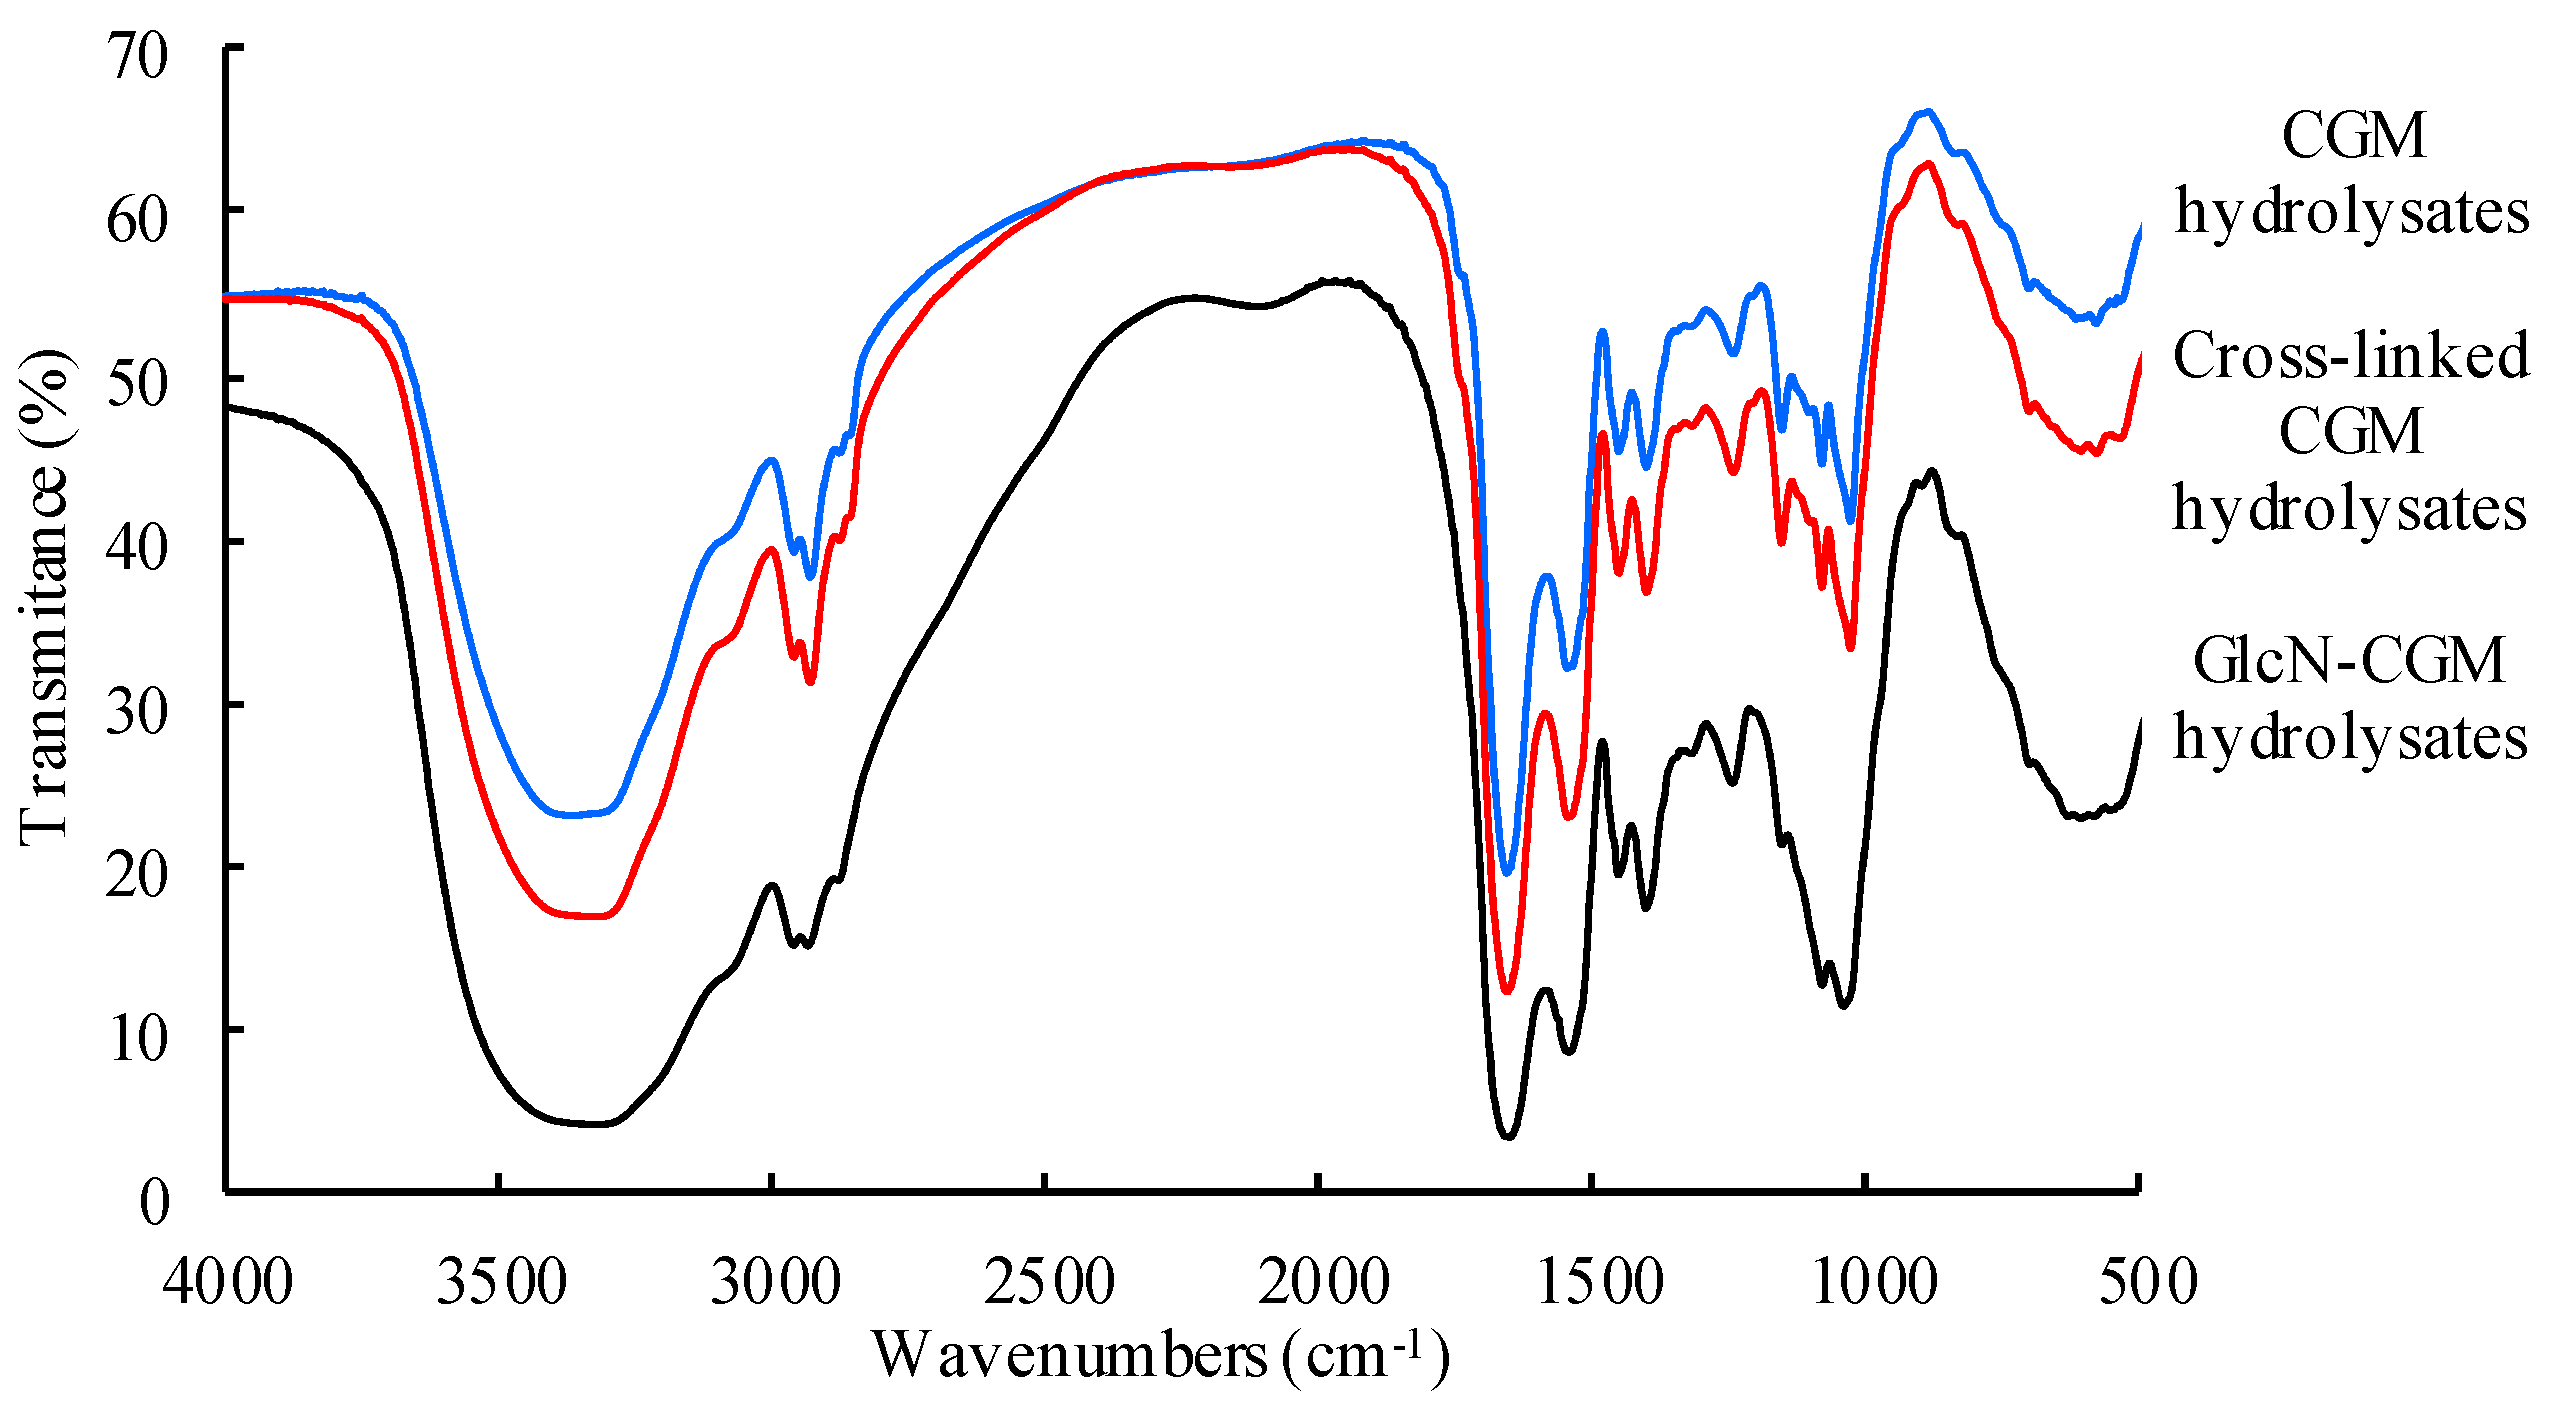
3.2.2. FTIR
3.2.3. ESI-TOF MS/MS
3.3. Biological Properties of Glycopeptides
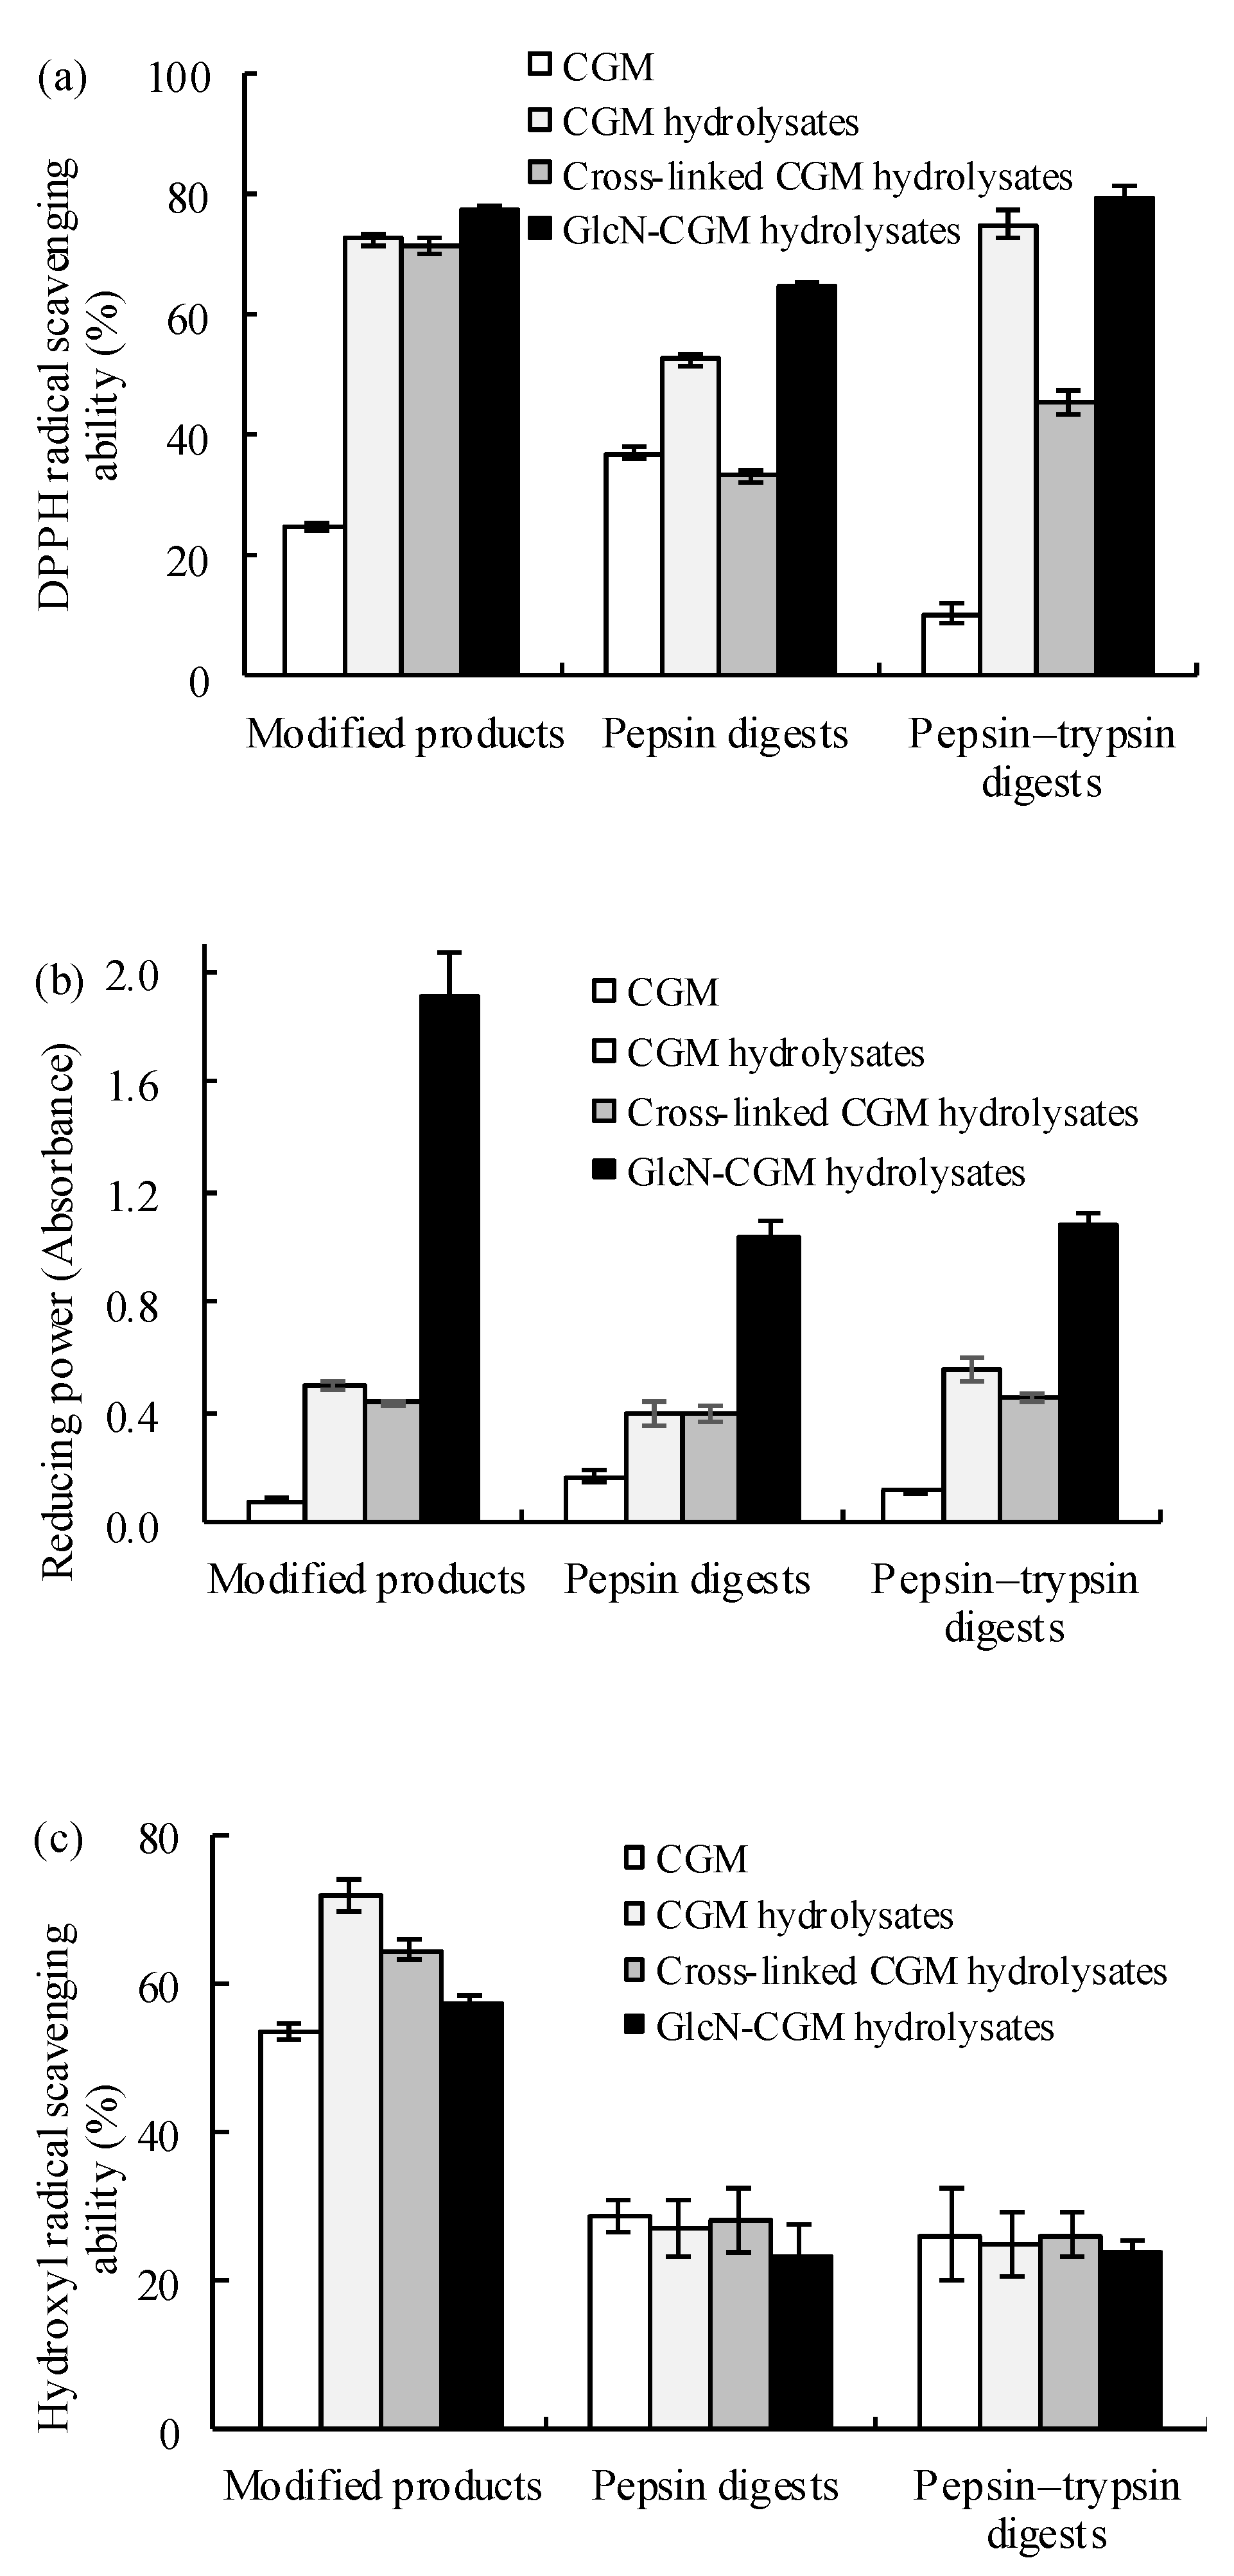
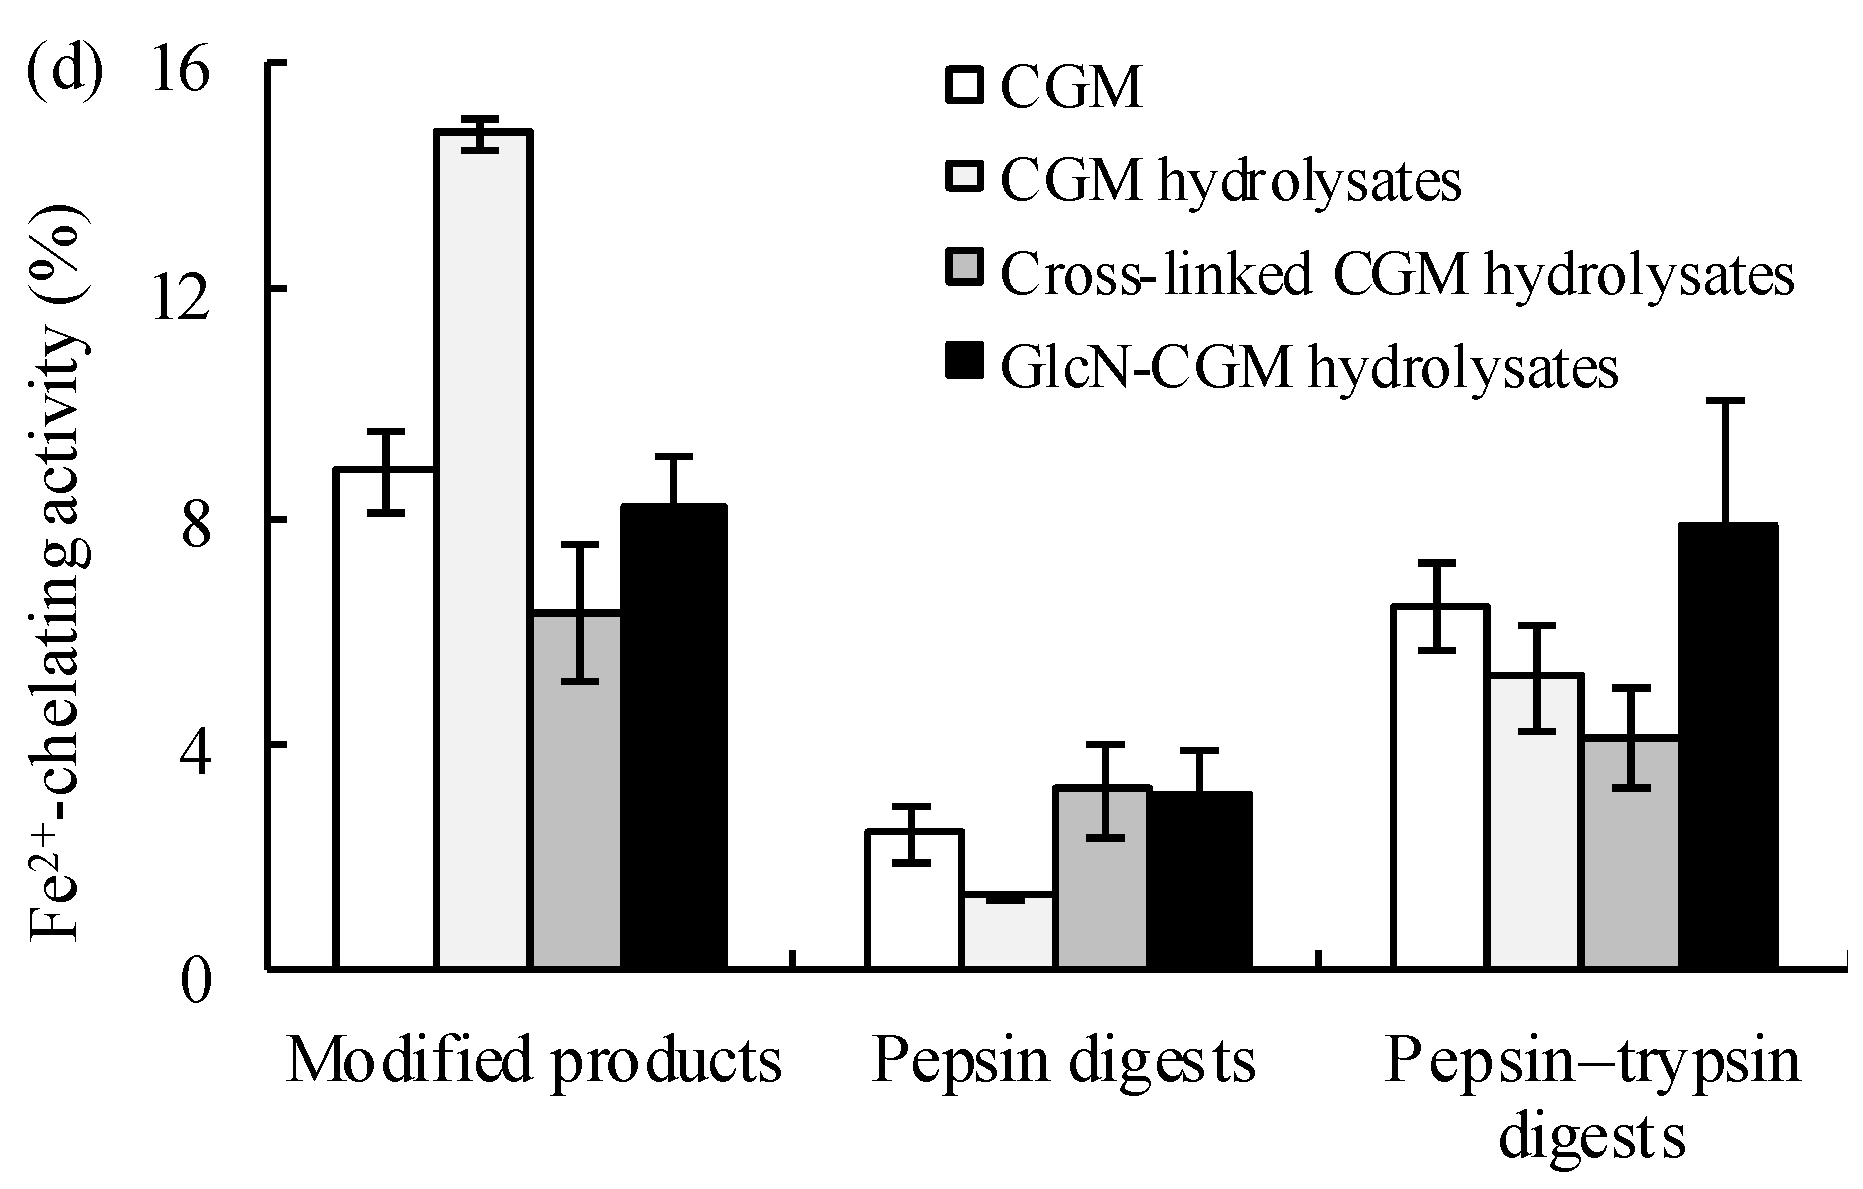
3.3.1. Antioxidant Properties In Vitro of the Prepared Glcn–CGM Hydrolysates and its Digestion Products
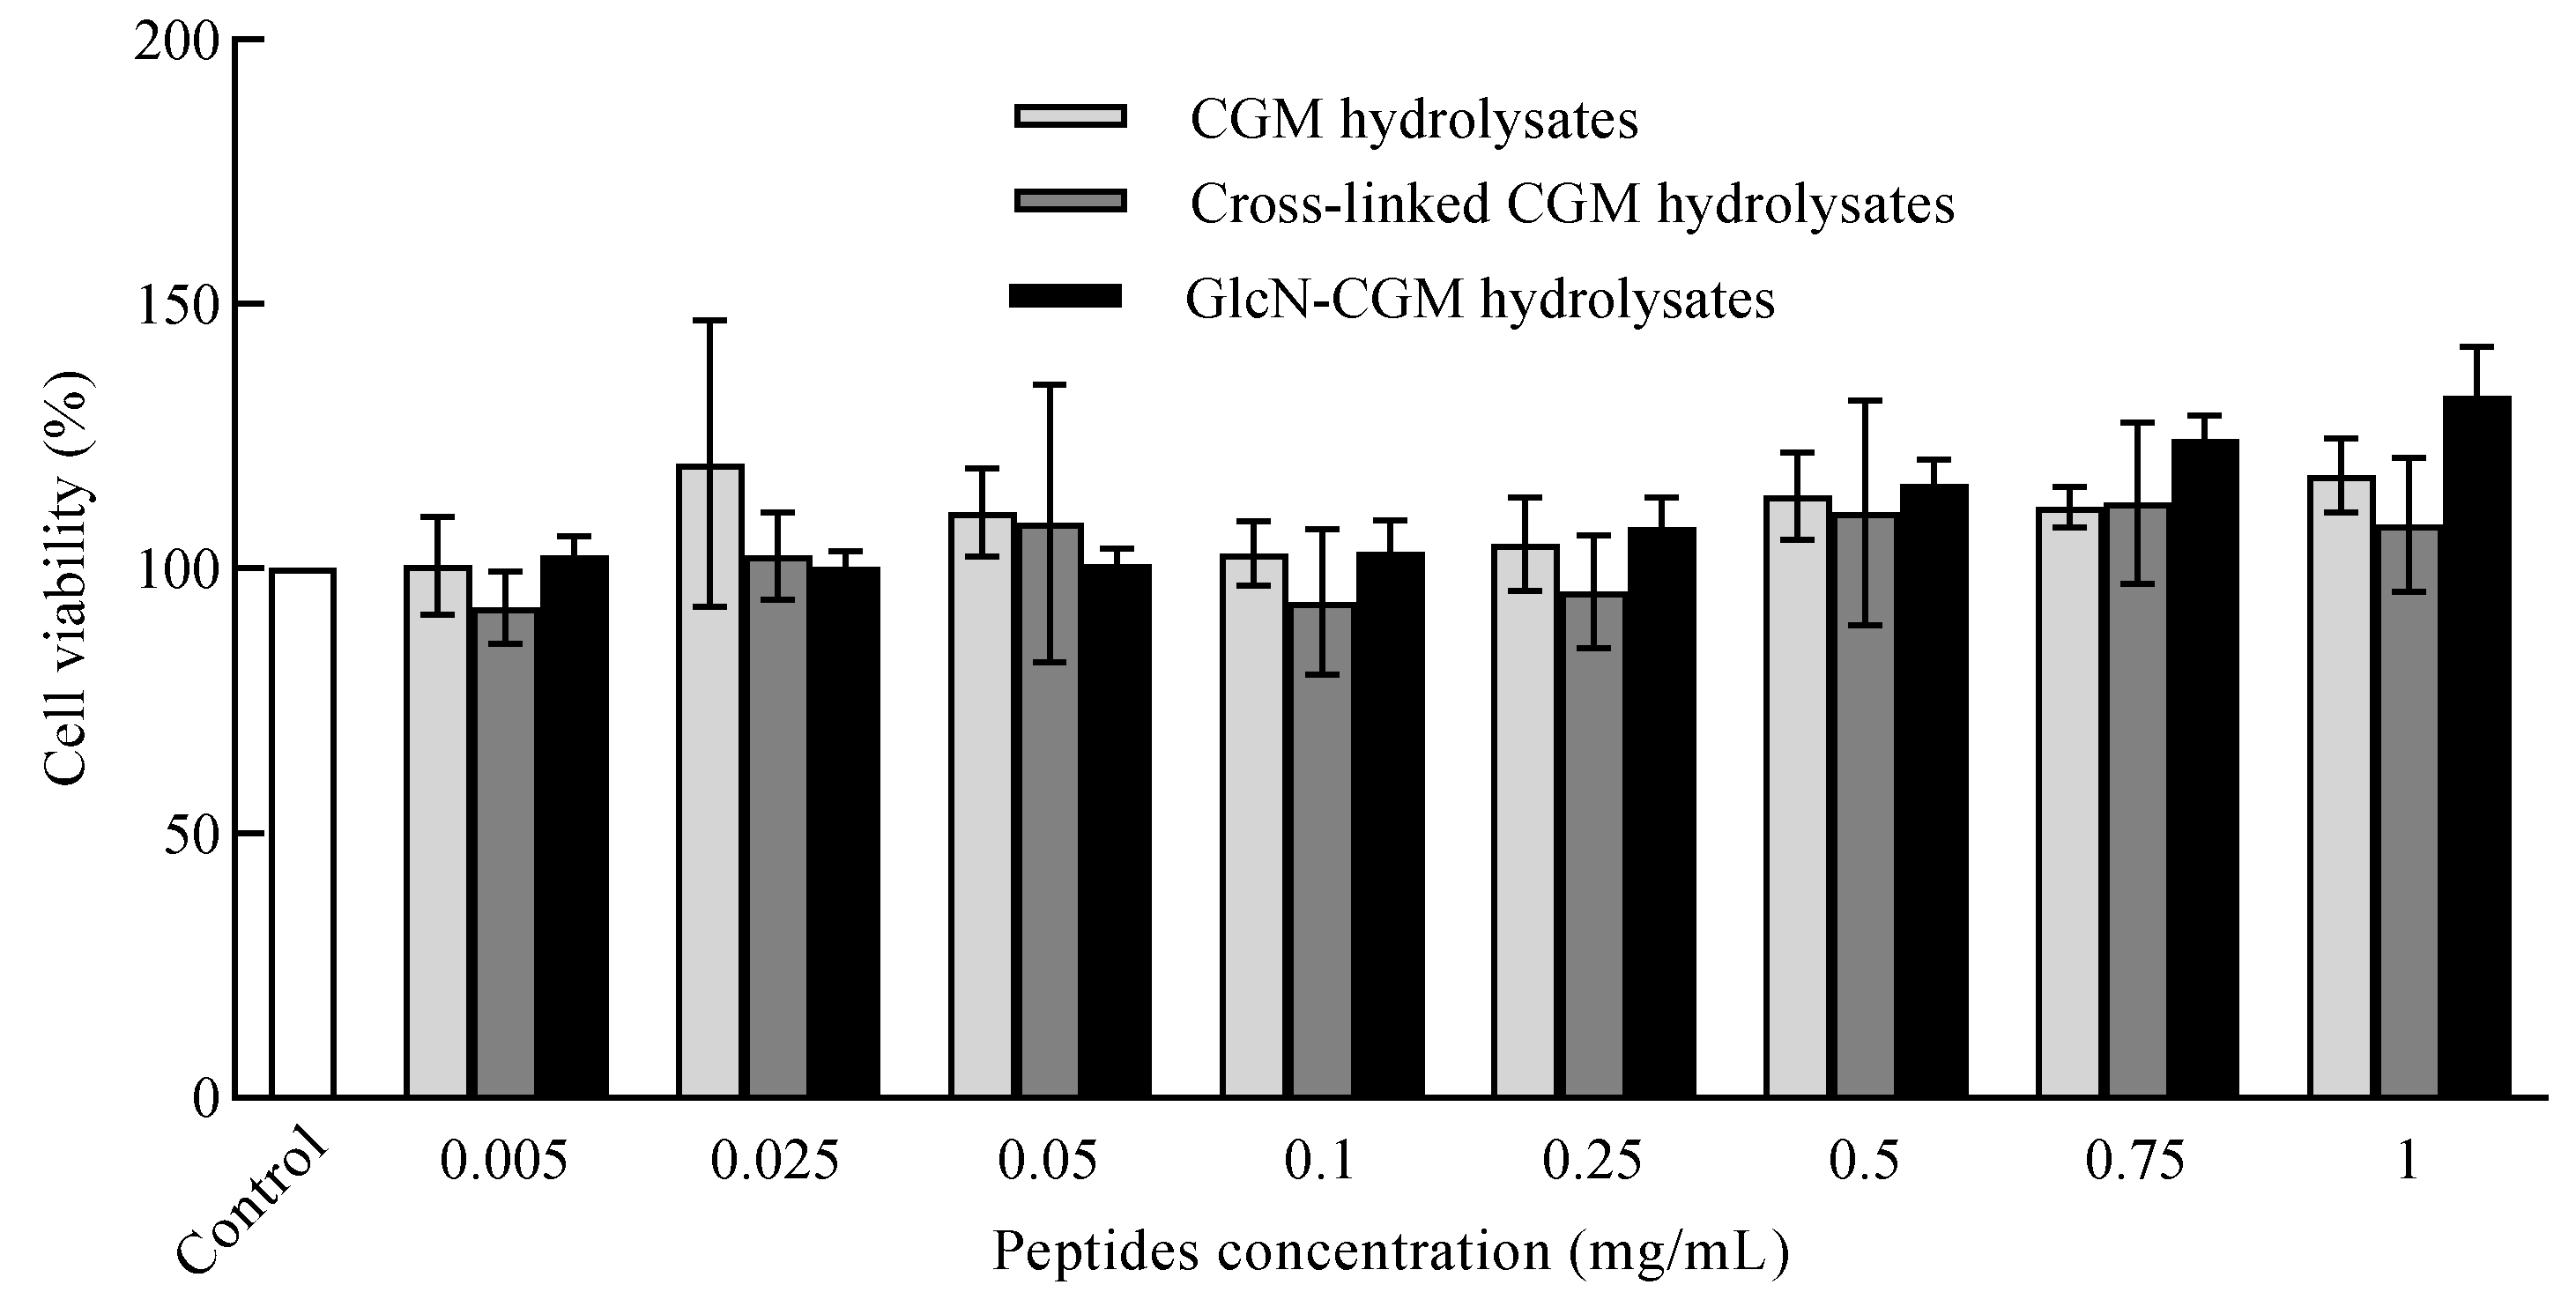
3.3.2. Effect of GlcN–CGM Hydrolysate Addition on Cell Viability of LO2 Cells
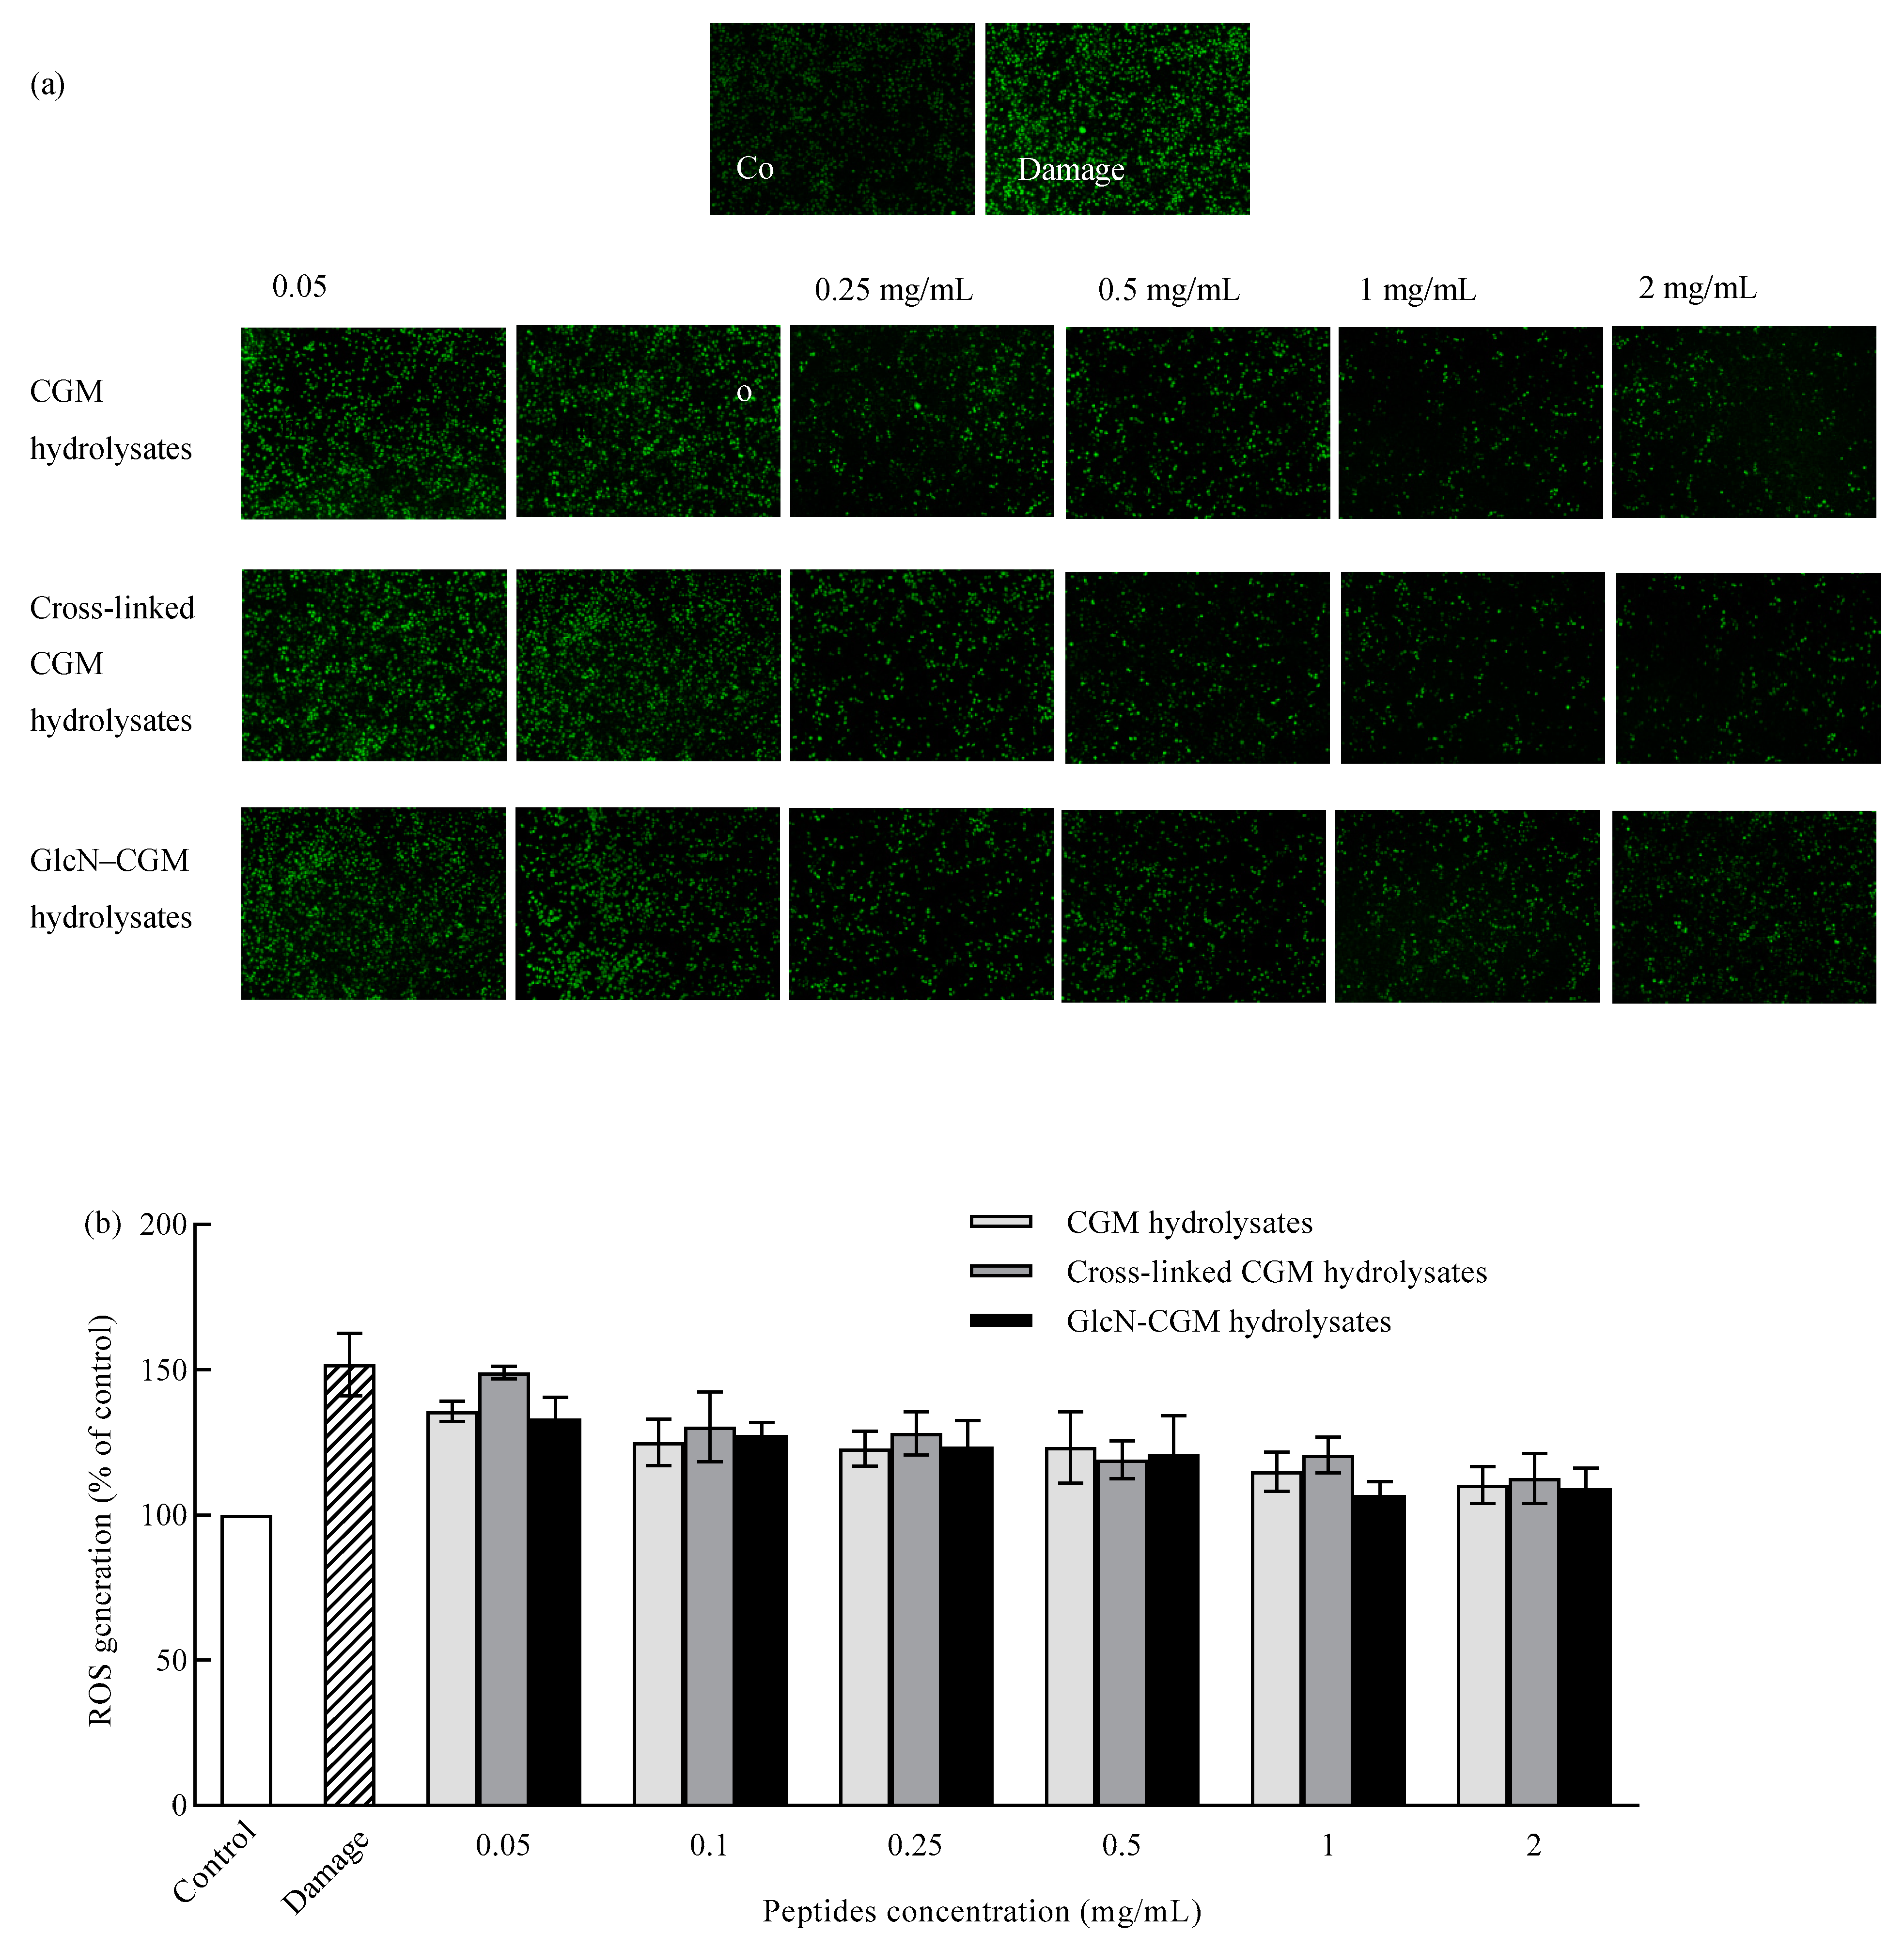
3.3.3. Effect of GlcN–CGM Hydrolysate Addition on Intracellular ROS Generation in LO2 Cells
3.4. Functional Properties of Glycopetides
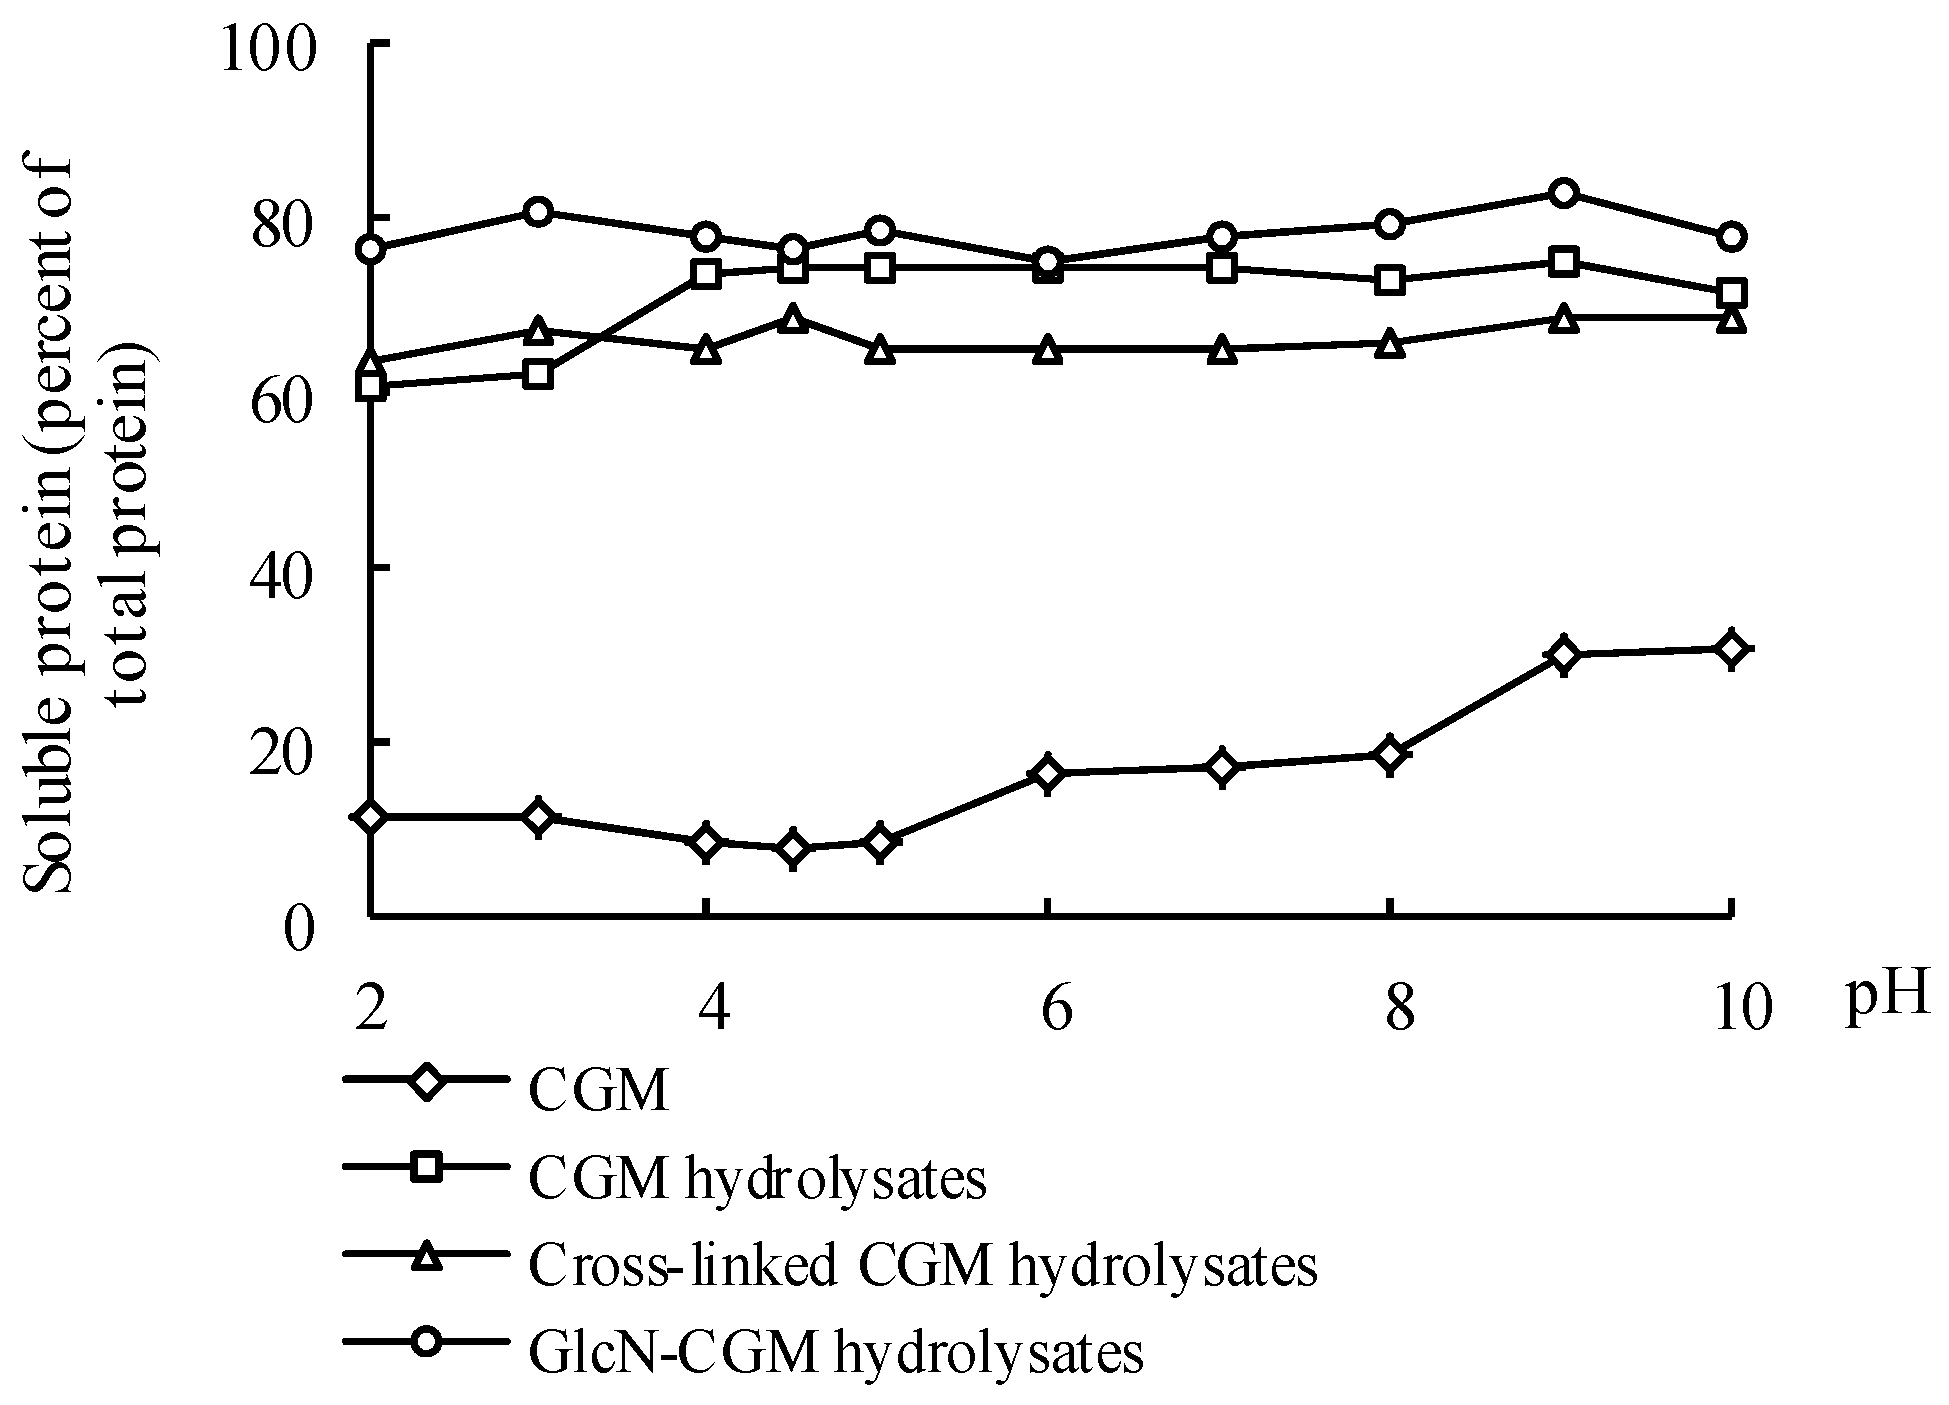
3.4.1. Solubility
3.4.2. Emulsifying Properties
3.4.3. Surface Hydrophobicity
4. Conclusions
Author Contributions
Funding
Conflicts of Interest
Abbreviations
| CGM | Corn gluten meal |
| GlcN | Glucosamine |
| TGase | Transglutaminase |
| HPLC | High performance liquid chromatography |
| FTIR | Fourier transform infrared spectroscopy |
| ESI-TOF MS/MS | Electrospray ionisation-time-of-flight mass spectrometry |
References
- National bureau of statistics of China. Corn Yield Statistics Reports for the China. 2019. Available online: http://data.stats.gov.cn/search.htm?s/aboutChinacorn/statistics/Chinacornstatsreport (accessed on 26 April 2020).
- Park, P.J.; Jung, W.K.; Nam, K.S.; Shahidi, F.; Kim, S.K. Purification and characterization of antioxidative peptides from protein hydrolysate of lecithin-free egg yolk. J. Am. Oil Chem. Soc. 2001, 78, 651–656. [Google Scholar] [CrossRef]
- Landry, J.; Delhaye, S.; di Gioia, L. Protein distribution in gluten products isolated during and after wet-milling of maize grains. Cereal Chem. 1999, 76, 503–505. [Google Scholar] [CrossRef]
- Shukla, R.; Cheryan, M. Zein: The industrial protein from corn. Ind. Crop. Prod. 2001, 13, 171–192. [Google Scholar] [CrossRef]
- Smith, R.J.; Wilmore, D.W. Glutamine nutrition and requirements. JPEN-Parenter. Enter. 1990, 14, 94S–99S. [Google Scholar] [CrossRef]
- Wang, L.; Yu, B.; Wang, R.; Xie, J. Biotechnological routes for transglutaminase production: Recent achievements, perspectives and limits. Trends Food Sci. Technol. 2018, 81, 116–120. [Google Scholar] [CrossRef]
- Colas, B.; Caer, D.; Fournier, E. Transglutaminase-catalyzed glycosylation of vegetable proteins. Effect on solubility of pea legumin and wheat gliadins. J. Agric. Food Chem. 1993, 41, 1811–1815. [Google Scholar] [CrossRef]
- Shi, J.; Zhao, X.H. In Vitro immuno-modulatory ability of tryptic caseinate hydrolysate affected by prior caseinate glycation using the Maillard reaction or transglutaminase. Food Agric. Immunol. 2017, 28, 1029–1045. [Google Scholar] [CrossRef]
- Hong, P.K.; Gottardi, D.; Ndagijimana, M.; Betti, M. Glycation and transglutaminase mediated glycosylation of fish gelatin peptides with glucosamine enhance bioactivity. Food Chem. 2014, 142, 285–293. [Google Scholar] [CrossRef]
- Kieliszek, M.; Misiewicz, A. Microbial transglutaminase and its application in the food industry. A review. Folia Microbiol. 2014, 59, 241–250. [Google Scholar] [CrossRef]
- Mattei, G.; Cacopardo, L.; Ahluwalia, A. Engineering gels with time-evolving viscoelasticity. Materials 2020, 13, 14. [Google Scholar] [CrossRef]
- Zheng, X.Q.; Liu, X.L.; Yu, S.F.; Wang, X.J.; Ma, Y.Q.; Yang, S.; Jing, S.S. Effects of extrusion and starch removal pretreatment on zein proteins extracted from corn gluten meal. Cereal Chem. 2014, 91, 496–501. [Google Scholar] [CrossRef]
- Adler-Nissen, J. Limited enzymic degradation of proteins: A new approach in the industrial application of hydrolases. J. Chem. Technol. Biotechnol. 1982, 32, 138–156. [Google Scholar] [CrossRef]
- El-Saharty, Y.S.; Bary, A.A. High-performance liquid chromatographic determination of neutraceuticals, glucosamine sulphate and chitosan, in raw materials and dosage forms. Anal. Chim. Acta 2002, 462, 125–131. [Google Scholar] [CrossRef]
- Anumula, K. Quantitative determination of monosaccharides in glycoproteins by high-performance liquid chromatography with highly sensitive fluorescence detection. Anal. Biochem. 1994, 220, 275–283. [Google Scholar] [CrossRef] [PubMed]
- Zheng, X.Q.; Wang, J.T.; Liu, X.L.; Sun, Y.; Zheng, Y.J.; Wang, X.J.; Liu, Y. Effect of hydrolysis time on the physicochemical and functional properties of corn glutelin by Protamex hydrolysis. Food Chem. 2015, 172, 407–415. [Google Scholar] [CrossRef] [PubMed]
- Marciniak-Darmochwal, K.; Kostyra, H. Influence of nonenzymatic glycosylation (glycation) of pea proteins (Pisum sativum) on their susceptibility to enzymatic hydrolysis. J. Food Biochem. 2009, 33, 506–521. [Google Scholar] [CrossRef]
- Tang, C.H.; Sun, X.; Yin, S.W.; Ma, C.Y. Transglutaminase-induced cross-linking of vicilin-rich kidney protein isolate: Influence on the functional properties and In Vitro digestibility. Food Res. Int. 2008, 41, 941–947. [Google Scholar] [CrossRef]
- Choe, I.H.; Jeon, H.J.; Eom, S.H.; Han, Y.K.; Kim, Y.S.; Lee, S.H. The anti-inflammatory effect of a glycosylation product derived from the high hydrostatic pressure enzymatic hydrolysate of a flatfish byproduct. Food Funct. 2016, 7, 2557–2565. [Google Scholar] [CrossRef]
- Vieira, E.F.; da Silva, D.D.; Carmo, H.; Ferreira, I.M. Protective ability against oxidative stress of brewers’ spent grain protein hydrolysates. Food Chem. 2017, 228, 602–609. [Google Scholar] [CrossRef]
- Bera, M.; Mukherjee, R. Solubility, emulsifying, and foaming properties of rice bran protein concentrates. J. Food Sci. 1989, 54, 142–145. [Google Scholar] [CrossRef]
- Pearce, K.N.; Kinsella, J.E. Emulsifying properties of proteins: Evaluation of a turbidimetric technique. J. Agric. Food Chem. 1978, 26, 716–723. [Google Scholar] [CrossRef]
- Hayakawa, S.; Nakai, S. Relationships of hydrophobicity and net charge to the solubility of milk and soy proteins. J. Food Sci. 1985, 50, 486–491. [Google Scholar] [CrossRef]
- Jiang, S.J.; Zhao, X.H. Transglutaminase-induced cross-linking and glucosamine conjugation of casein and some functional properties of the modified product. Int. Dairy J. 2011, 21, 198–205. [Google Scholar] [CrossRef]
- Jiang, S.J.; Zhao, X.H. Transglutaminase-induced cross-linking and glucosamine conjugation in soybean protein isolates and its impacts on some functional properties of the products. Eur. Food Res. Technol. 2010, 231, 679–689. [Google Scholar] [CrossRef]
- Guan, J.J.; Qiu, A.Y.; Liu, X.Y.; Hua, Y.F.; Ma, Y.H. Microwave improvement of soy protein isolate-saccharide graft reactions. Food Chem. 2006, 97, 577–585. [Google Scholar] [CrossRef]
- Lu, R.R.; Qian, P.; Sun, Z.; Zhou, X.H.; Chen, T.P.; He, J.F.; Zhang, H.; Wu, J. Hempseed protein derived antioxidative peptides: Purification, identification and protection from hydrogen peroxide-induced apoptosis in PC12 cells. Food Chem. 2010, 123, 1210–1218. [Google Scholar] [CrossRef]
- Gottardi, D.; Hong, P.K.; Ndagijimana, M.; Betti, M. Conjugation of gluten hydrolysates with glucosamine at mild temperatures enhances antioxidant and antimicrobial properties. LWT-Food Sci. Technol. 2014, 57, 181–187. [Google Scholar] [CrossRef]
- Wang, X.J.; Zheng, X.Q.; Liu, X.L.; Kopparapu, N.K.; Cong, W.S.; Deng, Y.P. Preparation of glycosylated zein and retarding effect on lipid oxidation of ground pork. Food Chem. 2017, 227, 335–341. [Google Scholar] [CrossRef]
- Stoddart, M.J. Cell viability assays: Introduction. In Mammalian Cell Viability; Springer: Berlin, Germany, 2011; pp. 1–6. [Google Scholar]
- Fu, Y.; Zhao, X.H. Utilization of chum salmon (Oncorhynchus keta) skin gelatin hydrolysates to attenuate hydrogen peroxide-induced oxidative injury in rat hepatocyte BRL cell model. J. Aquat. Food Prod. Technol. 2015, 24, 648–660. [Google Scholar] [CrossRef]
- Karnjanapratum, S.; O’Callaghan, Y.C.; Benjakul, S.; O’Brien, N.M. In Vitro cellular bioactivities of Maillard reaction products from sugar-gelatin hydrolysate of unicorn leatherjacket skin system. J. Funct. Foods 2016, 23, 87–94. [Google Scholar] [CrossRef]
- Ameziane-El-Hassani, R.; Dupuy, C. Detection of Intracellular Reactive Oxygen Species (CM-H2DCFDA). Bio-protocol 2013, 3, e313. [Google Scholar] [CrossRef]
- Zhang, Q.; Tong, X.; Qi, B.; Wang, Z.; Li, Y.; Sui, X.; Jiang, L. Changes in antioxidant activity of Alcalase-hydrolyzed soybean hydrolysate under simulated gastrointestinal digestion and transepithelial transport. J. Funct. Foods 2018, 42, 298–305. [Google Scholar] [CrossRef]
- Barzegar, A.; Moosavi-Movahedi, A.A. Intracellular ROS protection efficiency and free radical-scavenging activity of curcumin. PLoS ONE 2011, 6, e26012. [Google Scholar] [CrossRef] [PubMed]
- Kinsella, J.E.; Melachouris, N. Functional properties of proteins in foods: A survey. Crit. Rev. Food Sci. Nutr. 1976, 7, 219–280. [Google Scholar] [CrossRef]
- Hettiarachchy, N.; Griffin, V.; Gnanasambandam, R. Reparation and functional properties of a protein isolate from defatted wheat germ. Cereal Chem. 1996, 73, 364–367. [Google Scholar]
- Yong, Y.H.; Yamaguchi, S.; Gu, Y.S.; Mori, T.; Matsumura, Y. Effects of enzymatic deamidation by protein-glutaminase on structure and functional properties of α-zein. J. Agric. Food Chem. 2004, 52, 7094–7100. [Google Scholar] [CrossRef]
- Agyare, K.K.; Addo, K.; Xiong, Y.L. Emulsifying and foaming properties of transglutaminase-treated wheat gluten hydrolysate as influenced by pH, temperature and salt. Food Hydrocoll. 2009, 23, 72–81. [Google Scholar] [CrossRef]
- Van Teeffelen, A.M.; Broersen, K.; de Jongh, H.H. Glucosylation of β-lactoglobulin lowers the heat capacity change of unfolding; a unique way to affect protein thermodynamics. Protein Sci. 2005, 14, 2187–2194. [Google Scholar] [CrossRef]
- Agyare, K.K.; Damodaran, S. pH-stability and thermal properties of microbial transglutaminase-treated whey protein isolate. J. Agric. Food Chem. 2010, 58, 1946–1953. [Google Scholar] [CrossRef]


| Functional Property | CGM | CGM Hydrolysates | Cross-linked CGM Hydrolysates | GlcN-CGM Hydrolysates |
|---|---|---|---|---|
| Glucosamine (g/kg protein) | 0 | 0 | 0 | 23.0 ± 0.11 |
| Surface hydrophobicity | 8.1 ± 0.45 a | 28.1 ± 0.85 d | 20.4 ± 1.49 c | 16.3 ± 0.77 b |
| Emulsifying activity index (m2/g protein) | 28.2 ± 1.2 a | 28.1 ± 2.2 a | 57.1 ± 3.4 c | 36.0 ± 2.3 b |
| Emulsion stability index (%) | 39.0 ± 2.2 a | 63.4 ± 4.2 b | 70.7±2.8 c | 74.9 ± 1.9 d |
© 2020 by the authors. Licensee MDPI, Basel, Switzerland. This article is an open access article distributed under the terms and conditions of the Creative Commons Attribution (CC BY) license (http://creativecommons.org/licenses/by/4.0/).
Share and Cite
Liu, X.-L.; Song, C.-L.; Chen, J.-P.; Liu, X.; Ren, J.; Zheng, X.-Q. Preparation and Evaluation of New Glycopeptides Obtained by Proteolysis from Corn Gluten Meal Followed by Transglutaminase-Induced Glycosylation with Glucosamine. Foods 2020, 9, 555. https://doi.org/10.3390/foods9050555
Liu X-L, Song C-L, Chen J-P, Liu X, Ren J, Zheng X-Q. Preparation and Evaluation of New Glycopeptides Obtained by Proteolysis from Corn Gluten Meal Followed by Transglutaminase-Induced Glycosylation with Glucosamine. Foods. 2020; 9(5):555. https://doi.org/10.3390/foods9050555
Chicago/Turabian StyleLiu, Xiao-Lan, Chun-Li Song, Jia-Peng Chen, Xiang Liu, Jian Ren, and Xi-Qun Zheng. 2020. "Preparation and Evaluation of New Glycopeptides Obtained by Proteolysis from Corn Gluten Meal Followed by Transglutaminase-Induced Glycosylation with Glucosamine" Foods 9, no. 5: 555. https://doi.org/10.3390/foods9050555
APA StyleLiu, X.-L., Song, C.-L., Chen, J.-P., Liu, X., Ren, J., & Zheng, X.-Q. (2020). Preparation and Evaluation of New Glycopeptides Obtained by Proteolysis from Corn Gluten Meal Followed by Transglutaminase-Induced Glycosylation with Glucosamine. Foods, 9(5), 555. https://doi.org/10.3390/foods9050555