High-Quality Gluten-Free Sponge Cakes without Sucrose: Inulin-Type Fructans as Sugar Alternatives

 ,
,  ,
,  , ,
, ,  ,
,
Abstract
1. Introduction
2. Materials and Methods
2.1. Ingredients of Gluten-Free Mini-Sponge Cakes
2.2. Preparation of Experimental Gluten-Free Mini-Sponge Cakes
2.3. Pasting Behaviour of Batters for Gluten-Free Mini-Sponge Cakes over Heating-Cooling Cycles Determined with the Rapid Visco Analyser (RVA)
2.4. Characteristics of Gluten-Free Mini-Sponge Cakes
2.4.1. Physical Parameters
2.4.2. Texture Profile Analysis
2.4.3. Instrumental Colour Analysis
2.4.4. Evaluation of Early, Advanced, and Final Stage of the Maillard Reaction
2.4.5. Sensory Evaluation
2.5. Statistical Analysis
3. Results and Discussion
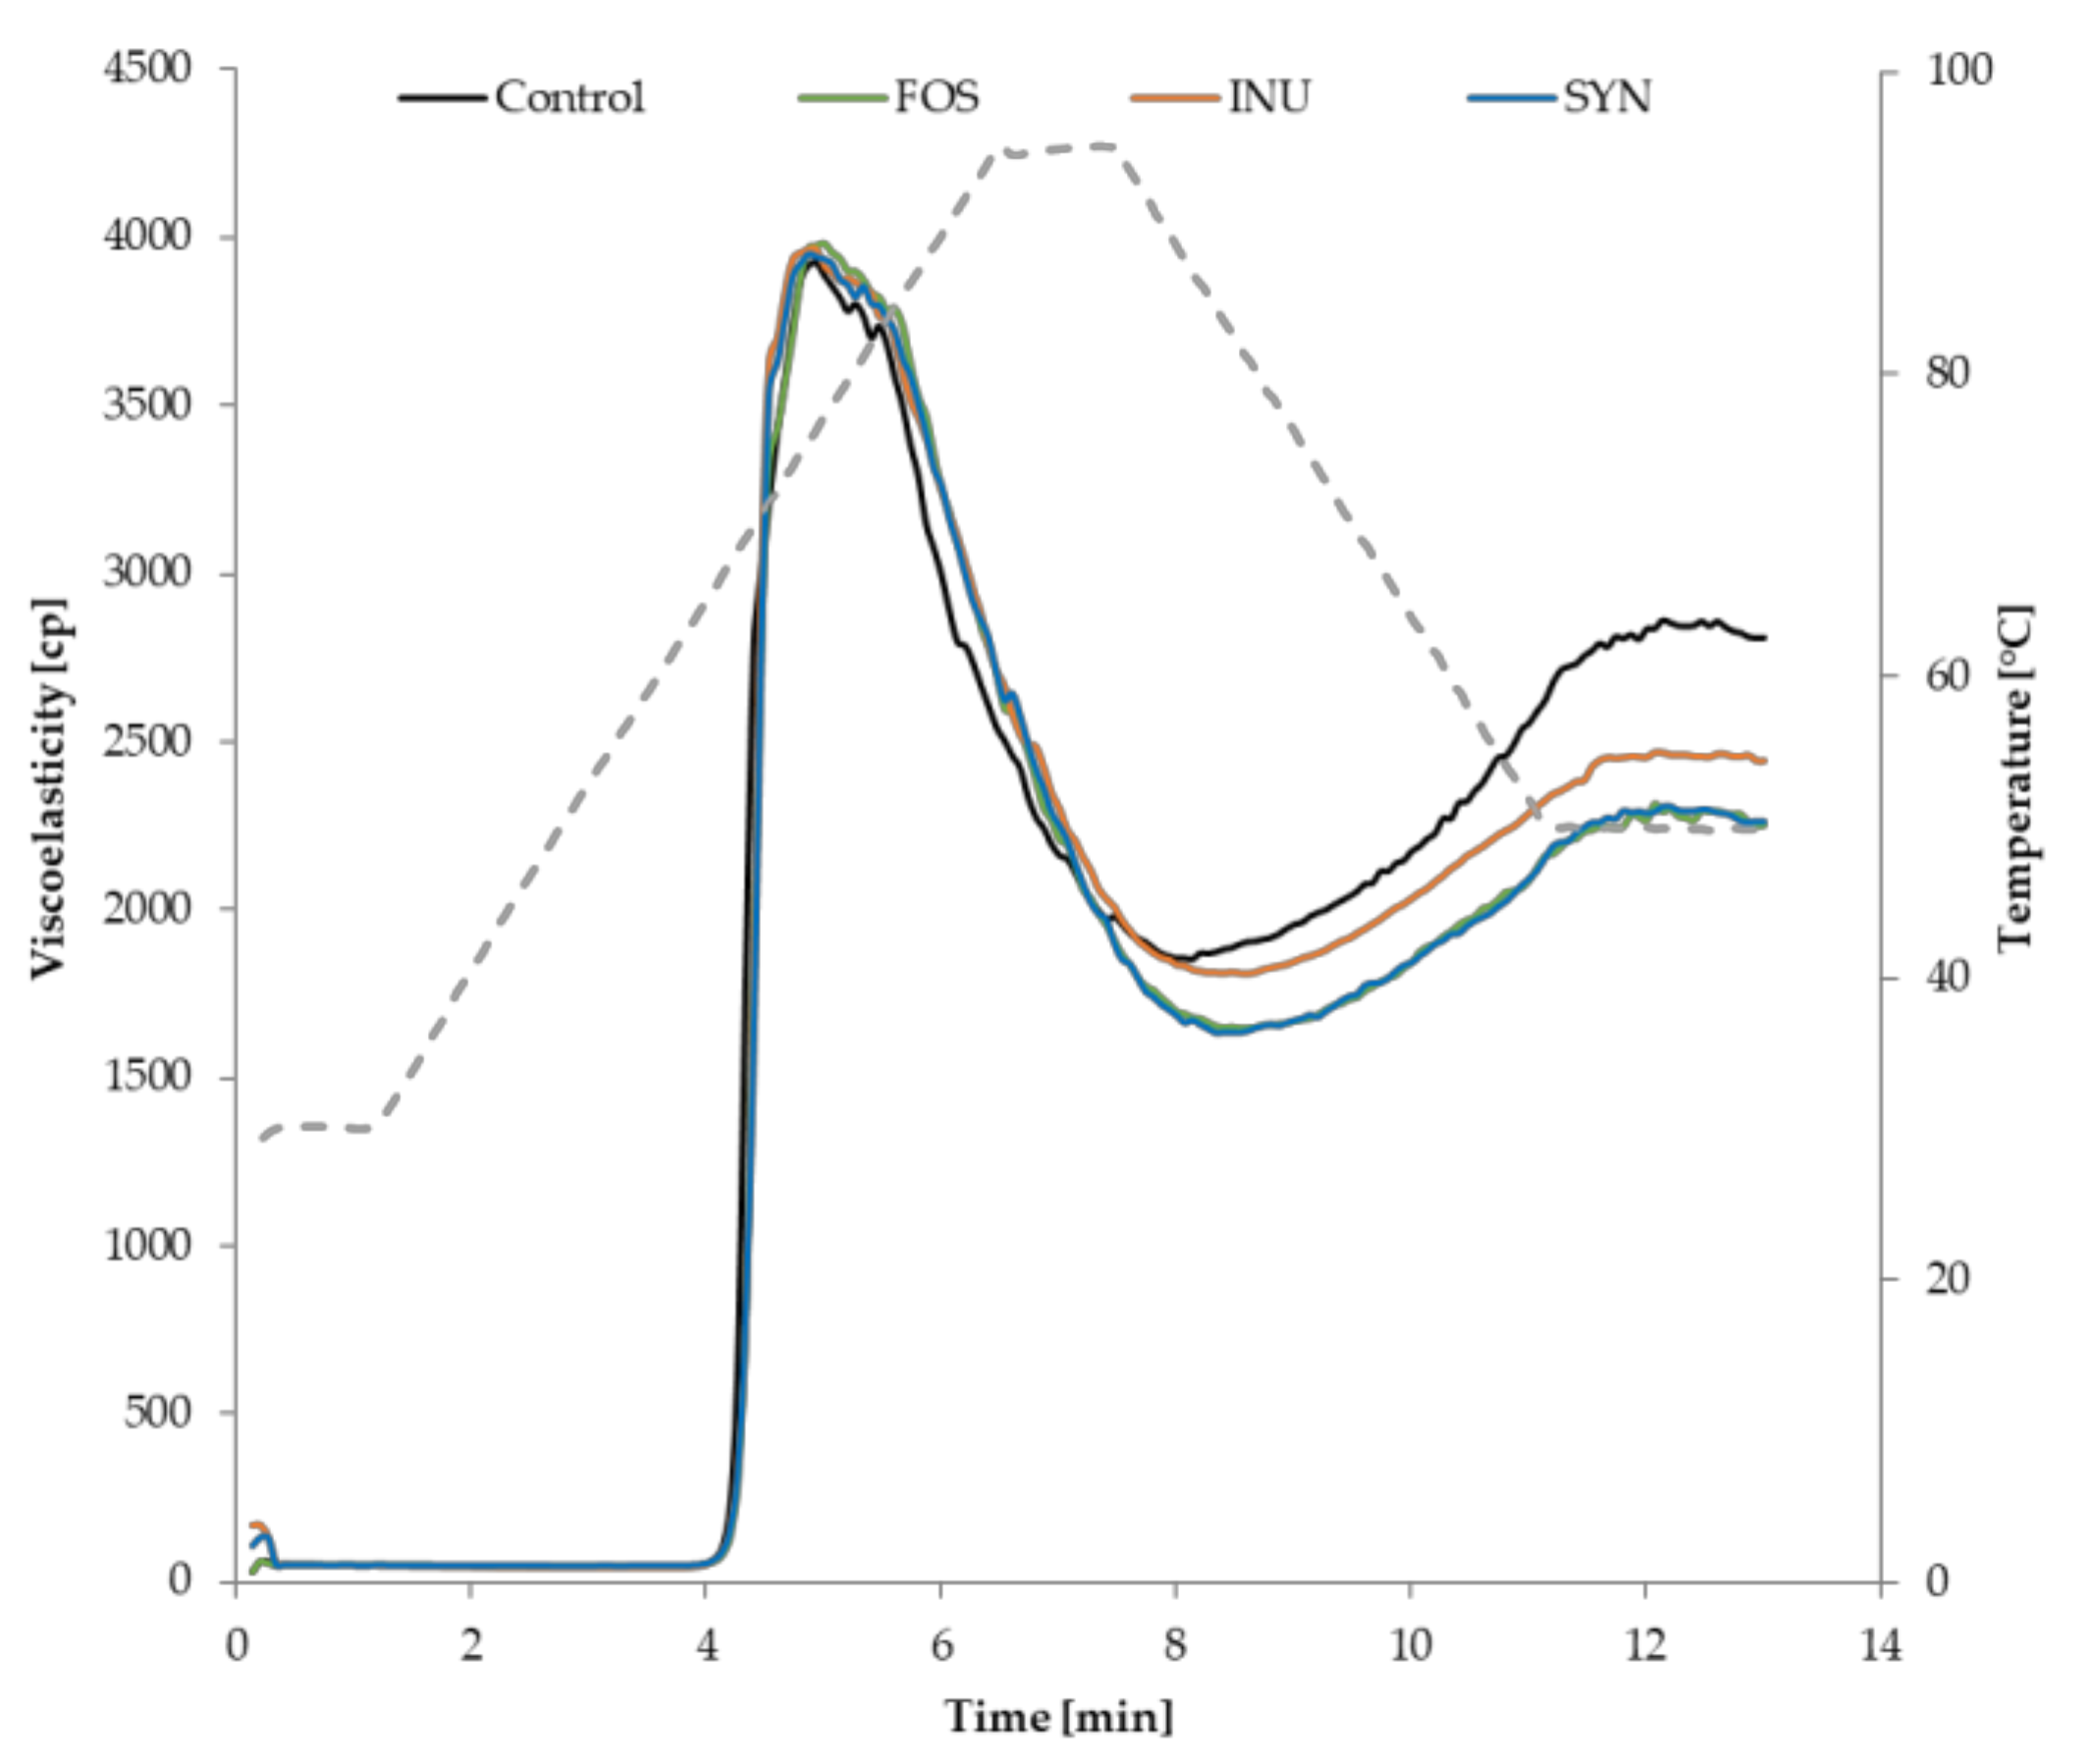
3.1. Pasting Behaviour of Batters for Gluten-Free Mini-Sponge Cakes
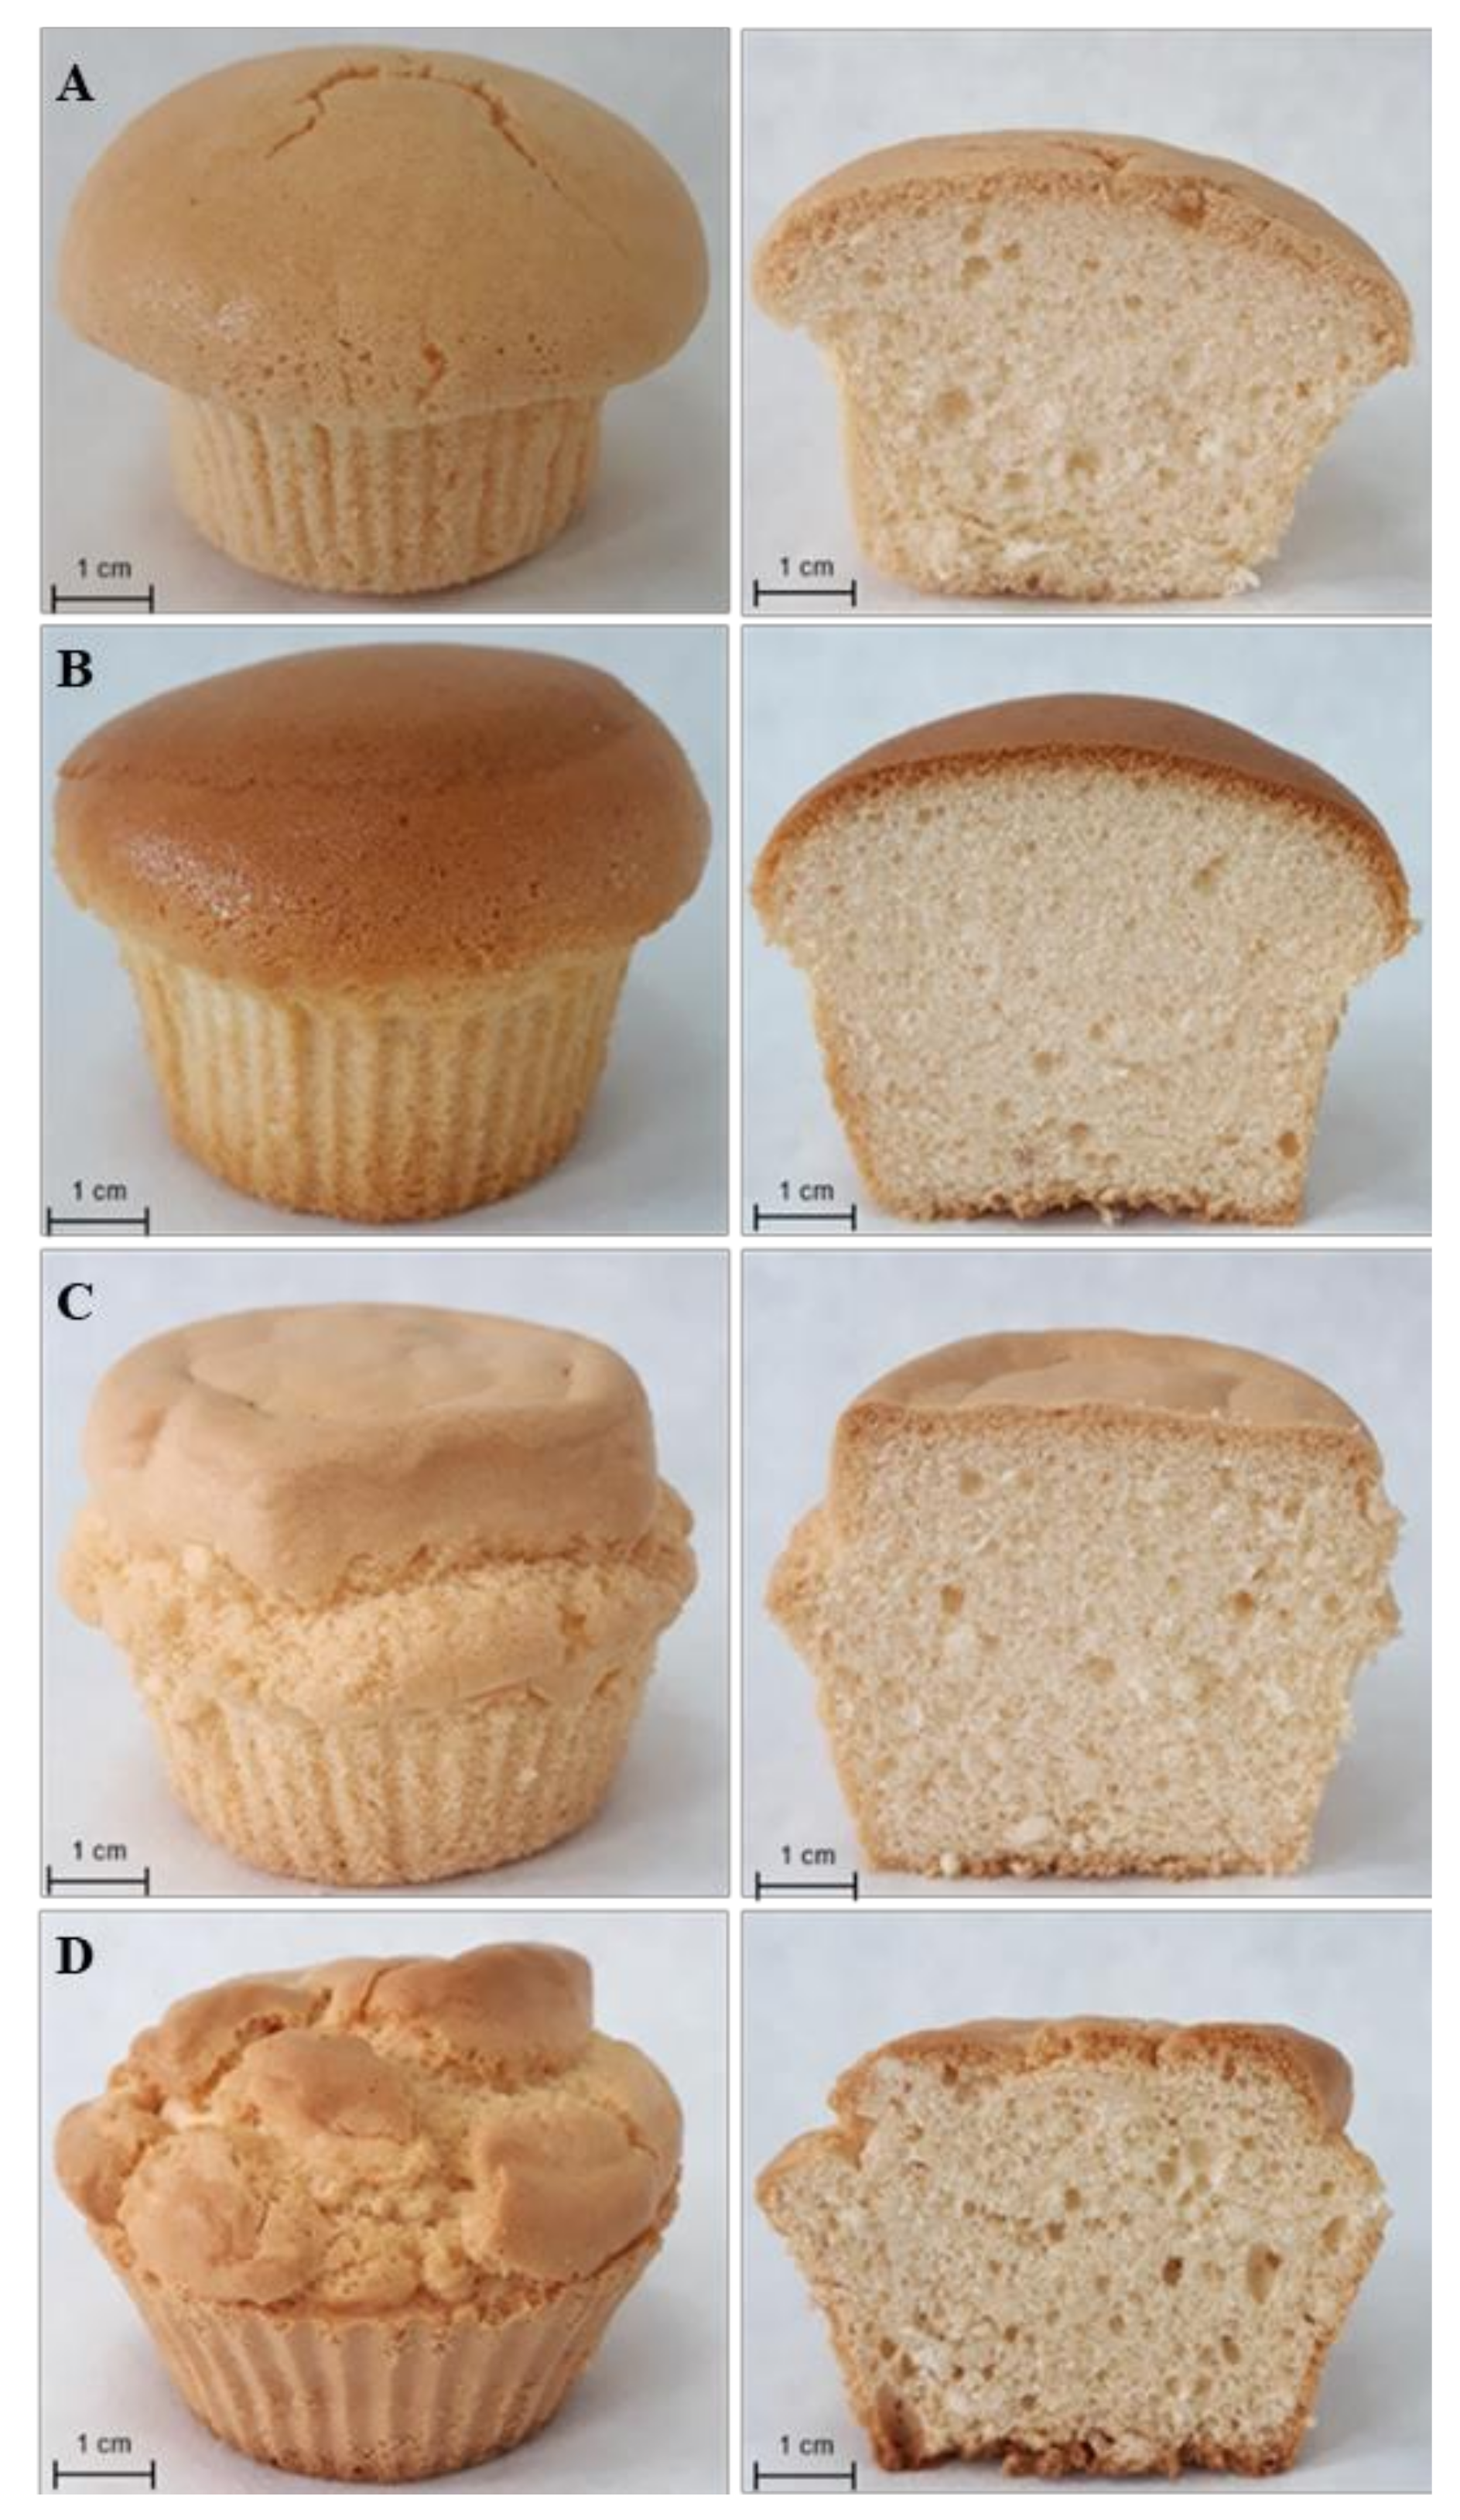
3.2. Physical Characteristics and Texture of Gluten-Free Mini-Sponge Cakes
4. Conclusions
Author Contributions
Funding
Conflicts of Interest
References
- Godefroidt, T.; Ooms, N.; Pareyt, B.; Brijs, K.; Delcour, J.A. Ingredient Functionality During Foam-Type Cake Making: A Review. Compr. Rev. Food Sci. Food Saf. 2019, 18, 1550–1562. [Google Scholar] [CrossRef]
- Psimouli, V.; Oreopoulou, V. The effect of alternative sweeteners on batter rheology and cake properties. J. Sci. Food Agric. 2012, 92, 99–105. [Google Scholar] [CrossRef]
- Welsh, J.A.; Sharma, A.; Cunningham, S.A.; Vos, M.B. Consumption of added sugars and indicators of cardiovascular disease risk among US adolescents. Circulation 2011, 123, 249–257. [Google Scholar] [CrossRef] [PubMed]
- Te Morenga, L.A.; Howatson, A.J.; Jones, R.M.; Mann, J. Dietary sugars and cardiometabolic risk: Systematic review and meta-analyses of randomized controlled trials of the effects on blood pressure and lipids. Am. J. Clin. Nutr. 2014, 100, 65–79. [Google Scholar] [CrossRef] [PubMed]
- Makarem, N.; Bandera, E.V.; Nicholson, J.M.; Parekh, N. Consumption of sugars, sugary foods, and sugary beverages in relation to cancer risk: A systematic review of longitudinal studies. Annu. Rev. Nutr. 2018, 38, 17–39. [Google Scholar] [CrossRef] [PubMed]
- Malik, V.S.; Schulze, M.B.; Hu, F.B. Intake of sugar sweetened beverages and weight gain: A systematic review. Am. J. Clin. Nutr. 2006, 84, 274–288. [Google Scholar] [CrossRef]
- Morris, M.J.; Beilharz, J.E.; Maniam, J.; Reichelt, A.C.; Westbrook, R.F. Why is obesity such a problem in the 21st century? The intersection of palatable food, cues and reward pathways, stress, and cognition. Neurosci. Biobehav. Rev. 2015, 58, 36–45. [Google Scholar] [CrossRef]
- Faruque, S.; Tong, J.; Lacmanovic, V.; Agbonghae, C.; Minaya, D.M.; Czaja, K. The Dose Makes the Poison: Sugar and Obesity in the United States. Pol. J. Food Nutr. Sci. 2019, 69, 219–233. [Google Scholar] [CrossRef]
- Ng, M.; Fleming, T.; Robinson, M.; Thomson, B.; Graetz, N.; Margono, C.; Mullany, E.C.; Biryukov, S.; Abbafati, C.; Abera, S.F.; et al. Global, regional, and national prevalence of overweight and obesity in children and adults during 1980–2013: A systematic analysis for the Global Burden of Disease Study 2013. Lancet 2014, 384, 766–781. [Google Scholar] [CrossRef]
- Tucker, E.; Rostami, K.; Prabhakaran, S.; Al Dulaimi, D. Patients with Coeliac Disease Are Increasingly Overweight or Obese on Presentation. J. Gastrointestin. Liver Dis. 2012, 21, 11–15. [Google Scholar]
- Mahmud, F.H.; Murray, J.A.; Kudva, Y.C.; Zinsmeister, A.R.; Dierkhising, R.A.; Lahr, B.D.; Dyck, P.J.; Kyle, R.A.; El-Youssef, M.; Burgart, L.J.; et al. Celiac Disease in Type 1 Diabetes Mellitus in a North American Community: Prevalence, Serologic Screening, and Clinical Features. Mayo Clin. Proc. 2005, 80, 1429–1434. [Google Scholar] [CrossRef] [PubMed]
- Assor, E.; Marcon, M.A.; Hamilton, N.; Fry, M.; Cooper, T.; Mahmud, F.H. Design of a Dietary Intervention to Assess the Impact of a Gluten-Free Diet in a Population with Type 1 Diabetes and Celiac Disease. BMC Gastroenterol. 2015, 15, 181. [Google Scholar] [CrossRef] [PubMed]
- Krupa-Kozak, U.; Lange, E. The gluten-free diet and glycaemic index in the management of coeliac disease associated with type 1 diabetes. Food Rev. Int. 2019, 35, 587–608. [Google Scholar] [CrossRef]
- Miranda, J.; Lasa, A.; Bustamante, M.A.; Churruca, I.; Simon, E. Nutritional Differences between a Gluten-Free Diet and a Diet Containing Equivalent Products with Gluten. Plant Foods Hum. Nutr. 2014, 69, 182–187. [Google Scholar] [CrossRef] [PubMed]
- Melini, V.; Melini, F. Gluten-Free Diet: Gaps and Needs for a Healthier Diet. Nutrients 2019, 11, 170. [Google Scholar] [CrossRef] [PubMed]
- Kulai, T.; Rashid, M. Assessment of Nutritional Adequacy of Packaged Gluten-Free Food Products. Can. J. Diet. Pract. Res. 2014, 75, 186–190. [Google Scholar] [CrossRef]
- Wild, D.; Robins, G.G.; Burley, V.J.; Howdle, P.D. Evidence of High Sugar Intake, and Low Fibre and Mineral Intake, in the Gluten-Free Diet. Aliment. Pharmacol. Ther. 2010, 32, 573–581. [Google Scholar] [CrossRef]
- Vici, G.; Belli, L.; Biondi, M.; Polzonetti, V. Gluten free diet and nutrient deficiencies: A review. Clin. Nutr. 2016, 35, 1236–1241. [Google Scholar] [CrossRef]
- Ronda, F.; Gomez, M.; Blanco, C.A.; Caballero, P.A. Effects of polyols and nondigestible oligosaccharides on the quality of sugar-free sponge cakes. Food Chem. 2005, 90, 549–555. [Google Scholar] [CrossRef]
- Carocho, M.; Morales, P.; Ferreira, I.C.F.R. Sweeteners as food additives in the XXI century: A review of what is known, and what is to come. Food Chem. Toxicol. 2017, 107, 302–317. [Google Scholar] [CrossRef]
- Chattopadhyay, S.; Raychaudhuri, U.; Chakraborty, R. Artificial sweeteners—A review. J. Food Sci. Technol. 2014, 51, 611–621. [Google Scholar] [CrossRef] [PubMed]
- George, V.; Arora, S.; Wadhwa, B.K.; Singh, A.K. Analysis of multiple sweeteners and their degradation products in lassi by HPLC and HPTLC plates. J. Food Sci. Technol. 2010, 47, 408–413. [Google Scholar] [CrossRef] [PubMed]
- Zahn, S.; Forker, A.; Krügel, L.; Rohm, H. Combined use of rebaudioside A and fibres for partial sucrose replacement in muffins. LWT Food Sci. Technol. 2013, 50, 665–670. [Google Scholar] [CrossRef]
- Gao, J.; Brennan, M.A.; Mason, S.L.; Brennan, C.S. Effect of sugar replacement with stevianna and inulin on the texture and predictive glycaemic response of muffins. Int. J. Food Sci. Technol. 2016, 51, 1979–1987. [Google Scholar] [CrossRef]
- Garvey, E.C.; O’Sullivan, M.G.; Kerry, J.P.; Milner, L.; Gallagher, E.; Kilcawley, K.N. Characterising the sensory quality and volatile aroma profile of clean-label sucrose reduced sponge cakes. Food Chem. 2020. [Google Scholar] [CrossRef]
- Gallagher, E.; Gormley, T.R.; Arendt, E.K. Crust and crumb characteristics of gluten free breads. J. Food Eng. 2003, 56, 153–161. [Google Scholar] [CrossRef]
- Drabińska, N.; Zieliński, H.; Krupa-Kozak, U. Technological benefits of inulin-type fructans application in gluten-free products—A review. Trends Food Sci. Technol. 2016, 56, 149–157. [Google Scholar] [CrossRef]
- Drabińska, N.; Rosell, C.M.; Krupa-Kozak, U. Inulin-Type Fructans Application in Gluten-Free Products: Functionality and Health Benefits. In Bioactive Molecules in Food, Reference Series in Phytochemistry; Mérillon, J.M., Ramawat, K., Eds.; Springer: Cham, Switzerland, 2018. [Google Scholar]
- Mensink, M.A.; Frijlink, H.W.; Maarschalk, K.V.; Hinrichs, W.L.J. Inulin, a flexible oligosaccharide I: Review of its physicochemical characteristics. Carbohydr. Polym. 2015, 130, 405–419. [Google Scholar] [CrossRef]
- Morais, E.C.; Cruz, A.G.; Faria, J.A.F.; Bolini, H.M.A. Prebiotic gluten-free bread: Sensory profiling and drivers of liking. Lebensm. Wiss. Technol. 2014, 55, 248–254. [Google Scholar] [CrossRef]
- Zahn, S.; Pepke, F.; Rohm, H. Effect of inulin as a fat replacer on texture and sensory properties of muffins. Int. J. Food Sci. Technol. 2010, 45, 2531–2537. [Google Scholar] [CrossRef]
- Krupa-Kozak, U.; Drabińska, N.; Rosell, C.M.; Fadda, C.; Anders, A.; Jeliński, T.; Ostaszyk, A. Broccoli leaf powder as an attractive by-product ingredient: Effect on batter behaviour, technological properties and sensory quality of gluten-free mini sponge cake. Int. J. Food Sci. Technol. 2019, 54, 1121–1129. [Google Scholar] [CrossRef]
- Hsu, C.L.; Chen, W.; Weng, Y.M.; Tseng, C.Y. Chemical composition, physical properties, and antioxidant activities of yam flours as affected by different drying methods. Food Chem. 2003, 83, 85–89. [Google Scholar] [CrossRef]
- Palou, E.; López-Malo, A.; Barbosa-Cánovas, G.V.; Welti-Chanes, J.; Swanson, B.G. Polyphenoloxidase activity and color of blanched and high hydrostatic pressure treated banana puree. J. Food Sci. 1999, 64, 42–45. [Google Scholar] [CrossRef]
- Mokrzycki, W.S.; Tatol, M. Color difference Delta E—A survey. Mach. Graph. Vis. 2011, 20, 383–411. [Google Scholar]
- Michalska, A.; Amigo-Benavent, M.; Zielinski, H.; del Castillo, M.D. Effect of bread making on formation of Maillard reaction products contributing to the overall antioxidant activity of rye bread. J. Cereal Sci. 2008, 48, 123–132. [Google Scholar] [CrossRef]
- Zieliński, H.; del Castillo, M.D.; Przygodzka, M.; Ciesarova, Z.; Kukurova, K.; Zielińska, D. Changes in chemical composition and antioxidative properties of rye ginger cakes during their shelf-life. Food Chem. 2012, 135, 2965–2973. [Google Scholar] [CrossRef]
- ISO. 8586–1: Sensory Analysis—General Guidance for the Selection, Training and Monitoring of Assessors—Part 1: Selected Assessors; ISO: Geneva, Switzerland, 1993. [Google Scholar]
- Lawless, H.T.; Heymann, H. Sensory Evaluation of Food—Principles and Practices; Springer: New York, NY, USA, 2010. [Google Scholar]
- ISO/DIS. 13299: Sensory Analysis—Methodology—General Guidance for Establishing a Sensory Profile; ISO: Geneva, Switzerland, 1998. [Google Scholar]
- ISO. 8589: Sensory Analysis—General Guidance for the Design of Test Rooms; ISO: Geneva, Switzerland, 1998. [Google Scholar]
- Rosell, C.M.; Collar, C. Effect of temperature and consistency on wheat dough performance. Int. J. Food Sci. Technol. 2009, 44, 493–502. [Google Scholar] [CrossRef]
- Andrade, F.J.E.T.; Albuquerque, P.B.S.; Moraes, G.M.D.; Farias, M.D.P.; Teixeira-Sá, D.M.A.; Vicente, A.A.; Carneiro-da-Cunha, M.G. Influence of hydrocolloids (galactomannan and xanthan gum) on the physicochemical and sensory characteristics of gluten-free cakes based on fava beans (Phaseolus lunatus). Food Funct. 2018, 9, 6369–6379. [Google Scholar] [CrossRef]
- Marco, C.; Rosell, C.M. Effect of different protein isolates and transglutaminase on rice flour properties. J. Food Eng. 2008, 84, 132–139. [Google Scholar] [CrossRef]
- Gularte, M.A.; de la Hera, E.; Gómez, M.; Rosell, C.M. Effect of different fibers on batter and gluten-free layer cake properties. Lebensm. Wiss. Technol. 2012, 48, 209–214. [Google Scholar] [CrossRef]
- Conforti, F.D. Cake manufacture. In Bakery Products: Science and Technology, 2nd ed.; Hui, Y.H., Corke, H., De Leyn, I., Nip, W., Cross, N.A., Eds.; Wiley-Blackwell: Ames, IA, USA, 2014; pp. 565–584. [Google Scholar]
- Mondal, A.; Dutta, A.K. Bread baking—A review. J. Food Eng. 2008, 86, 465–474. [Google Scholar] [CrossRef]
- Lostie, M.; Peczalski, R.; Andrieu, J. Lumped model for sponge cake baking during the ‘‘crust and crumb’’ period. J. Food Eng. 2004, 65, 281–286. [Google Scholar] [CrossRef]
- Purlis, E.; Salvadori, V.O. Bread baking as a moving boundary problem. Part 1: Mathematical modelling. J. Food Eng. 2009, 91, 428–433. [Google Scholar] [CrossRef]
- Dhingra, D.; Michael, M.; Rajput, H.; Patil, R.T. Dietary fibre in foods: A review. J. Food Sci. Technol. 2012, 49, 255–266. [Google Scholar] [CrossRef] [PubMed]
- Rodríguez-García, J.; Salvador., A.; Hernando., I. Replacing Fat and Sugar with Inulin in Cakes: Bubble Size Distribution. Physical and Sensory Properties. Food Bioprocess Technol. 2014, 7, 964–974. [Google Scholar]
- Chiavaro, E.; Vittadini, E.; Corradini, C. Physicochemical characterization and stability of inulin gels. Eur. Food Res. Technol. 2007, 225, 85–94. [Google Scholar] [CrossRef]
- Ziobro, R.; Korus, J.; Juszczak, L.; Witczak, T. Influence of inulin on physical characteristics and staling rate of gluten-free bread. J. Food Eng. 2013, 116, 21–27. [Google Scholar] [CrossRef]
- Starowicz, M.; Zieliński, H. How Maillard Reaction Influences Sensorial Properties (Color, Flavor and Texture) of Food Products? Food Rev. Int. 2019, 35, 707–725. [Google Scholar] [CrossRef]
- Pérez-Quirce, S.; Collar, C.; Ronda, F. Significance of healthy viscous dietary fibres on the performance of gluten-free rice-based formulated breads. Int. J. Food Sci. Technol. 2014, 49, 1375–1382. [Google Scholar] [CrossRef]
- Przygodzka, M.; Zieliński, H.; Ciesarová, Z.; Kukurová, K.; Lamparski, G. Effect of selected spices on chemical and sensory markers in fortified rye-buckwheat cakes. Food Sci. Nutr. 2016, 4, 651–660. [Google Scholar] [CrossRef]
- Tamanna, N.; Mahmood, N. Food Processing and Maillard Reaction Products Effect on Human Health and Nutrition. J. Food Chem. 2015. [Google Scholar] [CrossRef] [PubMed]
- Baryłko-Pikielna, N. Sensoryczne Badania Żywności: Podstawy, Metody, Zastosowania; Polskie Towarzystwo Technologii Żywności; Wydawnictwo Naukowe PTTŻ: Kraków, Poland, 2009. [Google Scholar]
- Sahi, S.S. Interfacial properties of the aqueous phases of wheat flour doughs. J. Cereal Sci. 1994, 20, 119–127. [Google Scholar] [CrossRef]
- Meullenet, J.F.; Lyon, B.G.; Carpenter, J.A.; Lyon, C.E. Relation between sensory and instrumental texture profile attributes. J. Sens. Stud. 1998, 77–93. [Google Scholar] [CrossRef]
- Szczesniak, A.S. Texture profile analysis—Methodology interpretation clarified. J. Food Sci. 1995, 6, 60. [Google Scholar]
- Lyon, B.G.; Champagne, E.T.; Vinyard, B.T.; Windham, W.R. Sensory and Instrumental Relationships of Texture of Cooked Rice from Selected Cultivars and Postharvest Handling Practices. Cereal Chem. 2000, 77, 64–69. [Google Scholar] [CrossRef]


| Ingredient [%] | Control | FOS | INU | SYN |
|---|---|---|---|---|
| Potato starch | 30.6 | 30.6 | 30.6 | 30.6 |
| Corn starch | 7.8 | 7.8 | 7.8 | 7.8 |
| Egg | 43.0 | 43.0 | 43.0 | 43.0 |
| Sugar | 14.0 | - | - | - |
| FOS | - | 14.0 | - | - |
| INU | - | - | 14.0 | - |
| SYN | - | - | - | 14.0 |
| Sunflower oil | 3.7 | 3.7 | 3.7 | 3.7 |
| Salt | 0.2 | 0.2 | 0.2 | 0.2 |
| Gluten-free baking powder | 0.7 | 0.7 | 0.7 | 0.7 |
| Attribute | Definition | Scale Edges | |
|---|---|---|---|
| Appearance | Creamy colour | colour intensity (colour intensity according to colour pattern RAL 075 90 20—scale value 5) | light–dark |
| Pore collocation | a visual impression of the arrangement of crumb pores | irregular–regular | |
| Pore dimension | a visual impression of the size of crumb pores | small–big | |
| Aroma | Sponge cake | the typical odour of sponge cake | none—very intensive |
| Sweet | aroma typical of sweet baked products from wheat flour | none—very intensive | |
| Taste | Sponge cake | as the corresponding odour (measured in the mouth) | none—very intensive |
| Sweet | basic taste (3% sucrose dissolved in water) | none—very intensive | |
| Aftertaste | lingering sensation after swallowing the sample | none—very intensive | |
| Texture (manual) | Elasticity | the extent to which a piece of product returns to its original length when pushed by a finger | small–big |
| Texture (in mouth) | Crustiness | degree of friability released by the sample | small–big |
| Chewiness | the multiplicity of chewing the product to prepare it to swallow | low–high | |
| Adhesiveness | degree of adhesiveness perceived while chewing the sample 10 times | low–high | |
| Overall quality | overall quality including all attributes and their harmonisation | low–high | |
| Control | FOS | INU | SYN | |
|---|---|---|---|---|
| Onset temperature (°C) 1 | 64 ± 1 ab | 64 ± 1 a | 63 ± 1 b | 64 ± 1 a |
| Peak temperature (°C) | 77 ± 1 | 77 ± 1 | 76 ± 1 | 77 ± 1 |
| Peak viscosity PV (cP) | 3937 ± 16 | 4014 ± 80 | 3975 ± 122 | 3973 ± 54 |
| HPV (cP) | 1856 ± 15 a | 1648 ± 54 b | 1808 ± 43 a | 1633 ± 61 b |
| Breakdown (cP) | 2080 ± 1 b | 2366 ± 26 a | 2167 ± 84 b | 2339 ± 15 a |
| Final CPV (cP) | 2846 ± 50 a | 2253 ± 68 c | 2445 ± 67 b | 2265 ± 57 c |
| Setback (cP) | 991 ± 64 a | 605 ± 14 c | 637 ± 30 b | 632 ± 5 c |
| Control | FOS | INU | SYN | |
|---|---|---|---|---|
| Weight (g) 1 | 22.45 ± 0.57 b | 23.13 ± 0.32 a | 23.31 ± 0.13 a | 23.23 ± 0.11 a |
| Height (mm) | 49.0 ± 0.52 | 51.3 ± 0.30 | 51.0 ± 0.36 | 48.0 ± 0.10 |
| Baking weight loss (%) | 25.18 ± 1.92 a | 22.89 ± 1.05 b | 22.31 ± 0.44 b | 22.58 ± 0.37 b |
| Textural parameters | ||||
| Hardness (N) | 32.22 ± 2.49 c | 37.45 ± 2.74 c | 62.92 ± 3.473 a | 51.54 ± 6.639 b |
| Springiness (%) | 0.87 ± 0.03 a | 0.79 ± 0.02 b | 0.81 ± 0.02 b | 0.81 ± 0.03 b |
| Cohesiveness | 0.49 ± 0.01 a | 0.33 ± 0.02 b | 0.15 ± 0.02 c | 0.17 ± 0.03 c |
| Gumminess | 1.60 ± 0.11 d | 12.22 ± 0.63 a | 10.43 ± 0.90 b | 8.56 ± 0.76 c |
| Chewiness | 1.40 ± 0.10 c | 9.67 ± 0.66 a | 7.70 ± 0.95 b | 6.49 ± 0.96 b |
| Resilience | 0.15 ± 0.01 a | 0.08 ± 0.01 b | 0.05 ± 0.01 c | 0.06 ± 0.01 c |
| Crust colour | ||||
| L* | 64.64 ± 2.82 b | 49.53 ± 0.12 d | 70.69 ± 0.95 a | 59.71 ± 0.47 c |
| a* | 13.26 ± 0.84 c | 17.64 ± 0.20 a | 12.09 ± 0.19 d | 15.72 ± 0.13 b |
| b* | 35.58 ± 0.95 a | 34.14 ± 0.49 bc | 33.71 ± 0.54 c | 36.09 ± 0.19 a |
| BI | 92.21 ± 5.94 c | 133.30 ± 2.56 a | 75.66 ± 0.70 d | 107.36 ± 1.46 b |
| ΔE | 6.44 | 15.8 | 5.53 | |
| Crumb colour | ||||
| L* | 82.74 ± 0.58 b | 84.01 ± 0.64 a | 82.42 ± 0.49 b | 81.23 ± 0.92 c |
| a* | 2.01 ± 0.11 d | 3.22 ± 0.14 b | 2.65 ± 0.14 c | 4.59 ± 0.19 a |
| b* | 22.75 ± 0.80 c | 24.95 ± 0.64 b | 24.15 ± 0.54 b | 28.84 ± 0.24 a |
| WI | 71.37 ± 0.65 a | 70.18 ± 0.48 b | 70.01 ± 0.67 b | 65.28 ± 0.62 c |
| ΔE | 1.57 | 2.82 | 6.79 |
| Control | FOS | INU | SYN | |
|---|---|---|---|---|
| Available lysine (mg/g) 1 | 12.50 ± 0.42 a | 12.51 ± 0.17 a | 9.88 ± 0.06 b | 9.31 ± 0.09 b |
| FIC (FI) | 28.05 ± 0.60 bc | 20.16 ± 0.17 c | 50.14 ± 1.94 a | 38.56 ± 1.87 b |
| TRP (FI) | 18.00 ± 0.09 d | 16.02 ± 0.03 c | 20.52 ± 0.78 a | 19.44 ± 0.04 b |
| FAST index (%) | 123 ± 5.56 c | 175 ± 1.08 b | 245 ± 11.28 a | 203 ± 19.94 b |
| Melanoidins (AU) | 0.758 ± 0.011 b | 0.921 ± 0.012 a | 0.504 ± 0.005 c | 0.775 ± 0.020 b |
| Attribute | Control | FOS | INU | SYN | |
|---|---|---|---|---|---|
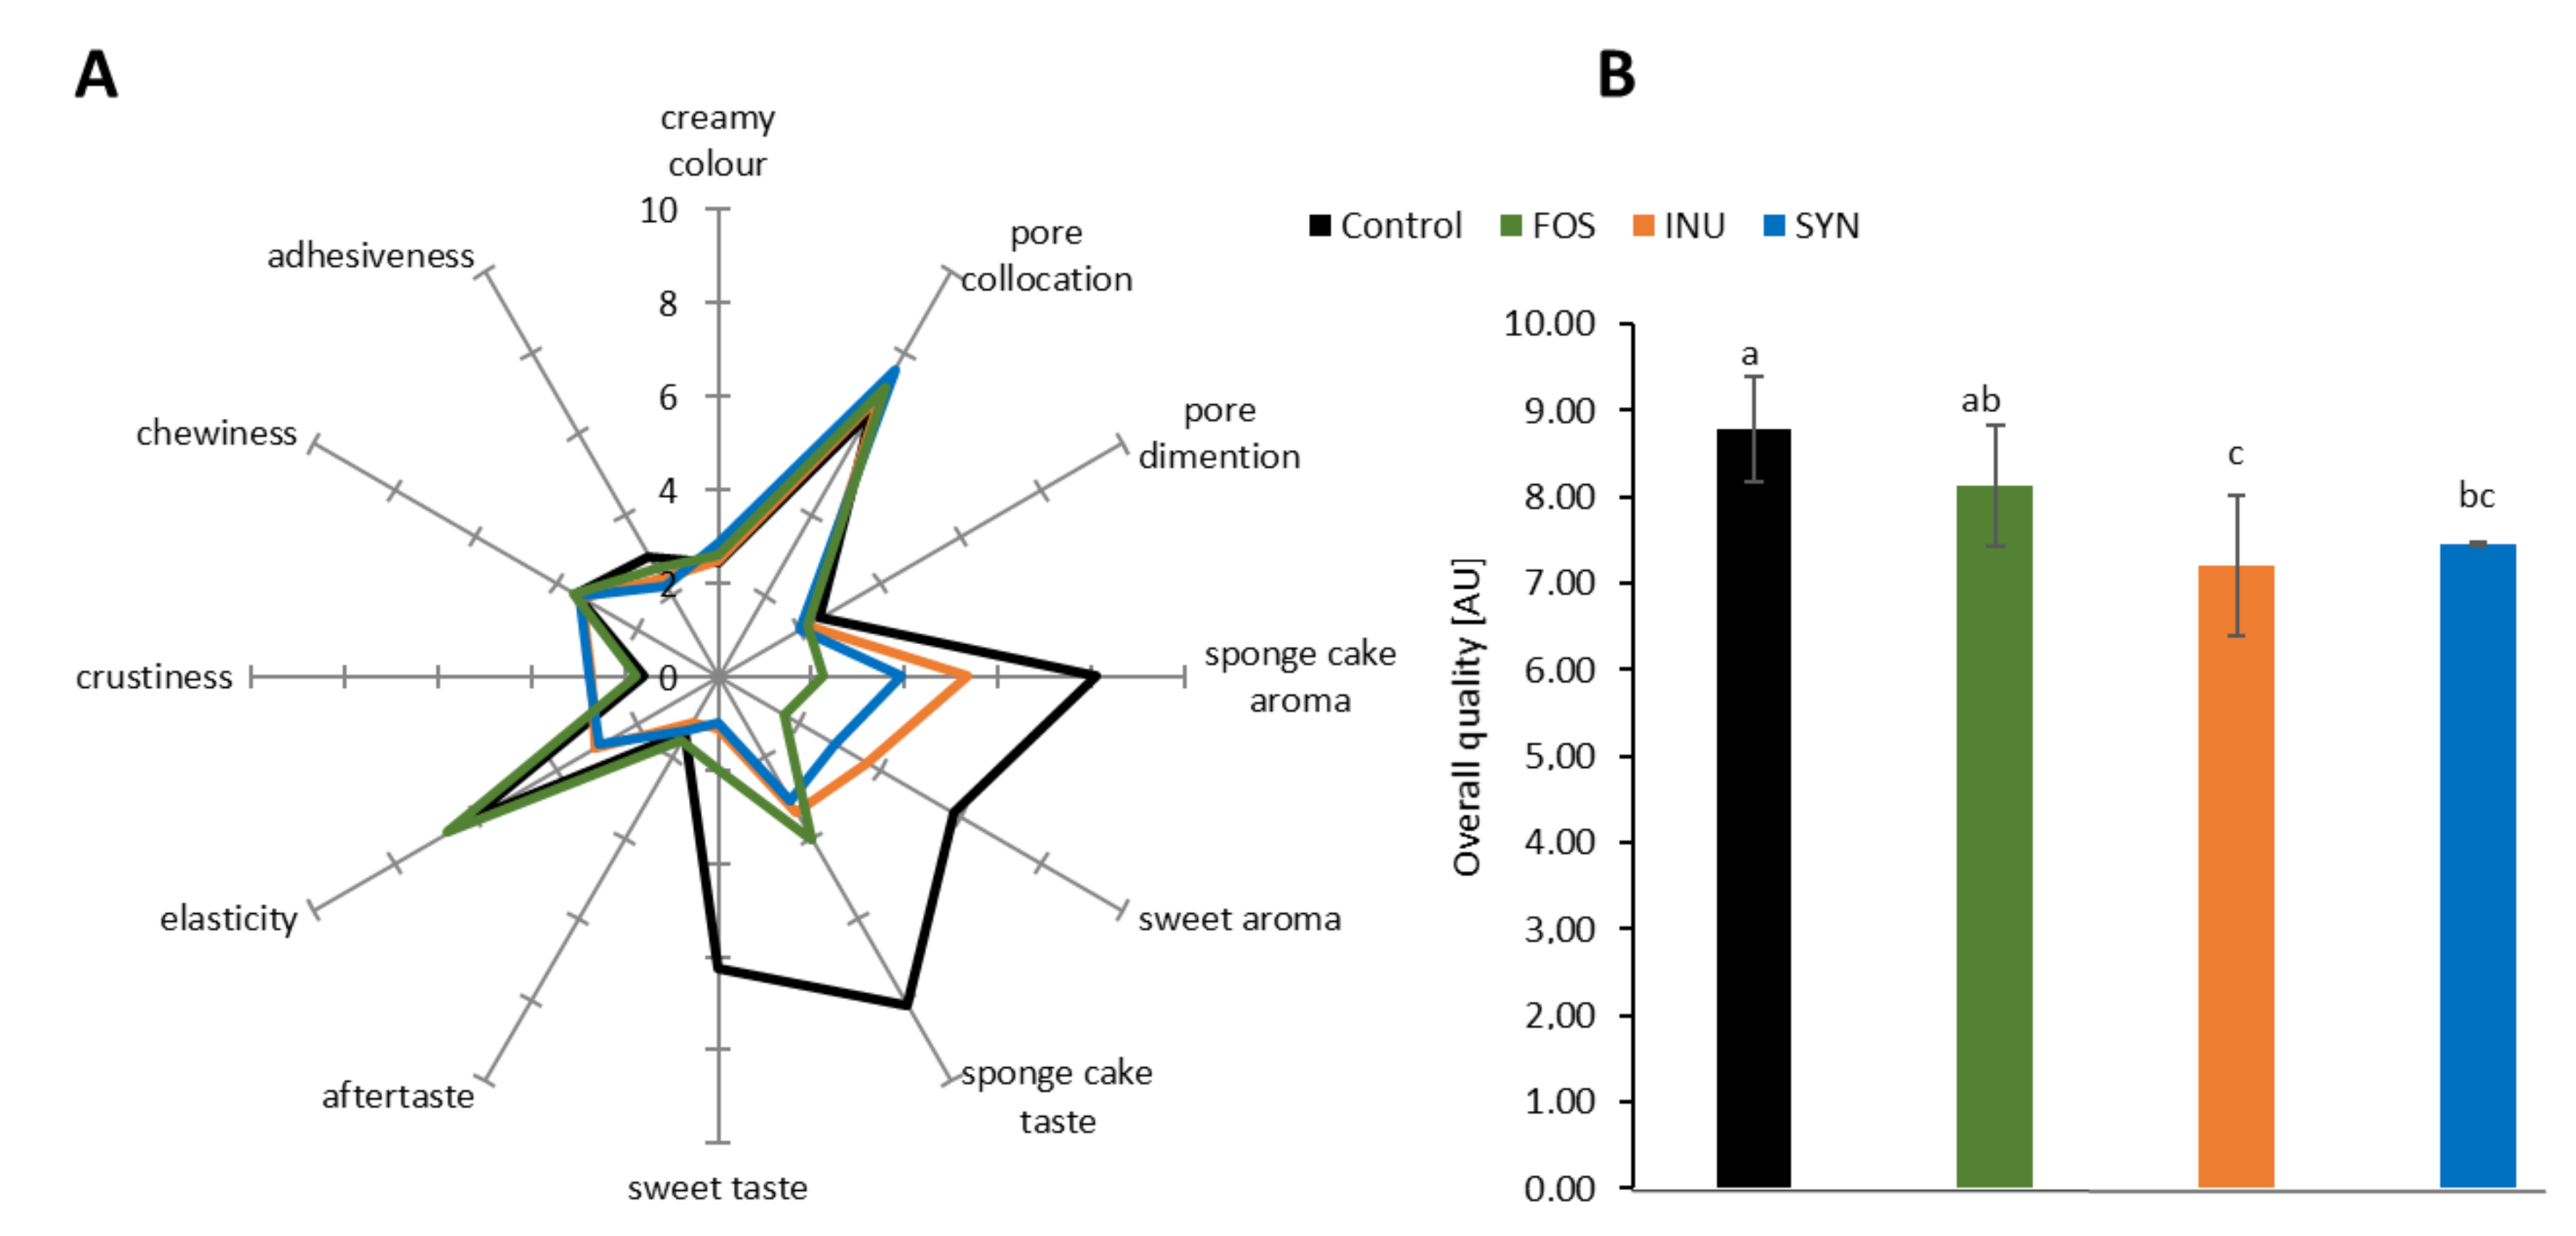
| Appearance | creamy colour | 2.42 ± 0.53 | 2.59 ± 0.62 | 2.48 ± 0.54 | 2.86 ± 0.63 |
| pore collocation | 6.59 ± 1.59 | 7.16 ± 1.87 | 7.02 ± 0.83 | 7.56 ± 1.20 | |
| pore dimension | 2.51 ± 1.34 | 2.20 ± 1.95 | 2.18 ± 0.47 | 2.03 ± 0.72 | |
| Aroma | sponge cake | 8.11 ± 1.07 a | 2.26 ± 0.85 d | 5.34 ± 2.04 b | 3.91 ± 1.32 c |
| sweet | 5.82 ± 1.96 a | 1.64 ± 0.92 c | 3.69 ± 2.32 b | 2.88 ± 1.59 bc | |
| Taste | sponge cake | 8.12 ± 0.95 a | 4.04 ± 2.31 b | 3.34 ± 0.89 b | 3.05 ± 1.35 b |
| sweet | 6.26 ± 1.48 a | 1.98 ± 1.20 b | 1.09 ± 0.76 b | 0.99 ± 0.80 b | |
| aftertaste | 1.39 ± 0.61 | 1.59 ± 0.96 | 1.13 ± 0.68 | 1.31 ± 0.71 | |
| Texture (manual) | elasticity | 6.18 ± 0.48 a | 6.69 ± 1.61 a | 3.04 ± 0.92 b | 2.92 ± 1.18 b |
| Texture (in mouth) | crustiness | 1.58 ± 0.24 b | 1.77 ± 0.53 b | 2.72 ± 0.98 a | 2.76 ± 0.82 a |
| chewiness | 3.54 ± 0.44 | 3.58 ± 0.54 | 3.36 ± 0.82 | 3.43 ± 0.93 | |
| adhesiveness | 2.98 ± 0.78 | 2.67 ± 0.67 | 2.41 ± 0.76 | 2.24 ± 0.90 | |
Publisher’s Note: MDPI stays neutral with regard to jurisdictional claims in published maps and institutional affiliations. |
© 2020 by the authors. Licensee MDPI, Basel, Switzerland. This article is an open access article distributed under the terms and conditions of the Creative Commons Attribution (CC BY) license (http://creativecommons.org/licenses/by/4.0/).
Share and Cite
Krupa-Kozak, U.; Drabińska, N.; Rosell, C.M.; Piłat, B.; Starowicz, M.; Jeliński, T.; Szmatowicz, B. High-Quality Gluten-Free Sponge Cakes without Sucrose: Inulin-Type Fructans as Sugar Alternatives. Foods 2020, 9, 1735. https://doi.org/10.3390/foods9121735
Krupa-Kozak U, Drabińska N, Rosell CM, Piłat B, Starowicz M, Jeliński T, Szmatowicz B. High-Quality Gluten-Free Sponge Cakes without Sucrose: Inulin-Type Fructans as Sugar Alternatives. Foods. 2020; 9(12):1735. https://doi.org/10.3390/foods9121735
Chicago/Turabian StyleKrupa-Kozak, Urszula, Natalia Drabińska, Cristina M. Rosell, Beata Piłat, Małgorzata Starowicz, Tomasz Jeliński, and Beata Szmatowicz. 2020. "High-Quality Gluten-Free Sponge Cakes without Sucrose: Inulin-Type Fructans as Sugar Alternatives" Foods 9, no. 12: 1735. https://doi.org/10.3390/foods9121735
APA StyleKrupa-Kozak, U., Drabińska, N., Rosell, C. M., Piłat, B., Starowicz, M., Jeliński, T., & Szmatowicz, B. (2020). High-Quality Gluten-Free Sponge Cakes without Sucrose: Inulin-Type Fructans as Sugar Alternatives. Foods, 9(12), 1735. https://doi.org/10.3390/foods9121735