Milk Protein Fractionation by Means of Spiral-Wound Microfiltration Membranes: Effect of the Pressure Adjustment Mode and Temperature on Flux and Protein Permeation


 and
and 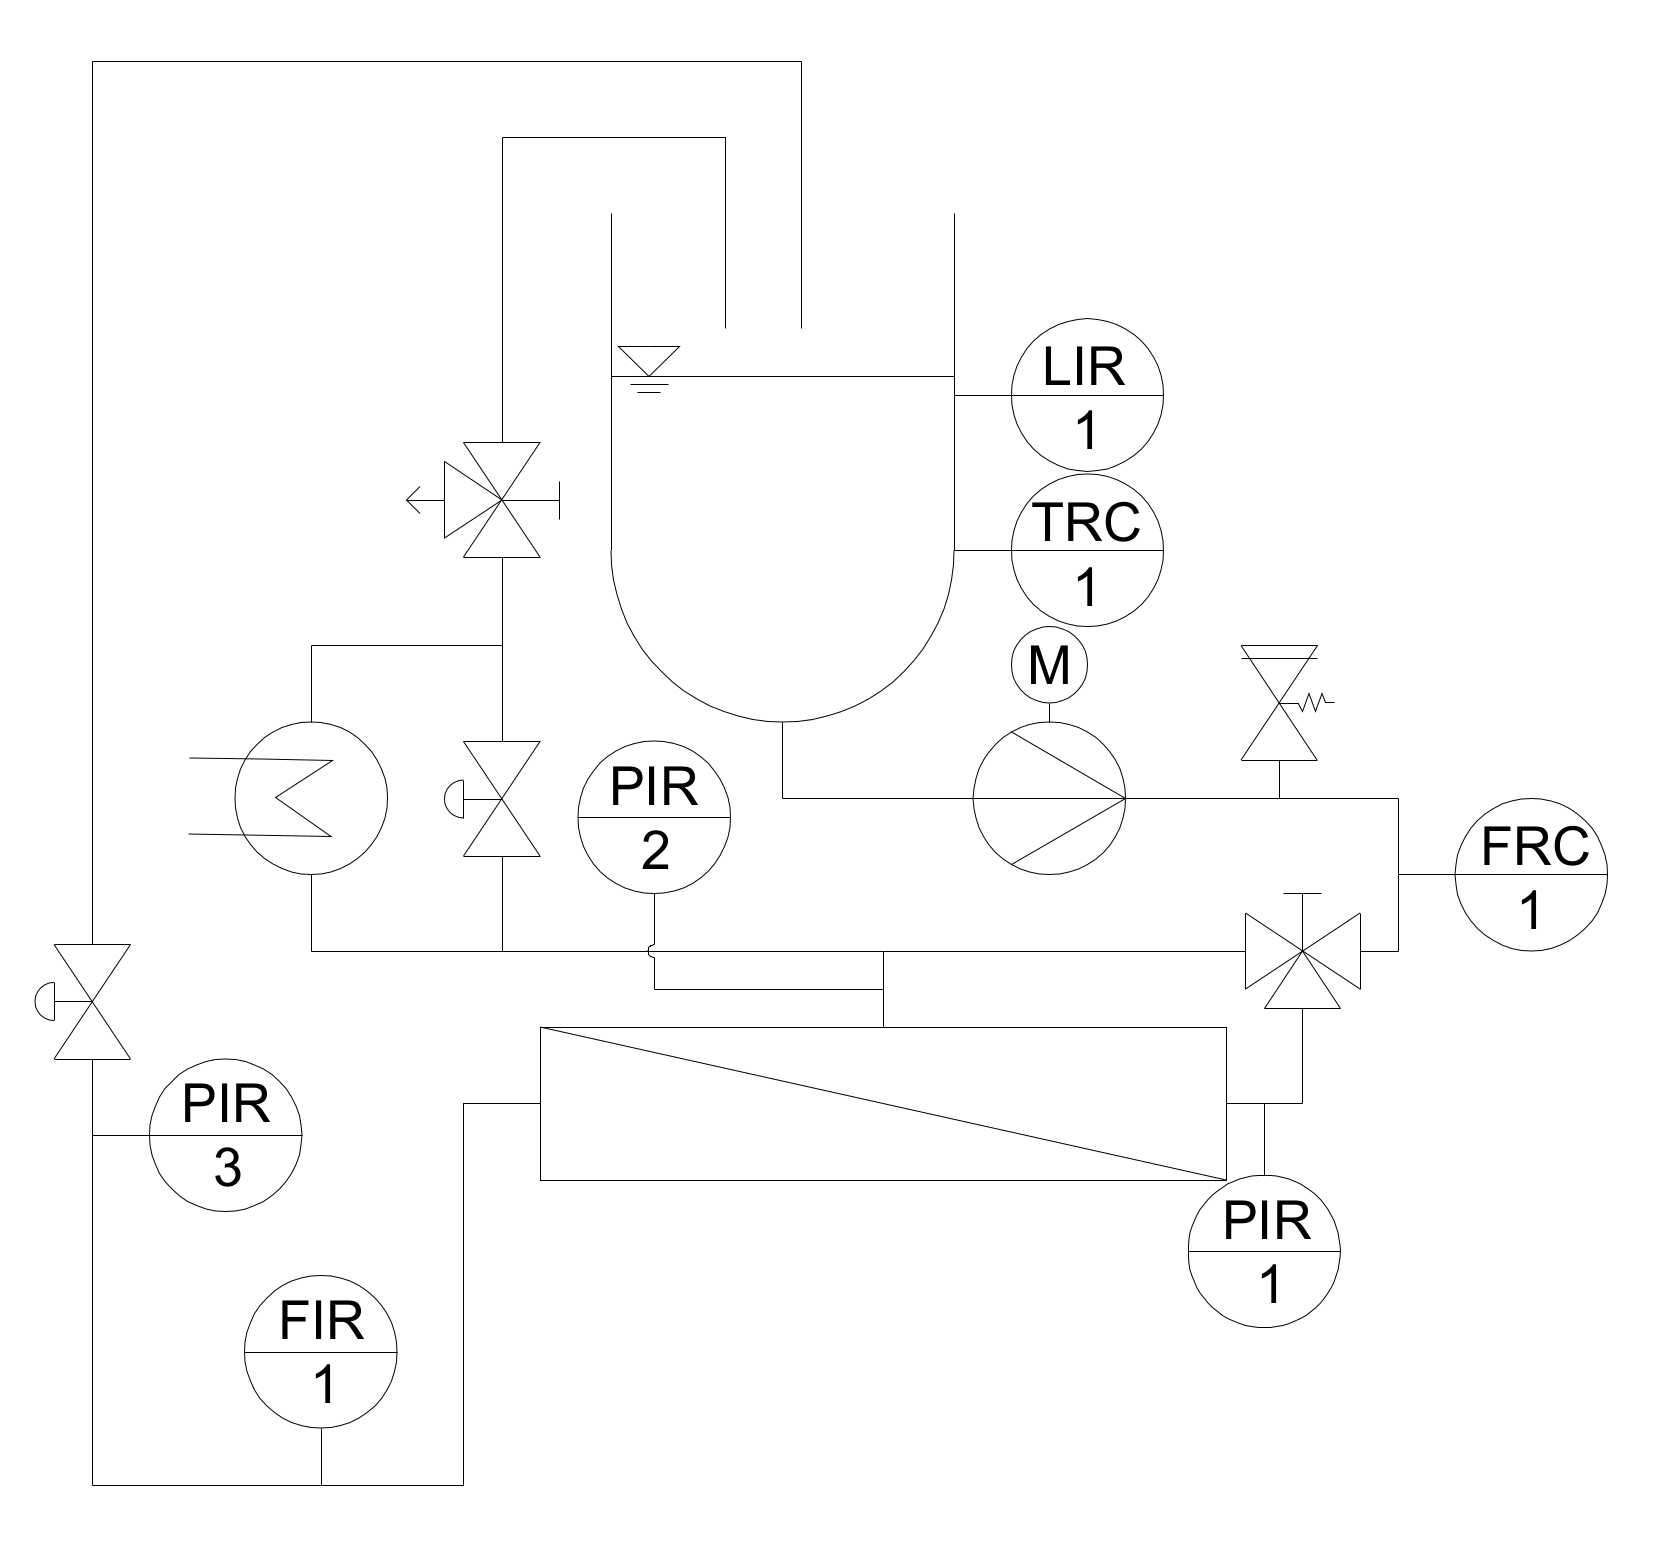
Abstract
1. Introduction
- Setting ΔpTM to various target levels and keeping it constant over the entire experiment (No. 1)
- Increasing and subsequently decreasing ΔpTM stepwise (No. 2)
2. Materials and Methods
2.1. Filtration Fluid Skim Milk and Analyses
2.2. Membrane and Filtration Pilot Plant
2.2.1. Pilot Filtration Plant and Experimental Design
2.2.2. Start-Up Procedure and Experimental Design
- Stepwise increasing and subsequently stepwise decreasing ΔpTM
- Setting ΔpTM directly to target level and keeping it constant during the experiment
2.2.3. Stepwise Increasing and Subsequently Stepwise Decreasing ΔpTM
2.2.4. Setting ΔpTM Directly to Target Level and Keeping It Constant during the Experiment
2.2.5. Cleaning Procedure
2.3. Calculations
2.4. Data Regression and Statistical Analysis
3. Results and Discussion
3.1. Effect of the Mode of ΔpTM Increase to Target Level on Flux of SWM
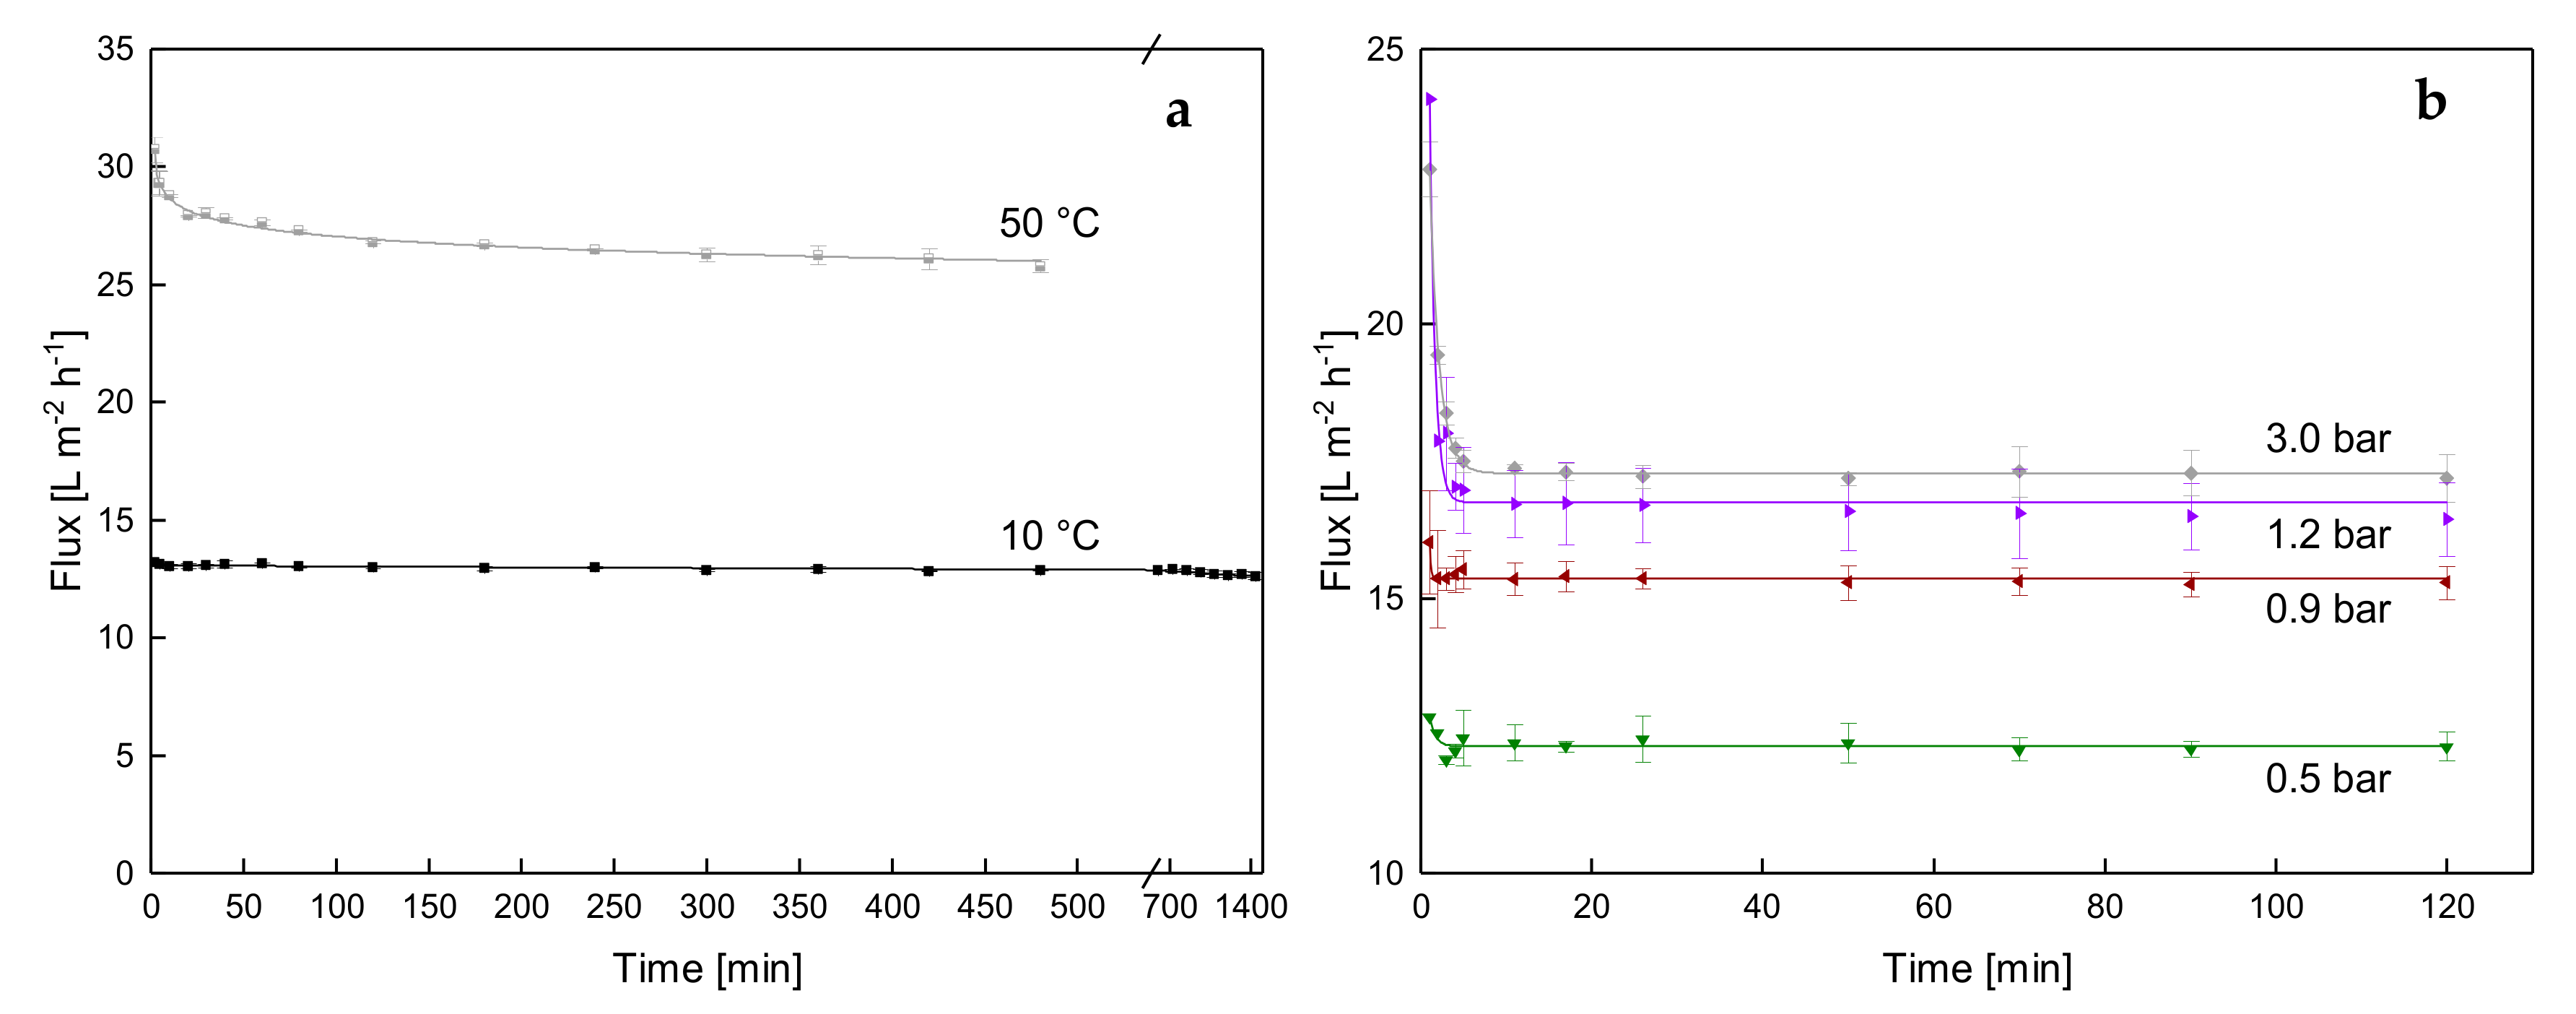
3.1.1. Influence of Temperature and Initial ΔpTM on Steady-state Conditions of Flux
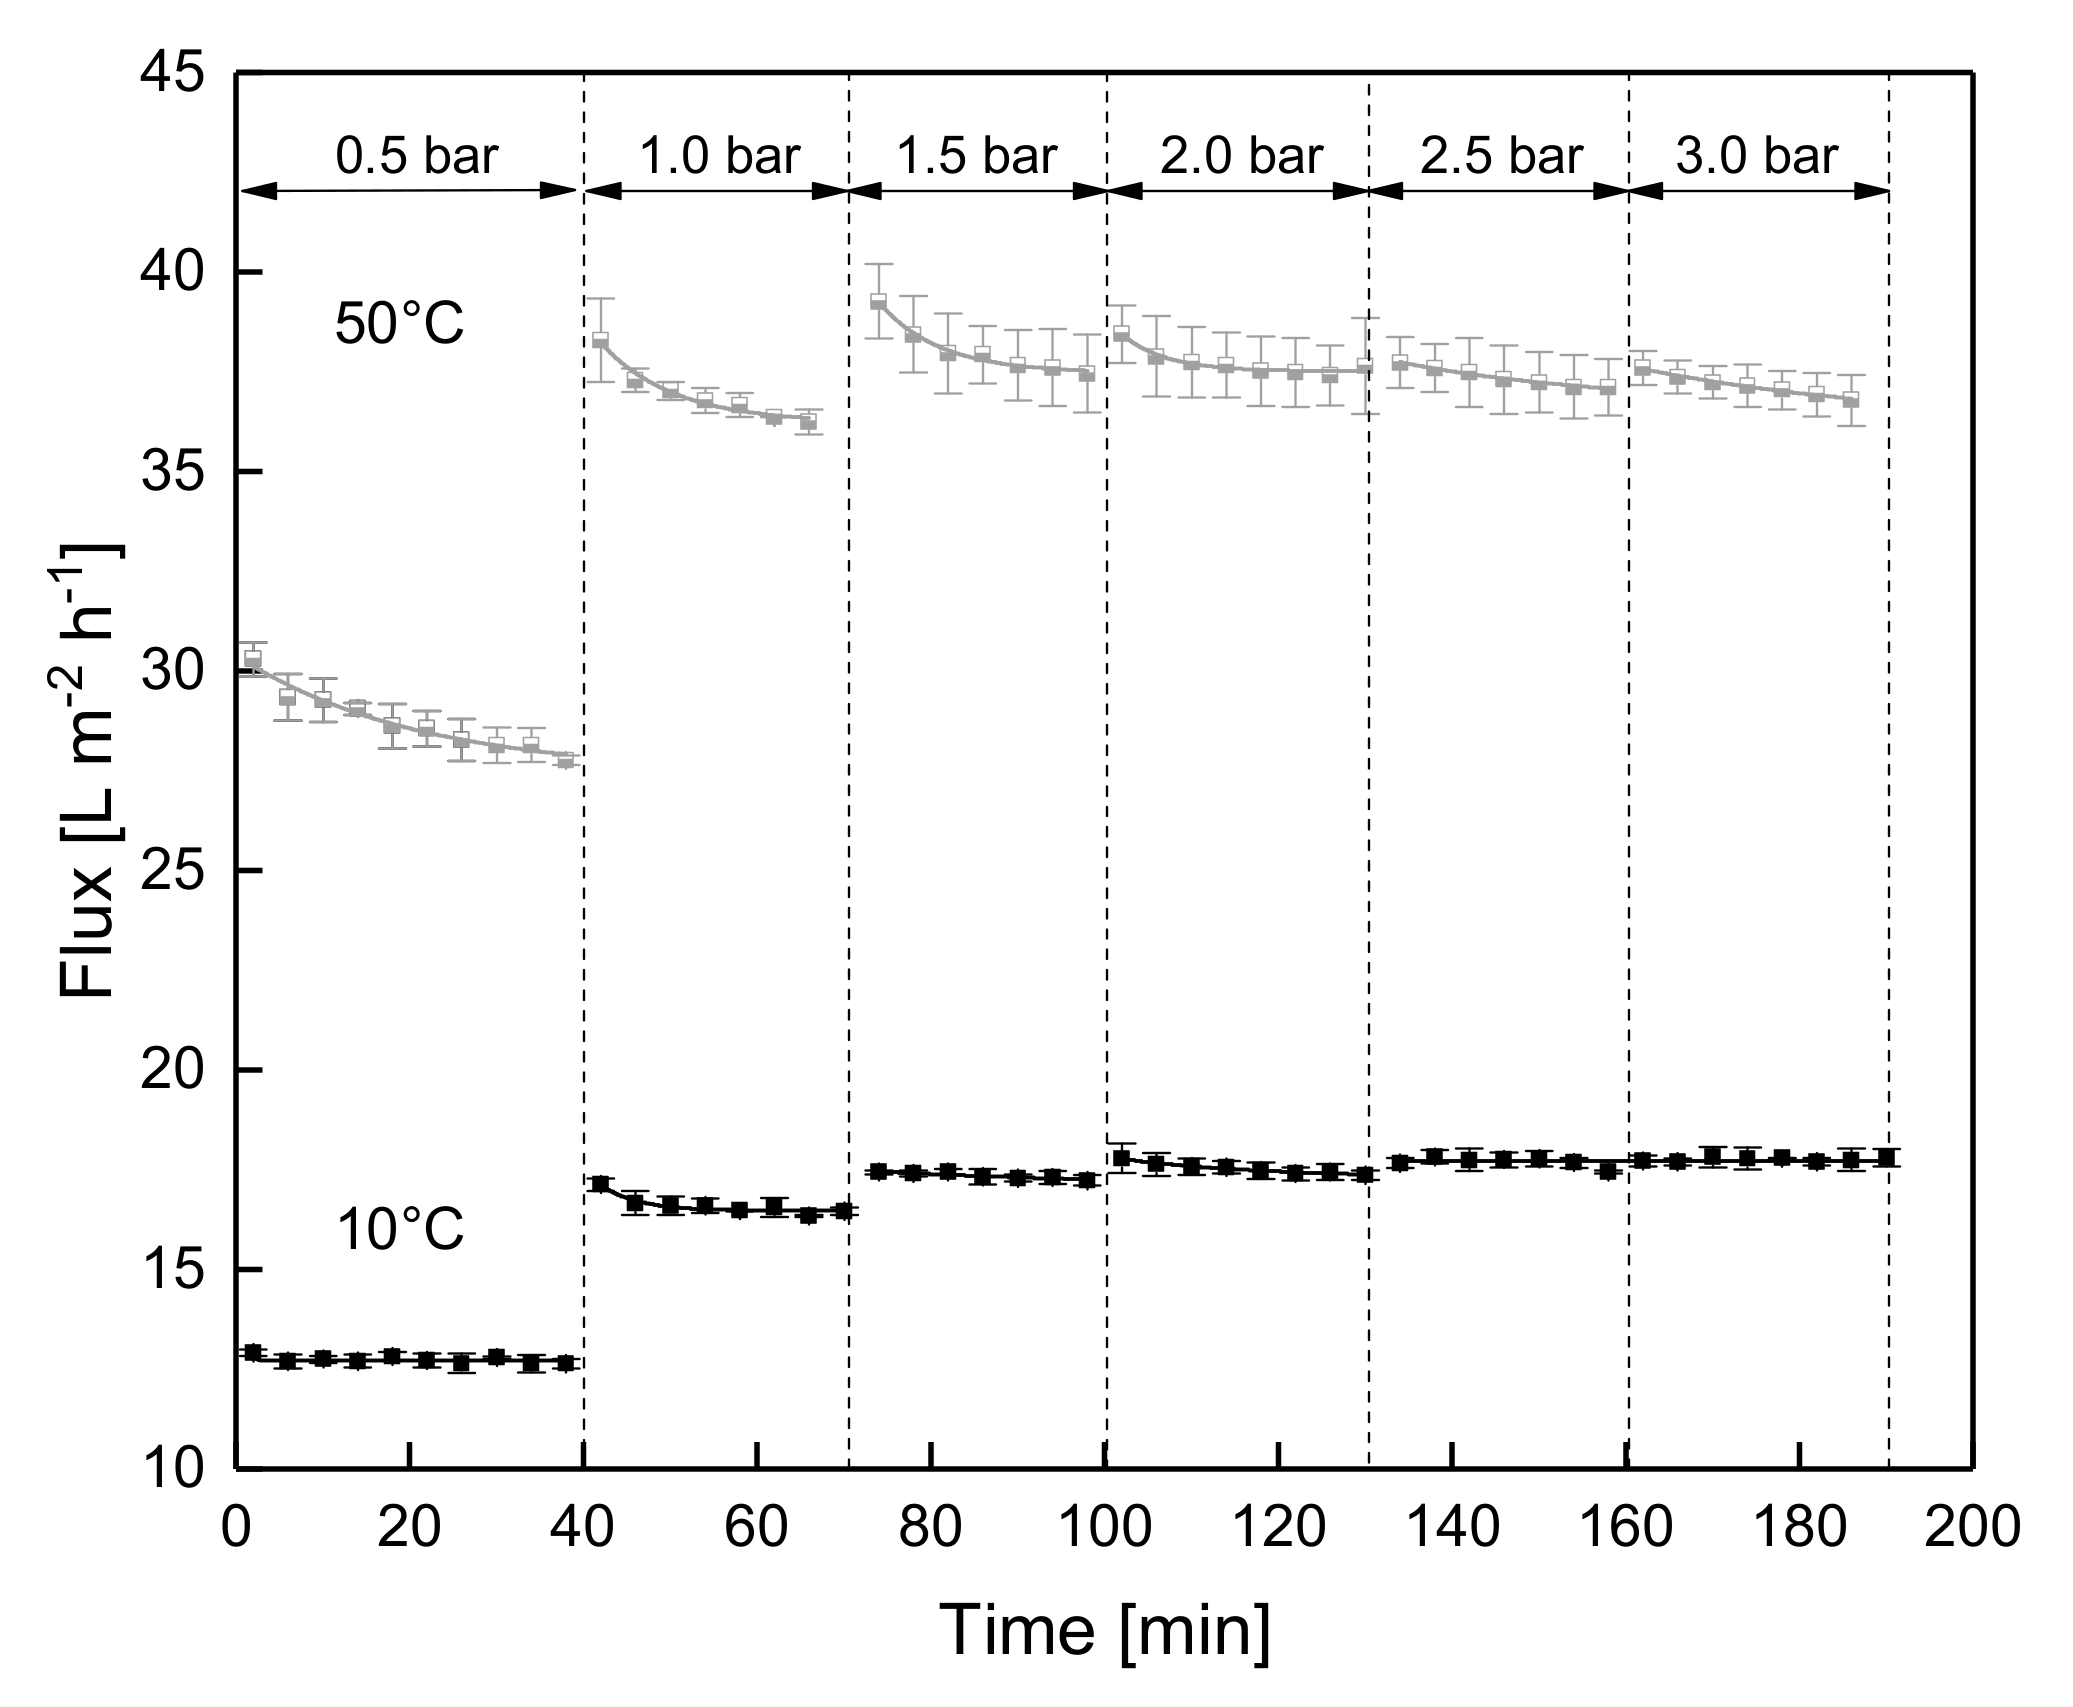
3.1.2. Influence of a Gradual Increase of ΔpTM on Steady-state Conditions of Flux
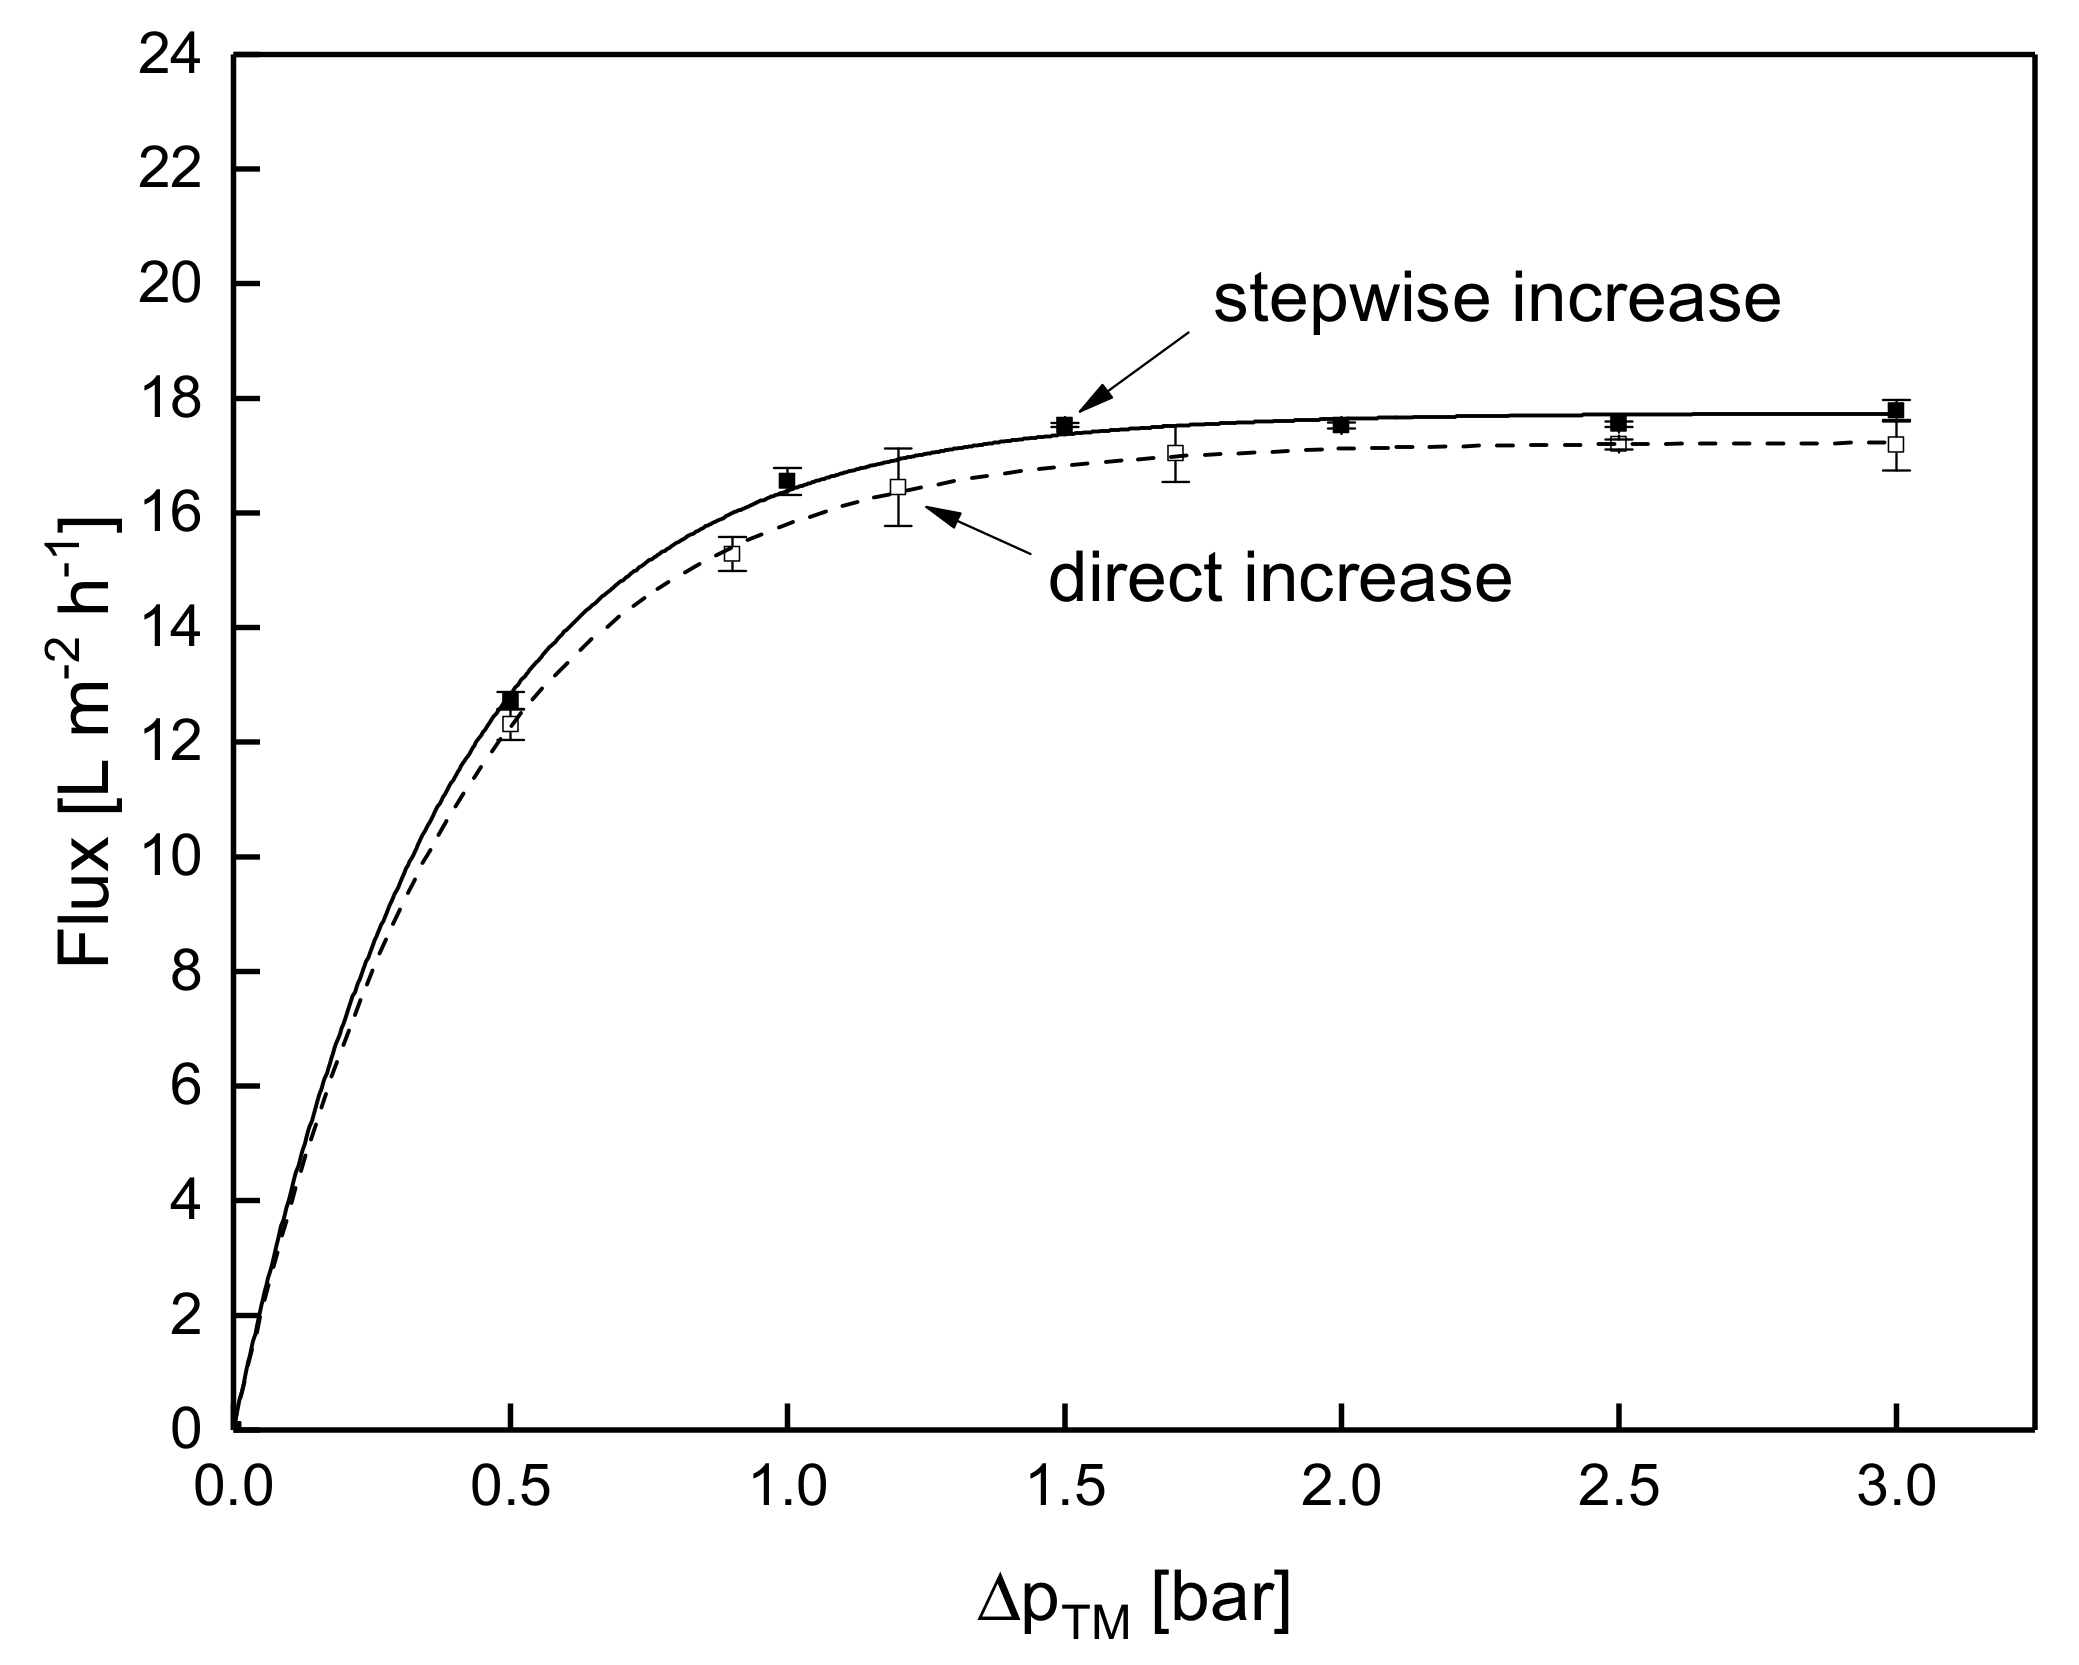
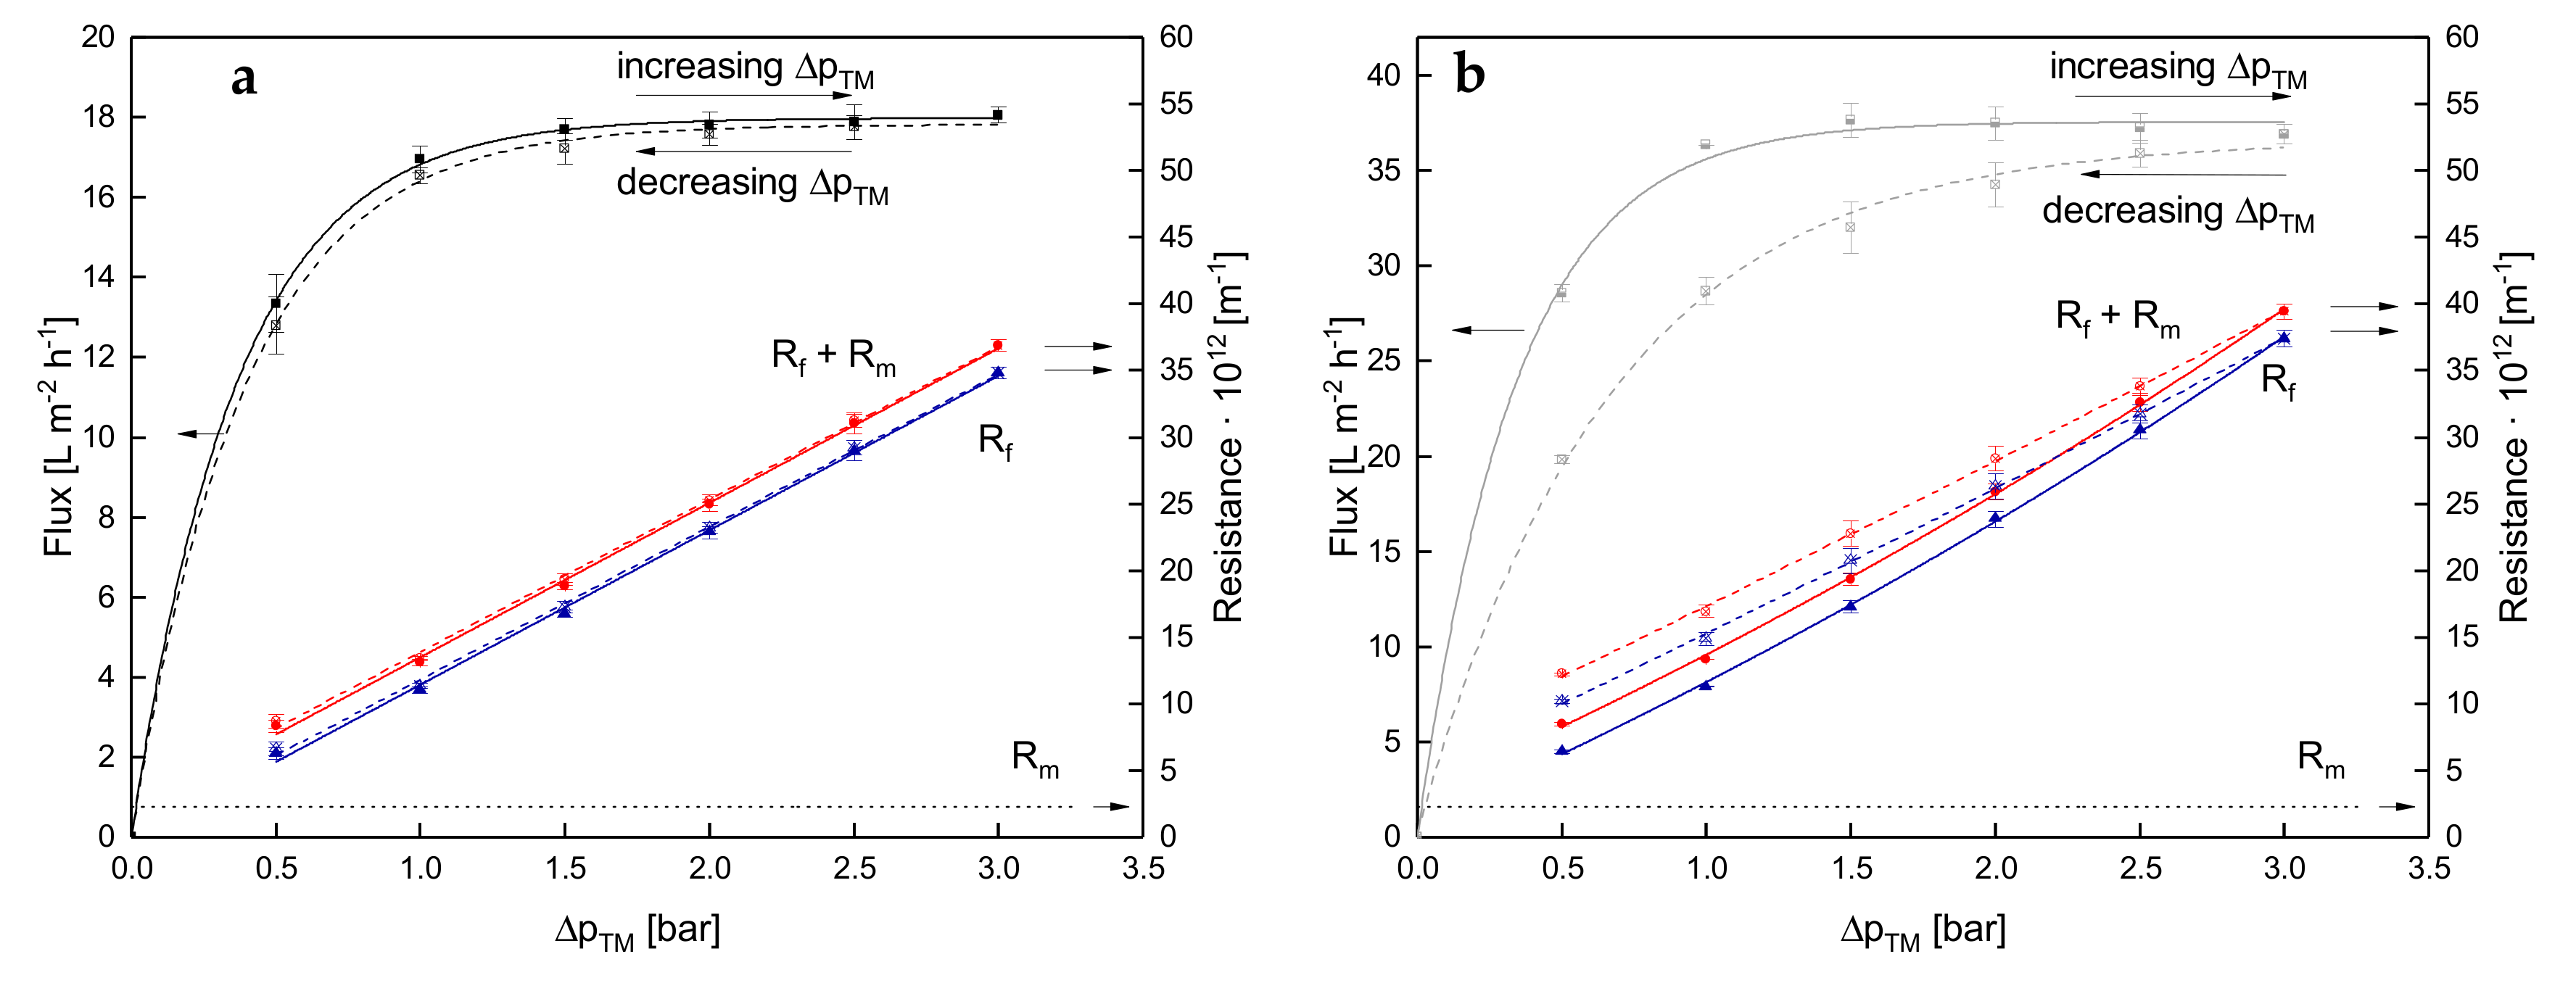
3.1.3. Influence of the Mode of Pressure Adjustment on Steady-state Flux
3.2. Effect of the Deposit Layer History on Flux of SWM
3.3. Effects on Protein Permeation in SWM and the Development of Steady-state Filtration Conditions
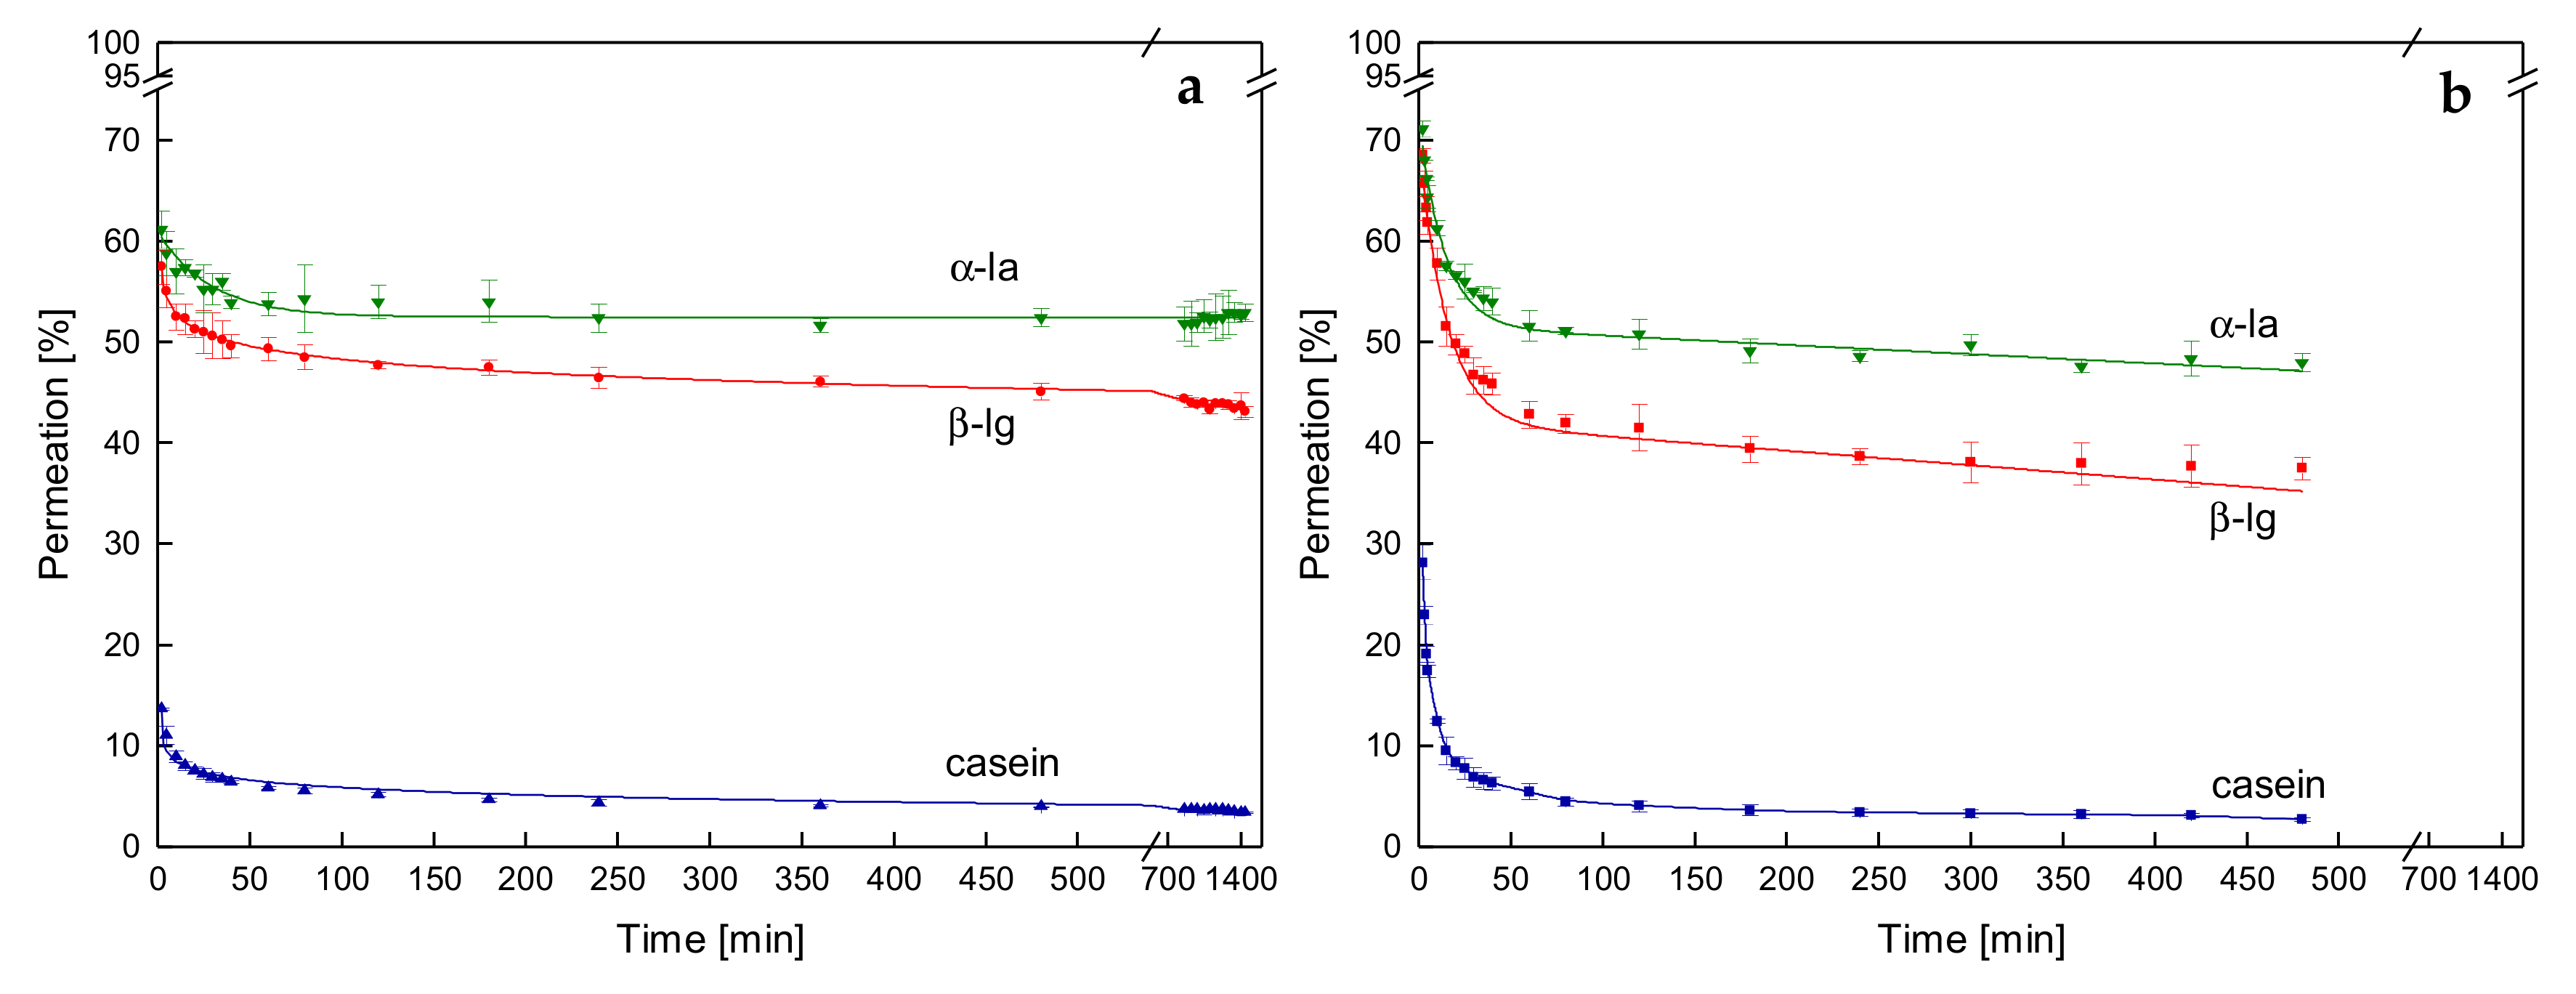
3.3.1. Influence of the Temperature and Protein Size on the Development of Steady-state Protein Permeation
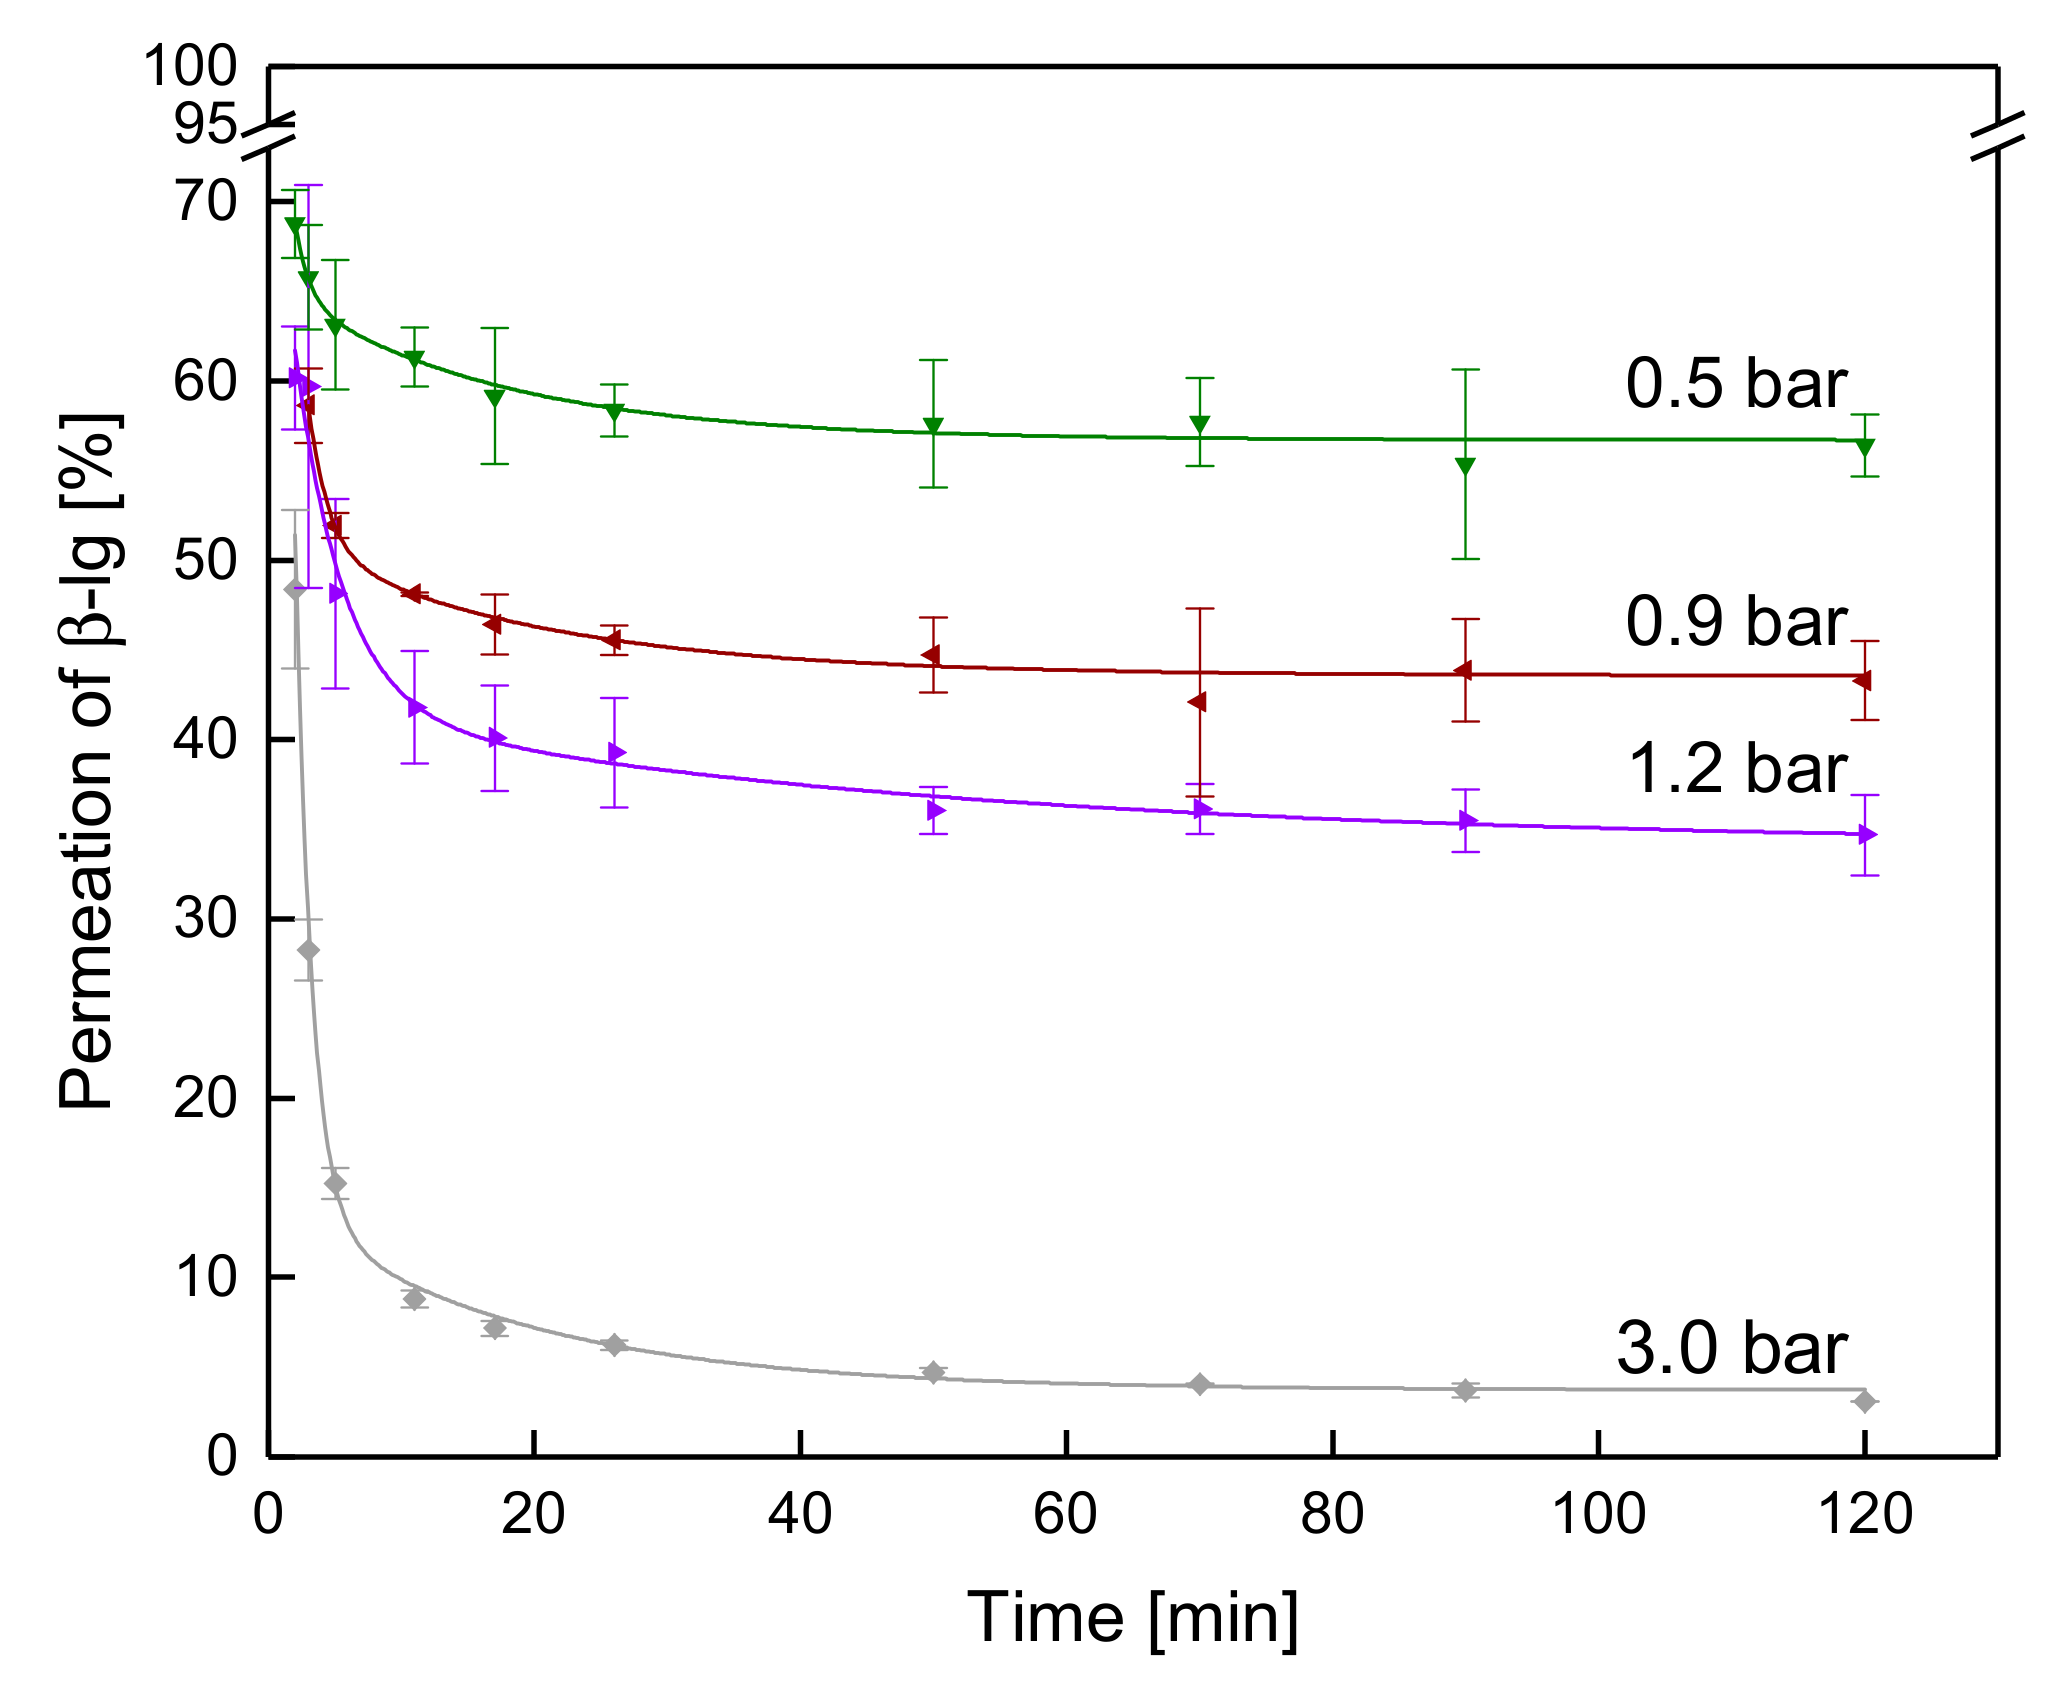
3.3.2. Influence of the ΔpTM on the Development of Steady-state Protein Permeation
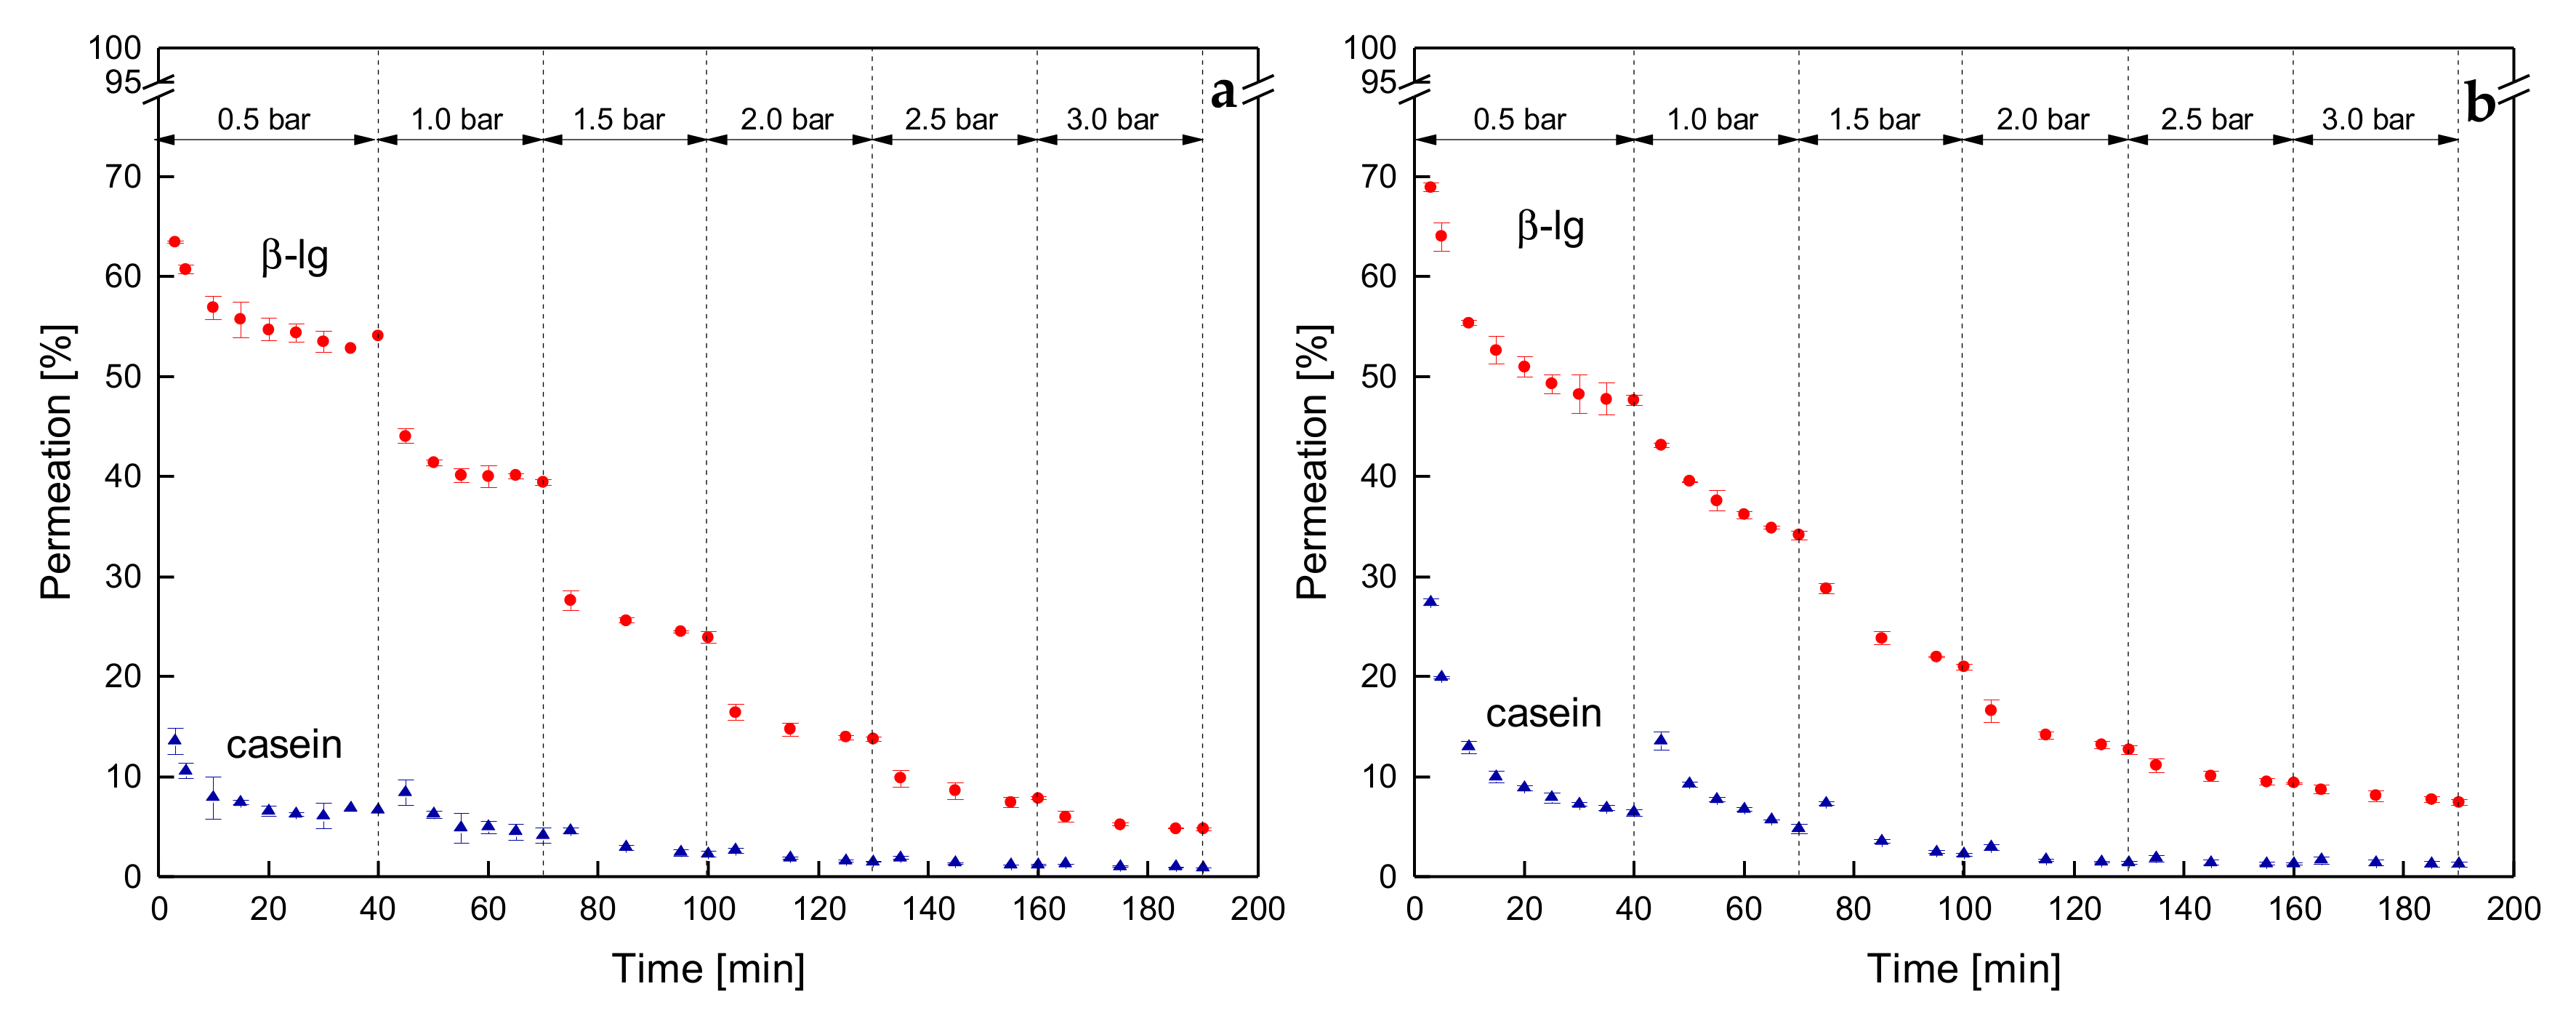
3.3.3. Influence of a Gradual Increase of ΔpTM on the Development of Steady-state Protein Permeation
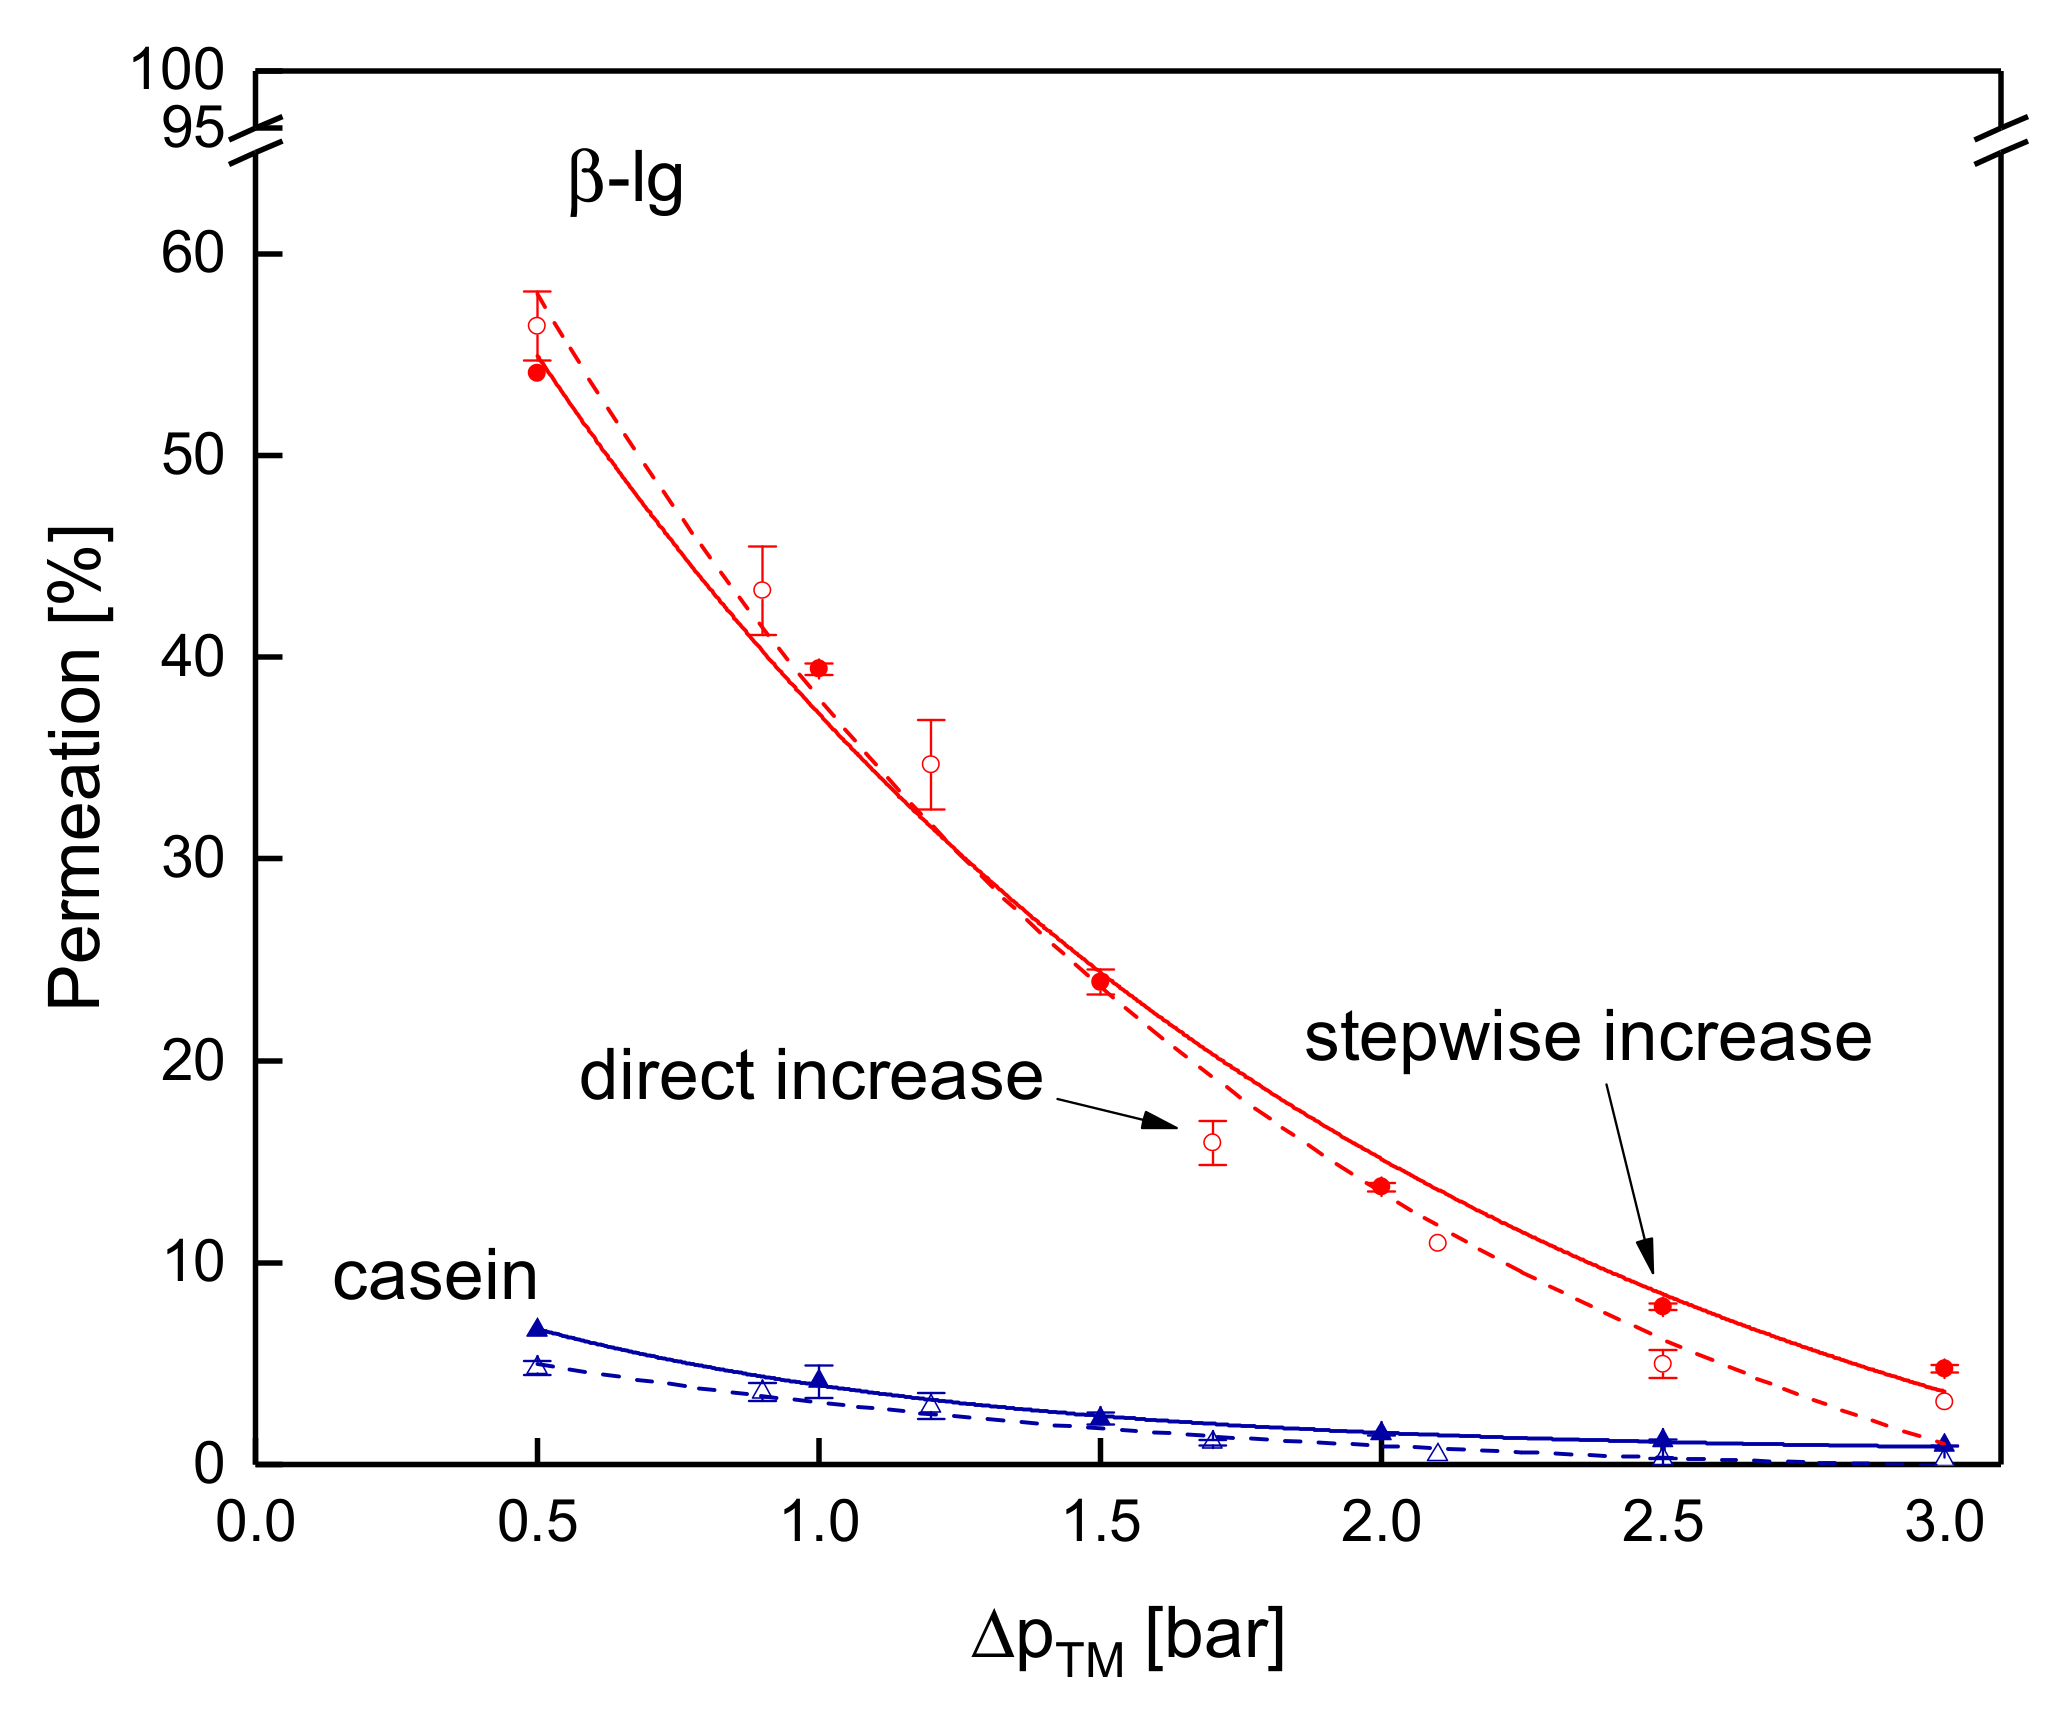
3.3.4. Influence of the Mode of Pressure Adjustment on Protein Permeation
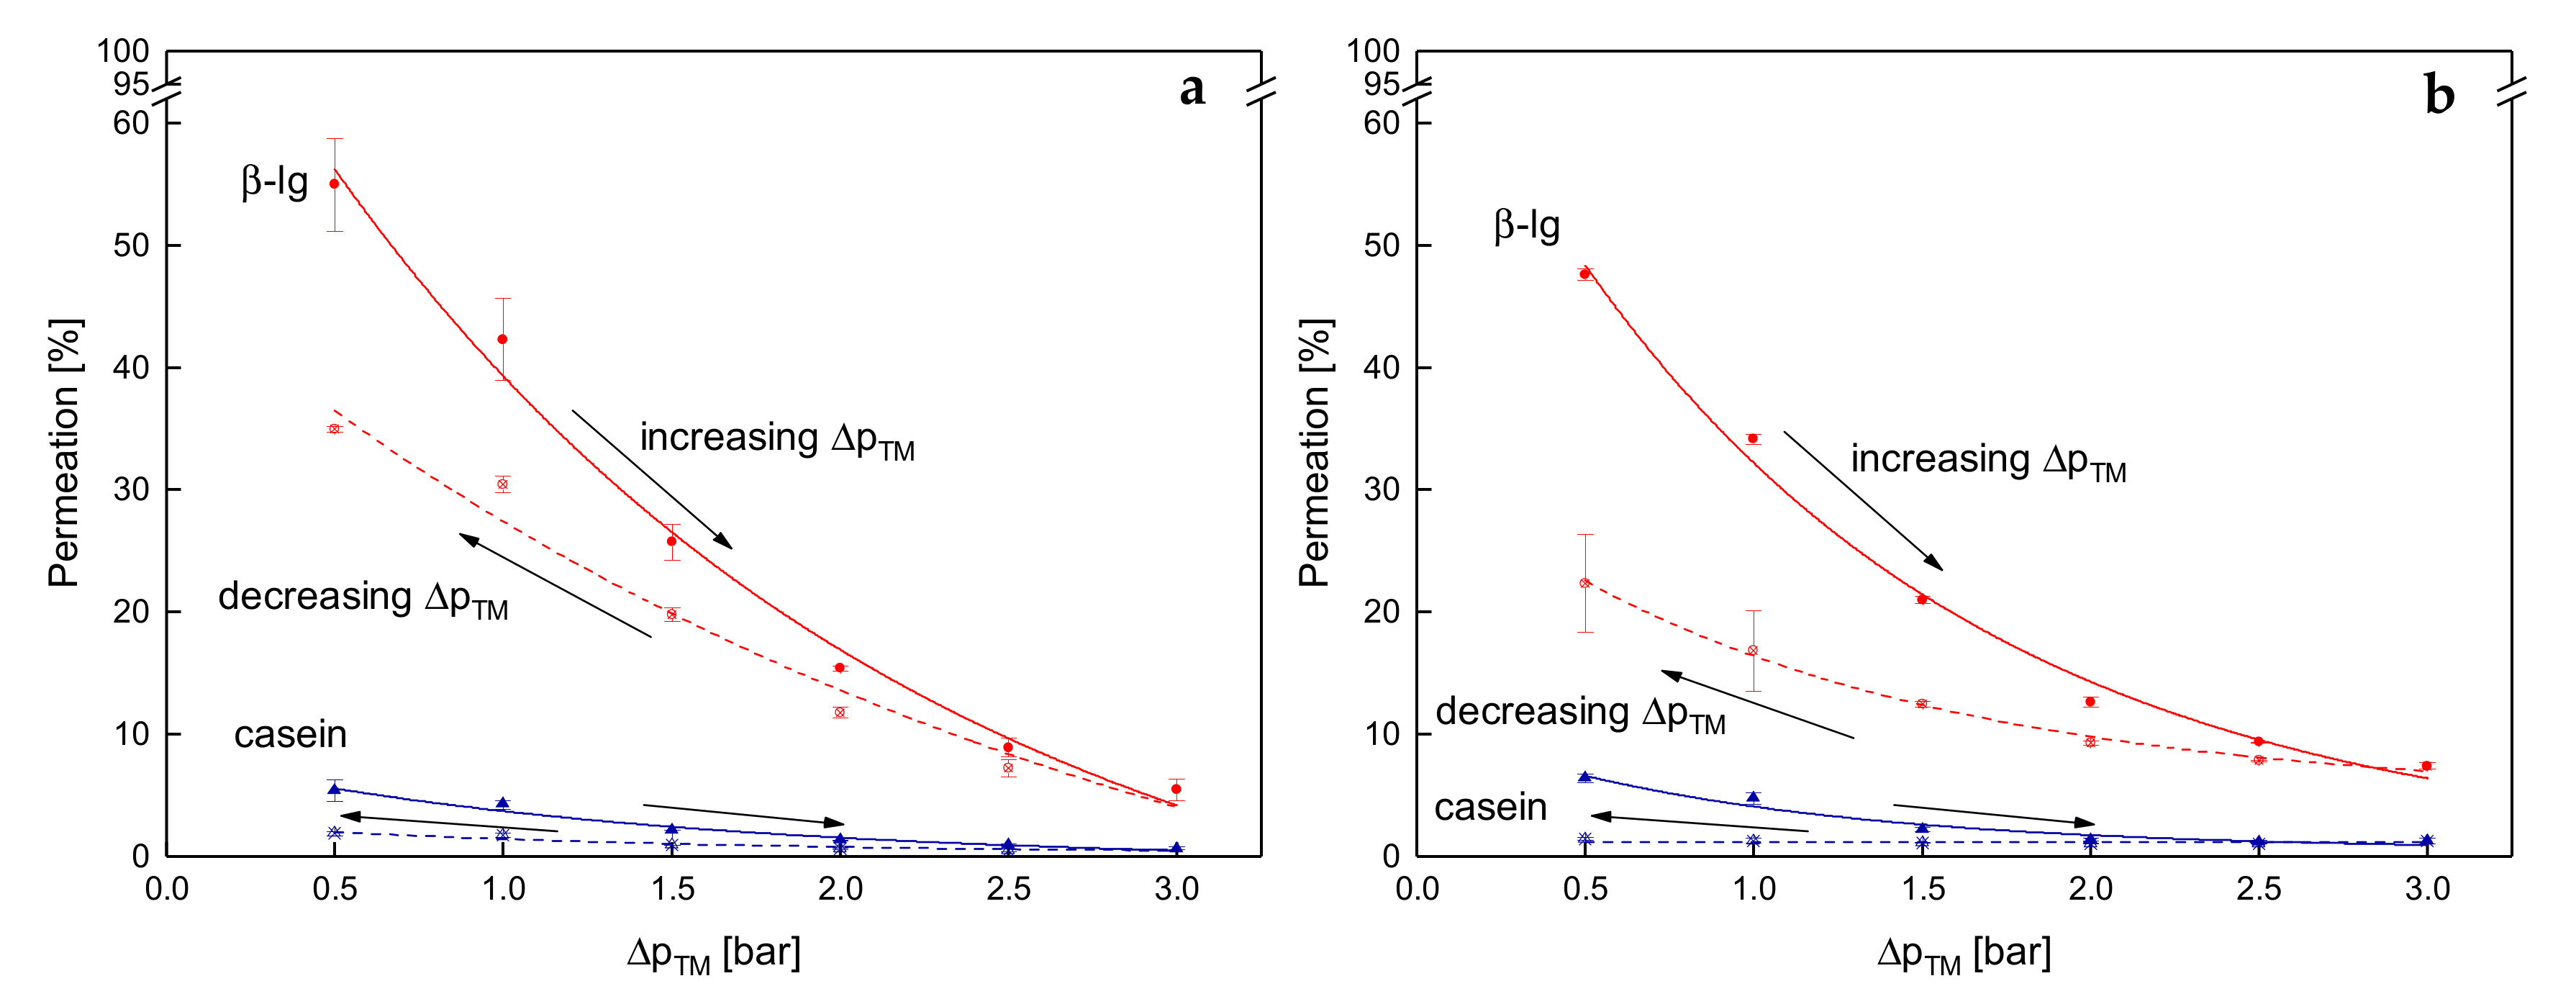
3.4. Influence of the Deposit Layer History on Protein Permeation in SWM
4. Conclusions
Author Contributions
Funding
Acknowledgments
Conflicts of Interest
References
- Le Berre, O.; Daufin, G. Skimmilk crossflow microfiltration performance versus permeation flux to wall shear stress ratio. J. Membr. Sci. 1996, 117, 261–270. [Google Scholar] [CrossRef]
- Beckman, S.L.; Zulewska, J.; Newbold, M.; Barbano, D.M. Production efficiency of micellar casein concentrate using polymeric spiral-wound microfiltration membranes. J. Dairy Sci. 2010, 93, 4506–4517. [Google Scholar] [CrossRef]
- Beckman, S.L.; Barbano, D.M. Effect of microfiltration concentration factor on serum protein removal from skim milk using spiral-wound polymeric membranes. J. Dairy Sci. 2013, 96, 6199–6212. [Google Scholar] [CrossRef] [PubMed]
- Zulewska, J.; Barbano, D.M. Influence of casein on flux and passage of serum proteins during microfiltration using polymeric spiral-wound membranes at 50 °C. J. Dairy Sci. 2013, 96, 2048–2060. [Google Scholar] [CrossRef] [PubMed]
- Saxena, A.; Tripathi, B.P.; Kumar, M.; Shahi, V.K. Membrane-based techniques for the separation and purification of proteins: An overview. Adv. Colliod Interface 2009, 145, 1–22. [Google Scholar] [CrossRef] [PubMed]
- Piry, A.; Kühnl, W.; Grein, T.; Tolkach, A.; Ripperger, S.; Kulozik, U. Length dependency of flux and protein permeation in crossflow microfiltration of skimmed milk. J. Membr. Sci. 2008, 325, 887–894. [Google Scholar] [CrossRef]
- Gésan-Guiziou, G.; Daufin, G.; Boyaval, E. Critical stability conditions in skimmed milk crossflow microfiltration: Impact on operating modes. Lait 2000, 80, 129–138. [Google Scholar] [CrossRef]
- Gésan-Guiziou, G.; Boyaval, E.; Daufin, G. Critical stability conditions in crossflow microfiltration of skimmed milk: Transition to irreversible deposition. J. Membr. Sci. 1999, 158, 211–222. [Google Scholar] [CrossRef]
- Qu, P.; Gésan-Guiziou, G.; Bouchoux, A. Dead-end filtration of sponge-like colloids: The case of casein micelle. J. Membr. Sci. 2012, 417-418, 10–19. [Google Scholar] [CrossRef]
- Qu, P.; Bouchoux, A.; Gésan-Guiziou, G. On the cohesive properties of casein micelles in dense systems. Food Hydrocoll. 2015, 43, 753–762. [Google Scholar] [CrossRef]
- Steinhauer, T.; Kühnl, W.; Kulozik, U. Impact of Protein Interactions and Transmembrane Pressure on Physical Properties of Filter Cakes Formed during Filtrations of Skim Milk. Proc. Food Sci. 2011, 1, 886–892. [Google Scholar] [CrossRef]
- Bouchoux, A.; Qu, P.; Bacchin, P.; Gésan-Guiziou, G. A general approach for predicting the filtration of soft and permeable colloids: The milk example. Langmuir 2014, 30, 22–34. [Google Scholar] [CrossRef] [PubMed]
- Steinhauer, T.; Lonfat, J.; Hager, I.; Gebhardt, R.; Kulozik, U. Effect of pH, transmembrane pressure and whey proteins on the properties of casein micelle deposit layers. J. Membr. Sci. 2015, 493, 452–459. [Google Scholar] [CrossRef]
- Steinhauer, T.; Kulozik, U.; Gebhardt, R. Structure of milk protein deposits formed by casein micelles and β-lactoglobulin during frontal microfiltration. J. Membr. Sci. 2014, 468, 126–132. [Google Scholar] [CrossRef]
- Coppola, L.E.; Molitor, M.S.; Rankin, S.A.; Lucey, J.A. Comparison of milk-derived whey protein concentrates containing various levels of casein. Int. J. Dairy Technol. 2014, 67, 467–473. [Google Scholar] [CrossRef]
- Samuelsson, G.; Dejmek, P.; Trägårdh, G.; Paulsson, M. Minimizing whey protein retention in cross-flow microfiltration of skim milk. Int. Dairy J. 1997, 7, 237–242. [Google Scholar] [CrossRef]
- Ng, K.S.Y.; Dunstan, D.E.; Martin, G.J.O. Influence of processing temperature on flux decline during skim milk ultrafiltration. Sep. Purif. Technol. 2018, 195, 322–331. [Google Scholar] [CrossRef]
- Jarto, I.; Lucey, J.A.; Smith, K.E. Impact of processing temperature on production of milk protein permeate during microfiltration of skim or whole milk. Int. J. Dairy Technol. 2018, 71, 844–848. [Google Scholar] [CrossRef]
- Iametti, S.; Gregori, B.; Vecchio, G.; Bonomi, F. Modifications Occur at Different Structural Levels During the Heat Denaturation of beta-Lactoglobulin. Eur. J. Biochem. 1996, 237, 106–112. [Google Scholar] [CrossRef]
- Ng, K.S.Y.; Haribabu, M.; Harvie, D.J.E.; Dunstan, D.E.; Martin, G.J.O. Mechanisms of flux decline in skim milk ultrafiltration: A review. J. Membr. Sci. 2017, 523, 144–162. [Google Scholar] [CrossRef]
- Kelly, S.T.; Zydney, A.L. Effects of intermolecular thiol-disulfide interchange reactions on bsa fouling during microfiltration. Biotechnol. Bioeng. 1994, 44, 972–982. [Google Scholar] [CrossRef] [PubMed]
- Zulewska, J.; Newbold, M.; Barbano, D.M. Efficiency of serum protein removal from skim milk with ceramic and polymeric membranes at 50 degrees C. J. Dairy Sci. 2009, 92, 1361–1377. [Google Scholar] [CrossRef] [PubMed]
- Anema, S.G.; Lowe, E.K.; Lee, S.K. Effect of pH at heating on the acid-induced aggregation of casein micelles in reconstituted skim milk. LWT-Food Sci. Technol. 2004, 37, 779–787. [Google Scholar] [CrossRef]
- Kühnl, W.; Piry, A.; Kaufmann, V.; Grein, T.; Ripperger, S.; Kulozik, U. Impact of colloidal interactions on the flux in cross-flow microfiltration of milk at different pH values: A surface energy approach. J. Membr. Sci. 2010, 352, 107–115. [Google Scholar] [CrossRef]
- Dumpler, J.; Wohlschläger, H.; Kulozik, U. Dissociation and coagulation of caseins and whey proteins in concentrated skim milk heated by direct steam injection. Dairy Sci. Technol. 2017, 96, 807–826. [Google Scholar] [CrossRef]
- Field, R.W.; Wu, D.; Howell, J.A.; Gupta, B.B. Critical flux concept for microfiltration fouling. J. Membr. Sci. 1995, 100, 259–272. [Google Scholar] [CrossRef]
- Bacchin, P. A possible link between critical and limiting flux for colloidal systems: Consideration of critical deposit formation along a membrane. J. Membr. Sci. 2004, 228, 237–241. [Google Scholar] [CrossRef]
- Gebhardt, R.; Steinhauer, T.; Meyer, P.; Sterr, J.; Perlich, J.; Kulozik, U. Structural changes of deposited casein micelles induced by membrane filtration. Faraday Discuss. 2012, 158, 77. [Google Scholar] [CrossRef] [PubMed]
- Meyer, P.; Mayer, A.; Kulozik, U. High concentration of skim milk proteins by ultrafiltration: Characterisation of a dynamic membrane system with a rotating membrane in comparison with a spiral wound membrane. Int. Dairy J. 2015, 51, 75–83. [Google Scholar] [CrossRef]
- Heidebrecht, H.-J.; Kulozik, U. Fractionation of casein micelles and minor proteins by microfiltration in diafiltration mode. Study of the transmission and yield of the immunoglobulins IgG, IgA and IgM. Int. Dairy J. 2019. [Google Scholar] [CrossRef]
- Heidebrecht, H.-J.; Toro-Sierra, J.; Kulozik, U. Concentration of Immunoglobulins in Microfiltration Permeates of Skim Milk: Impact of Transmembrane Pressure and Temperature on the IgG Transmission Using Different Ceramic Membrane Types and Pore Sizes. Foods 2018, 7, 101. [Google Scholar] [CrossRef] [PubMed]
- Bouchoux, A.; Gésan-Guiziou, G.; Pérez, J.; Cabane, B. How to squeeze a sponge: Casein micelles under osmotic stress, a SAXS study. Biophys. J. 2010, 99, 3754–3762. [Google Scholar] [CrossRef] [PubMed]


© 2019 by the authors. Licensee MDPI, Basel, Switzerland. This article is an open access article distributed under the terms and conditions of the Creative Commons Attribution (CC BY) license (http://creativecommons.org/licenses/by/4.0/).
Share and Cite
Hartinger, M.; Heidebrecht, H.-J.; Schiffer, S.; Dumpler, J.; Kulozik, U. Milk Protein Fractionation by Means of Spiral-Wound Microfiltration Membranes: Effect of the Pressure Adjustment Mode and Temperature on Flux and Protein Permeation. Foods 2019, 8, 180. https://doi.org/10.3390/foods8060180
Hartinger M, Heidebrecht H-J, Schiffer S, Dumpler J, Kulozik U. Milk Protein Fractionation by Means of Spiral-Wound Microfiltration Membranes: Effect of the Pressure Adjustment Mode and Temperature on Flux and Protein Permeation. Foods. 2019; 8(6):180. https://doi.org/10.3390/foods8060180
Chicago/Turabian StyleHartinger, Martin, Hans-Jürgen Heidebrecht, Simon Schiffer, Joseph Dumpler, and Ulrich Kulozik. 2019. "Milk Protein Fractionation by Means of Spiral-Wound Microfiltration Membranes: Effect of the Pressure Adjustment Mode and Temperature on Flux and Protein Permeation" Foods 8, no. 6: 180. https://doi.org/10.3390/foods8060180
APA StyleHartinger, M., Heidebrecht, H.-J., Schiffer, S., Dumpler, J., & Kulozik, U. (2019). Milk Protein Fractionation by Means of Spiral-Wound Microfiltration Membranes: Effect of the Pressure Adjustment Mode and Temperature on Flux and Protein Permeation. Foods, 8(6), 180. https://doi.org/10.3390/foods8060180