Article

Clustering of Streptococcus thermophilus Strains to Establish a Relation between Exopolysaccharide Characteristics and Gel Properties of Acidified Milk

Institute of Natural Materials Technology, Technische Universität Dresden, 01062 Dresden, Germany
*
Author to whom correspondence should be addressed.
Foods 2019, 8(5), 146; https://doi.org/10.3390/foods8050146
Submission received: 28 March 2019 / Revised: 24 April 2019 / Accepted: 28 April 2019 / Published: 30 April 2019

Abstract

:
In situ produced extracellular polysaccharides (EPS) from lactic acid bacteria are generally known to affect the texture of fermented dairy products; however, the interplay between EPS and product properties is still poorly understood. The aim of this study was to establish a relationship between concentration and properties of EPS, and gel formation of milk analysed by noninvasive Multispeckle Diffusing Wave Spectroscopy. Twenty Streptococcus thermophilus strains were classified with respect to EPS concentration (8–126 mg GE/kg) and ropiness (thread length: 15–80 mm). Five groups identified by cluster analysis demonstrate the high strain-to-strain variability even within one species of lactic acid bacteria. Results from acidification and gelation experiments averaged per cluster indicate that fermentation time and gel stiffness is higher for strains that produce ropy EPS. A further increase in gel stiffness was detected for strains that also produced cell-bound EPS, which underlines the importance of both ropy and cell-bound EPS for improving acid gel properties. The results may be helpful for a proper selection of EPS-producing starter cultures.

Graphical Abstract

1. Introduction

In situ produced extracellular polysaccharides (EPS) from lactic acid bacteria (LAB) are generally known to have an impact on the texture and, consequently, on sensory properties of fermented foods. Bacteria strains with the ability of synthesising EPS are utilised in the manufacture of a broad range of products, especially in the cereal [1] and dairy sector [2]. For the latter, positive effects were observed for viscosity, thickness and creaminess of yoghurt [3,4], and EPS also reduce the protein particle growth during fresh cheese manufacture [5]. However, the interplay between EPS properties and product microstructure is still poorly understood [2].
Recent reviews [2,6] highlight the diversity of EPS with respect to their chemical structure (e.g., homo- or heteropolysaccharides, linear or branched molecules) and their macromolecular properties (e.g., molecular mass, stiffness, charge). EPS from LAB are often distinguished by the degree of ropiness they induce in the product, and by their location: whereas free EPS (fEPS) are released into the surrounding medium, cell-bound EPS (cEPS) remain attached to the bacteria cells.
A common method to assess ropiness is to visually evaluate the slimy, thread-forming character of the fermented medium [7,8]. Ropy EPS were also identified by measuring viscosity of the cell-free sera [9], the efflux time of broth cultures from microhaematocrit capillaries [8], or extensibility of acid gel suspensions [10,11]. Different microscopy techniques such as counter- or negative-staining [12,13], autofluorescence [14] or transmission electron microscopy [15] were applied to visualise cEPS, and staining with fluorescence dyes or their conjugates to visualise both fEPS and cEPS [16,17]. To discriminate between EPS-producing strains, several workers determined monomer composition [13,18,19], chemical structure of EPS [20,21,22], EPS concentration [9,13] or macromolecular properties of aqueous EPS solutions [23,24]. Rheological methods and sensory evaluations were extensively used to investigate the impact of EPS producers on the texture of dairy products to facilitate the selection of appropriate strains [4,23,25].
Although extensive research has been carried out on the general impact of EPS on the texture of fermented dairy products, only a few studies related properties of the respective EPS to the resulting product characteristics. Hassan et al. [26] focused on EPS type and determined higher apparent viscosity in products with ropy fEPS than in products containing both nonropy fEPS and cEPS. Mende et al. [23] reported that ropiness of EPS from Streptococcus thermophilus is mainly caused by intrinsic properties (e.g., composition, branching), and that ropiness is linked to increased apparent viscosity of stirred acidified milk. For EPS with identical structure from two S. thermophilus strains, Faber et al. [27] determined higher medium viscosity for EPS with higher molecular mass. A positive correlation between EPS molecular mass and fermented milk viscosity was also found for 28 Lactobacillus strains [28]. Vaningelgem et al. [24] investigated 26 strains of S. thermophilus and proposed a classification by molecular mass and monomer composition for further studies of function–texture relationship. Monomer composition was also used by Mozzi et al. [13] to distinguish between EPS producers of different species. Recently, there has been an increasing interest in identifying the relationship between gene clusters and textural properties [10,29,30].
The impact of different EPS starts during gelation and might already alter the gel formation behaviour of milk [2]. Hassan et al. [31] investigated acid gelation of milk with three yoghurt cultures which produced different types of EPS, and detected similar gelation profiles but an earlier gelation onset for strains that produced nonropy fEPS and cEPS compared to ropy fEPS. Purwandari et al. [32] observed higher stiffness of gels with nonropy fEPS and cEPS compared to gels with ropy fEPS and cEPS, whereas Bullard et al. [33] determined lower gel stiffness for gels with nonropy fEPS and cEPS. Mende et al. [23] detected higher stiffness for gels made with S. thermophilus strains that produced low amounts of EPS compared to strains that produced high amounts. Because of the great diversity of strains and the corresponding EPS, there is still uncertainty concerning the effects of EPS on gel formation.
The aim of our study was to establish a relationship between EPS properties and gelation characteristics of acidified milk by clustering 20 S. thermophilus strains on the basis of ropiness and EPS concentration. The results may support the prediction of product characteristics influenced by certain EPS properties.

2. Materials and Methods

2.1. Preparation of Strains

Twenty single strains of S. thermophilus (ST): ST-1C, D, E, G, H, I, K; ST-2A, B, C, D, E, F, G, H, I, K, L, M; and the EPS-negative DSMZ20259 [34] (Deutsche Sammlung für Mikroorganismen und Zellkulturen GmbH, Braunschweig, Germany) were stored as cryocultures at −80 °C. Glass pellets were used to prepare precultures by anaerobic incubation (48 h, 40 °C) in a semidefined medium with 200 mM lactose [23].

2.2. Production of Acid Gel Suspensions

Stirred acid gels were prepared in laboratory scale based on the process described previously [35]. Reconstituted skim milk (RSM) was prepared by dissolving low-heat skim powder in demineralised water to achieve a dry matter of 10% (w/w). RSM was heated to 90 °C for 10 min in a water bath, subsequently cooled to 40 °C and 0.45 L was transferred into plastic vessels. Aerobic cultivation was carried out after inoculation with 1% (v/v) preculture in a water bath at 40 °C for 24 h. During cultivation, acidification was continuously monitored using a 6-channel pH logger (EA Instruments Ltd., Wembley, UK). Time until pH 4.6 (tpH = 4.6) and pH at the end of fermentation (pHt = 24 h) were evaluated. Subsequently, the milk gels were broken using a perforated plunger (d = 78 mm) [36] which was moved upwards and downwards for 2 × 30 s, and then stirred at 400 rpm for 2 min with a 3-wing propeller blade (d = 70 mm) mounted on a Eurostar power control-visc stirrer (IKA GmbH & Co. KG, Staufen, Germany).
The fermentation medium used for ropiness determination was RSM supplemented with 1% (w/v) tryptically digested casein peptone and 0.5% (w/v) yeast nitrogen base (RSMsuppl) that was autoclaved at 110 °C for 10 min [23]. After cultivation, the gels were broken using the perforated plunger only.
All acid gels suspensions from RSM and RSMsuppl were produced in duplicate. Analysis of EPS concentration was started directly after fermentation. All other measurements were performed after three days storage at 6 °C. All results are expressed as arithmetic means from duplicate measurements.

2.3. Analysis of Acid Gel Suspensions

EPS isolation and quantification was performed as described by Mende et al. [23]. In brief, acid gel suspensions adjusted to pH 7.5 with 1 M NaOH were incubated with 0.25 mL of a 0.5% (w/v) Pronase E solution (Sigma-Aldrich Chemie GmbH, Steinheim, Germany) at 37 °C for approximately 18 h to cleave the proteins. After adjusting to 9% (w/v) trichloroacetic acid (TCA) and thermal treatment (10 min at 90 °C), cells and proteins were removed by centrifugation (19,000× g, 15 min, 6 °C). The pellets were resuspended in 0.5 mL 10% (w/v) TCA and centrifuged again. Two volumes of chilled acetone (6 °C) were added to the pooled supernatants. On the next day, the EPS precipitated by the solvent were collected through centrifugation (19,000× g, 15 min, 6 °C), dissolved in water, dialysed (molecular mass cut-off 8–10 kDa; Carl Roth GmbH & Co. KG, Karlsruhe, Germany) for 48 h against demineralised water, and freeze-dried (Alpha 1-2, Martin Christ Gefriertrocknungsanlagen GmbH, Osterode, Germany). EPS concentration, determined by the phenol-sulphuric acid method [37] in duplicate, is expressed as milligram glucose equivalent (GE) per kilogram medium. Fresh media served as blank and their absorbance was subtracted from those of the fermented samples.
Cell-free milk serum was obtained by centrifugation of the acid gel suspension at 19,000× g and 6 °C for 15 min. Dynamic viscosity of the serum was determined with a LOVIS rolling ball microviscometer (Anton Paar GmbH, Graz, Austria). The sample was filled into a glass capillary of 1.59 mm diameter and conditioned to 20 °C. Measurements were performed at a capillary angle of 70° with two independently prepared sera in six-fold. Dynamic viscosity was calculated from the rolling time of a gold-coated stainless steel ball (d = 1.5 mm, ρ = 7.88 g/mL) through the capillary [38] and the density of the serum, which was determined by the oscillating U-tube method. Mean density of 1.029 ± 0.001 g/mL and 1.032 ± 0.001 g/mL were used for RSM and RSMsuppl, respectively.
Negative staining with Indian ink was used to visualize EPS [13]. Ink particles are not able to penetrate into the polymeric material, so that EPS capsules appear as clear zones around the cells. Cell-bound EPS producers are indicated by ‘+’ after strain name.
Ropiness of the acid gel suspensions with RSMsuppl was measured with a TA-XT.plus analyser (Stable Microsystems Ltd., Godalming, UK). Thirty ±1 g gel suspension was transferred into a petri dish, and a cylindrical probe (d = 40 mm) mounted to the force transducer was lowered until full contact with the sample surface was achieved. The crosshead was then moved upwards at a velocity of 40 mm/s, and each experiment was recorded at 30 frames per second using a digital video camera. Time sequences of the video were analysed to determine the time span until the thread teared. This time measure and crosshead velocity were used to calculate the maximum length of the thread (Lthread).

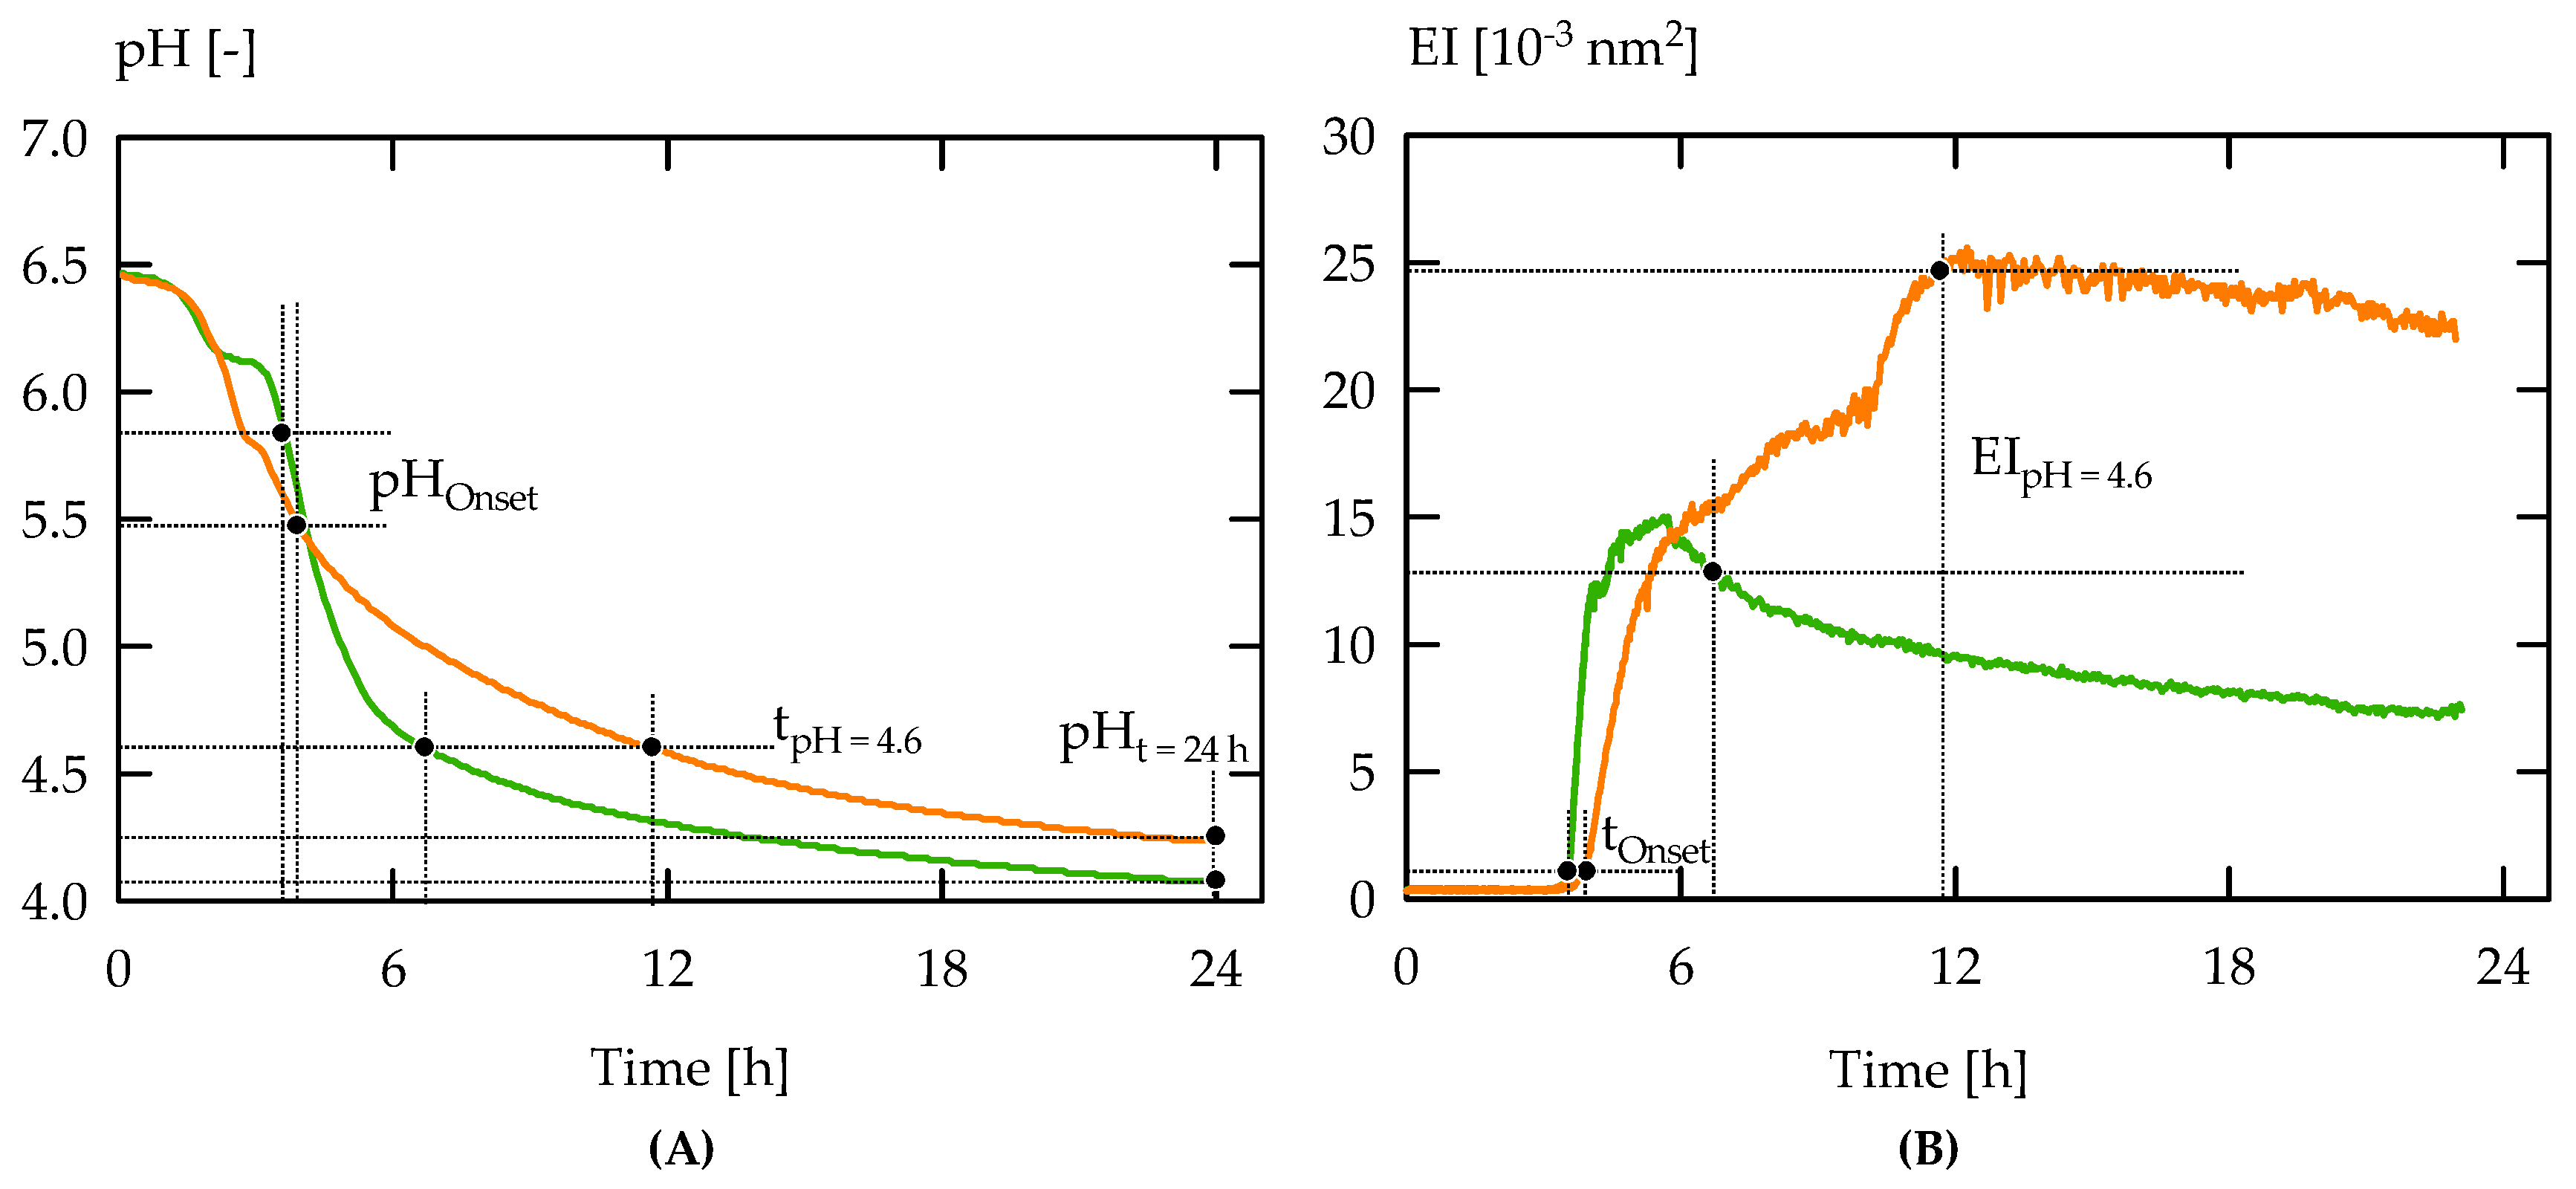
2.4. Analysis of Gelation Behaviour

Gel formation was analysed by Multispeckle Diffusing Wave Spectroscopy (MS-DWS) using a RheolaserTM MASTER (Formulaction SA, Toulouse, France). Twenty mL inoculated RSM was transferred into glass vials that were placed in the measurement cell. Time-based backscattering of a λ = 650 nm laser was measured using a multi-pixel detector, and internally converted into curves of Mean Square Displacements (MSD) over decorrelation time by instrument software V1.4 (Formulaction SA, Toulouse, France). Temperature in the measuring cell was kept constant at 40 °C using a Peltier element. The elasticity index (EI) was determined from the inverse mean MSD at short decorrelation times (<0.1 s). The EI at pH 4.6 (EIpH = 4.6), gelation onset (tOnset) determined at EI = 10−3 nm2 and the corresponding pH at gelation onset (pHOnset) taken from the acidification profiles are further used as measures.

2.5. Statistical Data Evaluation

SAS® University Edition 6p.2 (SAS® Institute, Cary, NC, USA) was used for Euclidian distance cluster analysis using Ward linkage on averaged Lthread and EPS concentration, and for univariate ANOVA. Unless stated otherwise, data are expressed as arithmetic mean ± half deviation range (n = 2) or arithmetic mean ± standard deviation (n > 2).

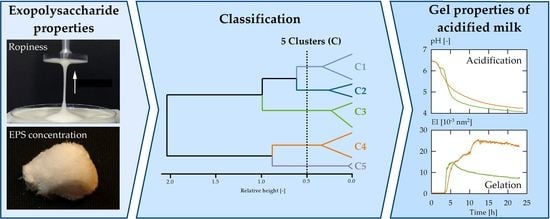
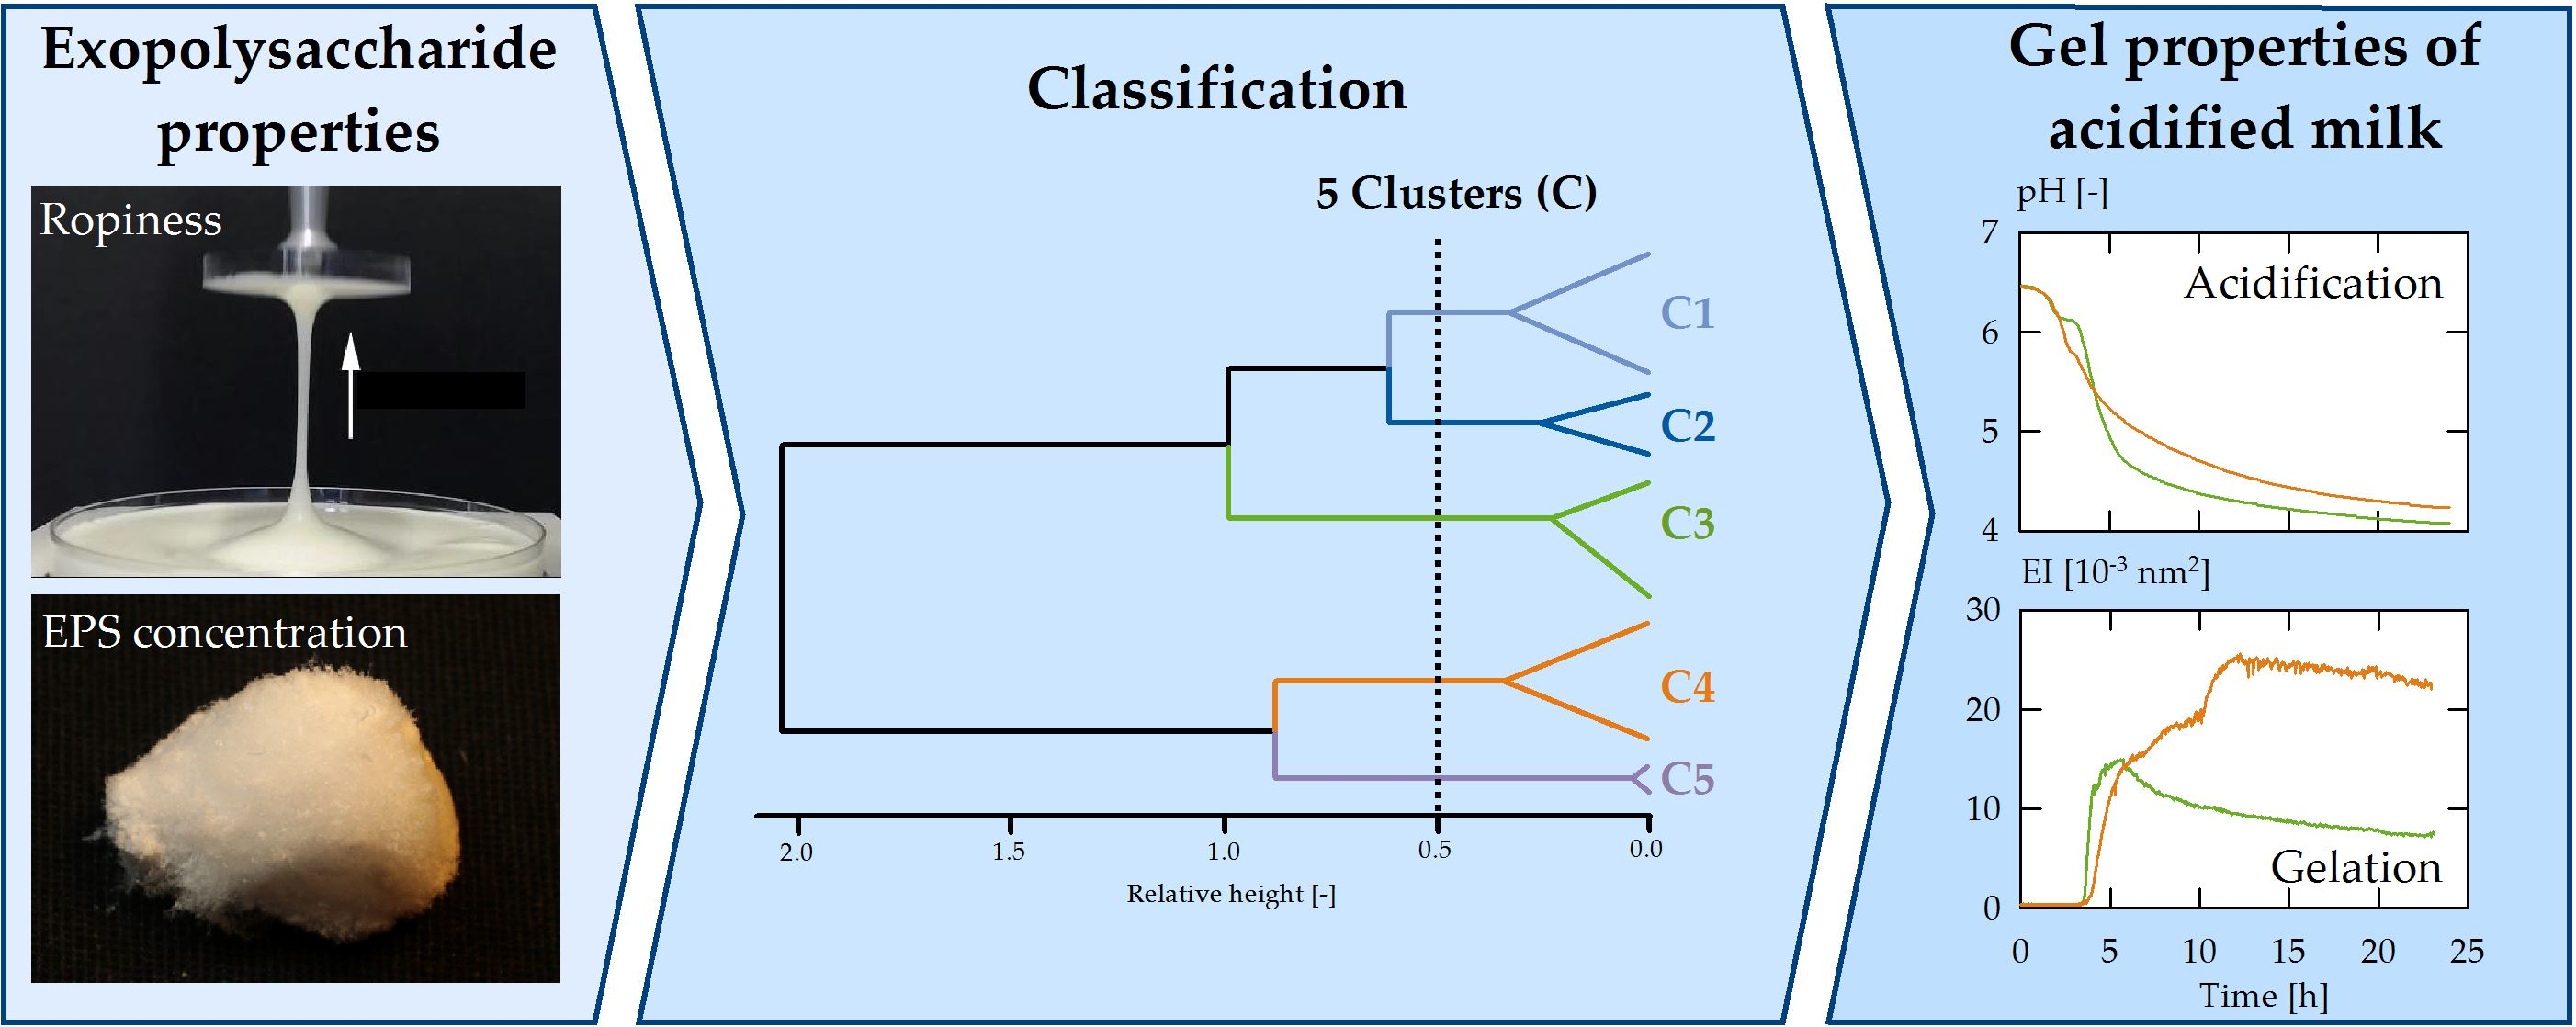
3. Results and Discussion

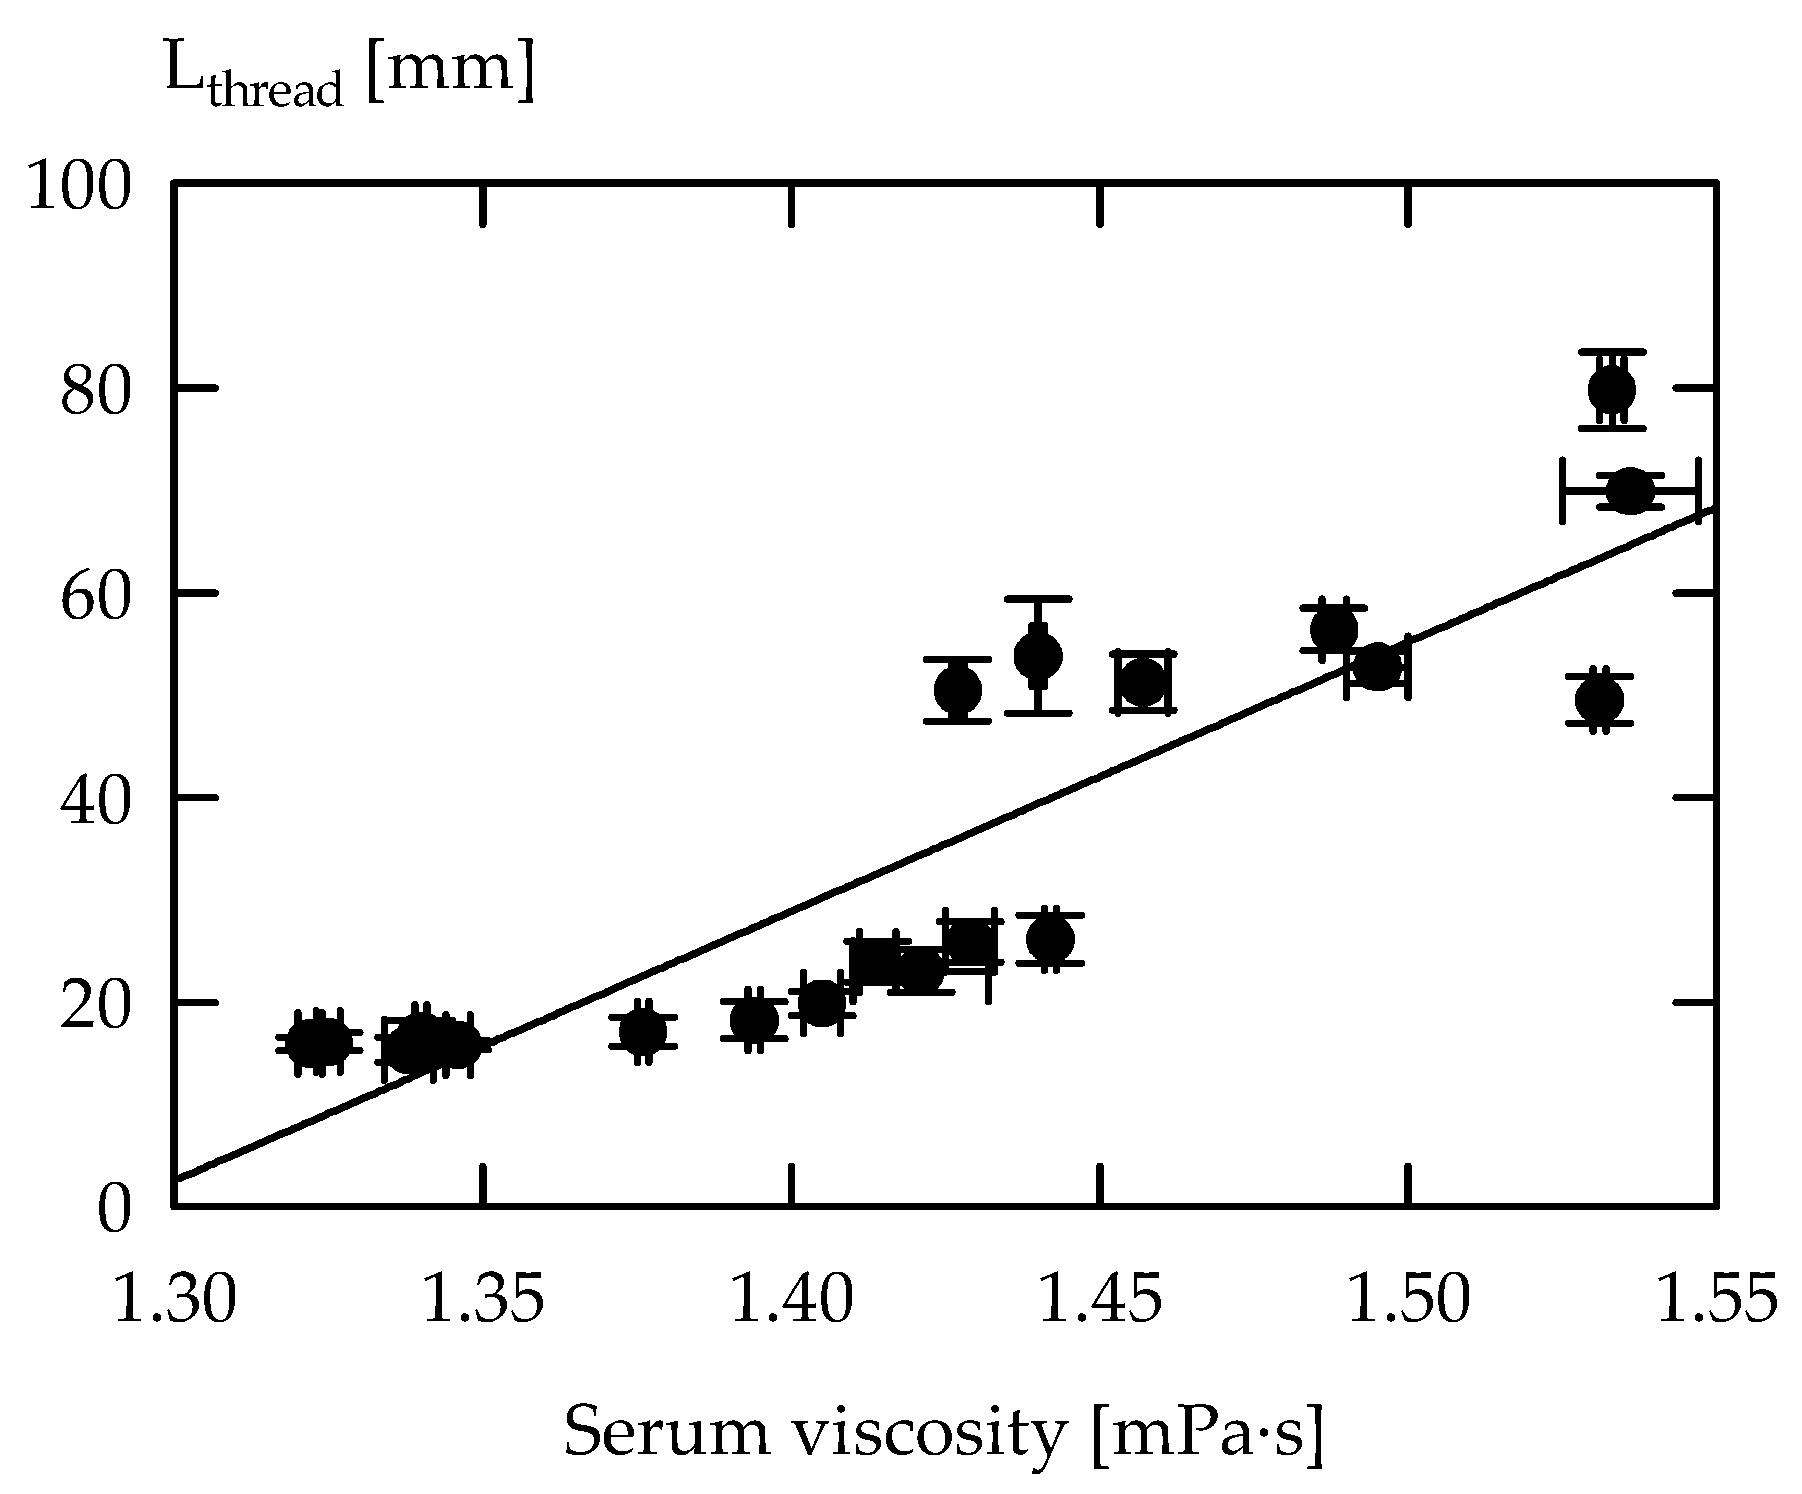
3.1. Exopolysaccharides in Acid Gel Suspensions

The concentration of EPS in acid gel suspensions was highly strain-dependent and varied from 8–126 mg GE/kg (Table 1). A similar range of 10–235 mg/L was found when milk was fermented with various starter cultures [4,9,23,39].
Dynamic viscosity of the separated serum ranged from 1.30–1.51 mPa·s. A higher serum viscosity, observed for e.g., ST-2K.+, must be attributed to remaining fEPS as the cEPS are separated with the cells. Serum viscosity was found to be related to yoghurt viscosity [40,41,42]. In agreement with observations of Ren et al. [9] on LAB wild strains isolated from fermented vegetables, serum viscosity was not correlated with EPS concentration (r = 0.05, p > 0.05). These findings support the statement that texture and product viscosity can not only be explained by EPS concentration when different EPS producers are considered [25,43,44]. However, for EPS of a specific strain, a higher concentration was linked to higher product viscosity [45].
To quantify ropiness, Mozzi et al. [46] used a pipette, and denoted EPS as ropy when strings longer than 6 mm were observed. Other researchers who classified EPS ropiness on the basis of thread formation and extensibility used a so-called siphon test [4], an extensional rheometer [10], or a universal testing machine [11]. In the latter approach, Hess et al. [11] expanded the samples between two parallel plates at a velocity of 10 mm/s, and observed Lthread of 17–53 mm for milk fermented with different starter cultures. A higher thread length is an indicator for a more extensible product. In the current study, we decided to apply a higher velocity of 40 mm/s, and RSMsuppl was chosen as fermentation medium for this test. This resulted in an extended range of Lthread (e.g., ST-1E: 26 mm for RSM and 10 mm/s; RSMsuppl: 31 mm for 10 mm/s and 80 mm for 40 mm/s), and Lthread correlated significantly with the serum viscosity of acid gel suspensions made from RSMsuppl (Figure 1). The findings suggest that serum viscosity can be used as an indicator for ropiness. It cannot be completely excluded that the supplementation of RSM may affect EPS formation, but viscosity of the sera obtained after fermentation in RSM and RSMsuppl correlated significantly (r = 0.84, p < 0.05).

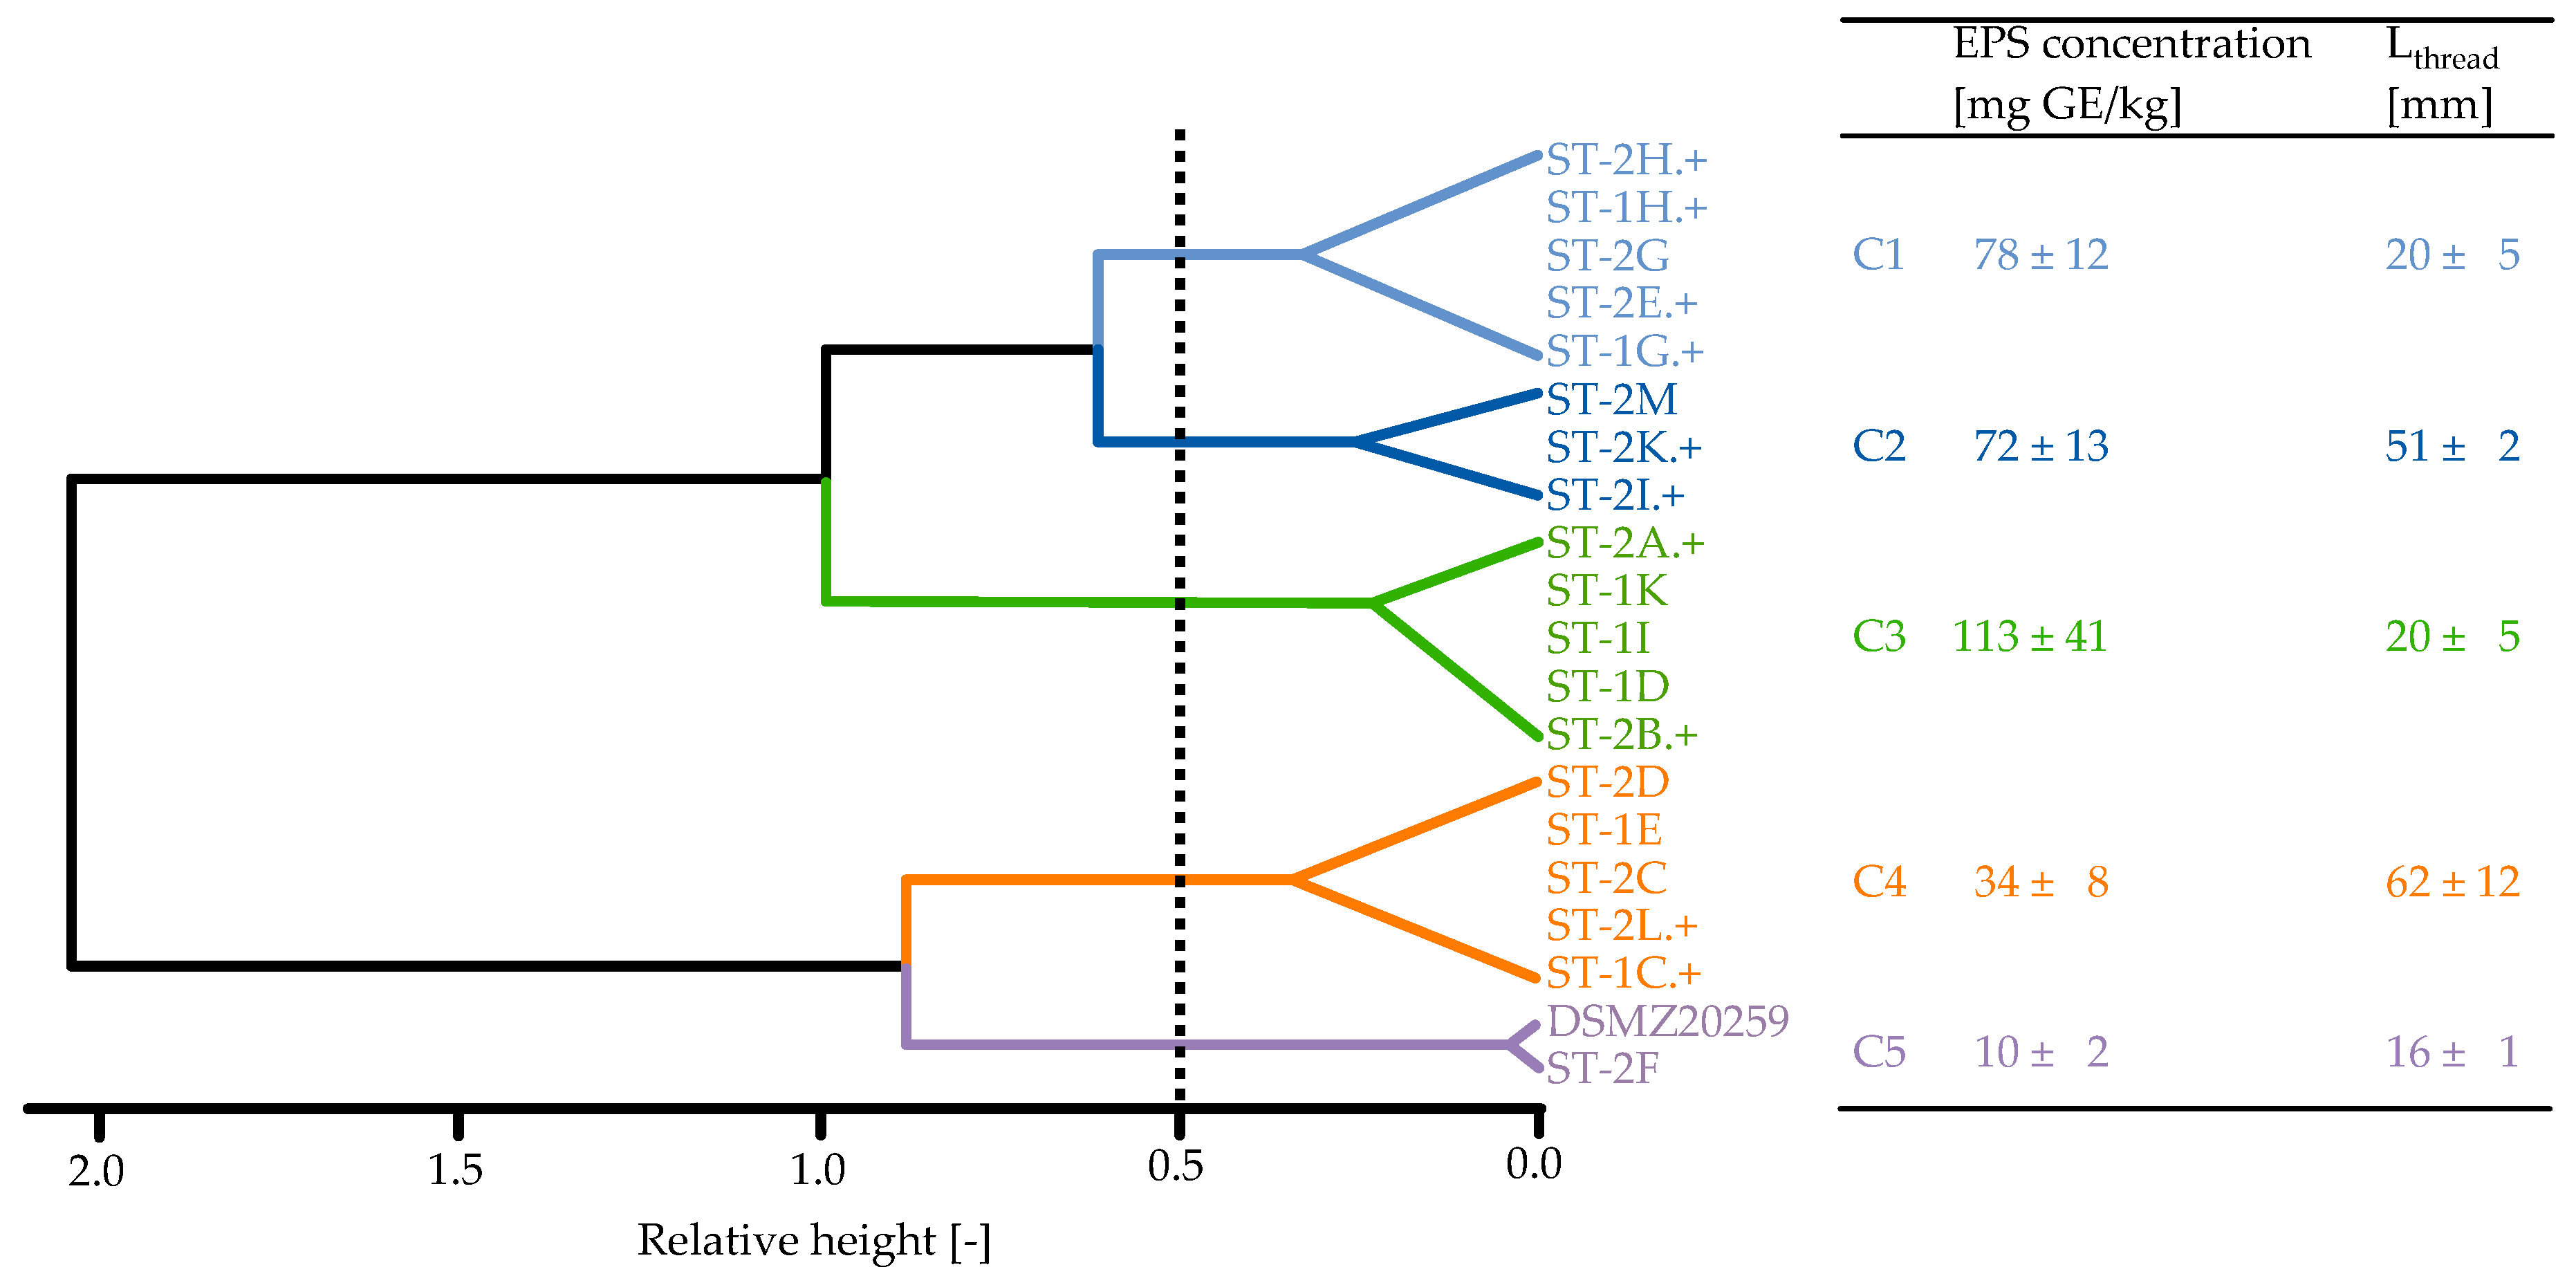
3.2. Strain Classification

In cluster analysis performed on EPS concentration and Lthread, five distinct clusters (C) were identified (Figure 2). As serum viscosity correlated with Lthread (see Figure 1), it was excluded from cluster analysis. At the first cluster branch there is a clear separation into strains showing high (C1–C3) or low EPS concentration (C4–C5). Strains producing low amounts of EPS are well separated by Lthread into clusters C4 and C5. The strains ST-2F and DSMZ20259 of C5 (low EPS concentration, low Lthread) can be denoted as EPS negative. Cluster 4 represents strains producing low amounts of EPS, but evoking high ropiness in acid gel suspensions. Strains in C1–C3 which produced high amounts of EPS can be further distinguished by EPS concentration at the second branch (approx. 113 vs. 75 mg GE/kg); the third branch allows distinguishing between C1 and C2 by Lthread. Lthread of the strains in clusters C1 and C3 was similar to that of the EPS-negative strains (C5), indicating nonropy fEPS. The high strain-to-strain variability even within one species of LAB is clearly evident from this classification approach. As highly ropy strains were found in both C2 and C4, it is obvious that EPS concentration is not the only factor that contributes to ropiness. Strains producing cEPS were present in all clusters, except for the EPS-negative strain (C5).

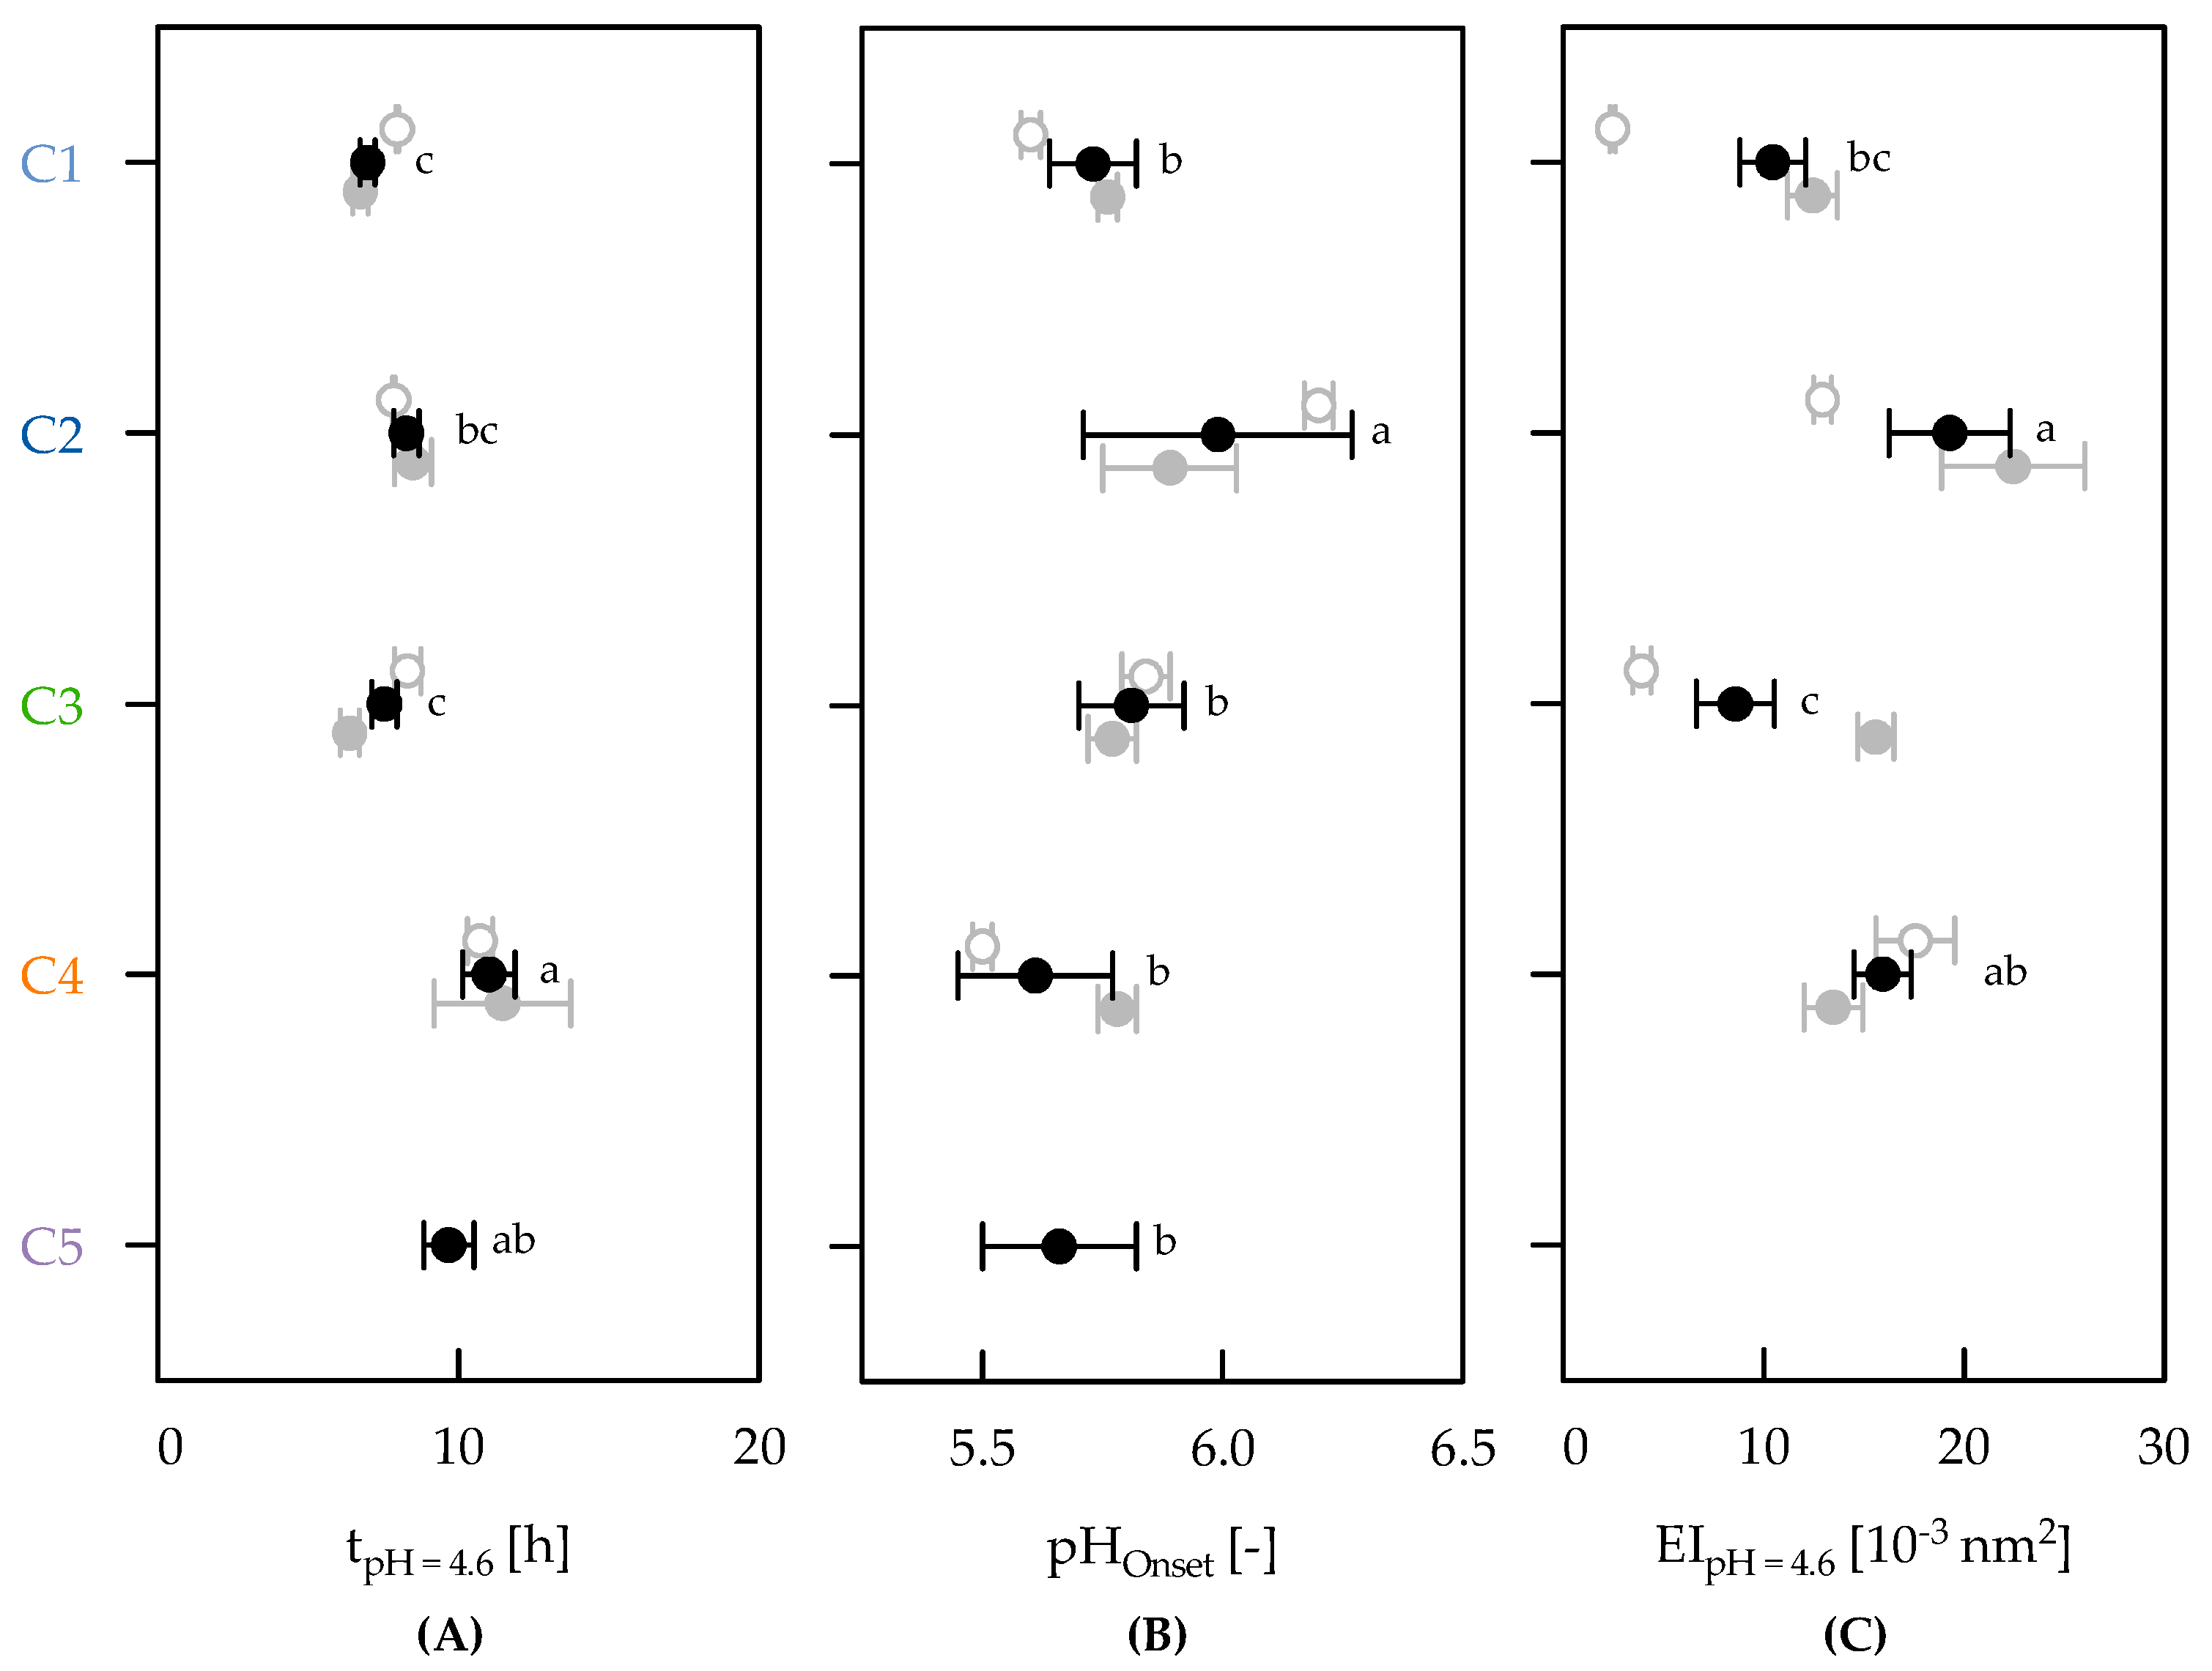
3.3. Effect of Clusters on Gelation Behaviour

In recent studies, Multispeckle Diffusing Wave Spectroscopy was used to investigate acid-induced [47] and rennet-induced gelation of skim milk [48]. The elasticity index recorded by the instrument correlates with the storage modulus from small deformation rheology and can therefore be taken as an indicator for gel stiffness [47,49].
Figure 3 compares the acidification and gelation curves for ST-2C, producing ropy fEPS, from cluster 4, and for ST-2B.+, producing nonropy fEPS and cEPS, assigned to C3. Apart from tpH = 4.6 and pHt = 24 h, gelation onset time at EI = 10−3 nm2 (tOnset), the corresponding pH (pHOnset), and EI at pH 4.6 (EIpH = 4.6) were read from the MS-DWS curves. The acidification activity was less pronounced for ST-2C (both tpH = 4.6 and pHt = 24 h were higher), which also affected gelation behaviour (tOnset and EIpH = 4.6 were higher, and pHOnset was lower as compared to ST-2B.+).
In the next step, the mentioned parameters were averaged per cluster. As a significant correlation was found between tpH = 4.6 and pHt = 24 h and between tpH = 4.6 and tOnset (r = 0.82 and r = 0.84, respectively; p < 0.10), pHt = 24 h and tOnset were not considered in further analysis. The remaining data for the respective clusters are shown in Figure 4. Time to reach pH 4.6 was higher for strains producing ropy fEPS (C2 and C4) and for the EPS negative strains (C5) than for nonropy fEPS producing strains (C1 and C3), indicating slower acidification. A higher tpH = 4.6 was therefore necessary for strains that produced low amounts of EPS or none (C4, C5), see also Mende et al. [23]. pH at gelation onset was significantly higher for strains producing higher amounts of EPS and ropy fEPS (C2) than for the low EPS (C4, C5) and nonropy fEPS strains (C1, C3). During gel formation, higher amounts of polysaccharides may affect attraction forces between larger casein micelles because of larger phase separating regions [50]. For the strains of C1–C4 which produced also cEPS, pHOnset was similar to that of non-cEPS producers (C5), while Hassan et al. [31] detected an earlier gelation onset for cEPS producers. However, the observed pHOnset in this study was generally higher than earlier findings based on oscillatory rheology [23,51], which was also found by Kristo et al. [52]. Generally, the gelation pH of heated milks is close to the isoelectric point of whey proteins (pH ~5.3) [53]. An earlier gelation onset observed by MS-DWS was recently explained by the noninvasive particle tracking observations in the measurements [49].
A higher gel stiffness as indicated by EIpH = 4.6 was observed for the ropy fEPS producers in C2 and C4, and can be explained by reduced particle motion at the measurement point in the MS-DWS cuvettes (height = 24 mm) [47]. Data of the EPS negative strains are missing because of inhomogeneities due to excessive gel shrinkage [47] because of syneresis, which was found to be higher for acid gels with EPS-negative strains [23,33]. The impact of ropy EPS on gel stiffness was frequently addressed after performing oscillatory rheology [23,31,32,33,39,45]. For the strains producing high amounts of EPS (C1–C3), the results further indicate that the presence of cEPS is responsible for the higher gel stiffness, which might be explained by a high water-binding ability similar to ropy fEPS [38]. For gels containing ropy fEPS, the higher stiffness might be attributed to interactions between EPS and protein or the prolonged fermentation (higher tpH = 4.6), which affects microstructure formation and the incorporation of EPS in the protein network [54,55]. To result in similar acidification rate, Khanal and Lucey [51] supplemented milk with different amounts of peptone, and found differences in gel stiffness between strains that produced EPS with different chemical structure and molecular mass. However, the supplementation of any substrate with a protein fraction is known to enhance EPS production [56], and resulted in a higher storage modulus of whey permeate fermented with EPS-producing strains [57]. Hassan et al. [31] used three yoghurt cultures showing a similar acidification time and explained differences in gel stiffness by the type of EPS. They detected a higher stiffness of acid gels that contained nonropy fEPS and cEPS, compared to gels with ropy fEPS and cEPS. This is in contrast to Bullard et al. [33] who were not able to distinguish effects on product properties that were induced by different types of EPS. For single strains, a higher stiffness for nonropy fEPS and cEPS was observed by Purwandari et al. [32], while Gentes et al. [58] detected a higher stiffness in gels with ropy fEPS. Our findings point on the importance of both ropy fEPS and cEPS for the improvement of acid gel properties.
Finally, we observed a moderate correlation between EIpH = 4.6 and the EPS concentration for the different clusters (r = 0.82, p < 0.10). This correlation was also reported for S. thermophilus strains when adding isolated fractions of EPS at increasing concentration to milk prior to acidification [45], or for in situ produced EPS in yoghurt gels [4,32]. Mende et al. [2] summarised that the relation between EPS concentration and product properties is still a controversial issue, while other factors such as macromolecular and structural properties of EPS or interactions between EPS and protein have to be considered.

4. Conclusions

Exopolysaccharides from S. thermophilus strains showed a major effect on the physical properties of acid gel suspensions. The length of thread as the indicator of ropiness was found to correlate well with the viscosity of the cell-free serum, but was not clearly related to EPS concentration. We therefore highlight the benefits of detecting serum viscosity as an indicator for the degree of ropiness.
The high strain-to-strain variability even within one species of LAB is clearly evident from cluster analysis performed on EPS concentration and ropiness. Highly ropy strains were found to produce either high or low amounts of EPS. Strains also producing cEPS were represented in all clusters, except EPS-negative strains. Results from acidification and gelation curves averaged per cluster indicated increased fermentation time and gel stiffness for strains producing ropy fEPS than for nonropy fEPS producers. A further increase in stiffness was detected for strains also producing cEPS, which point to the importance of both ropy fEPS and cEPS for the improvement of the texture of fermented dairy products. A moderate correlation was found between gel stiffness and EPS concentration; however, other factors have to be considered. It is suggested to determine texture (e.g., syneresis, sensory) and physicochemical properties (e.g., molecular mass) in combination with biochemical and structural characterisation for the examination of correlations between these characteristics and their impact on a product.

Author Contributions

G.S. and S.M. designed the experiments; G.S. performed the experiments and analysed the data; S.M. and D.J. co-supervised the work; G.S., D.J. and H.R. wrote the manuscript.

Funding

The IGF Project 18318 BR of the FEI was supported via AiF within the programme for promoting the Industrial Collective Research (IGF) of the German Ministry of Economic Affairs and Energy (BMWi), based on a resolution of the German Parliament. Financial support was received from the SLUB/TU Dresden for Open Access publication.

Acknowledgments

Special thanks go to Frederik Schleife and Mathias Lesti from Quantachrome GmbH & Co. KG (Odelzhausen, Germany) for providing the RheolaserTM Master and corresponding support.

Conflicts of Interest

The authors declare no conflict of interest.

References

  1. Waters, D.M.; Mauch, A.; Coffey, A.; Arendt, E.K.; Zannini, E. Lactic acid bacteria as a cell factory for the delivery of functional biomolecules and ingredients in cereal-based beverages: A review. Crit. Rev. Food Sci. Nutr. 2015, 55, 503–520. [Google Scholar] [CrossRef]
  2. Mende, S.; Rohm, H.; Jaros, D. Influence of exopolysaccharides on the structure, texture, stability and sensory properties of yoghurt and related products. Int. Dairy J. 2016, 52, 57–71. [Google Scholar] [CrossRef]
  3. Costa, N.E.; Wang, L.; Auty, M.E.; Hannon, J.A.; McSweeney, P.L.H.H.; Beresford, T.P. Rheological, microscopic and primary chemical characterisation of the exopolysaccharide produced by Lactococcus lactis subsp. cremoris DPC6532. Dairy Sci. Technol. 2012, 92, 219–235. [Google Scholar] [CrossRef]
  4. Folkenberg, D.M.; Dejmek, P.; Skriver, A.; Ipsen, R. Interactions between EPS-producing Streptococcus thermophilus strains in mixed yoghurt cultures. J. Dairy Res. 2006, 73, 385–393. [Google Scholar] [CrossRef]
  5. Hahn, C.; Müller, E.; Wille, S.; Weiss, J.; Atamer, Z.; Hinrichs, J. Control of microgel particle growth in fresh cheese (concentrated fermented milk) with an exopolysaccharide-producing starter culture. Int. Dairy J. 2014, 36, 46–54. [Google Scholar] [CrossRef]
  6. Zeidan, A.A.; Poulsen, V.K.; Janzen, T.; Buldo, P.; Derkx, P.M.F.; Øregaard, G.; Neves, A.R. Polysaccharide production by lactic acid bacteria: From genes to industrial applications. FEMS Microbiol. Rev. 2017, 41, S168–S200. [Google Scholar] [CrossRef]
  7. Paulo, E.M.; Vasconcelos, M.P.; Oliveira, I.S.; de Jesus Affe, H.M.; Nascimento, R.; de Melo, I.S.; de Abreu Roque, M.R.; de Assis, S.A. An alternative method for screening lactic acid bacteria for the production of exopolysaccharides with rapid confirmation. Food Sci. Technol. 2012, 32, 710–714. [Google Scholar] [CrossRef] [Green Version]
  8. Ricciardi, A.; Parente, E.; Clementi, F. A simple method for the screening of lactic acid bacteria for the production of exopolysaccharides in liquid media. Biotechnol. Tech. 1997, 11, 271–275. [Google Scholar] [CrossRef]
  9. Ren, W.; Xia, Y.; Wang, G.; Zhang, H.; Zhu, S.; Ai, L. Bioactive exopolysaccharides from a S. thermophilus strain: Screening, purification and characterization. Int. J. Biol. Macromol. 2016, 86, 402–407. [Google Scholar] [CrossRef]
  10. Manoury, E.; Horvath, P.; Fremaux, C.; Fourcassie, P. Genetic Cluster of Strains of Streptococcus thermophilus having Unique Rheological Properties for Dairy Fermentation. WO2010066907A1, 12 December 2010. [Google Scholar]
  11. Hess, S.J.; Roberts, R.F.; Ziegler, G.R. Rheological properties of nonfat yogurt stabilized using Lactobacillus delbrueckii ssp. bulgaricus producing exopolysaccharide or using commercial stabilizer systems. J. Dairy Sci. 1997, 80, 252–263. [Google Scholar] [CrossRef]
  12. Hughes, R.B.; Smith, A.C. Capsule Stain Protocols. Available online: http://www.asmscience.org/content/education/protocol/protocol.3041 (accessed on 29 January 2019).
  13. Mozzi, F.; Vaningelgem, F.; Hébert, E.M.; Van der Meulen, R.; Foulquié Moreno, M.R.; Font de Valdez, G.; De Vuyst, L.; Moreno, M.R.F.; Font de Valdez, G.; De Vuyst, L. Diversity of heteropolysaccharide-producing lactic acid bacterium strains and their biopolymers. Appl. Environ. Microbiol. 2006, 72, 4431–4435. [Google Scholar] [CrossRef]
  14. Hassan, A.N.N. ADSA Foundation Scholar Award: Possibilities and challenges of exopolysaccharide-producing lactic cultures in dairy foods. J. Dairy Sci. 2008, 91, 1282–1298. [Google Scholar] [CrossRef]
  15. Robitaille, G.; Moineau, S.; St-Gelais, D.; Vadeboncoeur, C.; Britten, M. Detection and quantification of capsular exopolysaccharides from Streptococcus thermophilus using lectin probes. J. Dairy Sci. 2006, 89, 4156–4162. [Google Scholar] [CrossRef]
  16. Hilbig, J.; Loeffler, M.; Herrmann, K.; Weiss, J. Application of exopolysaccharide-forming lactic acid bacteria in cooked ham model systems. Food Res. Int. 2019, 119, 761–768. [Google Scholar] [CrossRef]
  17. Zhang, L.; Folkenberg, D.M.; Qvist, K.B.; Ipsen, R. Further development of a method for visualisation of exopolysaccharides in yoghurt using fluorescent conjugates. Int. Dairy J. 2014, 46, 88–95. [Google Scholar] [CrossRef]
  18. Rühmann, B.; Schmid, J.; Sieber, V. High throughput exopolysaccharide screening platform: From strain cultivation to monosaccharide composition and carbohydrate fingerprinting in one day. Carbohydr. Polym. 2015, 122, 212–220. [Google Scholar] [CrossRef] [Green Version]
  19. Van Geel-Schutten, G.H.; Flesch, F.; Ten Brink, B.; Smith, M.R.; Dijkhuizen, L. Screening and characterization of Lactobacillus strains producing large amounts of exopolysaccharides. Appl. Microbiol. Biotechnol. 1998, 50, 697–703. [Google Scholar] [CrossRef]
  20. Marshall, V.M.; Laws, A.P.; Gu, Y.; Levander, F.; Rådström, P.; De Vuyst, L.; Degeest, B.; Vaningelgem, F.; Dunn, H.; Elvin, M. Exopolysaccharide-producing strains of thermophilic lactic acid bacteria cluster into groups according to their EPS structure. Lett. Appl. Microbiol. 2001, 32, 433–437. [Google Scholar] [CrossRef] [Green Version]
  21. Pachekrepapol, U.; Lucey, J.A.; Gong, Y.; Naran, R.; Azadi, P. Characterization of the chemical structures and physical properties of exopolysaccharides produced by various Streptococcus thermophilus strains. J. Dairy Sci. 2017, 100, 3424–3435. [Google Scholar] [CrossRef]
  22. Pachekrepapol, U.; Lucey, J.A.; Gong, Y.; Naran, R.; Azadi, P. Corrigendum to “Characterization of the chemical structures and physical properties of exopolysaccharides produced by various Streptococcus thermophilus strains” (J. Dairy Sci. 100:3424–3435). J. Dairy Sci. 2018, 101, 5668. [Google Scholar] [CrossRef]
  23. Mende, S.; Mentner, C.; Thomas, S.; Rohm, H.; Jaros, D. Exopolysaccharide production by three different strains of Streptococcus thermophilus and its effect on physical properties of acidified milk. Eng. Life Sci. 2012, 12, 466–474. [Google Scholar] [CrossRef]
  24. Vaningelgem, F.; Zamfir, M.; Mozzi, F.; Adriany, T.; Vancanneyt, M.; Swings, J.; De Vuyst, L. Biodiversity of exopolysaccharides produced by Streptococcus thermophilus strains is reflected in their production and their molecular and functional characteristics. Appl. Environ. Microbiol. 2004, 70, 900–912. [Google Scholar] [CrossRef] [PubMed]
  25. Buldo, P.; Benfeldt, C.; Folkenberg, D.M.; Jensen, H.B.; Amigo, J.M.; Sieuwerts, S.; Thygesen, K.; van den Berg, F.; Ipsen, R. The role of exopolysaccharide-producing cultures and whey protein ingredients in yoghurt. LWT—Food Sci. Technol. 2016, 72, 189–198. [Google Scholar] [CrossRef]
  26. Hassan, A.N.N.; Frank, J.F.; Schmidt, K.A.; Shalabi, S.I. Textural properties of yogurt made with encapsulated nonropy lactic cultures. J. Dairy Sci. 1996, 79, 2098–2103. [Google Scholar] [CrossRef]
  27. Faber, E.J.; Zoon, P.; Kamerling, J.P.; Vliegenthart, J.F.G. The exopolysaccharides produced by Streptococcus thermophilus Rs and Sts have the same repeating unit but differ in viscosity of their milk cultures. Carbohydr. Res. 1998, 310, 269–276. [Google Scholar] [CrossRef]
  28. Hamet, M.F.; Piermaria, J.A.; Abraham, A.G. Selection of EPS-producing Lactobacillus strains isolated from kefir grains and rheological characterization of the fermented milks. LWT—Food Sci. Technol. 2015, 63, 129–135. [Google Scholar] [CrossRef]
  29. Poulsen, V.K.; Derkx, P.; Oregaard, G. High-throughput screening for texturing Lactococcus strains. FEMS Microbiol. Lett. 2019, 366, 1–7. [Google Scholar] [CrossRef]
  30. Van der Meulen, R.; Grosu-Tudor, S.; Mozzi, F.; Vaningelgem, F.; Zamfir, M.; Font de Valdez, G.; De Vuyst, L. Screening of lactic acid bacteria isolates from dairy and cereal products for exopolysaccharide production and genes involved. Int. J. Food Microbiol. 2007, 118, 250–258. [Google Scholar] [CrossRef]
  31. Hassan, A.N.N.; Corredig, M.; Frank, J.F. Capsule formation by nonropy starter cultures affects the viscoelastic properties of yogurt during structure formation. J. Dairy Sci. 2002, 85, 716–720. [Google Scholar] [CrossRef]
  32. Purwandari, U.; Shah, N.P.; Vasiljevic, T. Effects of exopolysaccharide-producing strains of Streptococcus thermophilus on technological and rheological properties of set-type yoghurt. Int. Dairy J. 2007, 17, 1344–1352. [Google Scholar] [CrossRef]
  33. Bullard, J.; St-Gelais, D.; Turgeon, S.L. Production of set yoghurts using thermophilic starters composed of two strains with different growth biocompatibilities and producing different exopolysaccharides. Int. Dairy J. 2018, 79, 33–42. [Google Scholar] [CrossRef]
  34. Mårtensson, O.; Öste, R.; Holst, O. Lactic acid bacteria in an oat-based non-dairy milk substitute: Fermentation characteristics and exopolysaccharide formation. LWT—Food Sci. Technol. 2000, 33, 525–530. [Google Scholar] [CrossRef]
  35. Jaros, D.; Heidig, C.; Rohm, H. Enzymatic modification through microbial transglutaminase enhances the viscosity of stirred yogurt. J. Texture Stud. 2007, 38, 179–198. [Google Scholar] [CrossRef]
  36. Jaros, D.; Haque, A.; Kneifel, W.; Rohm, H. Influence of the starter culture on the relationship between dry matter content and physical properties of stirred yogurt. Milchwiss. Milk Sci. Int. 2002, 57, 447–450. [Google Scholar]
  37. Dubois, M.; Gilles, K.A.; Hamilton, J.K.; Rebers, P.A.; Smith, F. Colorimetric method for determination of sugars and related substances. Anal. Chem. 1956, 28, 350–356. [Google Scholar] [CrossRef]
  38. Mende, S.; Dong, T.; Rathemacher, A.; Rohm, H.; Jaros, D. Physicochemical characterisation of the exopolysaccharides of Streptococcus thermophilus ST-143. Int. J. Food Sci. Technol. 2014, 49, 1254–1263. [Google Scholar] [CrossRef]
  39. Amatayakul, T.; Sherkat, F.; Shah, N.P. Physical characteristics of set yoghurt made with altered casein to whey protein ratios and EPS-producing starter cultures at 9 and 14% total solids. Food Hydrocoll. 2006, 20, 314–324. [Google Scholar] [CrossRef]
  40. van Marle, M.E.; van den Ende, D.; de Kruif, C.G.; Mellema, J. Steady-shear viscosity of stirred yogurts with varying ropiness. J. Rheol. 1999, 43, 1643–1662. [Google Scholar] [CrossRef]
  41. Hassan, A.N.N.; Ipsen, R.; Janzen, T.; Qvist, K.B. Microstructure and rheology of yogurt made with cultures differing only in their ability to produce exopolysaccharides. J. Dairy Sci. 2003, 86, 1632–1638. [Google Scholar] [CrossRef]
  42. Ruas-Madiedo, P.; Alting, A.C.; Zoon, P. Effect of exopolysaccharides and proteolytic activity of Lactococcus lactis subsp. cremoris strains on the viscosity and structure of fermented milks. Int. Dairy J. 2005, 15, 155–164. [Google Scholar] [CrossRef]
  43. Marshall, V.M.; Rawson, H.L. Effects of exopolysaccharide-producing strains of thermophilic lactic acid bacteria on the texture of stirred yoghurt. Int. J. Food Sci. Technol. 1999, 34, 137–143. [Google Scholar] [CrossRef]
  44. Petry, S.; Furlan, S.; Waghorne, E.; Saulnier, L.; Cerning, J.; Maguin, E. Comparison of the thickening properties of four Lactobacillus delbrueckii subsp. bulgaricus strains and physicochemical characterization of their exopolysaccharides. FEMS Microbiol. Lett. 2003, 221, 285–291. [Google Scholar] [CrossRef]
  45. Mende, S.; Peter, M.; Bartels, K.; Rohm, H.; Jaros, D. Addition of purified exopolysaccharide isolates from S. thermophilus to milk and their impact on the rheology of acid gels. Food Hydrocoll. 2013, 32, 178–185. [Google Scholar] [CrossRef]
  46. Mozzi, F.; Torino, M.I.; de Valdez, G.F. Identification of exopolysaccharide-producing: Lactic acid bacteria a method for the isolation of polysaccharides in milk cultures. In Food Microbiology Protocols; Spencer, J.F.T., de Ragout Spencer, A.L., Eds.; Humana Press: New York City, NY, USA, 2001; Volume 14, pp. 183–190. [Google Scholar]
  47. Rohart, A.; Michon, C.; Confiac, J.; Bosc, V. Evaluation of ready-to-use SMLS and DWS devices to study acid-induced milk gel changes and syneresis. Dairy Sci. Technol. 2016, 96, 459–475. [Google Scholar] [CrossRef] [Green Version]
  48. Han, Y.; Mei, Y.; Li, K.; Xu, Y.; Wang, F. Effect of transglutaminase on rennet-induced gelation of skim milk and soymilk mixtures. J. Sci. Food Agric. 2019, 99, 1820–1827. [Google Scholar] [CrossRef]
  49. Raak, N.; Leidner, R.; Rohm, H.; Jaros, D. Potential of thromboelastometry and multispeckle diffusing wave difference during polymer melt extrusion flows sprectroscopy for monitoring acid-induced casein gelation. In Annual Transactions of the Nordic Rheology Society; Kádár, R., Ed.; Nordic Rheology Society: Helsinki, Finland, 2016; Volume 24, pp. 81–85. [Google Scholar]
  50. Dickinson, E. Colloid science of mixed ingredients. Soft. Matter 2006, 2, 642–652. [Google Scholar] [CrossRef]
  51. Khanal, S.N.; Lucey, J.A. Evaluation of the yield, molar mass of exopolysaccharides, and rheological properties of gels formed during fermentation of milk by Streptococcus thermophilus strains St-143 and ST-10255y. J. Dairy Sci. 2017, 100, 6906–6917. [Google Scholar] [CrossRef]
  52. Kristo, E.; Miao, Z.; Corredig, M. The role of exopolysaccharide produced by Lactococcus lactis subsp. cremoris in structure formation and recovery of acid milk gels. Int. Dairy J. 2011, 21, 656–662. [Google Scholar] [CrossRef]
  53. Lucey, J.A. Formation, structural properties and rheology of acid-coagulated milk gels. In Cheese: Chemistry, Physics and Microbiology; Fox, P.F., McSweeney, P.L.H., Cogan, T.M., Guinee, T.P., Eds.; Elsevier: Heidelberg, Germany, 2004; Volume 1, pp. 105–122. [Google Scholar]
  54. Folkenberg, D.M.; Dejmek, P.; Skriver, A.; Skov Guldager, H.; Ipsen, R. Sensory and rheological screening of exopolysaccharide producing strains of bacterial yoghurt cultures. Int. Dairy J. 2006, 16, 111–118. [Google Scholar] [CrossRef]
  55. Jaros, D.; Rohm, H.; Haque, A.; Bonaparte, C.; Kneifel, W. Influence of the starter culture on the relationship between dry matter content and physical properties of set-style yogurt. Milchwiss. Milk Sci. Int. 2002, 57, 325–328. [Google Scholar]
  56. Zisu, B.; Shah, N.P. Effects of pH, temperature, supplementation with whey protein concentrate, and adjunct cultures on the production of exopolysaccharides by Streptococcus thermophilus 1275. J. Dairy Sci. 2003, 86, 3405–3415. [Google Scholar] [CrossRef]
  57. Ayala-Hernández, I.; Hassan, A.N.N.; Goff, H.D.; Corredig, M. Effect of protein supplementation on the rheological characteristics of milk permeates fermented with exopolysaccharide-producing Lactococcus lactis subsp. cremoris. Food Hydrocoll. 2009, 23, 1299–1304. [Google Scholar]
  58. Gentès, M.C.; St-Gelais, D.; Turgeon, S.L. Gel formation and rheological properties of fermented milk with in situ exopolysaccharide production by lactic acid bacteria. Dairy Sci. Technol. 2011, 91, 645–661. [Google Scholar] [CrossRef]
Figure 1. Correlation plot of length of thread (Lthread) vs. serum viscosity of acid gel suspensions from supplemented reconstituted skim milk fermented with S. thermophilus strains (r = 0.88, p < 0.05).
Foods 08 00146 g001
Figure 2. Cluster plot of Euclidian distance cluster analysis using Ward linkage on length of thread (Lthread) and EPS concentration of acid gel suspensions. Inserted table represents average data of Lthread and EPS concentration for each cluster (C). A ‘+’ after the strain code indicates microscopic evidence of cell-bound EPS.
Foods 08 00146 g002
Figure 3. pH (A) and elasticity index (EI) (B) during acidification of reconstituted skim milk with ST-2B.+ (green) and ST-2C (orange). Parameters obtained are time until pH 4.6 (tpH = 4.6), pH at end of fermentation (pHt = 24 h), gelation onset at EI = 10−3 nm2 (tOnset) and corresponding pH (pHOnset), EI at pH 4.6 (EIpH = 4.6). Curves are representative runs (see Figure 4 for statistical analysis).
Foods 08 00146 g003
Figure 4. Cluster-specific average time until pH 4.6 (tpH = 4.6) (A), pH at gelation onset (pHOnset) (B) and elasticity index at pH 4.6 (EIpH = 4.6) (black, C). Mean values in the same plot with different superscripts differ significantly at p < 0.10. To study the influence of cell-bound EPS (cEPS), data is also displayed for non-cEPS (grey, open) and cEPS producers (grey, closed). EIpH = 4.6 of C5 is not included due to gel shrinkage. Bars indicate standard error of the mean.
Foods 08 00146 g004
Table 1. Exopolysaccharide (EPS) concentration in reconstituted skim milk fermented with Streptococcus thermophilus (ST) strains, and corresponding serum viscosity.
Strain 1EPS Concentration (mg GE/kg) 2Serum Viscosity (mPa·s)
ST-1C.+25 ± 4.9 fg1.34 ± 0.004 f
ST-1D106 ± 36.3 b1.30 ± 0.006 h
ST-1E25 ± 1.1 fg1.42 ± 0.020 d
ST-1G.+80 ± 18.2 c1.40 ± 0.005 e
ST-1H.+59 ± 6.6 d1.32 ± 0.004 g
ST-1I110 ± 7.7 b1.35 ± 0.001 f
ST-1K125 ± 16.7 a1.31 ± 0.008 gh
ST-2A.+118 ± 17.4 ab1.43 ± 0.008 cd
ST-2B.+106 ± 9.9 b1.45 ± 0.006 c
ST-2C33 ± 2.3 ef1.42 ± 0.005 d
ST-2D44 ± 8.8 e1.49 ± 0.006 b
ST-2E.+87 ± 13.0 c1.44 ± 0.002 cd
ST-2F8 ± 2.4 h1.30 ± 0.001 h
ST-2G89 ± 7.6 c1.30 ± 0.003 h
ST-2H.+71 ± 7.9 cd1.40 ± 0.001 e
ST-2I.+57 ± 3.1 d1.44 ± 0.001 cd
ST-2K.+82 ± 14.7 c1.51 ± 0.027 a
ST-2L.+40 ± 3.4 ef1.39 ± 0.004 e
ST-2M75 ± 3.3 c1.43 ± 0.004 cd
DSMZ2025911 ± 2.4 gh1.31 ± 0.008 gh
1 A ‘+’ after the strain code indicates microscopic evidence of cell-bound EPS. 2 Mean values (± half deviation range, n = 2) with different superscripts per column differ significantly (p < 0.05).

