Abstract
Two types of braised pork were prepared from self-made braised sauce added to Maillard reaction intermediate (MRI) and white granulated sugar, respectively. Descriptive sensory analysis and gas chromatography-mass spectrometry (GC-MS) were conducted to investigate their differences in sensory and aroma compounds. The results showed that the effect of self-made braised sauce in braised pork was comparable to white granulated sugar. One-hundred-and-nine volatile flavor compounds were identified by GC-MS using headspace-solid phase microextraction (HS-SPME) and simultaneous distillation and extraction (SDE). Thirty-six odor active compounds with retention indexes ranging from 935–2465 were identified by aroma extract dilution analysis (AEDA). Additionally, their odor activity values (OAV) were calculated. It was found that 17 aroma compounds showed an OAV greater than 1. Among them, pentanal (almond, pungent), nonanal (fat, green), (E, E)-2,4-decadienal (fat, roast), phenylacetaldehyde (hawthorn, honey, sweet), dodecanal (lily, fat, citrus) and linalool (floral, lavender) reached the highest OAV values (>200), indicating a significant contribution to the aroma of two types of braised pork. These results indicated that the self-made braised sauce added with MRI could be used for cooking braised pork with good sensory characteristics.
1. Introduction
Braised pork is a traditional Chinese cuisine made from pig meat, which is quite popular among ordinary people due to its mellow taste and fatty but not greasy characteristics. There are several kinds of braised pork, such as Maoist braised pork (peppery taste), Dongpo braised pork (soft and refreshing), and Shanghai braised pork (sweet salty palatability). However, in order to reach a perfect color and flavor, too much sugar need to be added added during the cooking of braised pork. This may not only result in the decline of the nutritional value of the food itself but also excessive sugar consumption has been identified as the major cause of excessive caloric intake and is the main dietary determinant of obesity or other civilization diseases.
Recent researches have focused on the new sweeteners or seasonings as substitutions for sugar in food formulas [1,2]. However, these sweeteners cannot produce intense aroma and color compared with the white granulated sugar. It is well known that Maillard reaction plays an important role in the generation of aroma and taste-active compounds of processed food [3]. Complete Maillard reaction products (MRPs) are usually used for savory flavoring [4]. They have been favored by consumers over the years and are found to be intriguing by researchers because of their rich fragrance. However, since most of the flavor components in MRPs are volatile, it is difficult to maintain the stability of flavored end products for application, especially during the heating treatment of cooking. The loss of aroma and fragrance makes MRPs limited in the application. During the initial stage of Maillard reaction, neither aromas nor melanoids are produced but significant non-volatile aroma precursors-Maillard reaction intermediate (MRI) are formed [5]. When heated, MRI undergoes dehydration and fission as the Maillard reaction progresses and generates colorless reductones and heterocyclic compounds [6]. Hence, the braised sauce with MRI as a flavoring additive cannot exhibit its flavor during primary processing or storage at room temperature but generates desirable flavor and color during cooking.
However, there is lack of deep research on braised sauce with added MRI. Thus, the MRI from xylose-L-cysteine was prepared in an aqueous phase and its applications in braised pork were tested by gas chromatography-olfactometry (GC-O) with aroma extraction dilution analysis (AEDA) and odor activity values (OAV). Xylose, an aldopentose, is one of the reaction precursors. It is also mainly used as an ideal sweetener because of its physical characteristics, such as being a non-digestible sugar and having zero calories. L-cysteine (cys) was an important precursor for the formation of sulphur compounds and has been extensively used in the manufacturing of reaction flavors. Many researches have been reported to detect aroma-active compounds using GC-O [7,8,9,10,11,12]. In addition, in order to obtain the more comprehensive analysis of flavor compounds, solid phase microextraction (SPME) and simultaneous distillation and extraction (SDE) pre-treatment methods were compared.
During this study, two types of braised pork were prepared, cooked with self-made braised sauce added with MRI (A) and white granulated sugar (B), respectively. The objectives of the present study were (1) to compare the sensory characteristics and aroma attributes of the two kinds of braised pork by descriptive sensory analysis, (2) to analyze and compare the volatile compounds by SPME/SDE-GC-MS, (3) to screen the characteristic aroma-active compounds as determined by AEDA and OAV, and (4) to assess through the above analysis and whether the self-made braised sauce containing MRI was recommended for new cooking methods for braised pork.
2. Materials and Methods
2.1. Chemicals
3-methylbutanal, pentanal, α-pinene, hexanal, β-pinene, δ-3-carene, limonene, 1,8-cineole, acetoin, 2-methyltetrahydrofuran-3-one, nonanal, furfural, 2-acetylfuran, benzaldehyde, linalool, 1-terpinen-4-ol, (E)-2-decenal, phenylacetaldehyde, furfuryl alcohol, (E)-cinnamaldehyde, neral, dodecanal, 3-phenylpropanal, anethole, (E,E)-2,4-decadienal, 2-methoxybenzaldehyde, 2-acetylpyrrole, 4-methoxybenzaldehyde, (Z)-cinnamaldehyde, phenol, ethyl cinnamate, γ-undecalactone, cinnamyl alcohol, and coumarin.
2.2. Materials to Food Sample
Streaky pork (Shuanghui, China), edible soya oil (Golden arowana, China) and all other food materials were purchased from the local Tesco supermarket. 1,2-dichlorobenzene (internal standard) and C6-C30 n-alkane series (concentration of 1000 mg/L in in hexane) were purchased from Sigma-Aldrich Chemical Co. (St. Louis, MO, USA). The five-spice powder, braised soy sauce and pork paste were purchased from Tesco supermarket. The refined lard was purchased from Anhui Muyang Oil and Fats Co., Ltd. (Anhui, China).
2.3. Preparation of Self-Made Braised Sauce
Preparation of MRI: The MRI was prepared according to the Cui et al., method with some modification [13]. Xylose (4.5 g) and L-cysteine (0.54 g) (molar ratio about 10:1.5) were dissolved in water (50 g). The solution was transferred into 100-mL screw-sealed tubes. The pH was adjusted to 7.0 with either 1 mol/L HCl or 6 mol/L NaOH, the tubes were tightly capped and then heated in an oil bath with magnetic stirring (150 rpm) at 100 °C for 80 min. After the reaction, the tubes were immediately cooled in ice water for further use. The preparation was carried out in triplicate.
Preparation of braised sauce: The optimum formula of braised sauce was determined by a single factor test. The final recipe was as follows: MRI solution 82.80%, xylose 16.56%, methionine 0.34%, monascus color 0.07%, caramel pigment 0.10%, ethyl maltol 0.03%, and xanthan gum 0.10%. All ingredients were blended, stirred for 5 minutes at 400 r/min and then dispersed by a high-shear dispersion homogenizer at 10000 r/min for 3 minutes to a homogeneous solution. The preparation was carried out in triplicate.
2.4. Preparation of Braised Pork
The preparation was as follows: Step 1: The power of induction cooker was set to 1300 W, 10 g oil was put into the frying pan and 10 g Chinese onion; 10 g ginger and 10 g garlic were stirred into it for about 1 minute. Then 500 g streaky pork (3 centimeter square and 4 centimeter thick pieces) was transferred to the pan and quickly fried until the meat turned white. At that point, 50 g yellow wine, 12.5 g dark soy sauce and 80 g self-made braised sauce were spooned over the meat and stirred for about 4 minutes. Step 2: The heat was turned down to 800 W, and 5 g cinnamon, 5 g star anise, and 1000 g warm water were added to the above material and left to simmer very gently for 30 minutes until thickened. As the final step, the material was seasoned with 0.5 g salt and stirred rapidly under 1600 W power until the gravy turned thick, then it was dished up and served immediately. The braised pork sample was named as A.
The preparation of the traditional braised pork was the same as A but the 80-g self-made braised sauce was substituted with 20 g white granulated sugar and it was named as B.
2.5. Sensory Evaluation
The sensory analysis of the two types of braised pork was performed in a sensory laboratory set in accordance with ISO 8589 (2007). A ten-member panel (five females and five males, aged from 22 to 35 years) was selected to participate in the discriminating and descriptive evaluations. They were trained for 2 weeks to familiarize them with the characteristic of braised pork to be evaluated. In addition, panelists had stated and discussed characteristic sample aromas through three preliminary sessions until all of them had agreed on a consensus vocabulary to describe samples. Then, seven aroma attributes including meat flavor, spicy flavor, greasy, sauce flavor, braised flavor, caramel flavor, and overall flavor were used for the descriptive analysis. To ensure that the panelists clarified these sensory attributes, the reference materials were set as follows: Streaky pork (200 g) wrapped in aluminum foil and baked at 150 °C for 1 h for a “meat” note, a kind of commercially available five-spice powder dissolved in hot water for a “spicy” note, refined lard (100 g) for a “greasy” note, a kind of commercially available braise soy sauce for a “sauce” note, a kind of commercially available pork paste for a “braised” note, and white granulated sugar (100 g) boiled on a small fire to obtain a caramel flavor. The panelist was instructed to score on a scale from 0 (not detectable) to 9 (strongly detectable) with 9-point category scale properties in comparison with the standard flavor models [14]. An evaluation was done in triplicate (on separate days) in isolated booths under controlled light (artificial daylight) and room temperature (21 ± 1 °C) [15].
2.6. SPME
Divinylbenzene/carboxen/polydimethylsiloxane (DVB/CAR/PDMS) fiber (57 mm length; 50/30 µm film thickness) was adopted. A total of 6 g braised pork (fat 3.6 g, lean meat 2.4 g) was added into a 15 mL amber vial closed by a PTFE/silicone septum. Before the extraction process, a time of 15 min at 60 °C was given for subsequent headspace equilibration; the SPME fiber was exposed in the headspace, placed for 30 min, and then thermally desorbed in the GC-MS injector port.
2.7. SDE
An SDE was performed in a Likense Nickerson apparatus (SDE apparatus) using dichloromethane as the extraction solvent. A total of 200 g of braised pork (fat 120 g, lean meat 80 g) was immersed in a flask with 250 mL of distilled water, and 80 mL of dichloromethane was put in another flask. Both flasks were heated up to their boiling points. Once the two flasks started to reflux, the distillation–extraction was continued for 4 h to allow the volatile components to collect in dichloromethane. After cooling to ambient temperature for 10 min, the dichloromethane extract was dried over anhydrous Na2SO4 which was maintained at −18 °C overnight. The extract was filtered through a folded filter paper with favorable hydrophilic properties. The filtrate was then collected and concentrated to 2 mL in a rotary evaporator and then to exactly 0.5 mL under gentle nitrogen flow at room temperature. Concentrated extract was kept at −24 °C for GC-MS-O and GC-MS analysis.
2.8. GC-MS Analysis
The analysis of volatile compounds obtained by SPME and SDE was performed on a GC-MS using an Agilent 5975C mass selective detector coupled with an Agilent 7890A GC (Agilent, Santa Clara, CA, USA), equipped with HP-Wax capillary column (60 m × 0.25 mm inner diameter, 0.25 µm film thickness). Helium was used as a carrier gas and the flow rate was 1 mL/min. For the SDE, 1 µL extract was injected in splitless mode at 250 °C; for SPME analysis, desorption was also in splitless mode at 250 °C for 5 min. GC oven temperature was programmed at 40 °C (held for 6 min), increased to 100 °C at 3 °C/min, and finally increased to 230 °C (SPME held for 10 min, SDE held for 20 min) at 5 °C/min. The MS conditions were as follows: The transfer line temperature was 280 °C; the ion source temperature was 230 °C; and ionization energy 70 eV, and mass range, 20 to 350 a.m.u.
All experiments were carried out in triplicate and the results were reported as mean values.
2.9. SDE-GC-O Analysis
GC separations were carried out on an Agilent 6890N instrument equipped with a split-splitless injector, an FID (flame ionization detector) and a Gerstel ODP (olfactory detection port). Approximately, 1 μL of each SDE extract was injected in splitless mode into a capillary column (HP-Wax column, 60 m × 0.25 mm inner diameter, 0.25 µm film thickness). The oven conditions, injector and detector temperatures were the same as those given above for GC-MS. Nitrogen was used as the carrier gas at a flow rate of 1 mL/min. The split ratio was 10:1. The eluate was split to 1:1 at the end of the capillary into the FID detector and the ODP device.
2.10. Aroma Extraction Dilution Analysis (AEDA)
The SDE extract was stepwise (3-fold, 1:3, 1:9, 1:27, 1:81, 1:243…) diluted with dichloromethane until the sniffer could not detect any significant odor. Each flavor was thus assigned a Flavor Dilution (FD) factor representing the last dilution in which the odor was still detectable. GC-O was performed by three experienced panelists. The aroma description and sniffing time of each compound were determined by at least two panelists.
2.11. Qualitative and Quantitative Analysis of the Volatile Compounds
The volatile compounds were identified either by comparing the retention indices (RIs) and mass fragmented patterns with those of reference compounds, or by matching with mass spectrums in WILEY and NIST database and reported RI values. The RI of volatile compounds was calculated based on a C6–C30 n-alkane series that were injected under the same chromatographic conditions as for test samples. The quantities of the odor active compounds were estimated by an external standard method.
2.12. Calibration of Standard Curves
Odor-active compounds identified by SDE-GC-O were quantitated by constructing standard curves. The mixed standard solutions were prepared through dissolving standard compounds in dichloromethane. Six levels of concentration were prepared for the calibration, and standards were analyzed in triplicate. In order to make the quantitative results more accurate, 16 aldehydes and 18 non-aldehydes were divided into two groups. Ten mg of each standard compound and 0.1 g of the internal standard solution (1,2-dichlorobenzene, 10 μg/g) were introduced to 5 g dichloromethane. The standard stock solution was then diluted with dichloromethane for six levels (1:10, 1:20, 1:30, 1:40, 1:50, and 1:60) for the calibration. The calibration equation for each compound was carried out by plotting the response ratio of standard compounds and 1,2-dichlorobenzene against their concentration ratio.
These solutions were analyzed using HP-Wax column by GC–MS as described in Section 2.8, except that mass spectrometry was conducted in the single ion monitoring (SIM) mode. By the calibration equation, the concentration of each odor-active compound was calculated. The final results were the average of three replicates. The limits of detection (LOD) were estimated as the concentration of a standard whose signal-to-noise ratio was 3. The limits of quantitation (LOQ) were estimated as the concentration of a standard whose signal-to-noise ratio was 10.
2.13. Odor Aroma Value Determination
OAV (odor activity value) was determined by dividing the concentration by its odor threshold. OAV = Wi/OTi, where Wi is the concentration (μg/g braised pork) of compound i, and OTi is its odor detection threshold concentration in water (μg/g) which was found in the literature. The compound with OAV ≥ 1 was identified as the key aroma component in braised pork.
2.14. Statistical Analysis
The data were analyzed by one-way analysis of variance ANOVA using the statistical software SAS 9.1.3 (SAS Institute Inc., USA). An interaction analysis (3-way ANOVA) was performed by the software PanelCheck V1.3.2. Significant effects were performed using Tukey’s least significant difference (LSD) test at the level of 0.05 (p ≤ 0.05).
3. Results
3.1. Sensory Evaluation of the Braised Pork Samples
The sensory differences between different braised porks were evaluated. Significant differences among two samples for all attributes (Figure 1) indicated that the tested samples had different aroma intensities except for spicy flavor, probably because they had the same addition of spicy materials. An interaction analysis shows that there were no significant panelists, and the replication effect (p < 0.05) was found for all attributes. In addition, no significant interactions between sample × panelist and panelist × replication were found, showing that all the panelists were reproducible in the triplicate tests for each attribute. However, a significant interaction between sample and replication was observed for the “Overall flavor” (p < 0.05) attributes, indicating that the intensities of the attribute in the samples were not rated similarly when they were replicated.
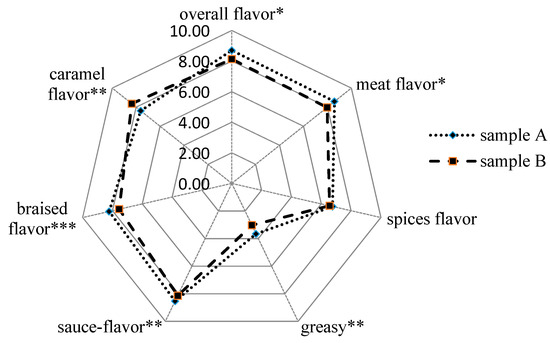
Figure 1.
Sensory evaluation results of two braised pork samples (* means significant at p < 0.05 level, ** means significant at p < 0.01 level, *** means significant at p < 0.001 level; sample A: prepared from self-made braised sauce; sample B: prepared from white granulated sugar).
In Chinese traditional food culture, braised flavor, sauce flavor, and caramel flavor are part of the typical fragrance of braised pork in various categories. An extremely significant influence (p < 0.001) was found for braised flavor, which might be partly affected by the different Maillard reaction effect of sucrose and xylose. Also, the overall flavor (p < 0.05), meat flavor (p < 0.05), greasy (p < 0.01), and sauce flavor (p < 0.01) of sample A were significantly higher than B. Instead, the score of caramel flavor for sample A was lower than sample B probably due to the white granulated sugar added. However, the GC-MS results show that many compounds such as furfural, 5-methylfurfural and 2,3-dihydro-3,5-dihydroxy-6-methyl-4H-pyran-4-one which might be generated via the caramelization of sugars were found in sample A in larger amounts than in sample B. This contradiction is normal because of the complexity of the food matrix and flavor generation. Nevertheless, the sensory panel agreed that the effect of self-made braised sauce in braised pork was as good as white granulated sugar and the lower sweetness of sample A was more in line with people’s needs for healthy eating.
3.2. Volatile Flavor Compounds Identified from the Braised Pork
The flavor substances were separated first in order to identify them. The methods for flavor substances separation include solvent extraction, distillation extraction, supercritical fluid extraction, and headspace capture. Generally, in the extraction process, the most widely used were the simultaneous distillation extraction (SDE) and solid phase micro-extraction (SPME). The SDE method has a good effect on the extraction of low volatility and high boiling components, such as esters and hydrocarbons with complex molecular structures. The SPME method adsorbs the sample directly, the sample processing time is short, the temperature is low, the steps are short, and the volatile components detected do not change.
The results from the two extraction methods SDE and SPME are summarized according to the functional groups in Table 1 and Table 2. A total of 109 aroma compounds were identified, of these, aldehydes were the most predominant in number (24 compounds), followed by alcohols, oxygen-containing heterocycles, acids, and ketones. Seventy-seven compounds were detected using the SPME method, while 68 compounds were detected in SDE extracts and 36 compounds co-existed in both methods. Methanethiol was the most abundant aroma substance in SPME, whereas anethole was the most abundant in SDE. The difference should be due to the fact that methanethiol is a very volatile compound while anethole is a moderately volatile compound and it is proved that volatile flavor profiles differ according to the extraction method. Thus, these two methods can be deemed as a complement for each other during the volatility analysis of braised pork.

Table 1.
Identification of braised pork volatile compounds extracted using SPME-GC/MS.
Table 2.
Identification of braised pork volatile compounds extracted using SDE-GC/MS.
Comparing the volatiles extracted by the two techniques, it could be revealed that SDE extracted a higher number of aldehydes, ketones, acids and phenols than the SPME, while the SPME extracted more hydrocarbons, sulphur, and nitrogen compounds. It was worth noting that sulphur-containing compounds were not detected in SDE and only one nitrogenous compound (2-acetylpyrrole) was identified. This result might be attributed to the evaporation step during the SDE process that might lead to more complex side reactions and the loss of some volatile compounds.
From the semi quantitation results, the most abundant class of compounds from SPME was the sulphur compounds in both samples, followed by aldehydes. A different situation was observed in SDE; the most abundant class was the aldehydes, followed by ethers. Furthermore, aldehydes considered to be formed by the mono-unsaturated fatty acids and Strecker oxidative degradation of amino acids, which made a great contribution to the flavor of braised pork due to their low odor threshold [19,20,21]. Nine kinds of aldehyde compounds were commonly identified in these two methods including 3-methylbutanal, pentanal, hexanal, heptanal, benzaldehyde, phenylacetaldehyde, (E,E)-2,4-decadienal, 4-methoxybenzaldehyde and (Z)-cinnamaldehyde. Moreover, SPME detected more low-molecular-weight aldehydes, such as hexanal, heptanal, (E)-2-heptenal, and nonanal. Meanwhile, SDE detected more long chain and methoxy aldehydes such as (Z)-13-octadecenal and 2-methoxybenzaldehyde.
Comparing the SPME results of the two braised pork samples with each other, sample A tended to be more dominant in the kinds of volatiles. Moreover, a higher number and number of oxygen-containing heterocycles and nitrogenous compounds were identified in sample A compared to sample B. In contrast, the content of sulphur compounds in sample B was slightly higher. Some sulfur compounds are allyl mercaptan derivatives which occur via the degradation of the precursors in garlic material [22]. Some other compounds were the result of a Maillard reaction between sugar and amino acid contributing to the meaty aroma, roasted flavor, and caramel-like odor. Among these volatiles, methanthiol was the most abundant and might have originated from methionine degradation [23]. It was highly volatile and easily extracted by the fiber. However, due to its strong volatility, it could easily be lost during extraction and this may explain why it was not detected in the SDE method. 3-methylbutanal was also detected in relatively high quantities and could be generated from Strecker degradation of leucine [24,25]. It was found that 3-methylbutanal was only detected in sample B. Besides, methional with sauce flavor is a meat-flavoring compound, and was detected only in sample A, which might have contributed to the sauce flavor of sample A [26].
Furan ring compounds can be obtained by 1,2-enolization and cyclization of amino acid-Amadori compound [27,28]. Furthermore, Table 1 showed that thiophene, 2-methyl-3-sulfanylfuran, and furfuryl mercaptan were only detected in sample A; the reason for this was probably due to the addition of MRI.
The results of SDE analysis show that sample B exhibited a more dominant number of volatile components than sample A. The discrepancy between the two samples mainly comes from the content difference of aldehydes and lactone. It was found that sample B had a higher peak area percentage of benzaldehyde, phenylacetaldehyde, 3-phenylpropanal, and (Z)-cinnamaldehyde. However, only one lactone γ-undecalactone was detected in sample B.
3.3. Identification of the Odor-Active Compounds in Braised Pork
In the above analysis, the results showed that the compounds obtained by the two extraction methods (SPME and SDE) had complementary effects. However, from a quantitative perspective, only the SDE extraction method was used for odor-active compounds analysis. Table 3 summarizes the aroma-active compounds detected in the extracts of two types of braised pork by AEDA. A total of 36 aroma-active compounds were observed by AEDA, including 16 aldehydes, 4 hydrocarbons, 3 alcohols, 1 ketone, 2 esters, 2 ethers, 1 phenol, 1 nitrogenous compound, 4 oxygen-containing heterocycles, and 2 unknown compounds. Thirty compounds were detected in sample A and 28 in sample B. The FD profiles of the aroma-active volatile compounds are shown in Figure 2. The RI of the larger FD factor (FD ≥ 27) aroma compounds fell within the range of RI 1135–2053, and these compounds were selected as potent compounds in the SDE of two types of braised pork extracts by AEDA. Furfuryl alcohol (sauce-flavor), anethole (anise, slight sweet), and unknown compound 1 were proved to be the most powerful aroma-active ones with the same highest FD factor of 243. Based on the sniff description of above aroma-active compounds, it was concluded that the main aroma of braised pork was meaty, caramel, sauce flavor, and spicy.
Table 3.
Odor-active compounds detected in in the SDE extracts of two types of braised pork by AEDA.
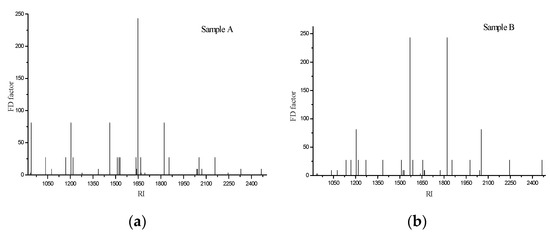
Figure 2.
(a) FD chromatogram of the volatile fraction of braised pork with braised sauce; (b) FD chromatogram of the volatile fraction of braised pork with white granulated sugar. (FD: Flavor Dilution factor, RI: retention indices).
For sample A, furfuryl alcohol (sauce-flavor) was the most intense aroma-active compound owning the highest aroma intensity (FD = 243). Pentanal (almond, pungent), limonene (fruity, orange), furfural (bread, almond, sweet), and anethole (anise, light sweet aroma) had the higher FD factor (FD = 81) which also suggested them to be the key contributors to the overall flavor. Besides, there were 12 kinds of substances with FD = 27, such as α-pinene, δ-3-carene, 1,8-cineole, 2-acetylfuran, ethyl cinnamate and so forth. Moreover, compounds with FD < 27 were considered to make only a minor contribution to the overall aroma. Compared with A, sample B presented anethole (anise, slight sweet) and unknown 1 (almond, caramel, toasty) with the highest aroma intensity (FD = 243). For sample B, Limonene (fruity, orange) and (Z)-cinnamaldehyde (cinnamon) gave the higher FD factor of 81. However, 3-phenylpropanal, 2-methoxybenzaldehyde, β-pinene, 1-terpinen-4-ol, acetoin, and unknown1 had no FD factor in sample A; and nonanal, (Z)-cinnamaldehyde, γ-undecalactone, coumarin, and anethole showed a lower FD factor in sample A. Therefore, the two samples exhibited different aromas in sensory evaluation.
However, owing to the strong complexity of the analyte, which led to very rich chromatographic profiles and made it quite difficult to sniff, the evaluation of a single peak or a given chromatographic region was often affected by the former eluents. Thus, odor descriptions of the sniffers were prone to differ from the literatures. Anyway, some compounds have been previously identified as key odor-active compounds in fried bacon, fried pork loin, and roasted pork of mini-pig by GC–O [29,30], for instance pentanal, limonene, furfural, β-pinene, and anethole. For the present work, spice ingredients (onion, ginger, garlic, cinnamon, and star aniseed) were used in the cooking, and thus, a high amount of spice compounds, e.g. (Z)-cinnamaldehyde, β-pinene, 1-terpinen-4-ol, anethole, α-pinene, δ-3-carene, 1,8-cineole, ethyl cinnamate were contained in the volatiles of the braised pork; they were basically similar to the results in Reference [31].
3.4. Quantitation of Important Odorants and Calculation of OAV
It is well known that AEDA is a worthy method for the screening of odor-active compounds in a given food. However, the application of AEDA does not provide immediate information about the contribution of a single odorant to the overall aroma. To get a deeper insight into the contribution of the quantitated aroma compounds to the overall aroma of the braised pork, OAV was calculated for each aroma component. Moreover, OAV was usually used to provide a rough evaluation of the real contribution of each compound to the overall aroma.
For quantification purposes, calibration curves for each odor-active compound in the extracts of two types of braised pork by SDE-AEDA-GC/O were drawn (Table 4). From Table 4, the coefficient of determination was determined, which indicated strong linearity for each of the standards.
Table 4.
Standard curves of key aroma compounds in braised pork.
Table 3 lists the concentrations (calculated by the standard curves), odor threshold values, and calculated OAV of the odor potent compounds. In terms of OAV, 3-methylbutanal, pentanal, nonanal, (E,E)-2,4-decadienal, phenylacetaldehyde, dodecanal, and linalool had OAV values >200, indicating that these compounds, especially aldehydes, might significantly contribute to the overall aroma of both types of braised pork. These results are consistent with the fact that aldehydes have an important potential effect on the global flavor of meat species [32]. By comparison, sample A had a higher content of (E,E)-2,4-decadienal (OAV = 1304). Furthermore, many compounds such as (Z)-cinnamaldehyde, limonene, γ-undecalactone, anethole, and 1,8-cineole were deemed to be the key-aroma compounds in braised pork, due to their concentrations clearly exceeding their odor thresholds. It is worth mentioning that two unknown compounds cannot calculate the OAV, so they can only be preliminarily considered as potential aroma-active substances through the odor description and FD factor. In addition, for some compounds, the concentrations did not reach their odor thresholds and they showed an OAV of <1. However, the combination of these compounds might also be linked with the aroma of braised pork due to the synergistic effect of similar compounds. Lack of agreement between FD factor and OAV results also existed in braised pork; 3-Methylbutanal had a high OAV (OAV = 335, 211) but a low FD factor (FD = 3), while α-Pinene had a high FD factor but a low OAV, which showed the influence of the food matrix.
4. Conclusions
Considering that changes in eating habits are difficult to achieve, strategies that do not require consumers’ willpower to change have the greatest chance of succeeding at the population level in the short term. Thus, reformulation of products has been proposed as one of the most effective strategies to encourage changes in nutrient intake. The main challenge for reducing the added sugar content of food products is that it causes changes in their sensory characteristics (especially aroma and taste attributes), which are key determinants of consumers’ liking. In this study, the novel braised sauce without white granulated sugar added was tested to see if it had the same aroma perception as white granulated sugar. Descriptive sensory analysis showed that the effect of self-made braised sauce in braised pork was as good as white granulated sugar. One-hundred-and-nine volatile compounds were identified by GC-MS using SPME and SDE methods in two braised porks. From the SDE-AEDA-GC/O analysis, it was found that pentanal (almond, pungent), nonanal (fat, green), ((E, E)-2,4-decadienal (fat, roast), phenyl acetaldehyde (hawthorne, honey, sweet), dodecanal (lily, fat, citrus) and linalool showed the highest OAV values (>200), indicating a contribution to the aroma of braised pork. The novel self-made braised sauce was proved to be useful in cooking braised pork with good sensory characteristics and rich aroma compounds. On the other hand, it is easy and convenient to operate for ordinary consumers; therefore, the braised sauce has significance in research and development.
Although people do not eat braised pork every day, at least the same aroma effect can be achieved by sugar substitution, which is a pleasure for people who want to eat but have to control their sugar intake. In addition, further research in this respect should be carried out on how many calories are saved when sugar is reduced and the effect of the novel formula on people’s health.
Author Contributions
Data curation, R.X. and Q.J.; Methodology, X.X.; Writing-original draft, S.S. and L.F.; Writing-review and editing, T.F.
Acknowledgments
We are grateful to the National Natural Science Foundation of China (NO. 31771942), Local Capacity Development Project of Shanghai Commission of Science and Technology (NO. 16090503800) and Shanghai Science Foundation Project (NO. 17ZR14296000), for their financial support.
Conflicts of Interest
The authors declare no conflict of interest. The funders had no role in the design of the study; in the collection, analyses, or interpretation of data; in the writing of the manuscript, or in the decision to publish the results.
References
- Gallagher, E.; O’Brien, C.M.; Agm, S.; Arendt, E.K. Evaluation of sugar replacers in short dough biscuit production. J. Food Eng. 2003, 56, 261–263. [Google Scholar] [CrossRef]
- Esteller, M.S.; Lima, A.C.O.D.; Lannes, S.C.D.S. Color measurement in hamburger buns with fat and sugar replacers. LWT-Food Sci. Technol. 2006, 39, 184–187. [Google Scholar] [CrossRef]
- Liu, J.; Liu, M.; He, C.; Song, H.; Chen, F. Effect of thermal treatment on the flavor generation from Maillard reaction of xylose and chicken peptide. LWT-Food Sci. Technol. 2015, 64, 316–325. [Google Scholar] [CrossRef]
- Parker, J.K. Thermal Generation or Aroma. In Flavour Development, Analysis and Perception in Food and Beverages; Elmore, J.S., Methven, L., Eds.; Woodhead Publishing: Sawston, UK, 2015; pp. 151–185. [Google Scholar]
- Perezlocas, C.; Yaylayan, V.A.; Skibsted, L.H.; Risbo, J.; Andersen, M.L. The Maillard reaction and food quality deterioration. In Chemical Deterioration and Physical Instability of Food and Beverages; Skibsted, L.H., Risbo, J., Andersen, M.L., Eds.; Woodhead Publishing: Sawston, UK, 2010; pp. 70–94. [Google Scholar]
- Trevisan, A.J.; De, A.L.D.; Sampaio, G.R.; Soares, R.A.; Markowicz, D.H. Influence of home cooking conditions on Maillard reaction products in beef. Food Chem. 2016, 196, 161–169. [Google Scholar] [CrossRef] [PubMed]
- Kesen, S.; Kelebek, H.; Sen, K.; Ulas, M.; Selli, S. GC-MS-olfactometric characterization of the key aroma compounds in Turkish olive oils by application of the aroma extract dilution analysis. Food Res. Int. 2013, 54, 1987–1994. [Google Scholar] [CrossRef]
- Chin, S.T.; Eyres, G.T.; Marriott, P.J. Cumulative solid phase microextraction sampling for gas chromatography-olfactometry of Shiraz wine. J. Chromatogr. A 2012, 1255, 221–227. [Google Scholar] [CrossRef] [PubMed]
- Eyres, G.; Marriott, P.J.; Dufour, J.P. The combination of gas chromatography–olfactometry and multidimensional gas chromatography for the characterisation of essential oils. J. Chromatogr. A 2007, 1150, 70–77. [Google Scholar] [CrossRef] [PubMed]
- Casilli, A.; Decorzant, E.; Jaquier, A.; Delort, E. Multidimensional gas chromatography hyphenated to massspectrometry and olfactometry for the volatile analysis of citrushybrid peel extract. J. Chromatogr. A 2014, 1373, 169–178. [Google Scholar] [CrossRef] [PubMed]
- Nuzzi, M.; Scalzo, R.L.; Testoni, A.; Rizzolo, A. Evaluation of Fruit Aroma Quality: Comparison between Gas Chromatography–Olfactometry (GC–O) and Odour Activity Value (OAV) Aroma Patterns of Strawberries. Food Anal. Methods 2008, 1, 270–282. [Google Scholar] [CrossRef]
- Zellner, B.D.; Dugo, P.; Dugo, G.; Mondello, L. Gas chromatography–olfactometry in food flavour analysis. J. Chromatogr. A 2008, 1186, 123–143. [Google Scholar] [CrossRef] [PubMed]
- Cui, H.; Jia, C.; Hayat, K.; Yu, J.; Deng, S. Controlled formation of flavor compounds by preparation and application of Maillard reaction intermediate (MRI) derived from xylose and phenylalanine. RSC Adv. 2017, 7, 45442–45451. [Google Scholar] [CrossRef]
- Song, S.; Tang, Q.; Fan, L.; Xu, X.; Song, Z. Identification of pork flavour precursors from enzyme-treated lard using Maillard model system assessed by GC–MS and partial least squares regression. Meat Sci. 2017, 124, 15–24. [Google Scholar] [CrossRef] [PubMed]
- Dermiki, M.; Phanphensophon, N.; Mottram, D.S.; Methven, L. Contributions of non-volatile and volatile compounds to the umami taste and overall flavour of shiitake mushroom extracts and their application as flavour enhancers in cooked minced meat. Food Chem. 2008, 141, 77–83. [Google Scholar] [CrossRef] [PubMed]
- Flavornet. Available online: http://www.flavornet.org/ (accessed on 12 December 2018).
- Xiao, Z.; Wu, M.; Niu, Y.; Chen, F.; Zhang, X.; Zhu, J.; Song, S. Contribution of Chicken Base Addition to Aroma Characteristics of Maillard Reaction Products Based on Gas Chromatography-Mass Spectrometry, Electronic Nose and Statistical Analysis. Food Sci. Biotechnol. 2015, 24, 411–419. [Google Scholar] [CrossRef]
- Tao, N.P.; Wu, R.; Zhou, P.G.; Gu, S.Q.; Wu, W. Characterization of odor-active compounds in cooked meat of farmed obscure puffer (Takifugu obscurus) using gas chromatographyemass spectrometry-olfactometry. J. Food Drug Anal. 2014, 22, 431–438. [Google Scholar] [CrossRef] [PubMed]
- Mottram, D.S. Flavour formation in meat and meat products: A review. Food Chem. 1998, 62, 415–424. [Google Scholar] [CrossRef]
- Barra, A.; Baldovini, N.; Loiseau, A.M.; Albino, L.; Lesecq, C. Chemical analysis of French beans (Phaseolus vulgaris L.) by headspace solid phase microextraction (HS-SPME) and simultaneous distillation/extraction (SDE). Food Chem. 2006, 101, 1279–1284. [Google Scholar] [CrossRef]
- Meadus, W.J.; Turner, T.D.; Dugan, M.E.; Aalhus, J.L.; Duff, P. Fortification of pork loins with docosahexaenoic acid (DHA) and its effect on flavor. J. Anim. Sci. Biotechnol. 2013, 4, 46. [Google Scholar] [CrossRef] [PubMed]
- Sunesen, L.O.; Dorigoni, V.; Zanardi, E.; Stahnke, L. Volatile compounds released during ripening in Italian dried sausage. Meat Sci. 2001, 58, 93–97. [Google Scholar] [CrossRef]
- Yu, A.N.; Zhang, A.D. Aroma compounds generated from thermal reaction of L-ascorbic acid with L-cysteine. Food Chem. 2010, 121, 1060–1065. [Google Scholar] [CrossRef]
- Khan, M.I.; Jo, C.; Tariq, M.R. Meat flavor precursors and factors influencing flavor precursors-A systematic review. Meat Sci. 2015, 110, 278–284. [Google Scholar] [CrossRef] [PubMed]
- Benet, I.; Guàrdia, M.D.; Ibañez, C.; Solà, J.; Arnau, J. Analysis of SPME or SBSE extracted volatile compounds from cooked cured pork ham differing in intramuscular fat profiles. LWT-Food Sci. Technol. 2015, 60, 393–399. [Google Scholar] [CrossRef]
- Duan, Y.; Zheng, F.; Chen, H.; Huang, M.; Xie, J. Analysis of volatiles in Dezhou Braised Chicken by comprehensive two-dimensional gas chromatography/high resolution-time of flight mass spectrometry. LWT-Food Sci. Technol. 2015, 60, 1235–1242. [Google Scholar] [CrossRef]
- Cerny, C. Origin of carbons in sulfur-containing aroma compounds from the Maillard reaction of xylose, cysteine and thiamine. LWT-Food Sci. Technol. 2007, 40, 1309–1315. [Google Scholar] [CrossRef]
- Yu, A.N.; Tan, Z.W.; Wang, F.S. Mechanism of formation of sulphur aroma compounds from L-ascorbic acid and L-cysteine during the Maillard reaction. Food Chem. 2012, 132, 1316–1323. [Google Scholar] [CrossRef] [PubMed]
- Timo´n, M.L.; Carrapiso, A.I.; Jurado, A.; Lagemaat, J.V. A study of the aroma of fried bacon and fried pork loin. J. Sci. Food Agric. 2004, 84, 825–831. [Google Scholar] [CrossRef]
- Xie, J.; Sun, B.; Zheng, F.; Wang, S. Volatile flavor constituents in roasted pork of Mini-pig. Food Chem. 2008, 109, 506–514. [Google Scholar] [CrossRef]
- Paleari, M.A.; Moretti, V.M.; Bersani, C.; Beretta, G.; Mentasti, T. Characterisation of a lard cured with spices and aromatic herbs. Meat Sci. 2004, 67, 549–557. [Google Scholar] [CrossRef] [PubMed]
- Ayseli, M.T.; Filik, G.; Selli, S. Evaluation of volatile compounds in chicken breast meat using simultaneous distillation and extraction with odour activity value. J. Food Nutr. Res. 2014, 53, 137–142. [Google Scholar]


© 2019 by the authors. Licensee MDPI, Basel, Switzerland. This article is an open access article distributed under the terms and conditions of the Creative Commons Attribution (CC BY) license (http://creativecommons.org/licenses/by/4.0/).