Review

Unravelling the Effects of Soluble Dietary Fibre Supplementation on Energy Intake and Perceived Satiety in Healthy Adults: Evidence from Systematic Review and Meta-Analysis of Randomised-Controlled Trials

by
Siti Nurshabani Salleh
1,
Ahmad Adli Hamizi Fairus
2,
Mohd Nizam Zahary
2,
Naresh Bhaskar Raj
3 and
Abbe Maleyki Mhd Jalil
1,*
1
School of Nutrition and Dietetics, Faculty of Health Sciences, Universiti Sultan Zainal Abidin, Kuala Nerus 21300, Malaysia
2
School of Biomedicine, Faculty of Health Sciences, Universiti Sultan Zainal Abidin, Kuala Nerus 21300, Malaysia
3
School of Rehabilitation Science, Faculty of Health Sciences, Universiti Sultan Zainal Abidin, Kuala Nerus 21300, Malaysia
*
Author to whom correspondence should be addressed.
Foods 2019, 8(1), 15; https://doi.org/10.3390/foods8010015
Submission received: 12 November 2018 / Revised: 27 December 2018 / Accepted: 2 January 2019 / Published: 6 January 2019
(This article belongs to the Section Food Nutrition)

Abstract

:
Consumption of soluble dietary fibre is recommended as part of a healthy diet. Evidence has shown that soluble dietary fibre slows gastric emptying, increases perceived satiety and plays a significant role in appetite regulation. This systematic review examined the effects of soluble dietary fibre using randomised-controlled trials (RCTs). Three different electronic databases were used, namely PubMed, Scopus® and the Cochrane Central Register of Controlled Trials (CENTRAL). Effect size (Cohen’s d) was calculated based on the intergroup mean difference and standard deviation (SD) followed by Cochran’s Q and I2 determination. The effect size was statistically pooled in the meta-analyses and presented as a forest plot. The risk of bias was high for each study as assessed using the Jadad scale. Meta-analysis of statistically pooled data for guar gum showed a sizeable effect on post-meal energy intake, followed by β-glucan, alginate, polydextrose and pectin, with pooled effect sizes of −0.90, −0.44, −0.42, −0.36 and −0.26, respectively. Guar gum (5 g) effectively reduced energy intake when prepared in milk beverages compared with control milk (p < 0.001). Alginate, when prepared in liquid (5 g) or solid (9 g) meals, effectively reduced energy intake compared with control (p < 0.001). A high dose of polydextrose (25 g) prepared in liquid meal form significantly reduced energy intake (p = 0.01). This study suggests that soluble fibres are not all created equal. Further interventional studies are needed to determine whether combinations of these soluble fibres might have greater effects than individual fibres per se.

1. Introduction

The benefit of dietary fibre on gut health is well established [1]. Dietary fibre is categorised into soluble and insoluble fibre. The distinction between soluble and insoluble dietary fibres is that the former solubilise in hot aqueous solution [2]. The physiological effects of soluble dietary fibres are attributed to its unique physico-chemical properties, namely viscosity, gel formation or fermentability in the colon [3]. Previous studies have demonstrated the physiological effects of soluble fibre as follows: (1) increased viscosity in the upper gastrointestinal tract [4,5], and (2) partial or full fermentation in the colon [6] and (3) exertion of a prebiotic effect [7,8].
Different dietary fibres might have different viscosities depending on their structure, concentration and chemical composition (types of monomers) [9,10]. Viscous soluble dietary fibres are believed to be more capable of inducing satiety compared to non-viscous soluble dietary fibres. Viscous soluble dietary fibre increases digesta viscosity and consequently delays gastric emptying [11,12,13], slowing digestion and the absorption of nutrients [14], and reducing enzyme diffusion [15] and the formation of an unstirred water layer [16]. Viscous soluble dietary fibres are not being digested in the stomach; instead, they are fermented in the colon and result in a rise in short chain fatty acids (SCFAs). SCFAs, particularly propionate, modulate the secretion of various appetite-regulating peptides (PYY, GLP-1 and CCK) throughout the colon and are associated with increased perceived satiety and reduced food intake [17,18,19,20]. Furthermore, the presence of soluble dietary fibre selectively boosts the growth or activity of a restricted number of colonic bacteria, ultimately enhancing host health [21]. Soluble fibre alters the balance of the gut microflora towards what is considered to be a healthier one [22].
Satiety is defined as a process that leads to inhibition of further eating, declining hunger and an increase in fullness after a meal, leaving one satisfied [23]. However, there have been inconsistent findings regarding the benefits of soluble dietary fibre on perceived satiety. Studies have shown the effects of soluble fibre to depend on factors such as dose, molecular size and solubility, and food matrix [24,25]. Hence, the aim of this review was to answer the following questions: (1) What is the best type of soluble dietary fibre to reduce energy intake? (2) What is the best dose for such an effect? (3) What is the optimal food matrix (solid, semi-solid or liquid meal)? The information was extracted from randomised-controlled trials followed by qualitative and quantitative analyses.

2. Methods

2.1. Eligibility Criteria

This review included studies examining healthy male or female free-living adults aged 18 years or above with a normal body mass index (18.5 to 24.9 kg/m2) [26] and not taking any supplements or antibiotics during the study period. The review excluded studies in which participants had undergone surgical procedures with the potential to affect gastrointestinal function or digestibility, which may interfere with results and contribute to clinical heterogeneity [27].
This review examined only interventions investigating the effects of soluble dietary fibre using randomised-controlled trials (RCTs). RCTs were chosen as they are considered as cornerstone of clinical research on intervention and offer the highest level of evidence [28]. Studies were excluded if the comparator groups were absent or not specified [29]. The outcome measures are as follows: energy intake, perceived satiety, appetite hormones, gastric emptying time and colonic transit time. Studies were excluded if they were observational in nature, that is, cross-sectional, retrospective or prospective cohort, longitudinal or case-control studies as well as case reports, case series, animal or in vitrostudies. There was no restriction on the time frame and type of study setting. Only full-text English articles were included in this review. Studies written in languages other than English were excluded due to potential bias of information resulting from poor translation. Given advances in research methodology, only studies published between 2007 and 2017 were included.

2.2. Search Strategy

Three different electronic databases were used to systematically search the literature as follows: (i) PubMed website (US National Library of Medicine and National Institute of Health); (ii) Scopus® (Elsevier B.V.); and iii. The Cochrane Central Register of Controlled Trials (CENTRAL, Cochrane library). PubMed was selected as it contains 27 million biomedical studies from MEDLINE and life science journals. Scopus was chosen as it is the largest database for scientific journals covering the fields of science and medicine, with 100% MEDLINE, EMBASE and Compendex. The Cochrane Central Register of Controlled Trials (CENTRAL) is the largest database and the most comprehensive source of reporting for RCTs. The search strategy for all three databases was carried out over the course of two weeks in August 2017. For Scopus, only articles in the fields of ‘agriculture and biological science’, ‘biochemistry’, ‘genetics and molecular biology’ and ‘medicine’ were included.
Boolean operators were included in the keyword searches of all three electronic databases. The main keywords were ‘type of soluble fibre’ AND ‘appetite’ AND ‘satiety’. Key search terms for type of soluble fibre were ‘soluble dietary fibre’, ‘soluble dietary fiber’, ‘beta glucan OR beta glucans OR b-glucan OR β-glucan’, ‘guar gum OR guaran OR gellan gum’, ‘alginate OR alginates OR alginic OR algin’, ‘pectin OR pectins’, ‘laminarin OR laminarins’, ‘polydextrose’, ‘PolyGlycopleX’, ‘maize-based soluble fibre OR maize-based soluble fiber’, ‘galactomannan OR galactomannans/konjac’, ‘NUTRIOSE’, ‘plantain’, ‘soluble corn fiber OR fibre’, ‘soluble maize fiber OR fibre’, ‘arabinoxylan OR arabinoxylans’, ‘mixed-linkage glucans’, ‘pullulan’, ‘plant gum OR plant gums OR gum OR gums OR plant mucilage OR mucilage’. Key search terms for appetite and satiety were ‘appetite hormones’, ‘gut hormones’, ‘glucagon-like peptide 1 OR GLP-1′, ‘Peptide YY OR PYY’, ‘cholecystokinin OR CCK’, ‘gastric insulinotropic polypeptide OR GIP’, ‘colonic transit time’, ‘gastrointestinal’, ‘gastric emptying time’, ‘energy intake OR energy intakes’ and ‘satiety’.

2.3. Data Management and Analysis

All articles were uploaded in Mendeley referencing software and duplication removed use of the ‘remove duplicate’ function. Three reviewers independently screened the titles and abstracts based on the pre-defined criteria described above. Full-text articles were carefully reviewed to determine whether the articles met the inclusion or exclusion criteria. Primary data extraction was done to identify studies investigating the effects of soluble fibre on energy intake, perceived satiety, appetite or gut hormones, gastric half-emptying time and/or colonic transit time as outcome measures. Secondary data extraction was done to exclude studies that did not meet the defined criteria, studies that failed to report certain details and studies that did not fall within the definition of RCTs. Data extraction included RCTs, the type of comparator clearly described (i.e., control/placebo), sample size calculation, dosage used, study duration, participant characteristics (free-living, normal body mass index (BMI) and healthy) and type of soluble dietary fibre related to outcome of interest.

2.4. Evaluation of Studies and Data Synthesis

For primary outcomes, the effect size (Cohen’s d) was calculated based on the intergroup mean difference and standard deviation (SD) in energy intake, perceived satiety, gastric half-emptying time, and appetite or gut hormones between treatment and control groups. The quantitative measure of the standardised mean differences (effect sizes) between the groups was considered as small (0.2), medium (0.5) and large (0.8). A negative value indicates that the intervention favoured the treatment group, while a positive value indicates that the intervention favoured the control or placebo group [30]. Means and standard deviations were manually calculated when the exact outcomes measures were not reported. The standard error of the means was converted into standard deviations to derive Cohen’s d [31]. P-values of less than 0.05 were deemed statistically significant. A study was excluded from the meta-analysis if the effect size could not be calculated.
For the secondary outcomes, Cochran’s Q and I2 were manually calculated using Excel worksheets in accordance with Neyeloff, Fuchs, and Moreira [32]. Cochran’s Q was calculated as the weighted sum of squared difference between each study’s effects and the pooled effect across studies with the weight used in the pooling method. Q was distributed as a chi-square statistic (χ2) with k minus 1 degree of freedom (df) whereas k is number of studies. The p-value was obtained by comparing Q against a table of critical values where a lower Q indicated that the studies were similar (i.e.,homogenous). The I2 statistic describes the percentage of total variation across studies due to true heterogeneity. I2 was calculated based on the formula (Q−df)/Q × 100, where ‘df’ stands for degrees of freedom and Q is Cochran’s heterogeneity statistic. A negative value of I2 was considered to be zero (studies were homogenous). Statistical heterogeneity of meta-analyses (I2) values of 25%, 50% and 75% were considered as low, moderate and high, respectively [33]. A fixed-effect model was selected if the test of heterogeneity was not significant and the I2 value was low (< 50%). The random effects model was used for heterogeneity ≥ 50%. The effect size was statistically pooled in the meta-analyses and presented as a forest plot.
The risk of bias of each individual study was assessed using the Jadad scale. The scale specifies whether double-blinding, randomisation, drop-outs and withdrawals were clearly described in the study [34]. The highest possible score is 5 and is suggestive of a low potential for reporting bias. Studies were rated as having low, moderate or high risk of bias.

3. Results

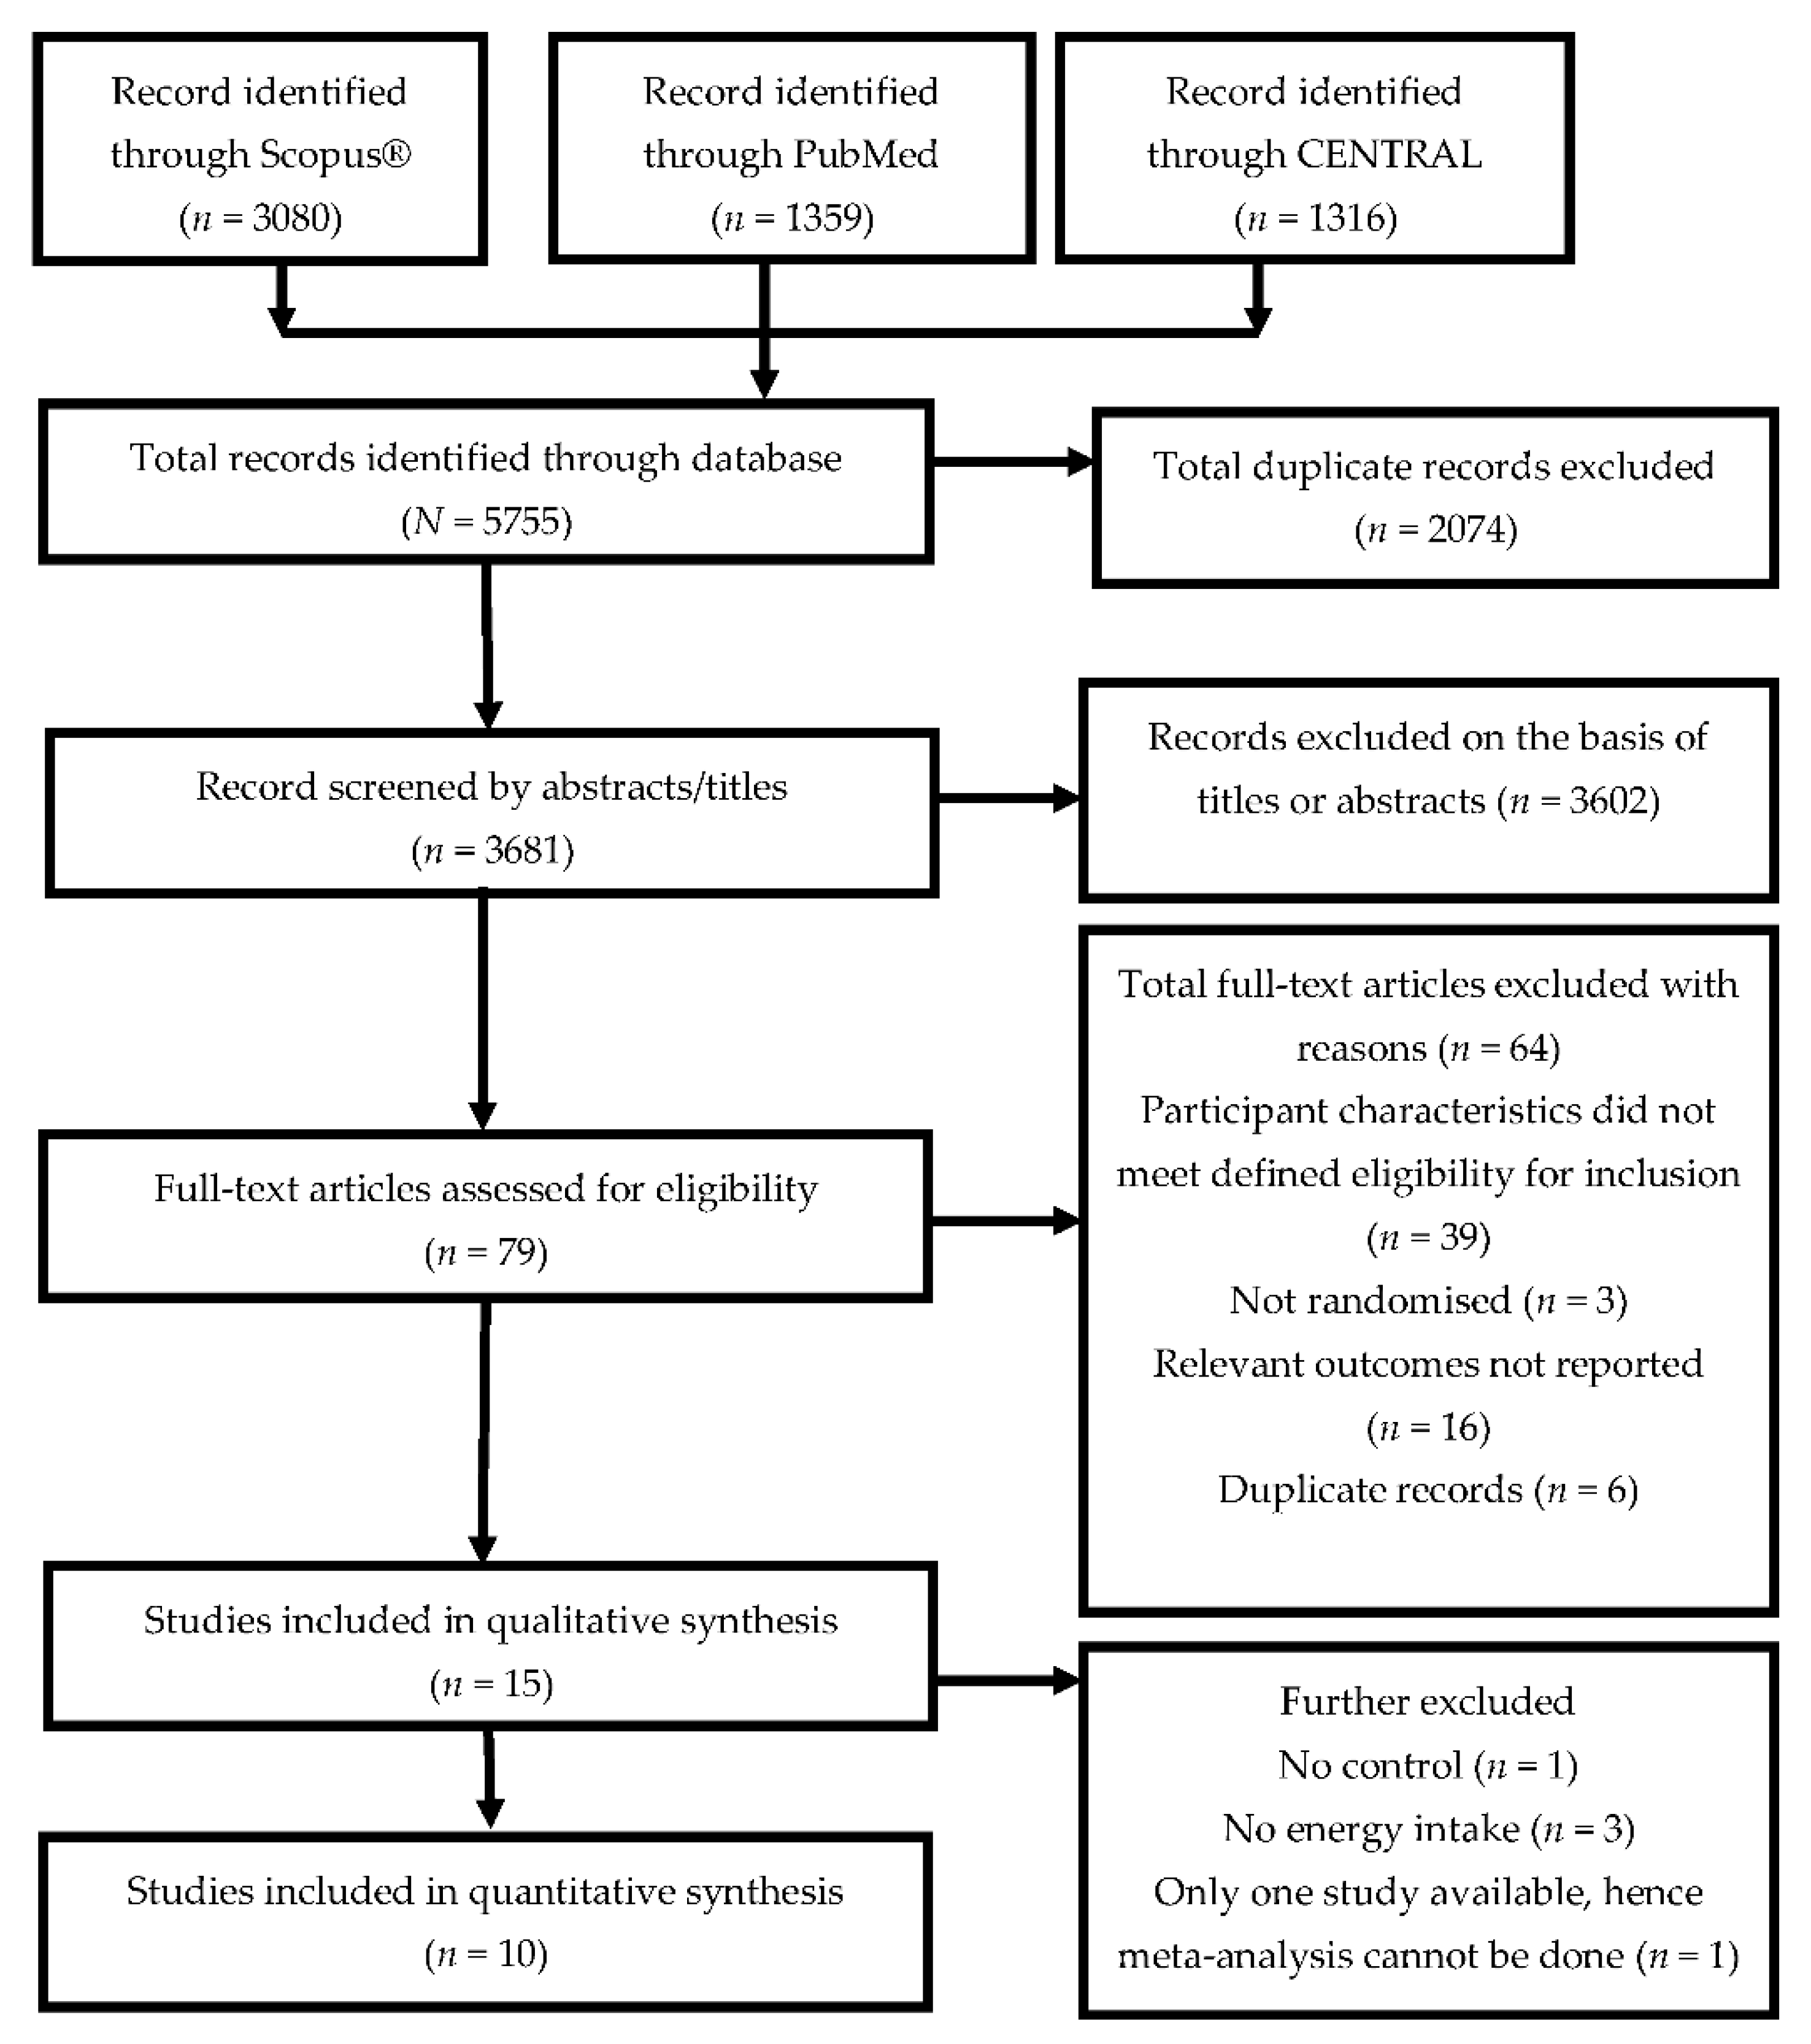
3.1. Study Selection

Figure 1 illustrates the study selection based on the PRISMA search strategy. An initial sample of 5755 articles was identified. Of these, 3080 articles were from Scopus®, 1359 articles were from PubMed, and the remaining 1316 articles were from CENTRAL. Duplicates were excluded and all articles were screened on the basis of their titles and abstracts. Seventy-nine full-text articles were retrieved to assess their eligibility, and 15 articles met the defined criteria and were subsequently included in the qualitative analysis. A subset of 10 articles was included in the meta-analysis.

3.2. Study Characteristics

Table 1 presents a summary of the randomised-controlled trials (RCTs) (N = 15 articles) involving 17 interventional studies with 31 soluble fibres [35,36,37,38,39,40,41,42,43,44,45,46,47,48,49]. A total of eight soluble dietary fibres were identified: alginate, arabinoxylan, β-glucans, guar gum, high-amylose maize, pectin, polydextrose, and PolyGlycopleX. There were a total of 31 soluble fibre types, doses or viscosities included in this review as follows: alginate (n = 3), arabinoxylan (n = 2), β-glucans (n = 3), guar gum (n = 6), high-amylose maize (n = 2), pectin (n = 4), polydextrose (n = 8) and PolyGlycopleX (n = 3). While all 31 soluble fibres were included in the systematic review (qualitative study), only 21 were included in the meta-analysis (quantitative study). Ten fibres were excluded from the meta-analysis for the following reasons: energy intake not measured (n = 7), control not available (n = 1) and only one study available, hence meta-analysis cannot be done (n= 2).
The doses of fibre used in the studies were in the range of 2 to 31.5 g and supplemented either liquid, semi-solid, solid or composite meals. All studies included were of randomised crossover-controlled design. Of the 17 interventional studies, one was double-blinded, 13 were single-blinded and three were not-blinded. The sample size ranges from 6 to 121 participants with a total sample size of 453 participants. The durations of outcome measures for energy intake, satiety, gut hormones and gastric emptying time range from 90 to 240 min, 30 to 240 min, 90 to 180 min and 90 to 360 min, respectively. The shortest duration of food intake measures was 90 min [42,44], while the longest was 240 min [38,41] (Table 1).

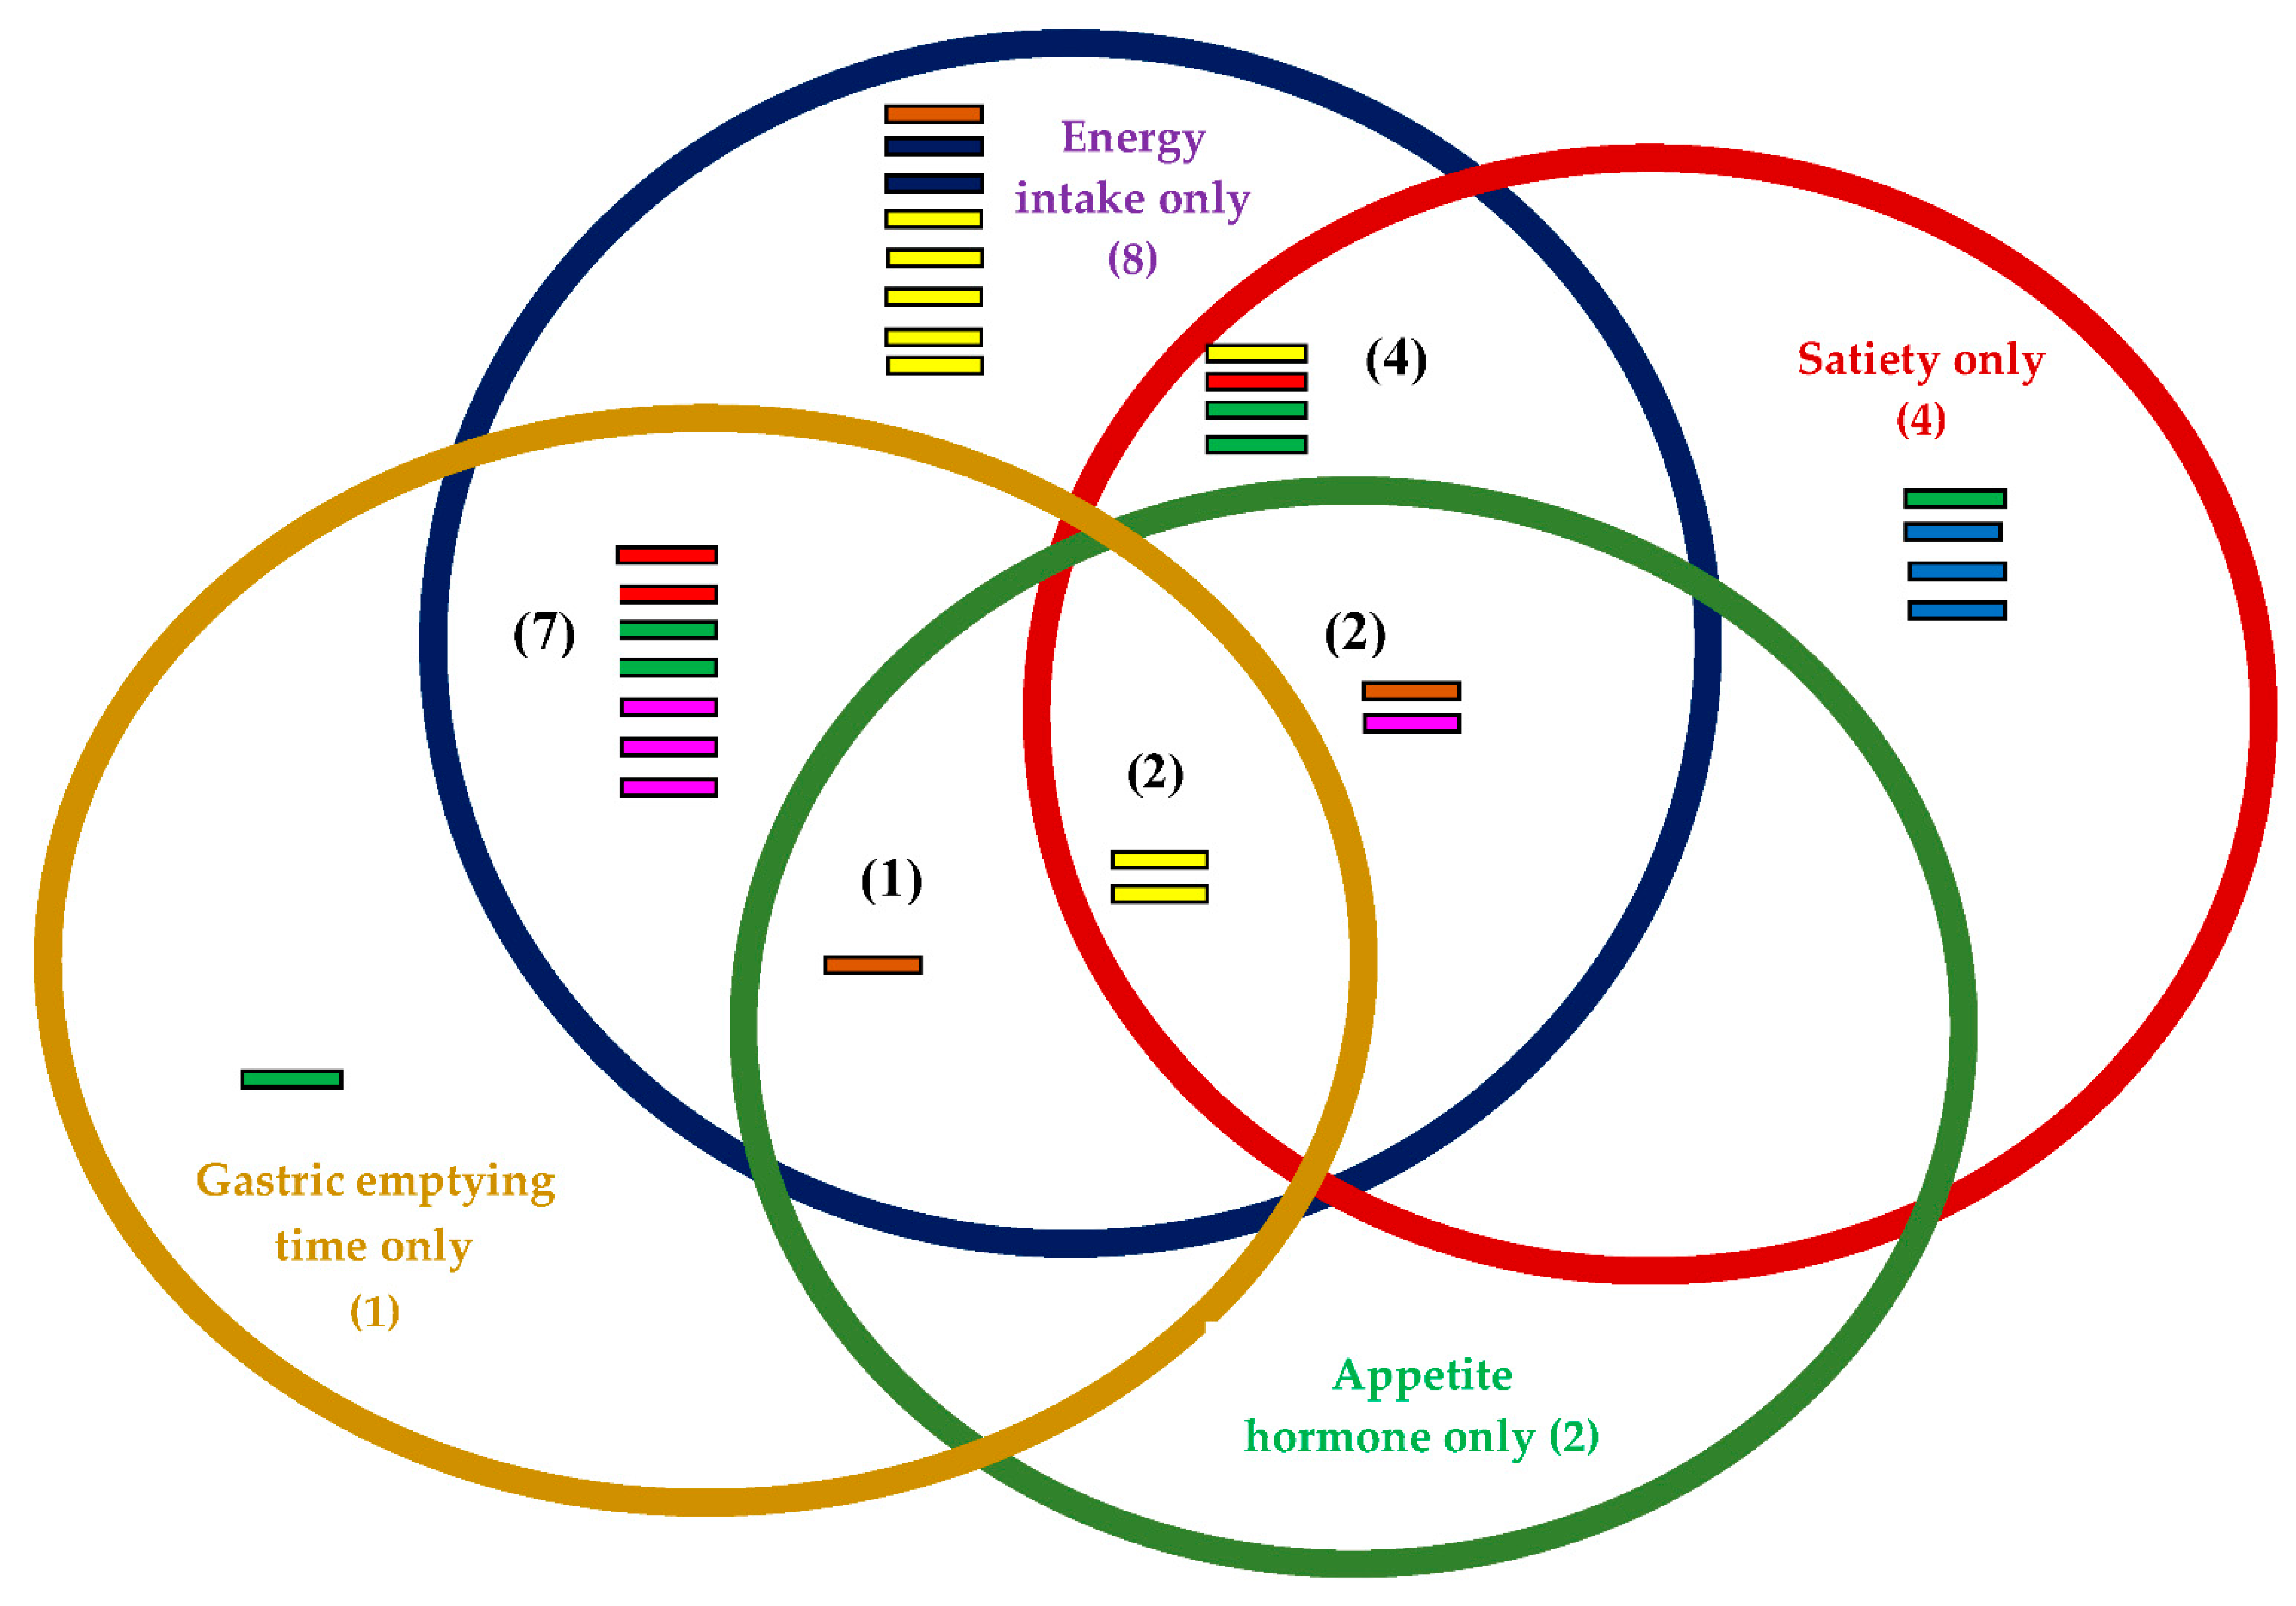
3.3. Outcome Measures

The outcome measures in this review are energy intake, perceived satiety, appetite hormones and gastric emptying time. Twenty-four of the 31 studies investigated the effects of soluble fibre on energy intake between treatment and control groups [35,36,37,38,39,40,41,42,43,44,45,48]. Twenty-two studies favoured treatment, but only four reported significant differences [34,36,37,38,39,40,41,42,44,45,46,47,48] (Table 1). Another 12 of the 31 studies focused on satiety, while 11 out of 31 investigated the gastric emptying rate and seven out of 31 investigated the effects of soluble dietary fibre on appetite hormones (PYY, GLP-1, CCK and GIP) (Figure 2).
It was observed that only four test products significantly reduced energy intake, as follows: 5 g of alginate and 5 g of guar gum in milk beverages [35], 9 g of alginate in chocolate cookies [36] and 25 g of polydextrose in chocolate-flavoured beverages [42] (Table 1). However, all fibres supplemented in the liquid food matrix favoured treatment rather than control groups [35,37,39,40,42,44]. Soluble fibre supplemented in the solid food matrix such as cookies, soya bean curd, white wheat bread or cooked white rice did not significantly reduce energy intake, except for high-dose alginate in chocolate cookies [36]. B-glucan (2.9 g) [38] showed a higher effect size on energy intake reduction compared with 6 g of alginate [36], with d = −0.35 (p = 0.28) (medium effect size) and d = −0.04 (p = 0.78) (small effect size), respectively. A high dose of alginate (9 g) is necessary in order to have significant effects (effect size = −0.52, p < 0.001) on reduced energy intake [36]. However, the effect of 9 g of alginate supplemented in chocolate cookies was larger than the effect of 12 g of polydextrose added to low- and high-protein soya bean curd, with effect sizes of −0.42 and −0.48, respectively [43].
Juvonen et al. [45] demonstrated that high viscosity β-glucan reduced energy intake compared with low viscosity β-glucan, with an effect size of −2.03 (p = 0.026). Wanders et al. [40] investigated the effects of 10 g of pectin in different forms, that is, bulking, viscous and gelled, on energy intake. No significant effects were observed with different types of pectin on energy intake compared with control (Table 1). Gelled pectin was further supplemented in liquid (as beverage) and capsule (so the pectin hydrated in the stomach) form. Pectin in capsule form exhibited lower energy intake than pectin in liquid form (p = 0.03) (Table 1). The lowest dose of soluble fibre found in this systematic review was 2 g of partially hydrolysed guar gum [37], while the highest dose was 31.0 g of high-amylose maize [48]. However, 2 g of partially hydrolysed guar gum showed a higher effect size on energy reduction (d = −0.41, p = 0.28) than 31.0 g of high‒amylose maize (d = −0.05, p = 0.83).

3.4. Risk of Bias within Studies Based on Jadad Score

Table 2 illustrates the quantified risks of bias within a study according to the features of RCTs, namely randomisation, double-blinding and withdrawals or drop-outs [34]. Risks of bias were relatively high with most studies showing an average score of 3 and below [35,36,37,38,39,40,41,42,43,44,45,46,47,48,49]. Five studies showed moderate risk of bias [37,40,42,43,49] while a further 12 showed high study bias [35,36,38,39,45,46,47] (Table 2).

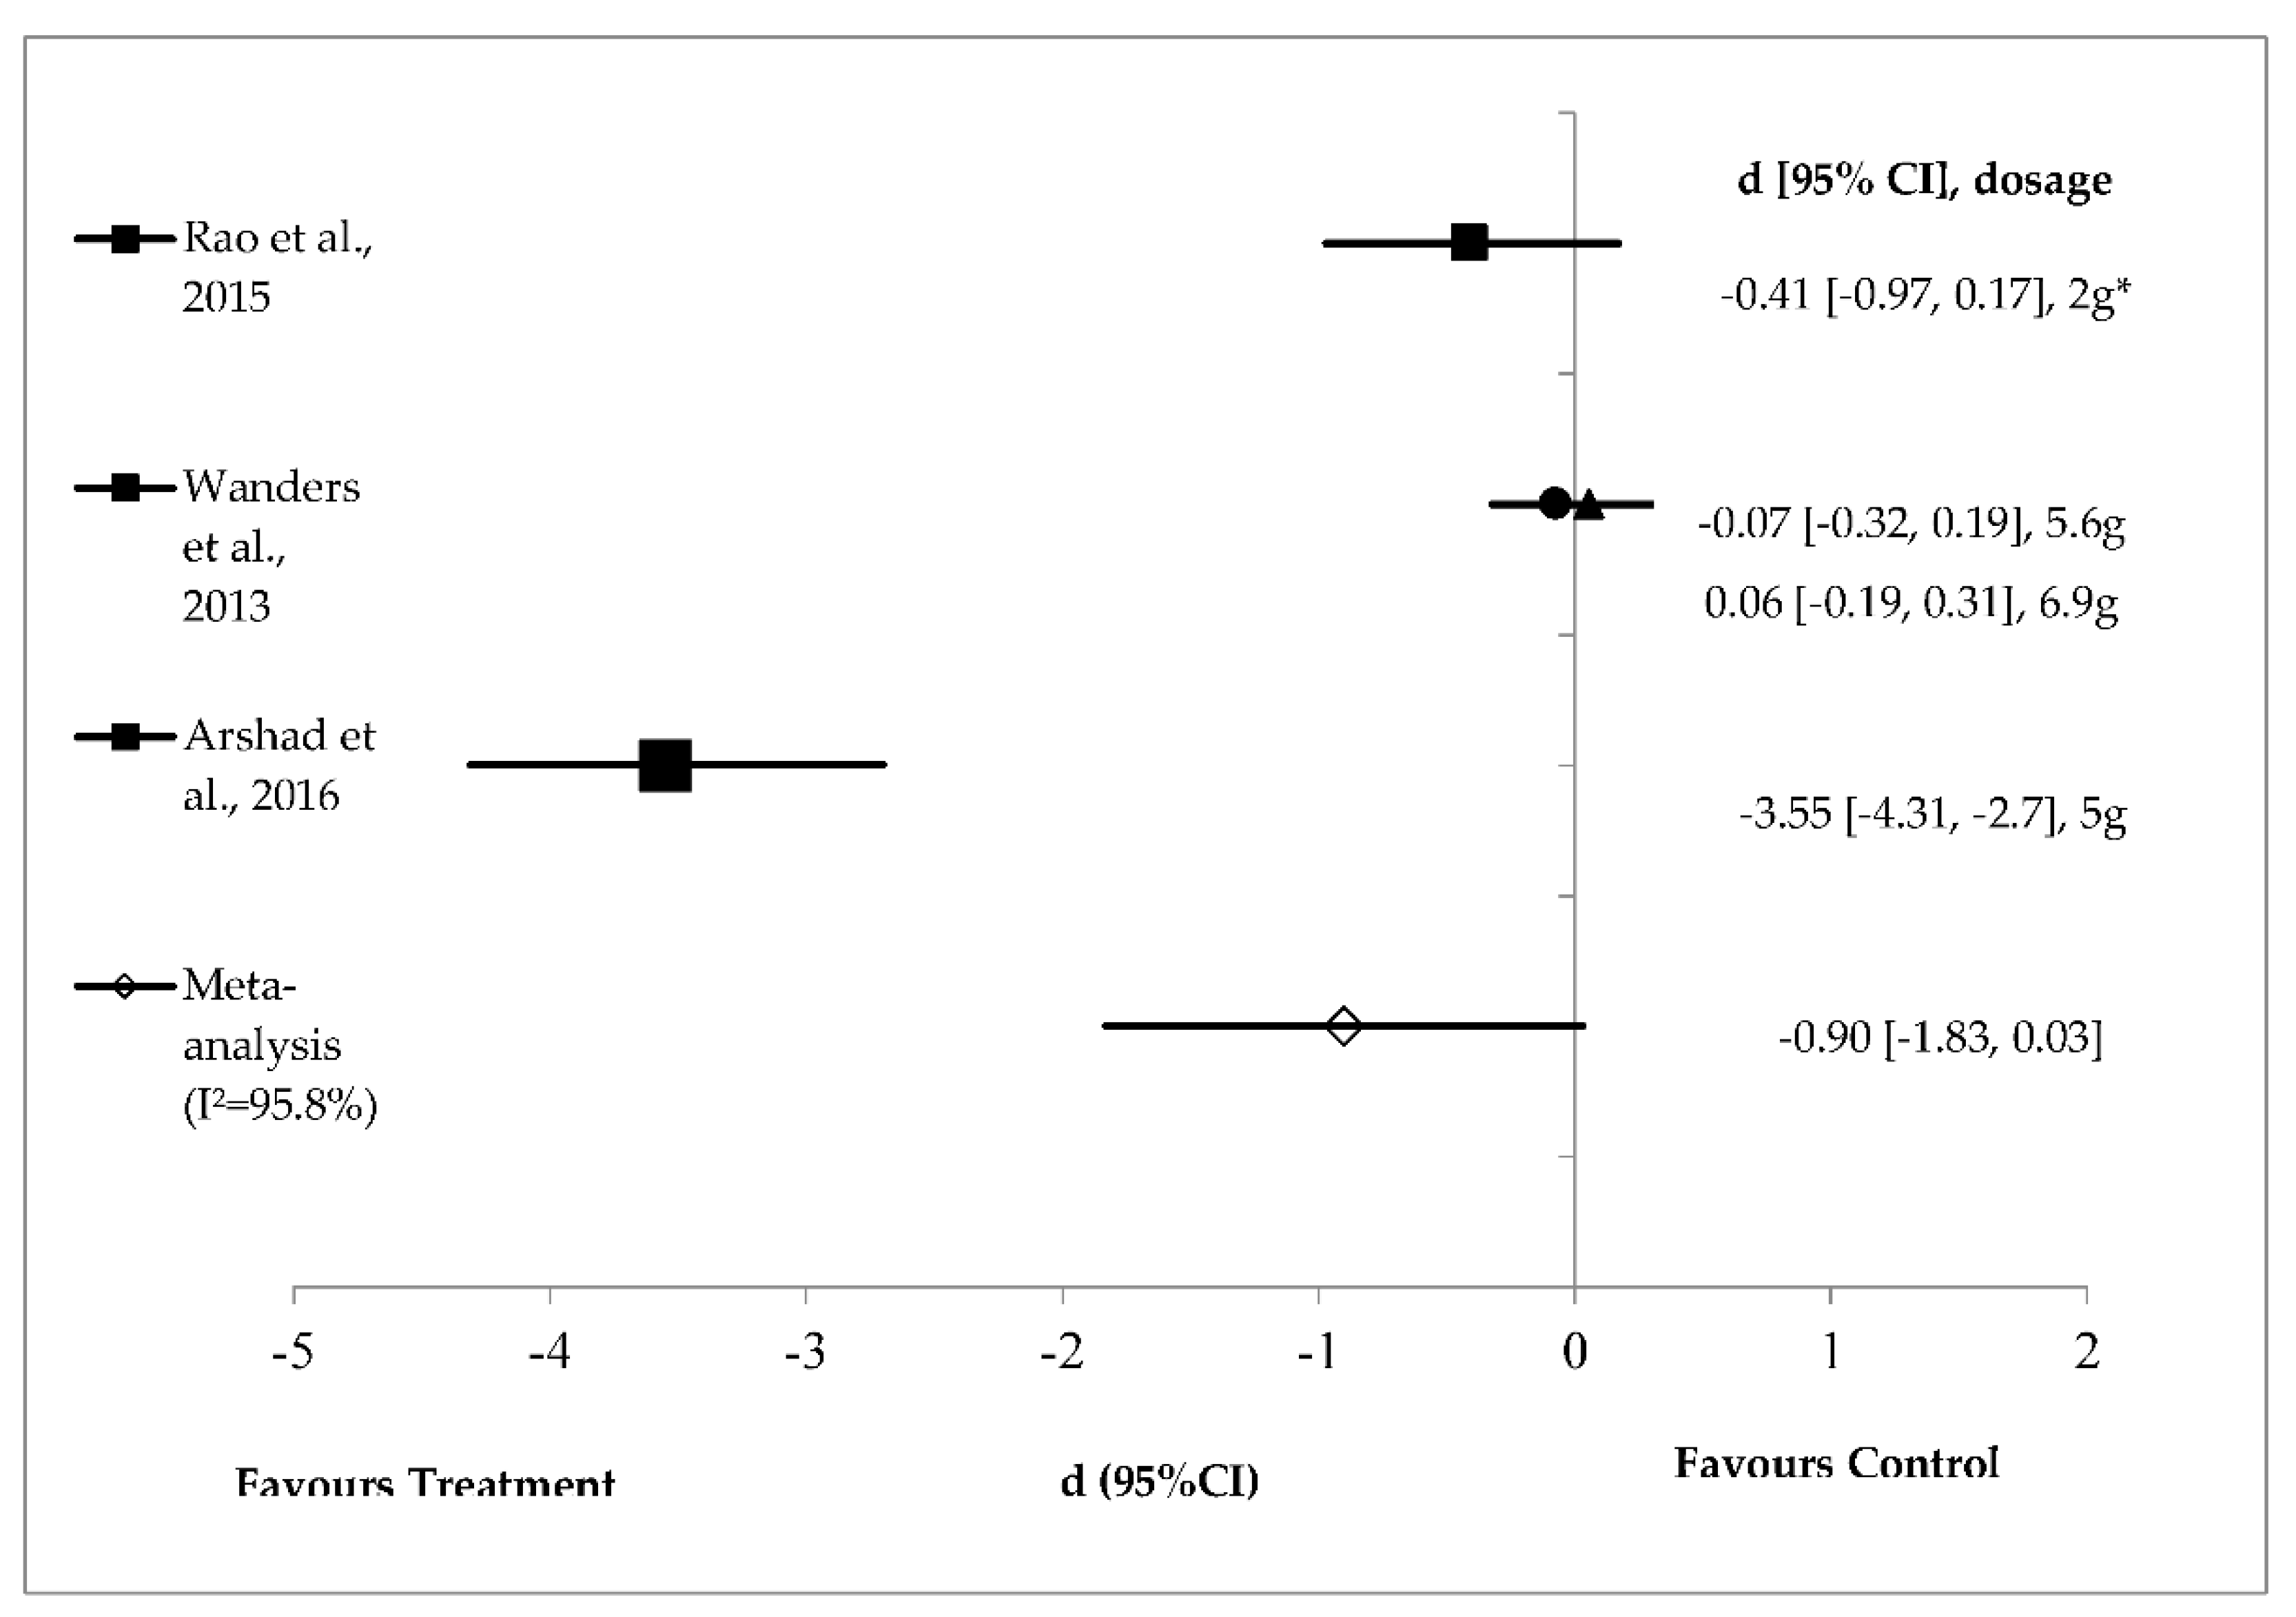
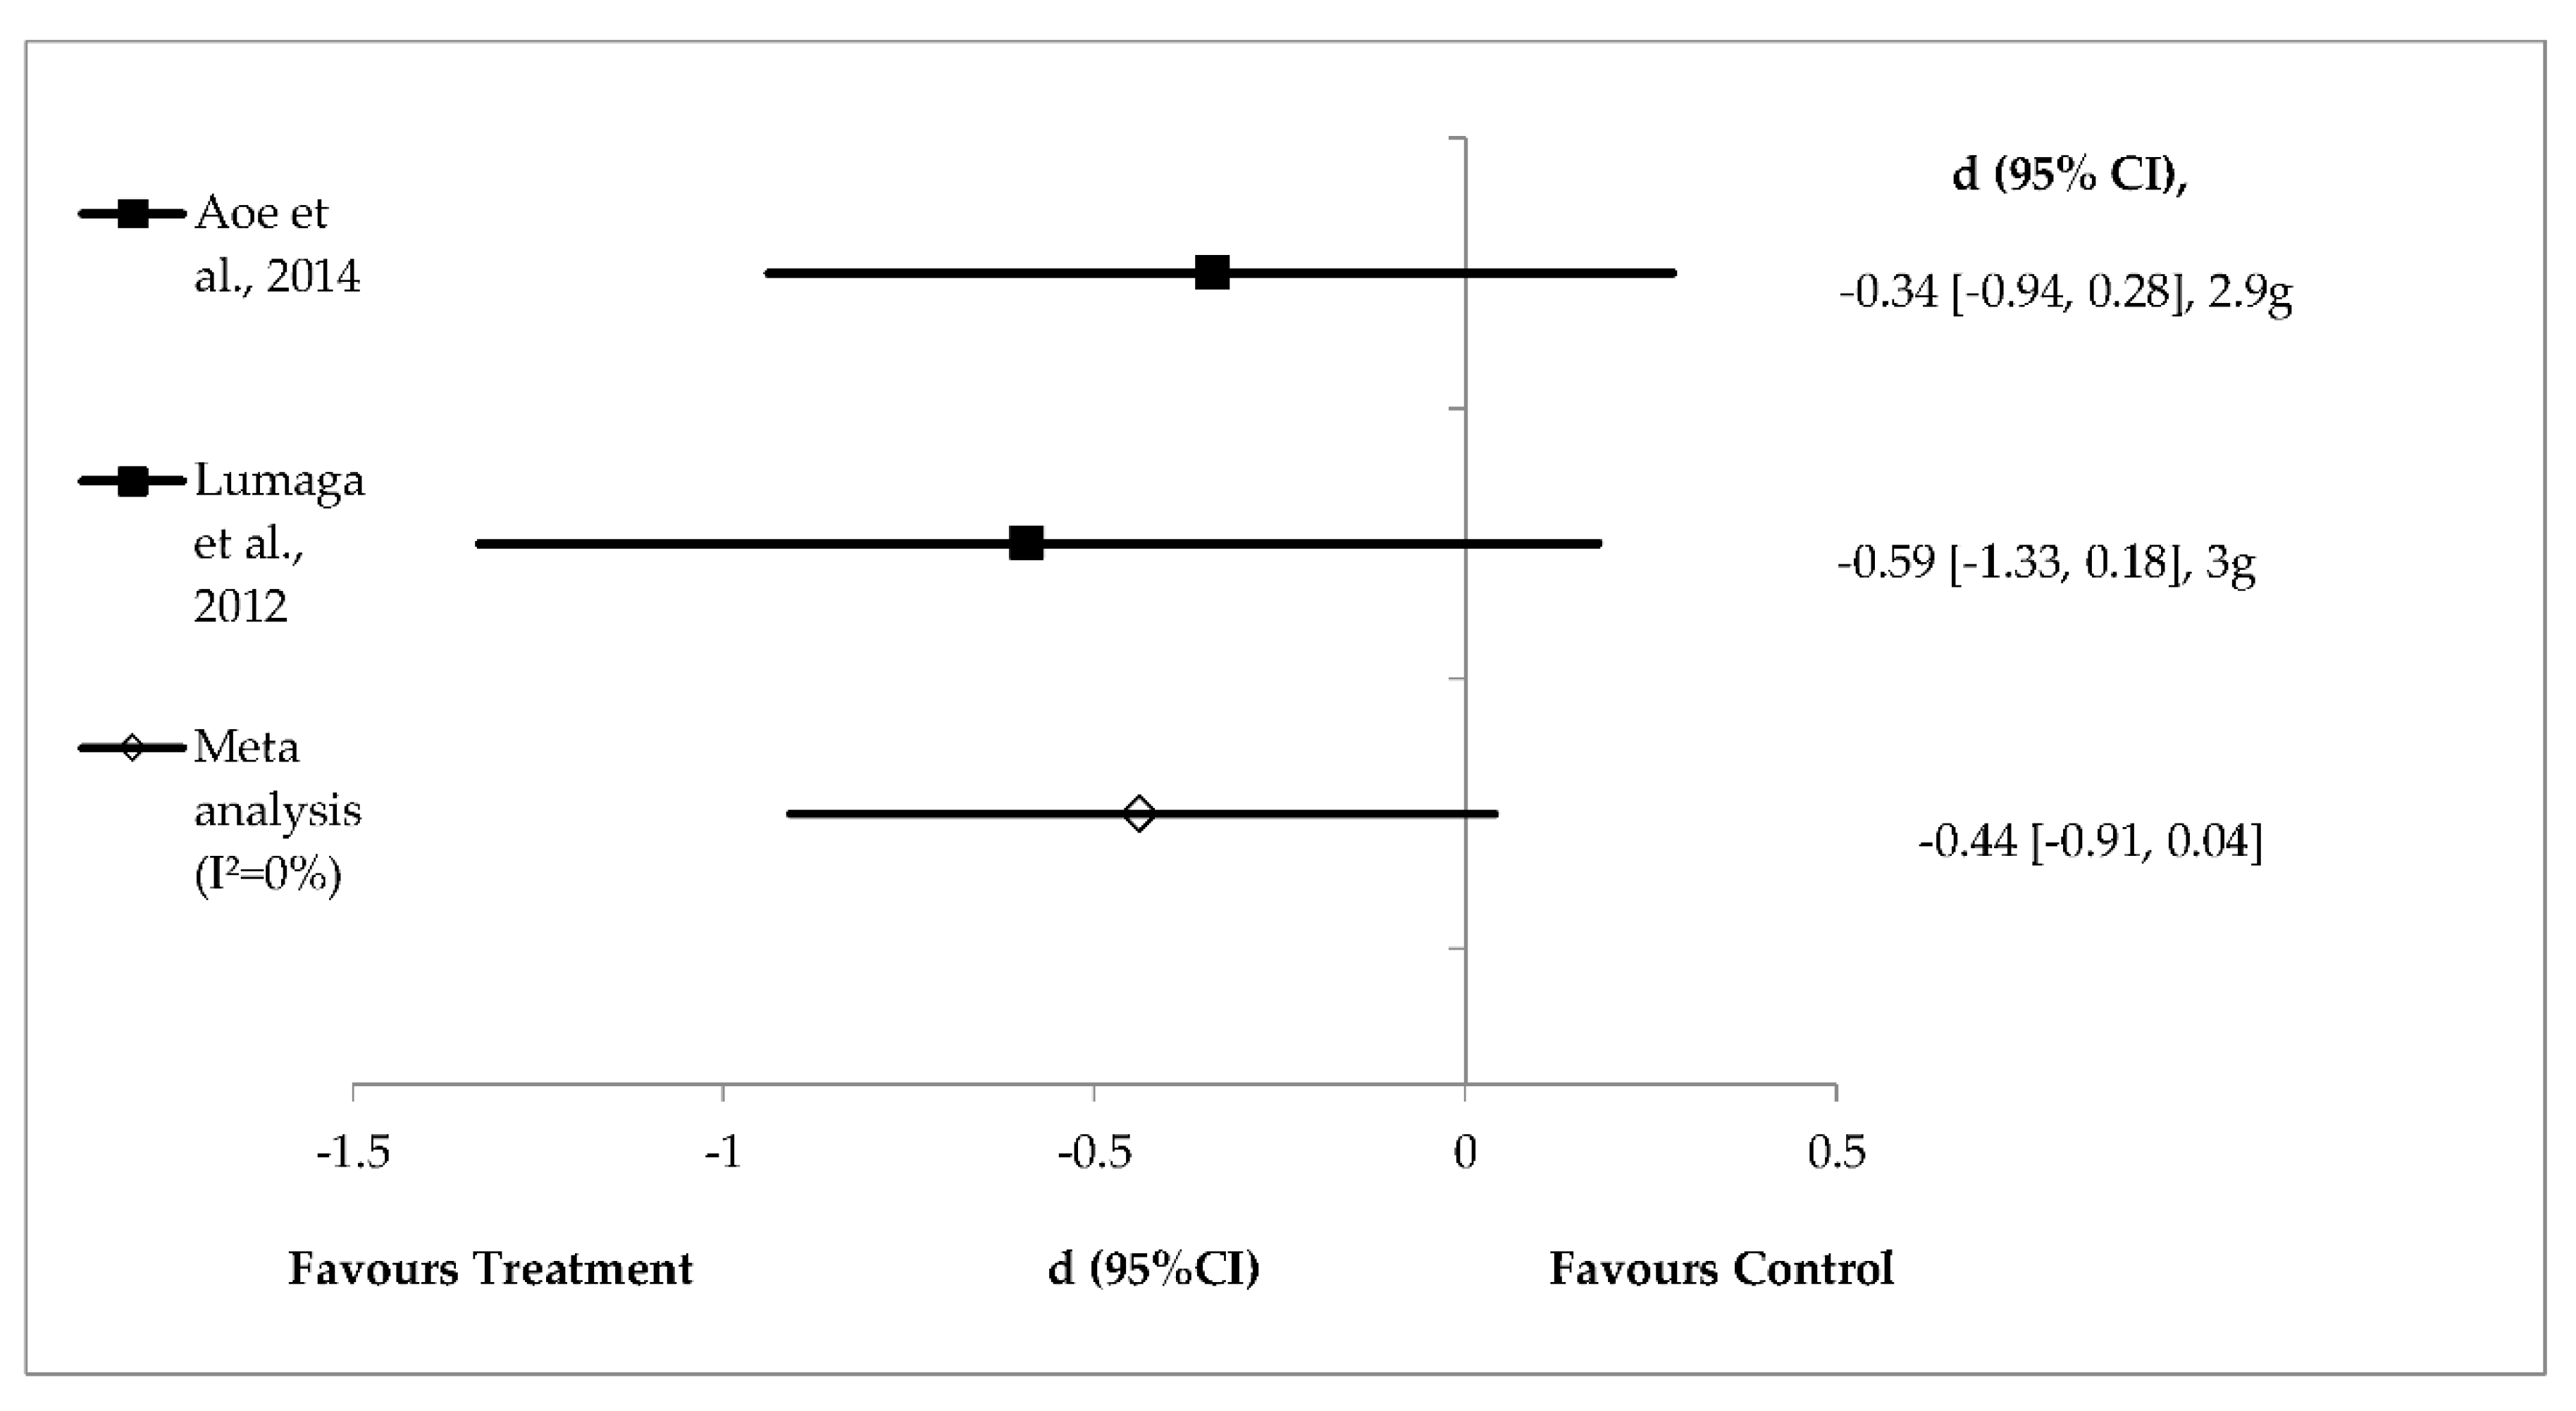
3.5. Random Effects Analysis

Studies investigating the effects of alginate (n = 2) and guar gum (n = 3) on energy intake showed a high level of heterogeneity and hence were analysed using random effects analysis (Figure 3 and Figure 4). Figure 3 shows the effect sizes of mean energy intake reduction in studies with alginate supplementation (n = 2), ranging from very small (d = −0.04, p = 0.78) to large (d = −0.81, p < 0.001). Mean energy intake reduction in all three doses of test product favoured treatment. Five grams of alginate in milk beverages (liquid) and 9 g in chocolate cookies (solid) significantly (p < 0.05) reduced energy intake compared with control [35,36]. The effect size of 5 g of alginate was larger [35] than that of 9 g of alginate [36]. However, a meta-analysis showed a medium and non-significant difference in mean energy intake reduction favouring alginate supplementation (pooled effect size of −0.42; 95% CI (–0.84, 0.01); I2 = 80.9%) (Figure 3).
Figure 4 shows the effect size of mean energy intake reduction after guar gum supplementation (n = 3). The effect sizes range from small (d = 0.06, p = 0.65) to very large (d = −3.55, p < 0.001). Mean energy intake in three test products favoured treatment groups except for 6.9 g of guar gum [36]. Either 2 g of partially hydrolysed guar gum or 5 g of guar gum prepared in the liquid food matrix significantly reduced energy intake [35,37]. However, a large but non-significant pooled effect size of −0.90 (95% CI (−1.83, 0.03); I2 = 95.8%) was observed for guar gum on energy intake reduction (Figure 4).

3.6. Fixed Effects Analysis

The level of heterogeneity was low for the effects of β-glucan (n = 2), pectin (n = 2) and polydextrose (n = 4) on energy intake and hence these were analysed using fixed effects analysis (Figure 5, Figure 6 and Figure 7). Meta-analysis of the studies shows a non‒significant difference in mean energy intake reduction favouring β-glucan supplementation with medium effect (pooled effect size of −0.44; 95% confidence interval: −0.91 to 0.04; I2 = 0%). Individual studies of β-glucan showed high effect size when prepared in liquid (d = −0.59, p = 0.13) compared with solid meal form (d = −0.34, p = 0.28) [38,39] (Figure 5).
Pectin supplementation (n = 2) did not significantly reduce energy intake with effect sizes of −0.20 to −0.36 [39,40]. A small and non‒significant pooled effect size of −0.26 (95% CI (−0.53, 0.02); I2 = 0%) was observed for pectin on energy intake reduction (Figure 6).
Polydextrose supplementation (n = 4) resulted in a small (−0.14) to a large (−0.81) effect size on mean energy intake reduction [41,42,43,44] (Figure 7) with a small and significant pooled effect size of 0.36 (95% CI (−0.56, −0.017); I2 = 0%) (Figure 7). Polydextrose supplemented in chocolate-flavoured beverages significantly reduced energy intake with a large effect size of ‒0.81 [42]. Polydextrose (6.25 g) prepared in liquid matrix and polydextrose (6 g) in pudding with semi-skimmed milk (composite meal) showed small effect sizes of d = −0.14 and d = −0.18, respectively. Interestingly, this review also found that polydextrose with the same doses (12.5 g) and same liquid food matrix exhibited distinct effect sizes, both small (d = −0.21) and medium (d = −0.56) [42,44] with small and significant pooled effect size of −0.36 (95% CI (−0.56, −0.17); I2 = 0%) (Figure 7).

4. Discussion

A total of eight soluble fibres were identified as follows: alginate, guar gum, arabinoxylan, β-glucan, high-amylose maize, pectin, polydextrose and PolyGlycopleX. Guar gum showed the greatest energy intake reduction, followed by β-glucan, alginate, polydextrose and pectin. The risk of bias was high; only four studies clearly reported how randomisation was conducted. The randomisation procedure was not clearly described in most studies, resulting low Jadad scores. Only one study was double-blinded [37].
The pooled random effects analysis showed that alginate did not significantly reduce energy intake in healthy adults (Figure 3). However, when considering individual studies, 5 g of alginate prepared in 250 mL milk beverages showed a larger and significant effect (d = −0.81, p < 0.001) on energy intake reduction than 6 g alginate in chocolate cookies (small effect size: d = −0.04, p = 0.78) [35,36]. The time interval for energy intake after consumption of 6 g alginate in cookies was shorter compared with alginate in liquid drinks, at 105 and 120 min, respectively. It is expected that a shorter time interval between fibre and ad libitum energy intake would decrease food intake. Hence, it is possible that other factors, such as preloads energy density (kcal/g) and dose may be responsible for such an effect. A higher dose of alginate (9 g) in the solid food matrix increased oral processing time and reduced the rate of gastric emptying [36]. Mechanistically, alginate may form a gel at low pH or in the presence of divalent cations [50]. Alginate forms a gel in the oral cavity due to the presence of water and divalent cations from saliva [51]. The measurement of physico-chemical properties suggests that alginate increases water‒holding capacity as well as digesta viscosity [3,36].
Random effects analysis showed that guar gum (n = 3) did not significantly reduce energy intake in healthy adults (Figure 4). However, when considering individual studies, guar gum (5 g) in milk beverages showed a large and significant effect on energy intake (d = −3.55, p < 0.001) [36]. The preparation of guar gum in milk beverages reduced short-term food intake and satiety (120 min) compared with control preloads [36]. This effect might be due the formation of a more stabilised gel emulsion between milk protein and guar gum in the stomach [52]. Other study has shown reduced hunger ratings with increasing beverage viscosity [53]. However, the effect might be different when guar gum is added to the solid food matrix. Wanders et al. [36] showed that both 5.6 g and 6.9 g of guar gum prepared in cookies did not reduce ad libitumfood intake compared with control. The study suggested that the liquid food matrix showed more pronounced effects on reduced energy intake compared with solid food matrix. Rao et al. [37] showed that long-term (two-week long) intake of 2 g partially hydrolysed guar gum (PHGG) for 14 days significantly reduced energy intake at lunch and evening snacks compared with control dextrin. PHGG is produced from guar gum with the same molecular structure but with shorter chain length [54]. Natural guar gum is extremely viscous and might form a very viscous product when added to products, lowering acceptability. Hence, a low molecular weight guar gum is more favourable than a high molecular weight one for product development. An early study by Ellis et al. [55] showed that low molecular weight guar gum markedly increased product palatability compared with high molecular weight guar gum.
Pectin is a natural fibre present in fruit and vegetables and one of the major plant cell wall components. Pectin has varying viscosity and gelling ability in accordance with its molecular weight [56]. Pectin behaves differently when hydrated in the liquid food matrix [40]. Wanders et al. [40] showed that viscous (80 kDa) and bulking pectin (25 kDa) had similar effects on energy reduction followed by gelled pectin (15 kDa). However, the effects were not statistically significant [40]. This study demonstrated that 10 g of pectin with a molecular weight of 15 kDa formed a gel while 80 kDa pectin increased the viscosity of dairy-based liquid drinks. All three type of pectin reduced gastric emptying, as indicated by 13C recovery in breath samples. However, this study showed that reduced gastric emptying was not associated with a reduction in energy intake. Wanders et al. [40] further investigated different modes of pectin delivery, namely supplemented as equal dose of gelled pectin (10 g, 15 kDa) in liquid beverage and capsule form. The latter approach was taken so that the pectin would form a gel in the stomach. The encapsulated pectin significantly reduced energy intake compared with gelled pectin in a liquid beverage [40]. Product viscosity rather than stomach viscosity reduced ad libitum intake [57]. It may be that the encapsulated pectin is entrapped in the food matrix within the stomach and must be hydrated first [3,58]. More water was retained, increasing small bowel transit time [59,60].
β-glucan is a soluble fibre extracted from oat and barley. Four grams of β-glucan per 30 g of available carbohydrate has been approved by the European Food Safety Authority to reduce blood glucose without disproportionately increase insulin levels [61]. β-glucan confers other health benefits, such as improving insulin resistance, dyslipidaemia, hypertension and obesity [62]. The results from fixed effects analysis show that β-glucan does not significantly reduce energy intake (Figure 5). In this review, 2.9 g of β-glucan in the solid food matrix (cooked white rice) did not reduce energy intake compared with control (d = −0.34, p = 0.28) [38]. β-glucan supplementation (3.0 g) in beverages reduced energy intake (medium effect size, d = −0.59), but the difference was not significant (p = 0.13) compared with control [39]. These two individual studies suggest that 2.9 g to 3.0 g of β-glucan either in the liquid or solid food matrix had small to medium, non-significant effects size on reducing energy intake. The satiety mechanism is complex and involves an integrated physiological system (the food-gut-brain axis) [63]. These physiological responses determine what we eat and how much of it we consume. In this review, we focused on the role of adding soluble fibre to food to manipulate the satiety response. Research has shown that adjusting the energy density of food by increasing its volume (e.g., by adding water or dietary fibre) while maintaining the macronutrient composition might be a good strategy to enhance satiety [64].
The effect of β-glucan on perceived satiety depends on factors such as dose, molecular weight and solubility, and food matrix. In the context of doses, this review found that 3.0 g of β-glucan supplemented in 250 mL beverages significantly increased satiety compared to control beverages [39]. This finding was in line with Lyly et al. [24] who reported that 2.5 g of β-glucan in 300 mL beverages significantly increased perceived satiety compared with fibre-free beverages. The physical effects of β-glucan on the ingesta appear to be fundamentally important in shaping their satiating properties. This effect is highly dependent on the molecular size and solubility of β-glucans [25]. The molecular weight of β-glucans varies from 31 to 3100 kDa and is a major determinant of their solubility in water and, hence, satiety [65]. The molecular weight of β-glucan varies depending on the production process, that is, isolation, purification, and extraction [66].
Food matrix might also play a role on the effect of β-glucan and satiety. In theory, solid foods are more satiating than liquid foods [67]. However, most studies have failed to show any significant effect of β-glucan on satiety when prepared in solid or semi-solid compared with liquid meals [24]. Soluble fibres, when prepared in liquid meal form, absorb more water and increase stomach distension, triggering afferent vagal signals to stop eating (i.e., increasing fullness) [68]. Mattes and Rothacker [53] elegantly demonstrated that a higher viscosity shake (16,000 cps) was more effective at reducing perceived hunger than a low viscosity shake (600 cps). Lyly et al. [69] showed that beverages enriched with soluble β-glucan increased perceived satiety compared with fibre-free beverage. However, both beverages (β-glucan and control) showed lower perceived satiety compared with a solid meal (white bread). This suggests that the presence of both liquid and solid food within a trial might mask the satiating potential of β-glucan. A similar study has demonstrated that the more pronounced satiating effect of solid food per se may ‘mask’ the satiating potential of β-glucan [62]. Juvonenet al. [45] demonstrated that increased viscosity produced by oat β-glucan in liquid meal markedly reduced postprandial appetite hormones, namely, CCK, PYY and GLP-1. High-viscosity β-glucan drinks reduce intestinal mixing and might prevent the interaction between the nutrients and enteroendocrine L cells in the distal colon for appetite hormones release [70]. Three-hour ad libitum energy intake was similar between low- and high-viscosity beverages but was significantly lower when energy intake was combined for the rest of the day [45]. However, it must be noted that appetite hormones do not necessarily correlate with food intake and vary between individuals [71]. Lumaga et al. [39] demonstrated that β-glucan in liquid beverages did not reduce energy intake or significantly affect appetite hormones (PYY, GLP-1 and GIP) but did significantly reduce perceived satiety compared with the control. One study showed that the average colonic transit time for the Western population is 30–40 h [72]. Other studies demonstrated that the effects on appetite might take up to 6 h after the ingestion of soluble fibre [73,74]. Based on this evidence, it is highly advisable to consider the time frame for the measurement of appetite hormones.
In this review, we focused on four main outcome measures namely gastric emptying time, appetite hormones, energy intake and perceived satiety (Figure 2). The majority of the studies focused on measuring energy intake in isolation (n = 8) and energy intake plus gastric emptying time (n = 7). Only two studies (n = 2, both are polydextrose) measured all four outcomes. It is strongly advisable to measure all four elements to have a better understanding of the effects of dietary fibre on appetite regulation. Polydextrose is a type of soluble dietary fibre and is not digested in the upper gastro-intestinal tract. Instead, it is partially fermented in the large intestine for the production of SCFAs [75]. Polydextrose is resistant to digestion and is partially fermented by the intestinal microbiota [76,77]. Polydextrose is well tolerated up to a dose of 90 g/day and has no laxative effect [78]. In this review, the heterogeneity for polydextrose was low (I2 = 0%), and these studies were, therefore, analysed using fixed effects analysis. Polydextrose showed a medium-sized pooled effect (d = −0.36, p < 0.05) on energy intake reduction. An individual study showed that 25 g of polydextrose significantly reduced (d = −0.81, p < 0.001) energy intake (90-min post preload) when prepared in 400 mL chocolate-flavoured liquid drinks compared with control [42]. This was consistent with the findings of the previous study, which demonstrated that 25 g of polydextrose in 200 g of yogurt significantly reduced energy intake compared with control yogurt. Similar to other soluble fibres, polydextrose increases gastrointestinal viscosity and may be subject to colonic fermentation for the production of SCFA [79,80,81]. However, lower doses of 6.25, 6.3 and 12.5 g of polydextrose prepared in liquid beverages were less effective at reducing energy intake [42,44]. Soong et al. [43] showed that 12 g of polydextrose prepared with low- and high-protein (LPP and HPP) soya bean curd significantly reduced gastric emptying time compared with the control. However, the supplementation did not reduce energy intake or increase perceived satiety compared with the control. LPP and HPP marginally increased GLP-1 compared with control soya bean curd. This is consistent with the results of other studies which have shown GLP-1 to slow gastric emptying in individuals following a high-fibre diet [82,83].

5. Conclusions

In this review, the evidence has shown that soluble fibre can potentially be used as an active ingredient for the formulation of functional foods. Soluble fibres might play a role in reducing energy intake and hence could be incorporated in the daily dietary intake. However, not all soluble fibres have similar effects on appetite regulation, that is, appetite hormones, gastric emptying and perceived satiety. Further long-term study is needed to determine whether these fibres could reduce energy intake and hence help maintain long-term body weight. Future research should aim to determine whether there is a synergistic effect when combining different soluble fibres together in the food matrix to reduce energy intake and/or stimulate appetite hormones. In addition, studies have not focused on the effects of soluble dietary fibre on colonic transit time. Thus, there is a need for future studies to explore this angle. This systematic review suggests that the food matrix of preloads is important to induce satiety, preferably as the liquid food matrix. Based on our earlier research questions, 5 g of guar gum in a liquid meal is optimal for reducing subsequent energy intake. Guar gum effectively reduces energy intake, but it is not always as palatable as other soluble fibres. We suggest using a combination of guar gum with other soluble fibres, for instance alginate, β-glucan, pectin and/or polydextrose, in order to improve palatability, reduce energy intake and increase appetite hormones.

Author Contributions

S.N.S., A.M.M.J. and A.A.H.F. designed and conceived the systematic review. S.N.S., A.M.M.J., and A.A.H.F. conducted the literature search and study selection. S.N.S. and A.M.M.J. analysed and interpreted the data and wrote the article. S.N.S., A.M.M.J., A.A.H.F., M.N.Z. and N.B.R. approved final revisions of the manuscript submitted for publication.

Funding

This study and the Article Processing Charge (APC) were funded by the Special Research Grant Scheme (SRGS), Universiti Sultan Zainal Abidin (UniSZA) (grant number R0019-R014) and Fundamental Research Grant Scheme (FRGS) Ministry of Education Malaysia (grant number FRGS/1/2017/SKK06/UNISZA/03/7).

Acknowledgments

The authors would like to thank to Nyi Nyi Naing for analytical and technical support especially in meta-analysis part.

Conflicts of Interest

The authors declare no conflict of interest. The funding sponsors had no role in the design of the study; in the collection, analyses, or interpretation of data; in the writing of the manuscript; or in the decision to publish the results.

References

  1. Mann, J.I.; Cummings, J.H. Possible implications for health of the different definitions of dietary fibre. Nutr. Metab. Cadiovasc. Dis. 2009, 19, 226–229. [Google Scholar] [CrossRef] [PubMed]
  2. Sullivan, D.M.; Carpenter, D.E. Methods of Analysis for Nutrition Labelling; AOAC International: Arlington, VA, USA, 1993; p. 624. ISBN 0935584528. [Google Scholar]
  3. Kristensen, M.; Jensen, M.G. Dietary fibres in the regulation of appetite and food intake. Importance of viscosity. Appetite 2011, 56, 65–70. [Google Scholar] [CrossRef] [PubMed]
  4. Jenkins, D.J.; Wolever, T.M.; Leeds, A.R.; Gassull, M.A.; Haisman, P.; Dilawari, J.; Goff, D.V.; Metz, G.L.; Alberti, K.G. Dietary fibres, fibre analogues and glucose tolerance: Importance of viscosity. Br. Med. J. 1978, 1, 1392–1394. [Google Scholar] [CrossRef] [PubMed]
  5. Wood, P.J.; Braaten, J.T.; Scott, F.W.; Riedel, K.D.; Wolynetz, M.S.; Collins, M.W. Effects of dose and modification of viscous properties of oat gum on plasma and insulin following an oral glucose load. Br. J. Nutr. 1994, 72, 731. [Google Scholar] [CrossRef] [PubMed]
  6. Wong, J.M.; de Souza, R.; Kendall, C.W.; Emam, A.; Jenkins, D.J. Colonic health: Fermentation and short chain fatty acids. J. Clin. Gastroenterol. 2006, 40, 235–243. [Google Scholar] [CrossRef] [PubMed]
  7. Macfarlene, S.; Macfarlene, G.T.; Cummings, J.H. Review article: Prebiotics in the gastrointestinal tract. Aliment. Pharmacol. Ther. 2006, 24, 701–714. [Google Scholar] [CrossRef] [PubMed]
  8. Roberfroid, M.B. Inulin-type fructans: Functional food ingredients. J. Nutr. 2007, 137, 249–250. [Google Scholar] [CrossRef]
  9. Dikeman, C.L.; Murphy, M.R.; Fahey, G.C. Dietary fibers affect viscosity of solutions and simulated human gastic and small intestinal digesta. J. Nutr. 2006, 136, 913–919. [Google Scholar] [CrossRef]
  10. Dikeman, C.L.; Fahey, G.C. Viscosity as related to dietary fiber: A review. Crit. Rev. Food. Sci. Nutr. 2006, 46, 649–663. [Google Scholar] [CrossRef]
  11. Braaten, J.T.; Wood, P.J.; Scott, F.W.; Riedel, K.D.; Poste, L.M.; Collins, M.W. Oat gum lowers glucose and insulin after an oral glucose load. Am. J. Clin. Nutr. 1991, 53, 1425–1430. [Google Scholar] [CrossRef]
  12. Marciani, L.; Gowland, P.A.; Spiller, R.C.; Manoj, P.; Moore, R.J.; Young, P.; Fillery-Travis, A.J. Effect of meal viscosity and nutrient on satiety, intragastric dilution and emptying assessed by MRI. Am. J. Physiol. Gastrointest. Liver Physiol. 2001, 280, 1227–1233. [Google Scholar] [CrossRef] [PubMed]
  13. Darwiche, G.; Björgell, O.; Almér, L.-O. The addition of locust bean gum but not water delayed the gastric emptying rate of a nutrient semisolid meal in healthy subjects. BMC Gastroenterol. 2003, 3, 12. [Google Scholar] [CrossRef] [PubMed] [Green Version]
  14. Edwards, C.A.; Johnson, I.T.; Read, N.W. Do viscous polysaccharides slow absorption by inhibiting diffusion or convection? Eur. J. Clin. Nutr. 1988, 42, 307–312. [Google Scholar] [PubMed]
  15. Schneeman, B.O.; Gallaher, D. Effects of dietary fiber on digestive enzyme activity and bile acids in the small intestine. Proc. Soc. Exp. Biol. Med. 1985, 180, 409–412. [Google Scholar] [CrossRef] [PubMed]
  16. Eastwood, M.A.; Morris, E.R. Physical properties of dietary fiber that influence physiological function: A model for polymers along the gastrointestinal tract. Am. J. Clin. Nutr. 1992, 55, 436–442. [Google Scholar] [CrossRef] [PubMed]
  17. Delzenne, N.M.; Cani, P.D.; Daubioul, C.; Neyrinck, A.M. Impact of inulin and oligofructose on gastrointestinal peptides. Br. J. Nutr. 2005, 93, 157–161. [Google Scholar] [CrossRef]
  18. Keenan, M.J.; Zhou, J.; McCutcheon, K.L.; Raggio, A.M.; Bateman, H.G.; Todd, E.; Jones, C.K.; Tulley, R.T.; Melton, S.; Martin, R.J.; et al. Effects of resistant starch, a non-digestible fermentable fiber on reducing body fat. Obesity 2006, 14, 1523–1534. [Google Scholar] [CrossRef] [PubMed]
  19. Reimer, R.A.; McBurney, M.I. Dietary fiber modulates intestinal proglucagon messenger ribonucleic acid and postprandial secretion of glucagon-like peptide-1 and insulin in rats. Endocrinology 1996, 137, 3948–3956. [Google Scholar] [CrossRef]
  20. Dumoulin, V.; Moro, F.; Barcelo, A.; Dakka, T.; Cuber, J.C. Peptide YY, glucagon-like peptide-1 and neurotensin responses to luminal factors in the isolated vascularly perfused rat ileum. Endocrinology 1998, 139, 3780–3786. [Google Scholar] [CrossRef]
  21. Gibson, G.R.; Probert, H.M.; Loo, J.V.; Rastall, R.A.; Roberfroid, M.B. Dietary modulation of the human colonic microbiota: Updating the concept of prebiotics. Nutr. Res. Rev. 2004, 17, 259–275. [Google Scholar] [CrossRef]
  22. Douglas, L.C.; Sanders, M.E. Probiotics and prebiotics in dietetics practice. J. Am. Diet. Assoc. 2008, 108, 510–521. [Google Scholar] [CrossRef] [PubMed]
  23. Blundell, J.; De Graaf, C.; Hulshof, T.; Jebb, S.; Livingstone, B.; Lluch, A.; Mela, D.; Salah, S.; Schuring, E.; Knaap, H.V.D.; et al. Appetite control: Methodological aspects of the evaluation of foods Europe PMC Funders Group. Obes. Rev. 2010, 11, 251–270. [Google Scholar] [CrossRef] [PubMed]
  24. Lyly, M.; Ohls, N.; Lähteenmäki, L.; Salmenkallio-Marttila, M.; Liukkonen, K.-H.; Karhunen, L.; Poutanen, K. The effect of fibre amount, energy level and viscosity of beverage containing oat fibre supplement on perceived satiety. Food Nutr. Res. 2010, 54. [Google Scholar] [CrossRef] [PubMed]
  25. Burkus, Z.; Temelli, F. Quantitative determination of β-glucan content. Curr. Protoc. Food Anal. Chem. 2003, 7, E3.5.1–E3.5.12. [Google Scholar] [CrossRef]
  26. World Health Organization. Obesity: Preventing and Managing the Global Epidemic; World Health Organization: Geneva, Switzerland, 2000; pp. 1–268. [Google Scholar] [CrossRef]
  27. West, S.L.; Gartlehner, G.; Mansfield, A.J.; Poole, C.; Tant, E.; Lenfestey, N.; Lux, L.J.; Amoozegar, J.; Morton, S.C.; Carey, T.C.; et al. Comparative Effectiveness Review Methods: Clinical Heterogeneity; Agency for Healthcare Research and Quality: Rockville, MD, USA, 2010.
  28. Guyatt, G.; Rennie, D.; Meade, M.O.; Cook, D.J. Users’ Guides to Themedical Literature, 2nd ed.; McGraw Hill Medical: New York, NY, USA, 2008. [Google Scholar]
  29. O’Connor, D.; Green, S.; Higgin, J.P. Defining the review question and developing criteria for including studies. In Cochrane Handbook for Systematic Reviews of Interventions; John Wiley & Sons, Ltd.: Chichester, UK, 2008; pp. 81–94. ISBN 97080470699515. [Google Scholar]
  30. Borenstein, M.; Hedges, L.V.; Higgins, J.P.T.; Rothstein, H.R. Effect sizes based on means. In Introduction to Meta-Analysis, 1st ed.; John Wiley & Sons, Ltd.: Chichester, UK, 2009; pp. 21–32. ISBN 9780470743386. [Google Scholar]
  31. LeBlanc, D.C. Statistics: Concepts and Application for Science; Jones and Barlette: Burlington, MA, USA, 2004; p. 382. ISBN 0763746991. [Google Scholar]
  32. Neyeloff, J.L.; Fuchs, S.C.; Moreira, L.B. Meta-analyses and forest plots using a Microsoft excel spreadsheet: Step-by-step guide focusing on descriptive data analysis. BMC Res. Notes 2012, 5, 52. [Google Scholar] [CrossRef] [PubMed]
  33. Higgins, J.P.T.; Thompson, S.G.; Deeks, J.J.; Altman, D.G. Measuring inconsistency in meta-analyses Testing for heterogeneity. BMJ 2003, 327, 557–560. [Google Scholar] [CrossRef] [PubMed]
  34. Jadad, A.R.; Moore, R.A.; Carroll, D.; Jenkinson, C.; Reynolds, D.J.; Gavaghan, D.J.; McQuay, H.J. Assessing the quality of reports of randomized clinical trials: Is blinding necessary? Control. Clin. Trials 1996, 17, 1–12. [Google Scholar] [CrossRef]
  35. Arshad, M.U.; Ishtiaq, S.; Anjum, F.M.; Saeed, F.; Chatha, S.A.S.; Imran, A. Acute effects of different dietary polysaccharides added in milk on food intake, postprandial appetite and glycemic responses in healthy young females. Int. J. Food Sci. Nutr. 2016, 67. [Google Scholar] [CrossRef]
  36. Wanders, A.J.; Jonathan, M.C.; Van Den Borne, J.J.G.C.; Mars, M.; Schols, H.A.; Fesken, E.J.M.; De Graaf, C. The effects of bulking, viscous and gel-forming dietary fibres on satiation. Br. J. Nutr. 2013, 109, 1330–1337. [Google Scholar] [CrossRef]
  37. Rao, T.P.; Hayakawa, M.; Minami, T.; Ishihara, N.; Kapoor, M.P.; Ohkubo, T.; Juneja, L.R.; Wakabayashi, K. Post-meal perceivable satiety and subsequent energy intake with intake of partially hydrolysed guar gum. Br. J. Nutr. 2015, 113, 1489–1498. [Google Scholar] [CrossRef] [Green Version]
  38. Aoe, S.; Ikenaga, T.; Noguchi, H.; Kohashi, C.; Kakumoto, K.; Kohda, N. Effect of cooked white rice with high β-glucan barley on appetite and energy intake in healthy Japanese subjects: A randomized controlled trial. Plant Foods Hum. Nutr. 2014, 69, 325–330. [Google Scholar] [CrossRef] [PubMed]
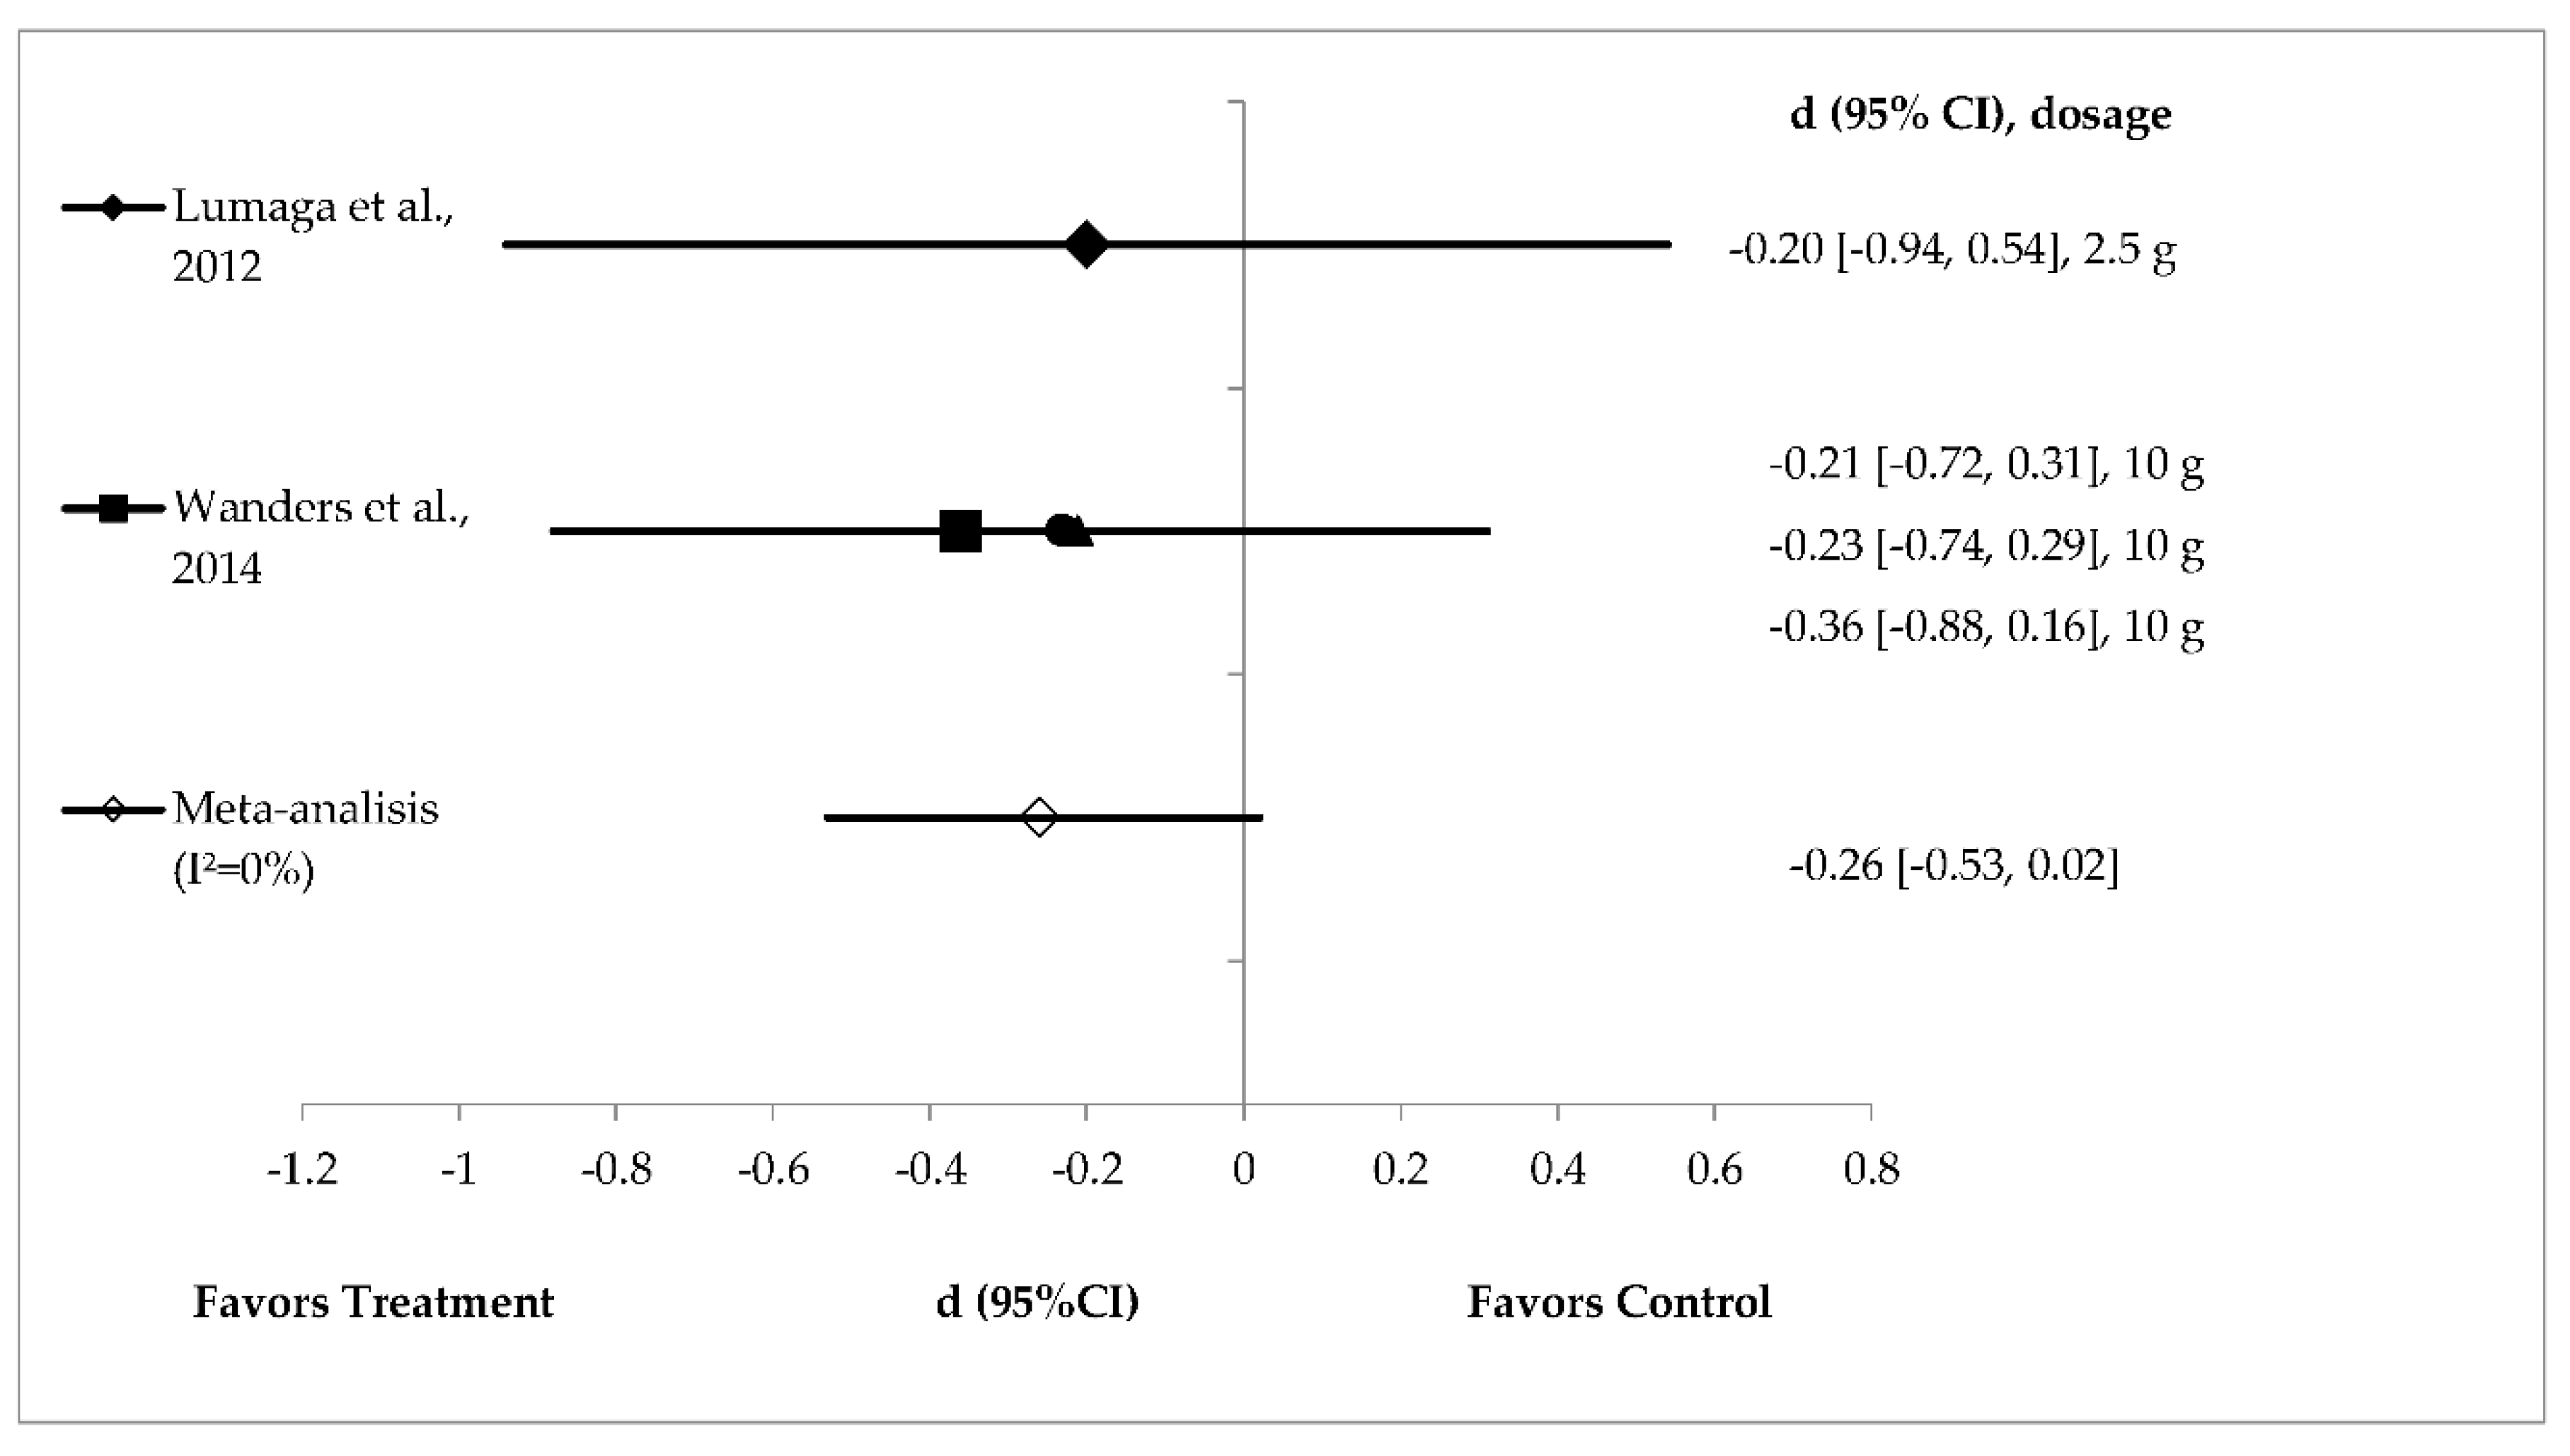
  39. Lumaga, B.; Azzali, R.; Fogliona, V.; Scalfi, L.; Vitaglione, P. Sugar and dietary fibre composition influence, by different hormonal response, the satiating capacity of a fruit-based and a β-glucan-enriched beverage. Food Funct. 2012, 3, 67–75. [Google Scholar] [CrossRef] [PubMed]
  40. Wanders, A.J.; Fesken, E.J.M.; Jonathan, M.C.; Schol, H.A.; de Graaf, C.; Mars, M. Pectin is not pectin: A randomized trial on the effect of different physicochemical properties of dietary fiber on appetite and energy intake. Physiol. Behav. 2014, 128, 212–219. [Google Scholar] [CrossRef] [PubMed]
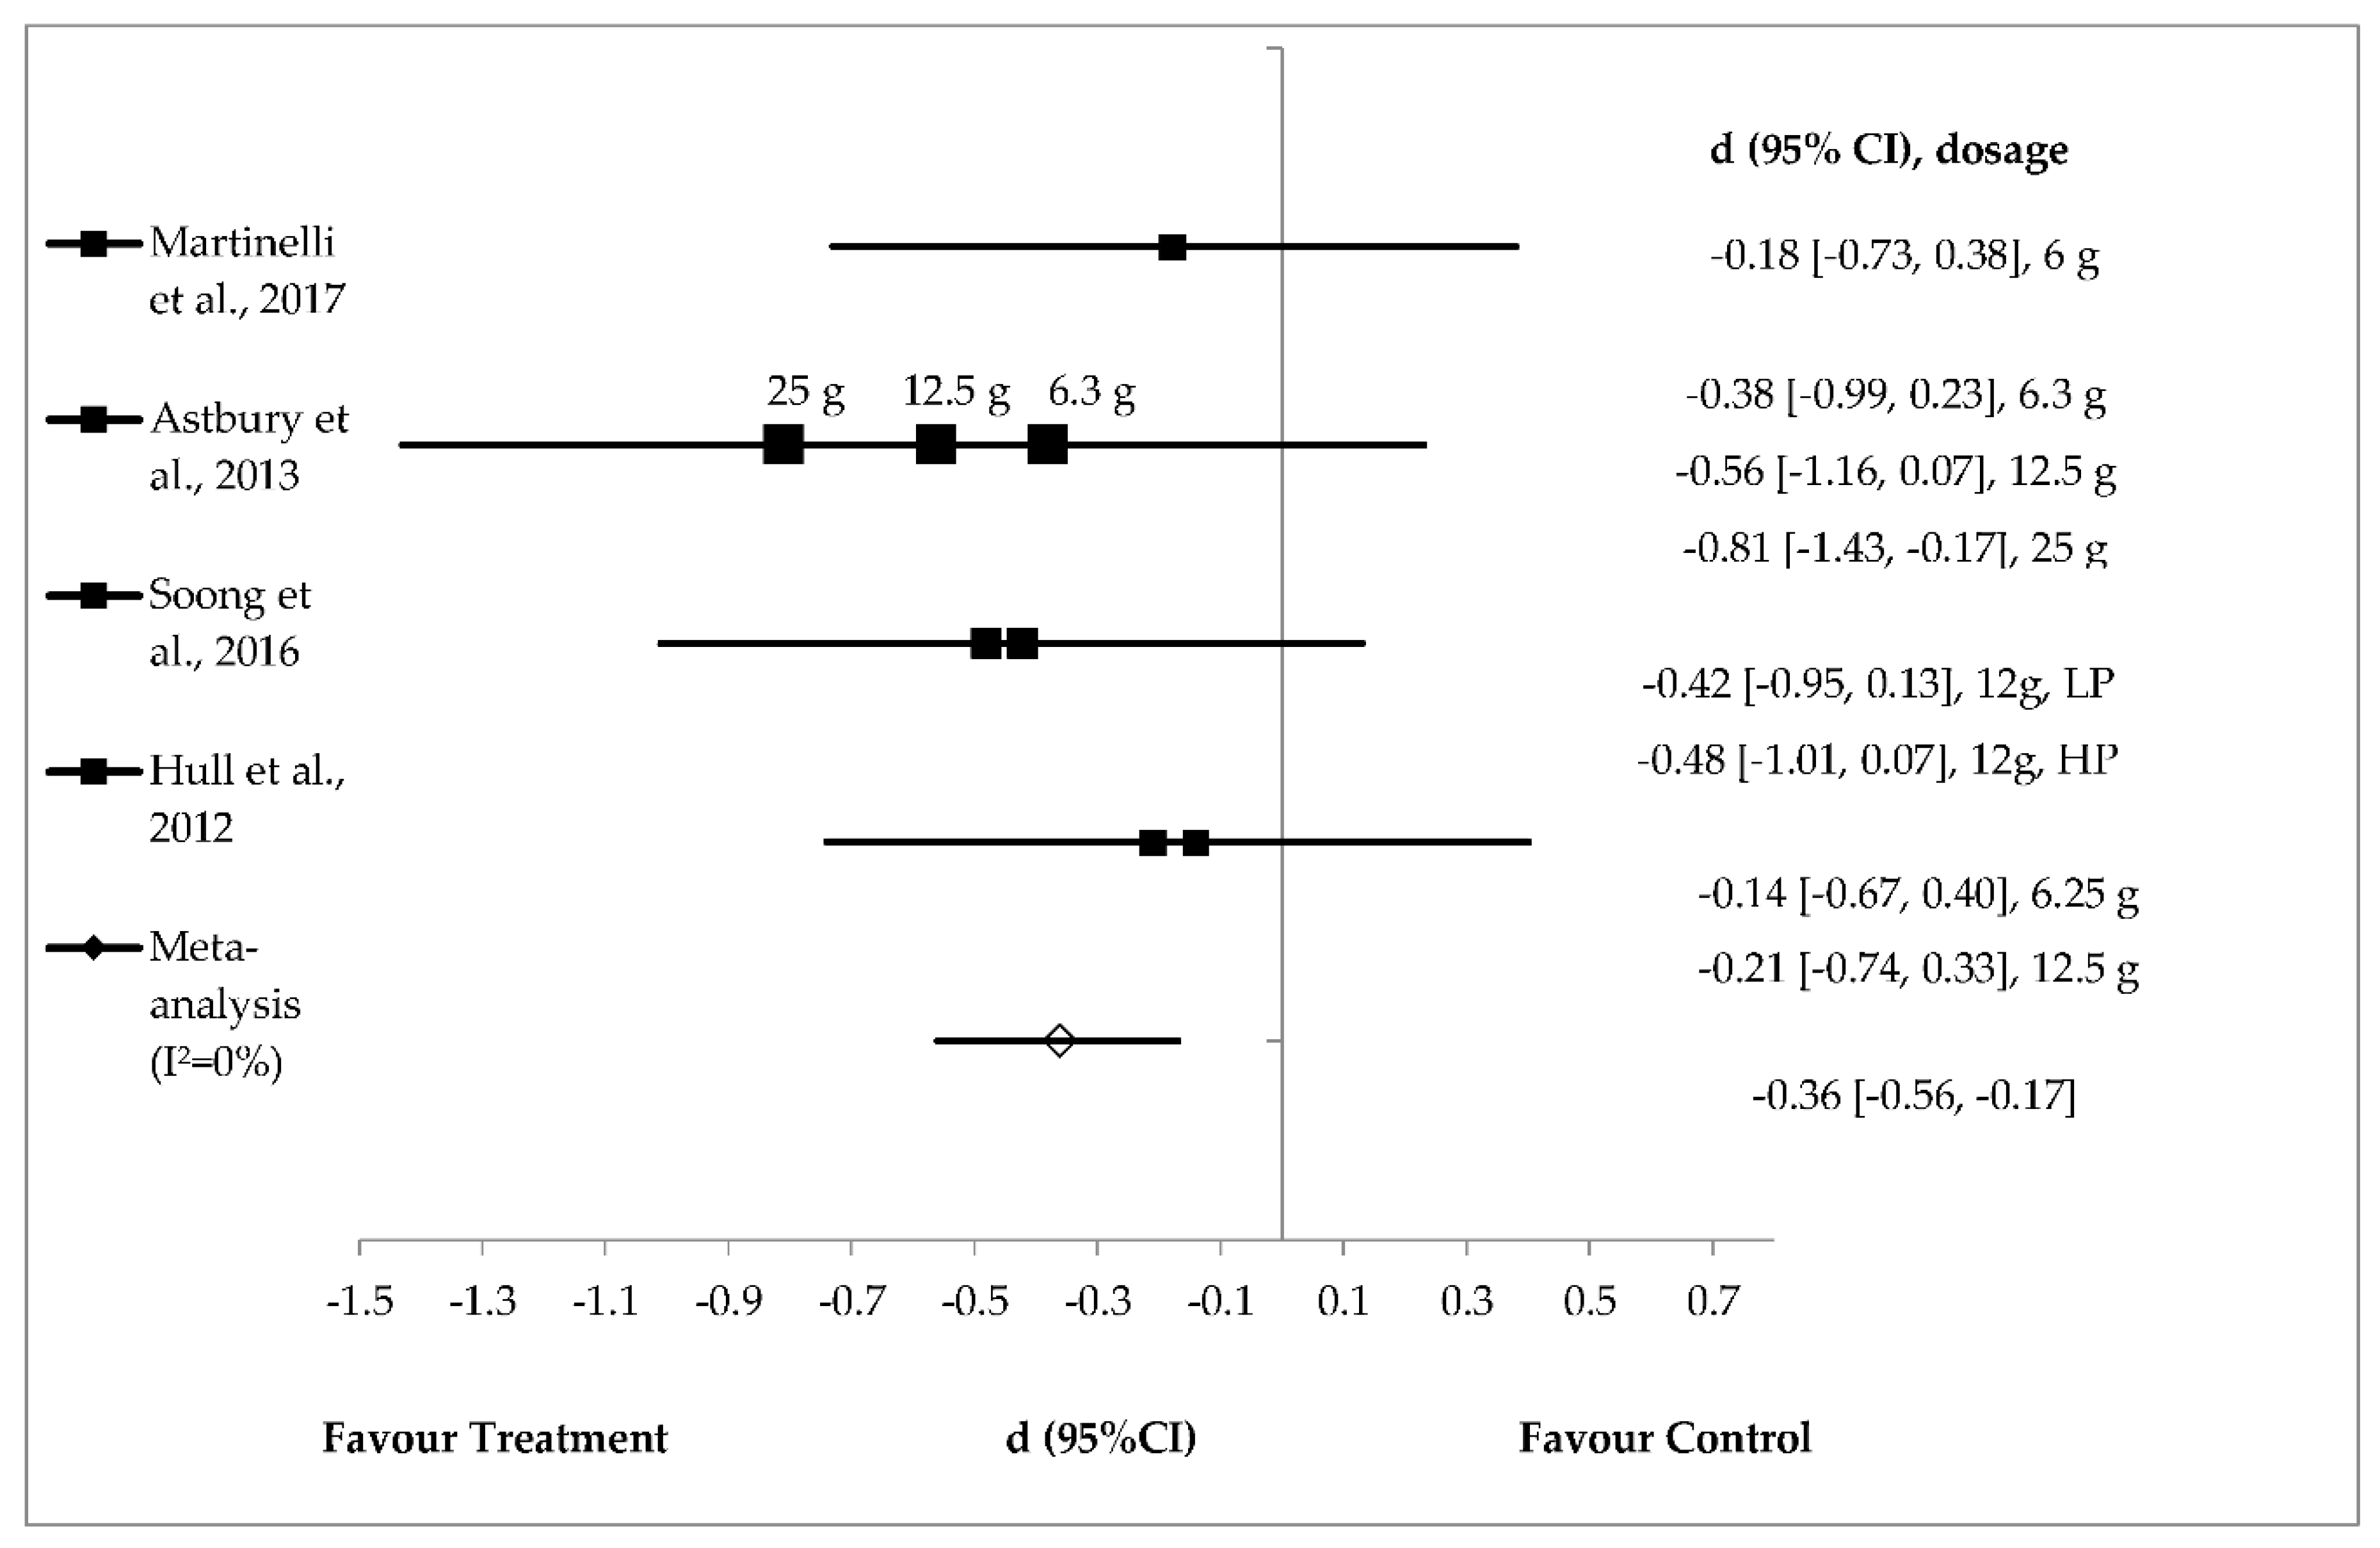
  41. Martinelli, M.; Walz, F.; Goñi, E.; Passutti, G.; Osella, C.; Drago, S.R. Effects of puddings containing whey protein and polydextrose on subjective feelings of appetite and and short-term energy intake in healthy adults. Int. J. Food Sci. Nutr. 2017, 68, 733–741. [Google Scholar] [CrossRef] [PubMed]
  42. Astbury, N.M.; Taylor, M.A.; MacDonald, I.A. Polydextrose results in a dose-dependent reduction in ad libitum energy intake at a subsequent test meal. Br. J. Nutr. 2013, 110, 934–942. [Google Scholar] [CrossRef] [Green Version]
  43. Soong, Y.Y.; Lim, W.X.; Leow, M.K.S.; Siow, P.C.; Teh, A.L.; Henry, C.J. Combination of soya protein and polydextrose reduces energy intake and glycemic response via modulation of gastric emptying rate, ghrelin and glucagon-like peptide-1 in Chinese. Br. J. Nutr. 2016, 115, 2130–2137. [Google Scholar] [CrossRef]
  44. Hull, S.; Re, R.; Tiihonen, K.; Viscione, L.; Wickham, M. Consuming polydextrose in a mid-morning snack increases acute satiety measurements and reduces subsequent energy intake at lunch in healthy human subjects. Appetite 2012, 59, 706–712. [Google Scholar] [CrossRef]
  45. Juvonen, K.R.; Purhonen, A.-K.; Salmenkallio-Marttila, M.; Lahteenmaki, L.; Laaksonen, D.E.; Herzig, K.-H.; Uusitupa, M.I.J.; Poutanen, K.S.; Karhunen, L.J. Viscosity of oat bran-enriched beverages influences gastrointestinal hormonal responses in healthy humans. J. Nutr. 2009, 139, 461–466. [Google Scholar] [CrossRef]
  46. Boll, E.V.J.; Ekström, L.M.N.K.; Courtin, C.M.; Delcour, J.A.; Nilsson, A.C.; Björck, I.M.E.; Östman, E.M. Effects of wheat bran extract rich in arabinoxylan oligosaccharides and resistant starch on overnight glucose tolerance and markers of gut fermentation in healthy young adults. Eur. J. Nutr. 2016, 55, 1661–1670. [Google Scholar] [CrossRef]
  47. Thazhath, S.S.; Wu, T.; Bound, M.J.; Checklin, H.L.; Jones, K.L.; Willoughby, S.; Horowitz, M.; Rayner, C.K. Changes in meal composition and duration affect postprandial endothelial function in healthy humans. Am. J. Physiol.-Gastrointest. Liver Physiol. 2014, 307. [Google Scholar] [CrossRef] [Green Version]
  48. Luhovyy, B.L.; Mollard, R.C.; Yurchenko, S.; Nunez, M.F.; Berengut, S.; Liu, T.T.; Smith, C.E.; Pelkman, C.L.; Anderson, G.H. The effects of whole grain high-amylose maize flour as a source of resistant starch on blood glucose, satiety and food intake in young men. J. Food Sci. 2014, 79, 2550–2556. [Google Scholar] [CrossRef] [PubMed]
  49. Solah, V.A.; Brand-Miller, J.C.; Atkinson, F.S.; Gahler, R.J.; Kacinik, V.; Lyon, M.R.; Wood, S. Dose-response effect of a novel functional fibre, PolyglycopleX®, PGX®, on satiety. Appetite 2014, 77, 72–76. [Google Scholar] [CrossRef] [PubMed]
  50. Gacesa, P. Alginates. Carbohydr. Polym. 1988, 8, 161–182. [Google Scholar] [CrossRef]
  51. Aps, J.K.M.; Martens, L.C. Review: The physiology of saliva and transfer of drugs into saliva. Forensic Sci. Int. 2005, 150, 119–131. [Google Scholar] [CrossRef]
  52. Dickinson, E. Interfacial structure and stability of food emulsions as affected by protein-polysaccharide interactions. Soft Matter 2008, 4, 932–942. [Google Scholar] [CrossRef]
  53. Mattes, R.D.; Rothacker, D. Beverage viscosity is inversely related to postprandial hunger in humans. Physiol. Behav. 2001, 74, 551–557. [Google Scholar] [CrossRef]
  54. Yoon, S.J.; Chu, D.C.; Juneja, L.R. Chemical and physical properties, safety and application of partially hydrolyzed guar gum as dietary fiber. J. Clin. Biochem. Nutr. 2008, 42, 1–7. [Google Scholar] [CrossRef] [PubMed]
  55. Ellis, P.R.; Dawoud, F.M.; Morris, E.R. Blood glucose, plasma insulin and sensory responses to guar-containing wheat breads: Effects of molecular weight and particle size of guar gum. Br. J. Nutr. 1991, 66, 363–379. [Google Scholar] [CrossRef]
  56. Thakur, B.R.; Singh, R.K.; Handa, A.K. Chemistry and uses of pectin—A review. Crit. Rev. Food Sci. Nutr. 1997, 37, 47–73. [Google Scholar] [CrossRef]
  57. Vuksan, V.; Panahai, S.; Lyon, M.; Rogovik, A.L.; Leiter, L.A. Viscosity of fiber preloads affects food intake in adolescents. Nutr. Metab. Cardiovasc. Dis. 2009, 19, 498–503. [Google Scholar] [CrossRef]
  58. Ellis, P.R.; Morris, E.R. Importance of the rate of hydration of pharmaceutical preparations of guar gum; a new in vitro monitoring method. Diabet. Med. 1991, 8, 378–381. [Google Scholar] [CrossRef] [PubMed]
  59. Blackwood, A.D.; Salter, J.; Dettmar, P.W.; Chaplin, M.F. Dietary fibre, physicochemical properties and their relationship to health. J. R. Soc. Promot. Health 2000, 120, 242–247. [Google Scholar] [CrossRef] [PubMed]
  60. Slavin, J.L. Dietary fiber and body weight. Nutrition 2005, 21, 411–418. [Google Scholar] [CrossRef] [PubMed]
  61. European Food Safety Authority. Scientific Opinion on the substantiation of health claims related to beta-glucans from oats and barley and maintenance of normal blood LDL-cholesterol concentrations, increase in satiety leading to a reduction in energy intake. EFSA J. 2011, 9, 2207. [Google Scholar] [CrossRef]
  62. El Khoury, D.; Cuda, C.; Luhovyy, B.L.; Anderson, G.H. Beta glucan: Health benefits in obesity and metabolic syndrome. J. Nutr. Metab. 2011, 2012. [Google Scholar] [CrossRef] [PubMed]
  63. Amin, T.; Mercer, J.G. Hunger and satiety mechanisms and their potential exploitation in the regulation of food intake. Curr. Obes. Rep. 2016, 5, 106–112. [Google Scholar] [CrossRef]
  64. Rolls, B.J. The relationship between dietary energy density and energy intake. Physiol. Behav. 2009, 97, 609–615. [Google Scholar] [CrossRef] [Green Version]
  65. Lazaridou, A.; Biliaderi, C.G.; Izydorczyk, M.S. Cereal beta-glucans: Structures, physical properties, and physiological functions. In Function Food Carbohydrates; CRC Press: Boca Raton, FL, USA, 2007; pp. 1–72. ISBN 9780849318221. [Google Scholar]
  66. Beer, M.U.; Wood, P.J.; Weisz, J. Molecular weight distribution and (1-3)(1-4)-β-glucan content of consecutive extracts of various oat and barley cultivars. Cereal Chem. J. 1997, 74, 479–480. [Google Scholar] [CrossRef]
  67. Kirkmeyer, S.V.; Mattes, R.D. Effects of food attributes on hunger and food intake. Int. J. Obes. Relat. Metab. Disord. 2000, 24, 1167–1175. [Google Scholar] [CrossRef] [Green Version]
  68. De Graaf, C.; Blom, W.A.; Smeets, P.A.; Stafleu, A.; Hendriks, H.F. Biomarkers of satiation and satiety. Am. J. Clin. Nutr. 2004, 79, 946–961. [Google Scholar] [CrossRef] [Green Version]
  69. Lyly, M.; Liukkonen, K.-H.; Salmenkallio-Marttila, M.; Karhunen, L.; Poutanen, K.; Lähteenmäki, L. Fibre in beverages can enhance perceived satiety. Eur. J. Nutr. 2009, 48, 251–258. [Google Scholar] [CrossRef] [PubMed]
  70. Coppari, R.; Elmquist, J.K. Neuroendocrine control of energy balance (Central Circuits/Mechanisms). In Encyclopedia of Neuroscience; Elsevier Ltd.: Amsterdam, The Netherlands, 2010; pp. 327–332. ISBN 9780080450469. [Google Scholar]
  71. Lee, J.; Lee, J.; Shin, H.; Kim, K.S.; Lee, E.; Koh, B.; Jang, H.J. Suggestion of new possibilities in approaching individual variability in appetite through constitutional typology: A pilot study. BMC Complement. Altern. Med. 2012, 12, 122. [Google Scholar] [CrossRef] [PubMed]
  72. Chen, F.; Yu, Y.; Wang, P.; Dong, Y.; Wang, T.; Zuo, X.; Li, Y. Brain-derived neurotrophic factor accelerates gut motility in slow-transit constipation. Acta Physiol. 2014, 212, 226–238. [Google Scholar] [CrossRef] [PubMed]
  73. Howarth, N.C.; Saltzman, E.; Roberts, S.B. Dietary fiber and weight regulation. Nutr. Rev. 2001, 59, 129–139. [Google Scholar] [CrossRef] [PubMed]
  74. Burley, V.J.; Paul, A.W.; Blundell, J.E. Influence of a high-fibre food (myco-protein) on appetite: Effects on satiation (within meals) and satiety (following meals). Eur. J. Clin. Nutr. 1993, 47, 409–418. [Google Scholar] [PubMed]
  75. Raninen, K.; Lappi, J.; Mykkänen, H.; Poutanen, K. Dietary fiber type reflects physiological functionality: Comparison of grain fiber, inulin and polydextrose. Nutr. Rev. 2011, 69, 9–21. [Google Scholar] [CrossRef] [PubMed]
  76. Achour, L.; Flourié, B.; Briet, F.; Pellier, P.; Marteau, P.; Rambaud, J.C. Gastrointestinal effects and energy value of polydextrose in healthy nonobese men. Am. J. Clin. Nutr. 1994, 59, 1362–1368. [Google Scholar] [CrossRef] [PubMed]
  77. Figdor, S.K.; Bianchine, J.R. Caloric utilization and disposition of (14C) polydextrose in man. J. Agric. Food Chem. 1983, 31, 389–393. [Google Scholar] [CrossRef]
  78. Flood, M.T.; Auerbach, M.H.; Craig, S.A.S. A review of the clinical toleration studies of polydextrose in food. Food Chem. Toxicol. 2004, 42, 1531–1542. [Google Scholar] [CrossRef]
  79. Jie, Z.; Bang-Yao, L.; Ming-jie, X.; Hai-wei, L.; Zu-kang, Z.; Ting-song, W.; Craig, S.A. Studies on the effects of polydextrose intake on physiologic functions in Chinese people. Am. J. Clin. Nutr. 2000, 72, 1503–1509. [Google Scholar] [CrossRef] [Green Version]
  80. Holt, S.; Heading, R.C.; Carter, D.C.; Prescott, L.F.; Tothill, P. Effect of gel fibre on gastric emptying and absorption of glucose and paracetamol. Lancet 1979, 1, 636–639. [Google Scholar] [CrossRef]
  81. Powley, T.L.; Phillips, R.J. Gastric satiation is volumetric, intestinal satiation is nutritive. Physiol. Behav. 2004, 82, 69–74. [Google Scholar] [CrossRef] [PubMed]
  82. Nauck, M.A.; Niedereichholz, U.; Ettler, R.; Holst, J.J.; Orskov, C.; Ritsel, R.; Schmiegel, W.H. Glucagon-like-peptide 1 inhibition of gastric emptying outweighs its insulinotropic effects in healthy humans. Am. J. Physiol. 1997, 273, E981–E988. [Google Scholar] [CrossRef] [PubMed]
  83. Näslund, E.; Gutniak, M.; Skogar, S.; Rössner, S.; Hellström, P.M. Glucagon-like-peptide 1 increases the period of postprandial satiety and slows gastric emptying in obese men. Am. J. Clin. Nutr. 1998, 68, 525–530. [Google Scholar] [CrossRef] [PubMed]
Figure 1. PRISMA flow chart of search strategy.
Foods 08 00015 g001
Figure 2. Outcome measure for each fibre: Energy intake (blue circle) = 24; Satiety (red circle) = 12; Gastric emptying time (yellow circle) = 11; Appetite hormone (green circle) = 7; Foods 08 00015 i001Alginate Foods 08 00015 i002Pectin Foods 08 00015 i003Arabinoxylan Foods 08 00015 i004Polydextrose Foods 08 00015 i005Guar gum Foods 08 00015 i006β-Glucan Foods 08 00015 i007High amylose maize Foods 08 00015 i008Polydextrose.
Foods 08 00015 g002
Figure 3. Effects of alginate on energy intake reduction (random effects model). The axis lines on ±0.2, ±0.5 and ±0.8 represent small, medium and large effect sizes, respectively. A negative value of summary effect size suggests that the alginate supplementation decreases energy intake compared with control. ▲: 9 g alginate; ■: 6 g alginate.
Foods 08 00015 g003
Figure 4. Effects of guar gum on energy intake reduction (random effects model). The axis lines on ±0.2, ±0.5 and ±0.8 represent small, medium and large effect sizes respectively. A negative value of summary effect size suggests that the guar gum supplementation decreases energy intake compared to control. *2 g of partially hydrolysed guar gum (PHGG); ●: 5.6 g of guar gum; ▲: 6.9 g of guar gum.
Foods 08 00015 g004
Figure 5. Effects of β-glucan on energy intake reduction (fixed effects model). The axis lines on ±0.2, ±0.5 and ±0.8 represent small, medium and large effect sizes, respectively. A negative value of summary effect size suggests that β-glucan supplementation decreases energy intake compared with control. d = effect size; CI = confidence interval.
Foods 08 00015 g005
Figure 6. Effects of pectin on energy intake reduction (fixed effects model). The axis lines on ±0.2, ±0.5 and ±0.8 represent small, medium and large effect sizes respectively. A negative value of summary effect size suggests that pectin supplementation decreases energy intake compared to control. d = effect size; CI = confidence interval. ▲: bulking; ■: gelled; ●: viscous.
Foods 08 00015 g006
Figure 7. Effects of polydextrose on energy intake reduction (fixed effects model). The axis lines on ±0.2, ±0.5 and ±0.8 represents small, medium and large effect sizes respectively. A negative value of summary effect size suggests that polydextrose supplementation decreases energy intake compared to control. d = effect size; CI = confidence interval; LP = low protein; HP = high protein.
Foods 08 00015 g007
Table 1. Summary of randomized-controlled trials (RCTs) included in systematic review (n = 15).
StudyFibre typeDoseStudy OverviewAppetite Hormone (Mean (SD)) (pmol·min/L)Gastric Emptying Rate (min)Energy Intake (kcal)Perceived Satiety (Mean (SD)) (mm)
Arshad et al., 2016 [35]Alginate5 gSubjects: 30 (F: 18–30 y)
Study design: randomised, single blinded
Washout: 1-week
Energy intake interval: 120 min
Satiety: 170 min
Food matrix: liquid (milk served chilled and iso-volumetric (250 mL)
Control: milk (250 mL) without fibre
Data not availableData not available611.76 (35.01)
(p < 0.001)
Effect size = −0.81
76.36 (1.82)
(p < 0.05)
Effect size = −0.90
Guar gum5 gData not availableData not available551.71 (23.52)
(p < 0.001)
Effect size = −3.55
61.81 (1.82)
(p < 0.05)
Effect size = −3.93
Wanders et al., 2013 [36]Alginate
(MW: 60–1000 kDA)
(i) 6 g
(ii) 9 g
Study 1 (energy intake):
Subjects: 121 (45M/76F: 18–50 y)
Study design: randomised, single blinded
Washout: 2-day
Energy intake interval: 105 min
Food matrix: solid (400 g chocolate cookies with 500 mL of water)
Control: chocolate cookies without fibre
Study 2 (gastric emptying):
Subjects: 10 (4F/ 6M: 18–50 y)
Study design: randomised, single blinded
Washout: 7-day
Gastric emptying rate: every 15 min and up to 240 min
Food matrix: solid (400 g chocolate cookies with 500 mL of water)
Control: chocolate cookies without fibre
Data not availableStudy 2:
AUC, 13C breath used
(i) 2126 (p < 0.05)
(ii) 2145 (p < 0.01)
No SD available to calculate effect size
Study 1:
(i) 943.44 (406.04)
(p = 0.77)
Effect size = −0.04
(ii) 702.68 (429.92)
(p < 0.001)
Effect size = −0.52
Data not available
Guar gum
(MW: 17–710 kDA)
(i) 5.6 g
(ii) 6.9 g
Data not availableStudy 2:
AUC, 13C breath used
(i) 1918
(p > 0.05)
(ii) 1864
(p > 0.05)
No SD available to calculate effect size
Study 1:
(i) 931.50 (501.58)
(p = 0.63)
Effect size = −0.07
(ii) 979.27 (525.46)
(p = 0.66)
Effect size = 0.06
Data not available
Rao et al., 2015 [37]Partially hydrolsed guar gum (PHGG)Study 1:
2 g PHGG
Study 1 (breakfast, liquid yogurt):
Subjects: 24 (12M/ 12F)
Study design: randomised, double blinded
Washout: 2-weeks
Energy intake interval: 180 min
Satiety: 240 min
Food matrix: liquid (yogurt, 125 g)
Control: Energy Intake: yogurt with dextrin
Satiety: yogurt without fibre
Study 2 (lunch, solid rice):
Subjects: 6 (4M/ 2F)
Study design: randomised, single blinded
Washout: 2-days
Satiety: 300 min
Food matrix: solid (cooked rice)
Control: cooked rice without fibre addition
Data not availableData not availableStudy 1:
731.60 (162.76)
(p = 0.17)
Effect size = −0.41
Study 1 (breakfast, 2 g):
14.9 (15.19)
(p < 0.05)
Effect size = 0.46
Study 2:
6 g PHGG
Data not availableData not availableData not availableStudy 2 (lunch, 6 g):
22.8 (10.78) (p > 0.05)
Effect size = 1.29
Aoe et al., 2014 [38]β-Glucan2.9 gSubjects: 21 (F: 30–49 y)
Study design: randomised, not-blinded
Washout: 7-days
Energy intake interval: 240 min
Food matrix: solid (cooked white rice)
Control: cooked white rice without fibre
Data not availableData not available783.94 (147.47)
(p = 0.28)
Effect size = −0.34
Data not available to calculate effect size
Lumagaet al., 2012 [39]β-Glucan (viscosity = 55 mPas)3 gSubjects: 14 (8M/ 4F:24–39 y)
Study design: randomised, single blind
Washout: 7-day
Measurement of gut hormones: 180 min
Energy intake interval: 180 min
Satiety: 180 min
Food matrix: liquid (250 mL beverages with isocaloric breakfast)
Control: beverages without fibre
AUC: (pg·min/mL)
(i) GLP-1: 1312.5 (467.71) (p > 0.05)
Effect size = 0.18
PYY: 13125 (2806.24)
(p > 0.05)
Effect size = 0.13
GIP: 7000 (9354.14) (p > 0.05)
Effect size = −0.11
Data not available767.5 (246.2) (p = 0.13)
Effect size = −0.59
AUC (mm·min)
5400 (748.33) (p < 0.05)
Effect size = 1.65
Pectin
(viscosity = 90 mPas)
2.5 gAUC: (pg·min/mL)
(ii) GLP-1: 1125(62.5) (p > 0.05)
Effect size = −0.18
PYY: 135,00 (5612.99) (p > 0.05)
Effect size = 0.17
GIP: 6000 (3741.66) (p> 0.05)
Effect size = −0.28
Data not available871.2 (296.71)
(p = 0.59)
Effect size = −0.20
AUC (mm·min)
6000 (1122.5) (p < 0.05)
Effect size = 1.94
Wanders et al., 2014 [40]Pectin
(different fibre forms)
10 g
(i) bulking (25 kDa)
Subjects: 29 M (18–30 y)
Study design: randomised, single blinded
Washout: 12-days
Gastric emptying rate: 180 min
Energy intake interval: 180 min
Food matrix: dairy based liquid 150 mL
Control:
Different fibre formfor EI and GER: dairy based liquid without fibre
Different supplementation methods: Gelled pectin in the form of capsule or liquid
Data not available13C recovery
(i) 74.0 (20.4) min
(p < 0.05)
Effect size = 0.19
(i)1058.09 (341.55)
(p = 0.44)
Effect size = −0.21
(bulking)
Data not available
10 g
(ii) viscous (80 kDa)
Data not available13C recovery
(ii) 75.5 (21.0) min
(p < 0.05)
Effect size = 0.2
(ii) 1058.091 (272.28)
(p = 0.38)
Effect size = −0.23 (viscous)
Data not available
10g
(iii) gelled (15 kDa)
Data not available13C recovery
(iii) 82.2 (17.8) min (p < 0.05)
Effect size = 0.65
(iii) 1024.65 (238.85)
(p = 0.17)
Effect size = −0.36 (gelled)
Data not available
Different method supplementation (gelled pectin)10g
(iv) capsule (15 kDa)
Data not available13C recovery
(iv) 64.1 (21.9)
(p < 0.05)
Effect size = −0.91
(iv) 955.38 (308.11)
(p = 0.03)
Effect size = −0.42
(capsule vs. liquid)
Data not available
10g
(v) liquid (15 kDa)
Data not available13C recovery
(v) 98.3 (21.1)
(p < 0.05)
Effect size = 0.82
Data not available
Martinelli et al., 2017 [41]Polydextrose6 gSubjects: 25 (19F/ 6M:18–50 y)
Study design: randomised, single blinded
Washout: 7-days
Energy intake interval: 240 min
Satiety: 30 to 240 min
Food matrix: composite meal (100 g pudding with 200 mL semi-skimmed milk)
Control: Pudding without fibre
Data not availableData not available1021.27 (356.60)
(p = 0.53)
Effect size = −0.18
iAUC (mm·min)
5166.67 (666.67)
(p = 0.934)
Effect size = −0.27
Astbury et al., 2013 [42]Polydextrose(i) 6.3 gSubjects: 21 (12M/ 9F)
Study design: randomised, single blinded
Washout: 1-week
Energy intake interval: 90 min
Food matrix: liquid (chocolate-flavoured liquid, 400 mL)
Control: chocolate-flavoured liquid, 400 mL without fibre
Data not availableData not available(i) 1206.5 (420.58)
(p = 0.22)
Effect size = −0.38
Data not available
(ii) 12.5 gData not availableData not available(ii) 1128.59 (421.58)
(p = 0.08)
Effect size = −0.56
Data not available
(iii) 25 gData not availableData not available(iii) 1042.54 (346.10)
(p = 0.01)
Effect size = −0.81
Data not available
Soong et al., 2016 [43]Polydextrose12 g
(i) low protein
Subjects: 27 (M: 21–40 y)
Study design: randomised, single blind
Washout: 5-day
GLP-1 hormone: 90 min
Gastric emptying rate: 90 min
Energy intake interval: 180 min
Satiety: 75 min
Food matrix: solid (soya bean curd)
Control: soya bean curd without fibre
GLP-1: (n=15)
(i) 338.97 (484.63)
(p < 0.05)
Effect size = 0.18
(i) 0.26 (0.14) min
(p = 0.05)
Effect size = −0.47
(i) 790.71 (231.73)
(p = 0.13)
Effect size= −0.42
iAUC (mm·min)
(i) 1892.44 (1570.33)
(p > 0.05)
Effect size = −0.05
12 g
(ii) high protein
GLP-1: (n=15)
(ii) 625.59 (776.77)
(p < 0.05)
Effect size = 0.60
(ii) 0.18 (0.17) min
(p < 0.05)
Effect size = −0.72
(ii) 774.21 (242.86)
(p = 0.08)
Effect size=−0.48
iAUC (mm·min)
(ii) 1809.11 (1402.49)
(p > 0.05)
Effect size = −0.11
Hull, et al., 2012 [44]Polydextrose(i) 6.25 gSubjects: 34 (10M/ 24F)
Study design: randomized, crossover, single blind
Washout: 1-week
Energy intake interval: 90 min
Food matrix: liquid (drinking yogurt)
Control: drinking yogurt with glucose syrup
Data not availableData not available(i) 731.36 (228.56)
(p = 0.61)
Effect size = −0.14
Data not available to calculate effect size
(ii) 12.5 gData not availableData not available(ii) 711.52 (263.40)
(p = 0.44)
Effect size = −0.21
Data not available to calculate effect size
Juvonenet al., 2009 [45]β-Glucan(i) High viscosity (10 g) (>3000 mPas)Subjects: 20 (16F/ 4M)
Study design: randomized, single blinded
Washout: > 2-days
Measurement of gut hormones: 180 min
Gastric emptying rate: 90 min
Energy intake interval:180 min
Food matrix: liquid (300mL isoenergy and isovolumetric beverage with 200mL water
*Low viscosity acts as control
GLP-1 (AUC): (pg·min/mL)
(i) 74 (89.44)
(ii) 189 (214.66)
(p = 0.030)
Effect size = −0.70
PYY (AUC):
(i) 129 (720.01)
(ii) 668 (822.87)
(p = 0.038)
Effect size = −0.70
CCK (AUC): n=17
(i) 250 (181.42)
(ii) 449 (300.99)
(p = 0.006)
Effect size = −1.78
Paracetamol
AUC (*n = 10)
(i) 14670 (3443.55) (μmol·min/L)
(ii) 16340 (5567.81) (μmol·min/L)
(p = 0.051)
Effect size = −0.36
Combined
(preload + rest of the day)
(i) 1733 (113.05)
(ii) 2007.89 (154.16)
(p = 0.026)
Effect size = −2.03
Data not available
(ii) Low viscosity (10 g) (<250
mPas)
*Differed only in viscosity
Boll et al., 2015 [46] (i) AXOS, 8.9 gSubjects: 19 (9M/ 10F: 20–35 y)
Study design: randomised, not blinded
Washout: 1-week
GLP-1: acute (180 min)
Food matrix: solid (white wheat bread with 250–300 mL water)
Control: white wheat bread without fibre
GLP-1:
(i) 1.01 (0.92)
(p > 0.05)
Effect size = 0.10
Data not availableData not availableData not available
(ii) hiAXOS, 18.4 gGLP-1:
(ii) 1.04 (0.92)
(p > 0.05)
Effect size = 0.19
Data not availableData not availableData not available
Thazhath et al., 2014 [47]Guar gum
MW: 220 kDa
9 gSubjects: 12 (6M/ 6F)
Study design: randomized, crossover, not blinded
Washout: 5-day
Gastric emptying rate: every 5 min for 1st hour and every 15 min for further 3 h (240 min)
Food matrix: semisolid (mashed potato, 300 mL)
Control: semisolid mashed potato 300 mL without fibre
Data not available13C2 breath used
285 (93.53)
(p < 0.05)
Effect size = 1.02
Data not availableData not available
Luhovyy et al., 2014 [48]High-amylose maize(i) 17.5 gSubjects: 30M (18–30 y)
Study design: randomized, crossover, single blinded
Washout: 1-week
Energy intake interval: 120 min
Food matrix: solid (cookies)
Control: cookies without fibre
Data not availableData not available(i) 1163.9 (279.34)
(p = 0.99)
Effect size = 0.00
Data not available
(ii) 31.5 gData not availableData not available(ii) 1147.5 (310.56)
(p = 0.83)
effect size = −0.05
Data not available
Solah et al., 2014 [48]PolyGlycopleX (PGX®)(i) 2.5 gSubjects: 10 (20–29 y)
Study design: randomised, single blind
Washout: 2 or 3 days
Satiety: 120 min
Food matrix: liquid (water, 2 × 250 mL)
Control: inulin in 500 mL water
Data not availableData not availableData not availableiAUC (mm·min)
(i) 3501 (2070) (p < 0.05)
Effect size = 0.56
(ii) 5 gData not availableData not availableData not available(ii) 2937 (1750) mm·min (p > 0.05)
Effect size = 0.32
(iii) 7.5 gData not availableData not availableData not available(iii)3942 (2250) mm·min (p < 0.05)
Effect size = 0.74
iAUC, incremental area under curve; AUC, area under curve; SD, standard deviation; EI, energy intake; GER, gastric emptying rate; CCK, cholescytokinin; GLP-1, glucagon-like peptide 1; GIP, gastric inhibitory polypeptide; PYY, peptide YY.
Table 2. Jadad scores of RCTs (n = 17).
Studies RandomisationDouble-BlindingWithdrawals and Drop-OutsScore
Arshad et al., 2016 [35] 1012
Wanders et al., 2013 [36]Study 11012
Study 21012
Rao et al., 2015 [37] *Study 11113
Study 21012
Aoe et al., 2014 [38] 1012
Lumaga et al., 2012 [39] 1012
Wanders et al., 2014 [40] 2013
Martinelli et al., 2017 [41] 1012
Astbury et al., 2013 [42] 2013
Soong et al., 2016 [43] 2013
Hull, et al., 2012 [44] 1012
Juvonen et al., 2009 [45] 1012
Boll et al., 2015 [46] 1012
Thazhath et al., 2014 [47] 1012
Luhovyy et al., 2014 [48] 1012
Solah et al., 2014 [48] 2013
* only study 1 was double-blinded.

