Safety of Yam-Derived (Dioscorea rotundata) Foodstuffs—Chips, Flakes and Flour: Effect of Processing and Post-Processing Conditions

 , ,
, , 
Abstract
:1. Introduction
- To assess whether possible contamination (bacterial and fungal, presence of aflatoxin, heavy metals, and pesticides) takes place during the processing or the post-processing stages;
- To determine if different food items presented different kinds or levels of contamination.
2. Materials and Methods
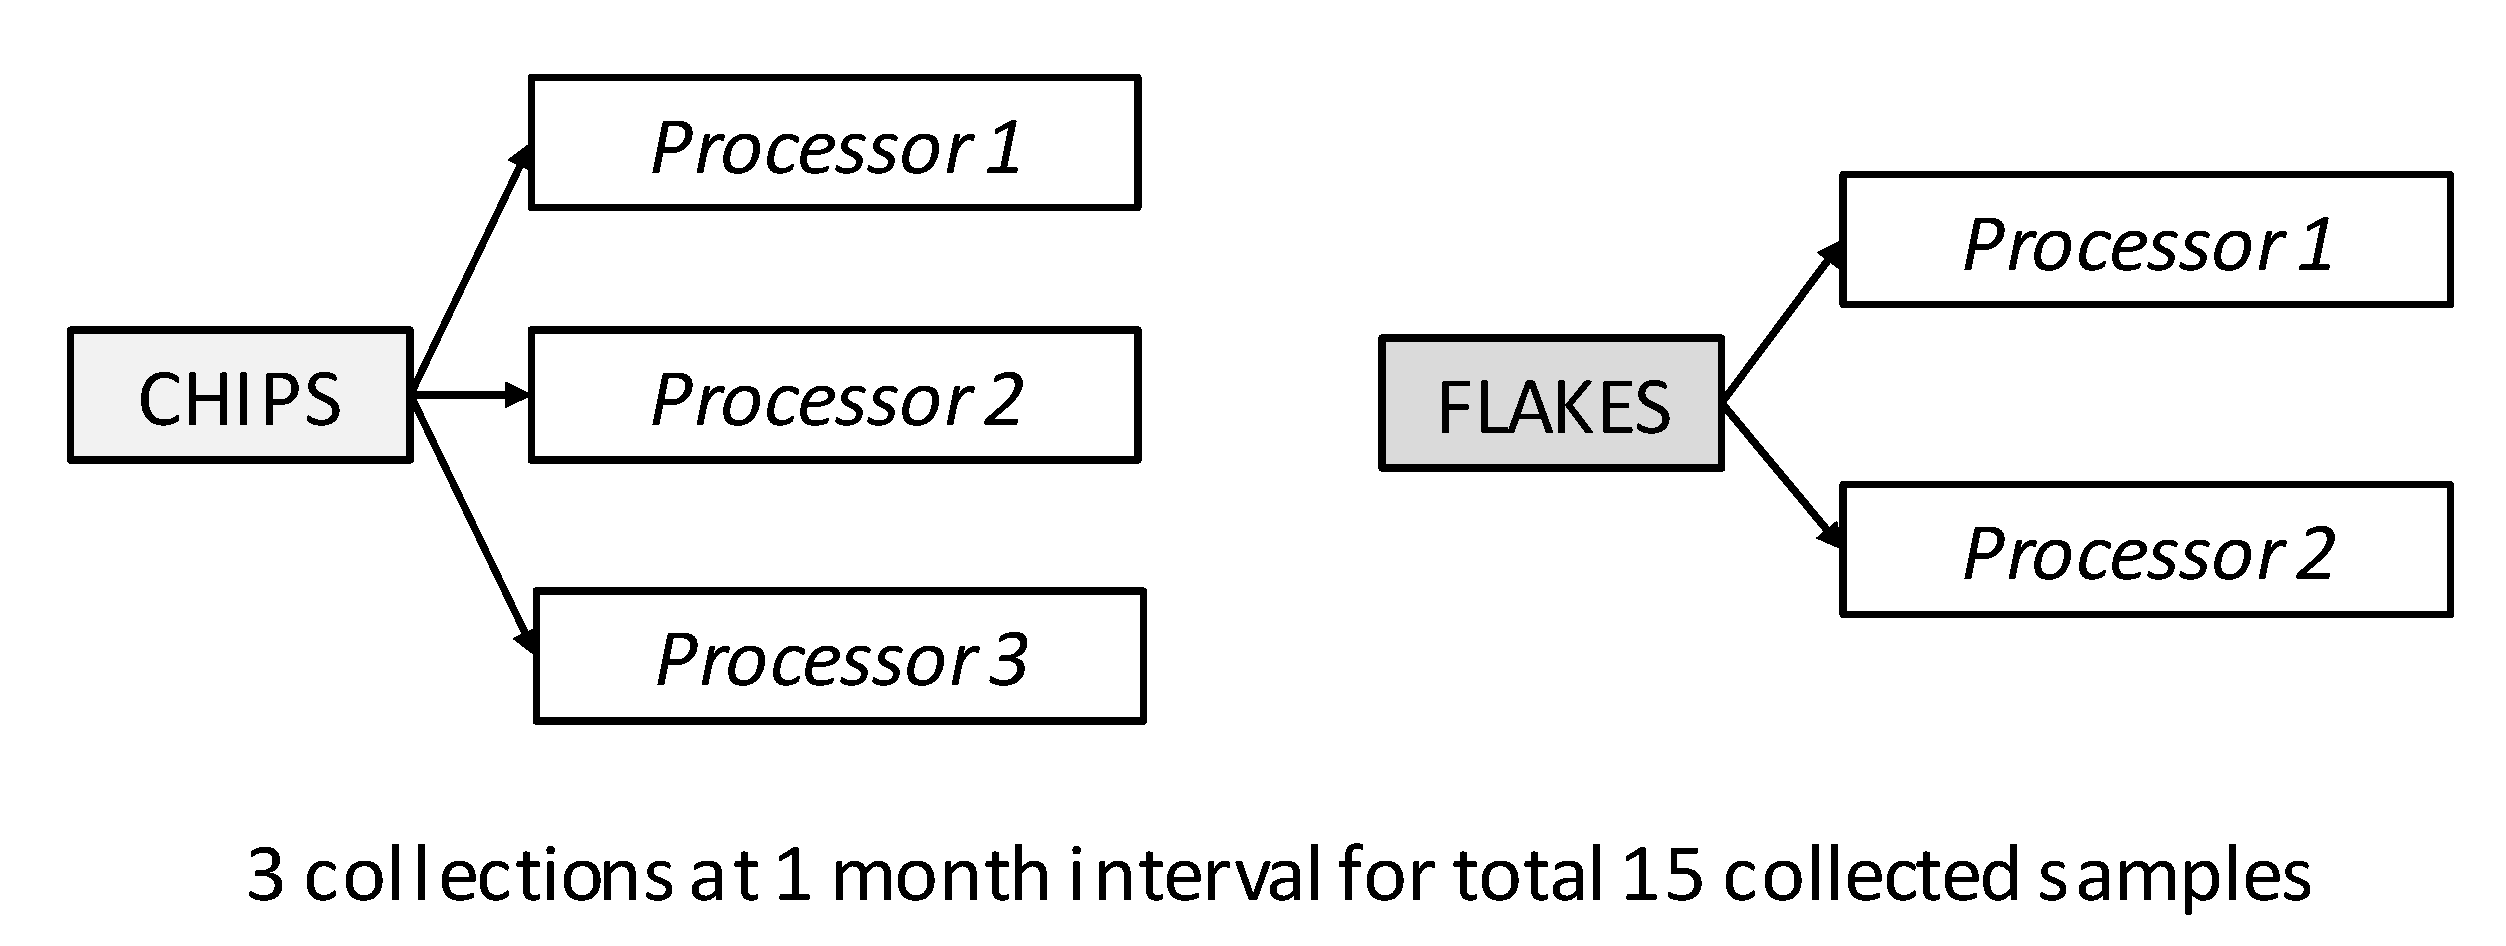
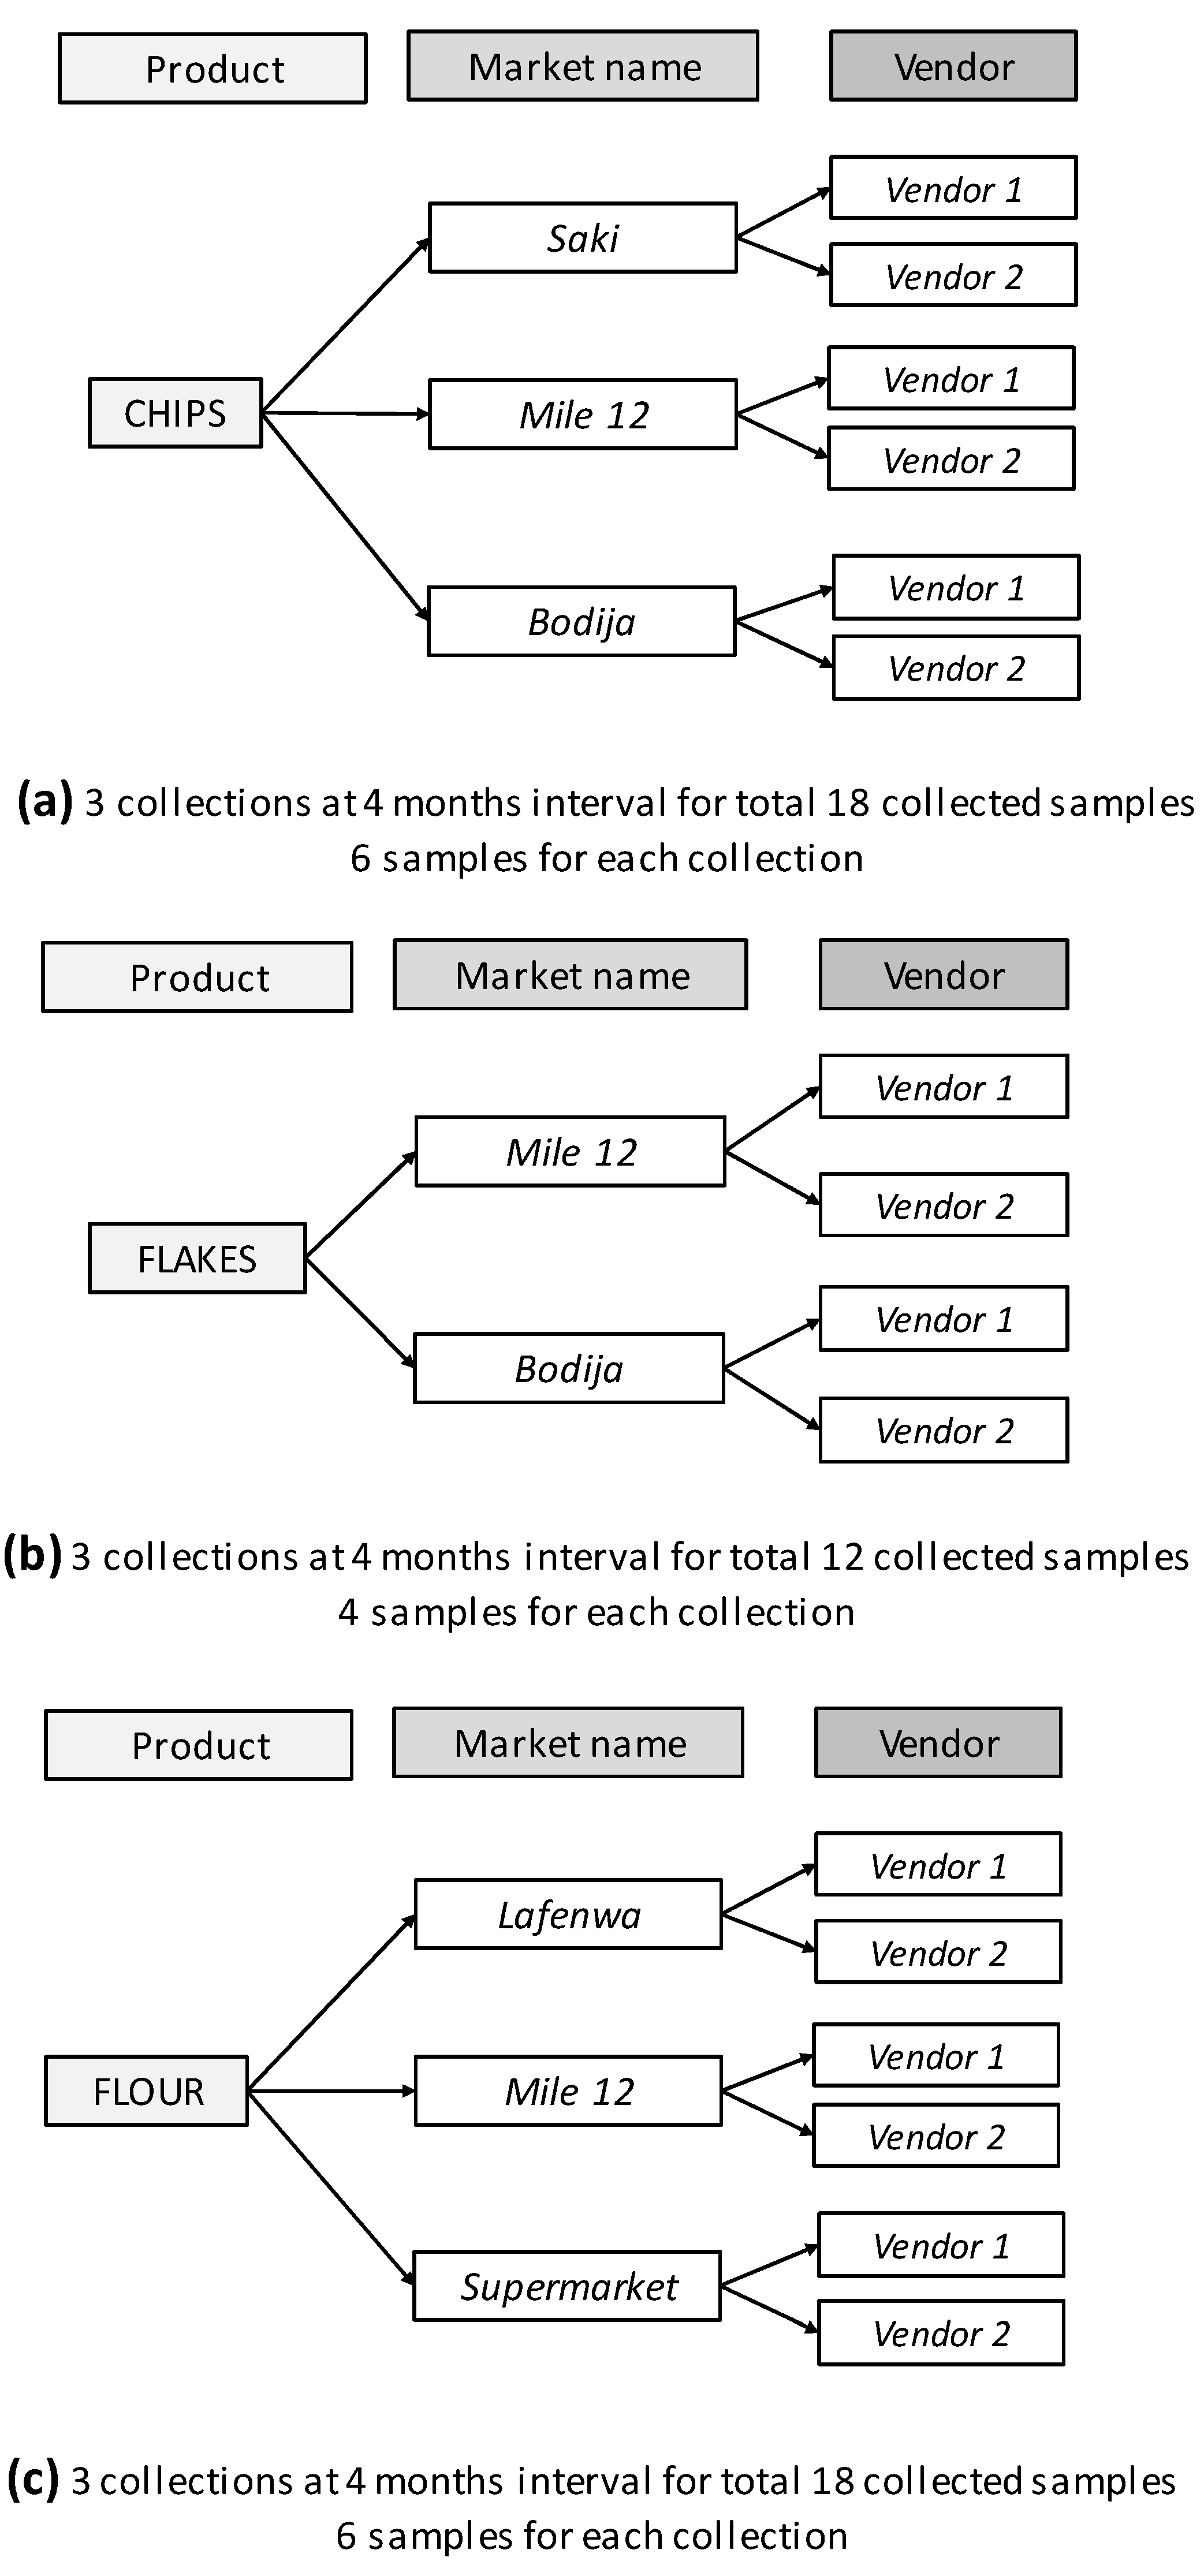
2.1. Sample Collection and Preparation
2.2. Moisture Content Determination
2.3. Microbiological Analysis
2.3.1. Isolation and Enumeration of Microorganisms
2.3.2. Characterization of Mold Isolates
2.3.3. Aflatoxin Determination
2.4. Heavy Metals Analysis
2.5. Pesticide Residue Analysis
2.6. Statistical Analysis
3. Results and Discussion
3.1. Sample Moisture Content
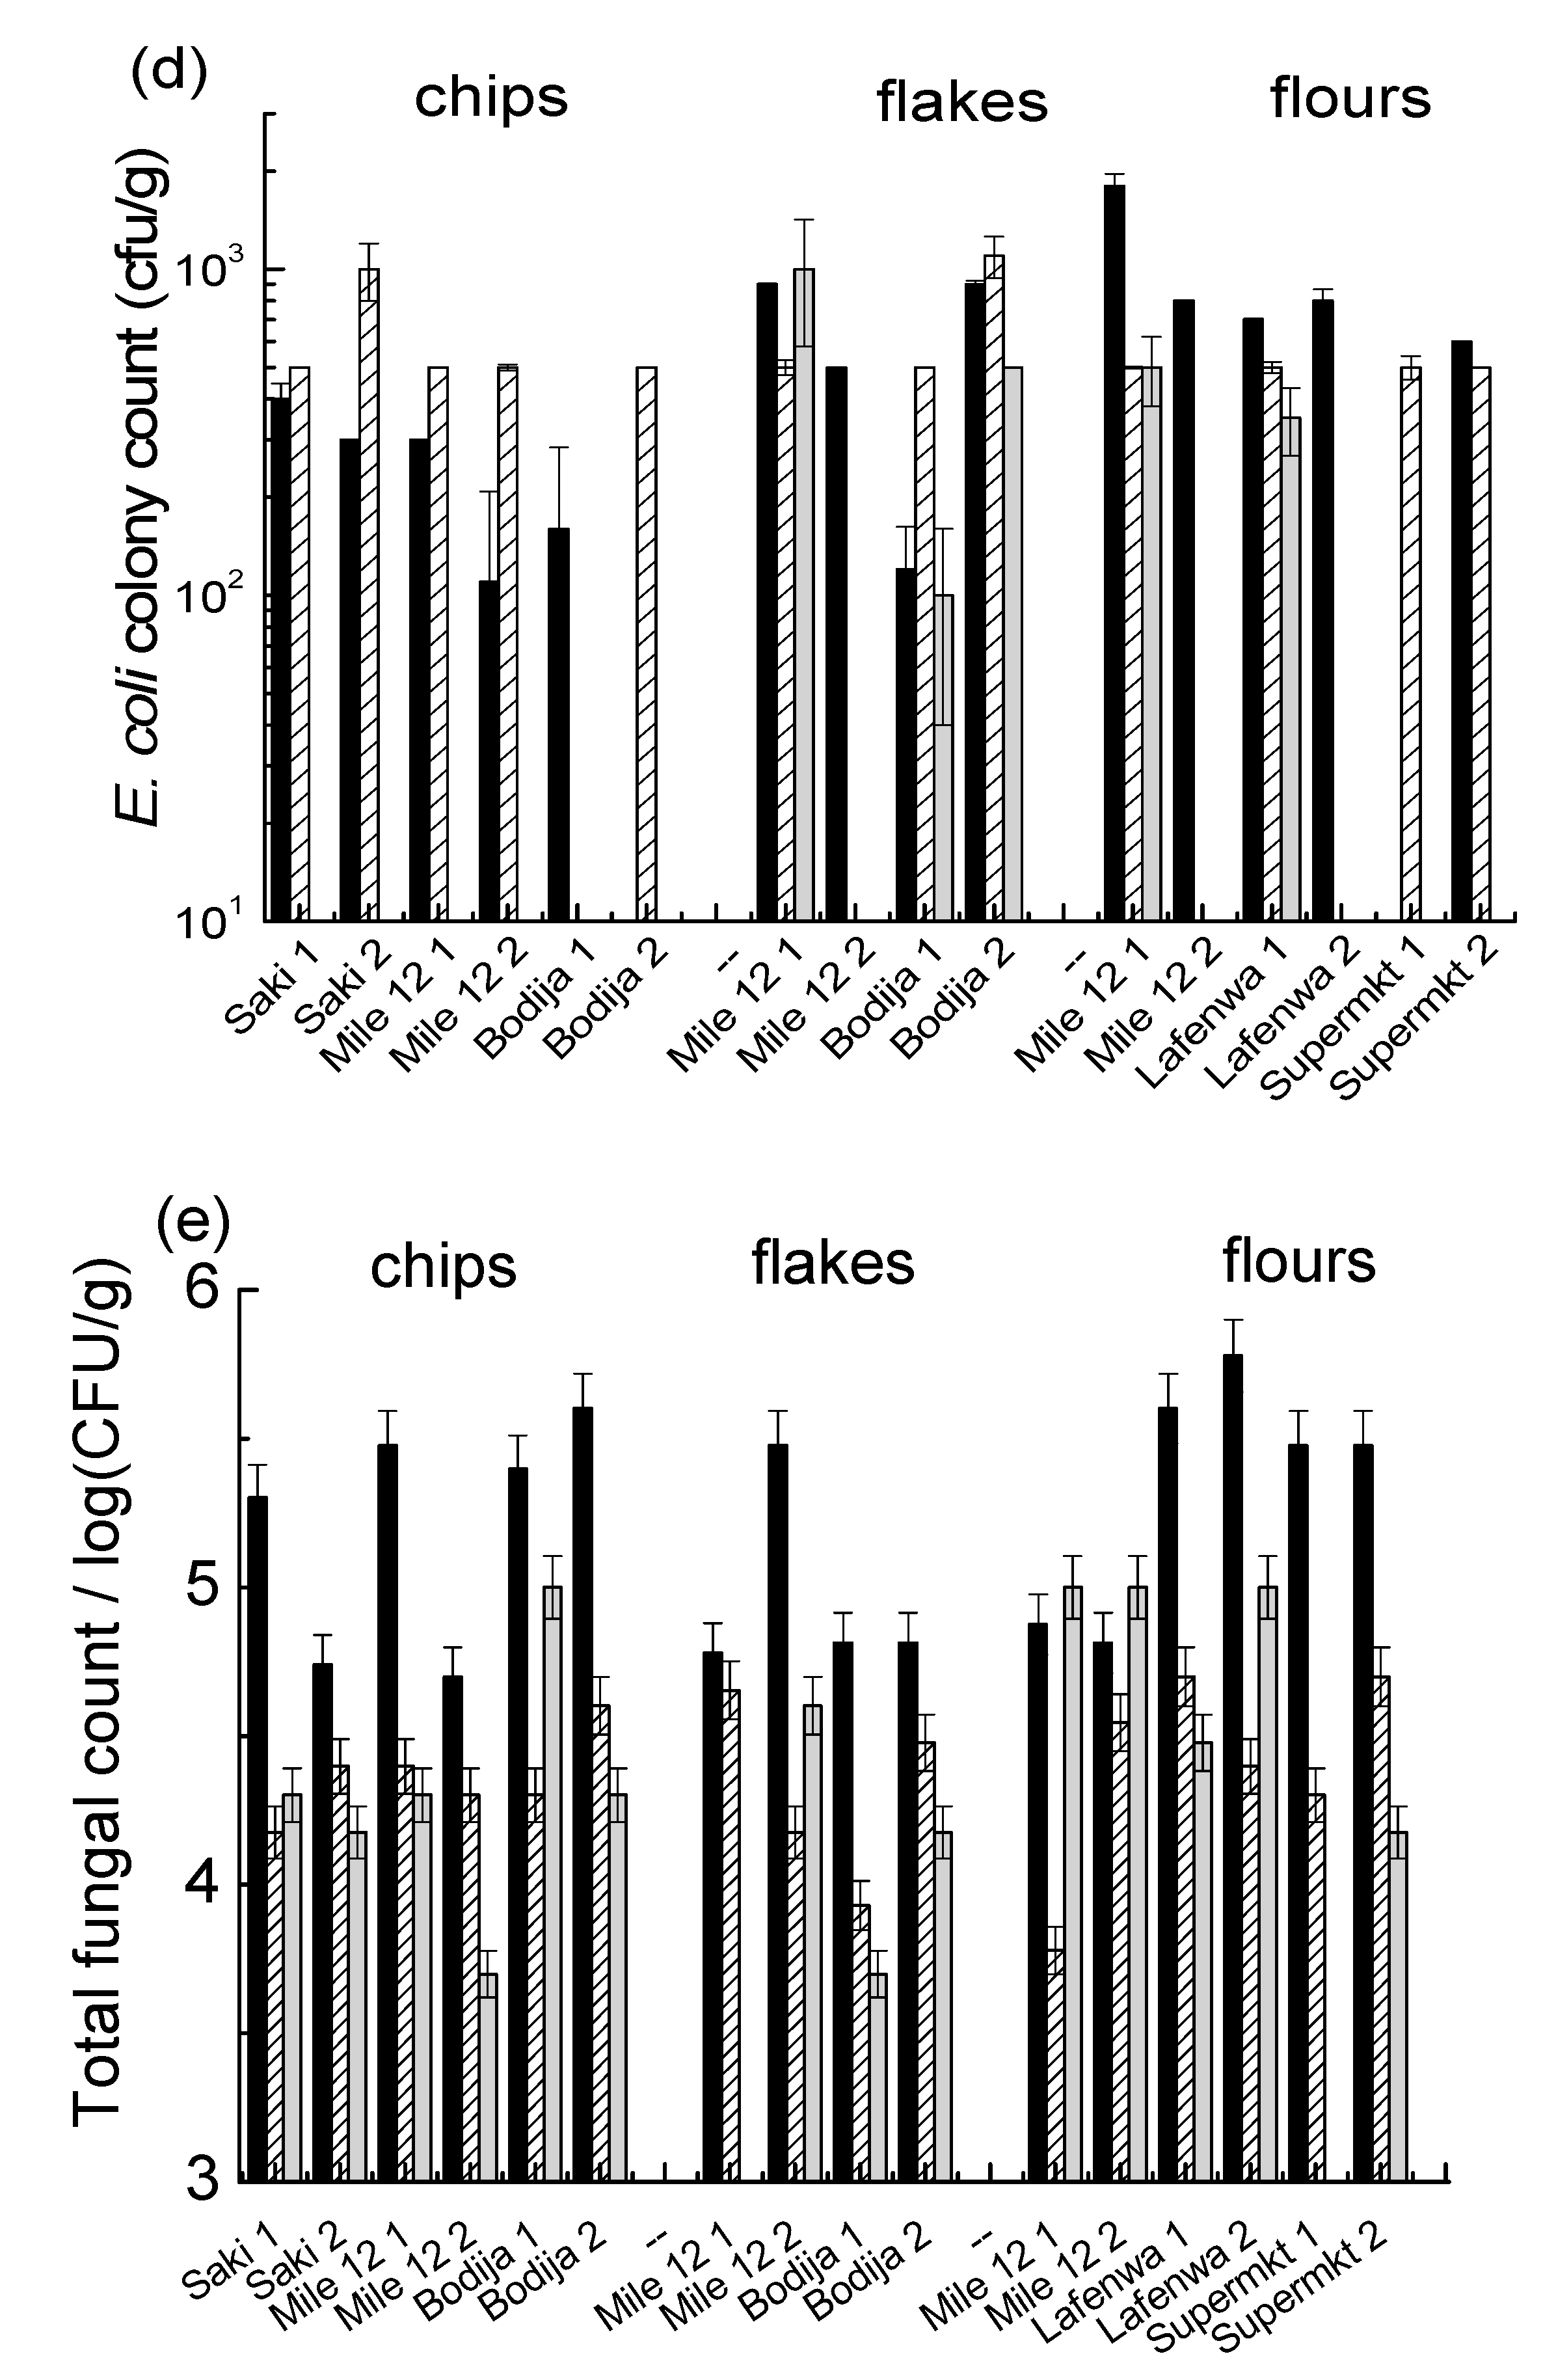
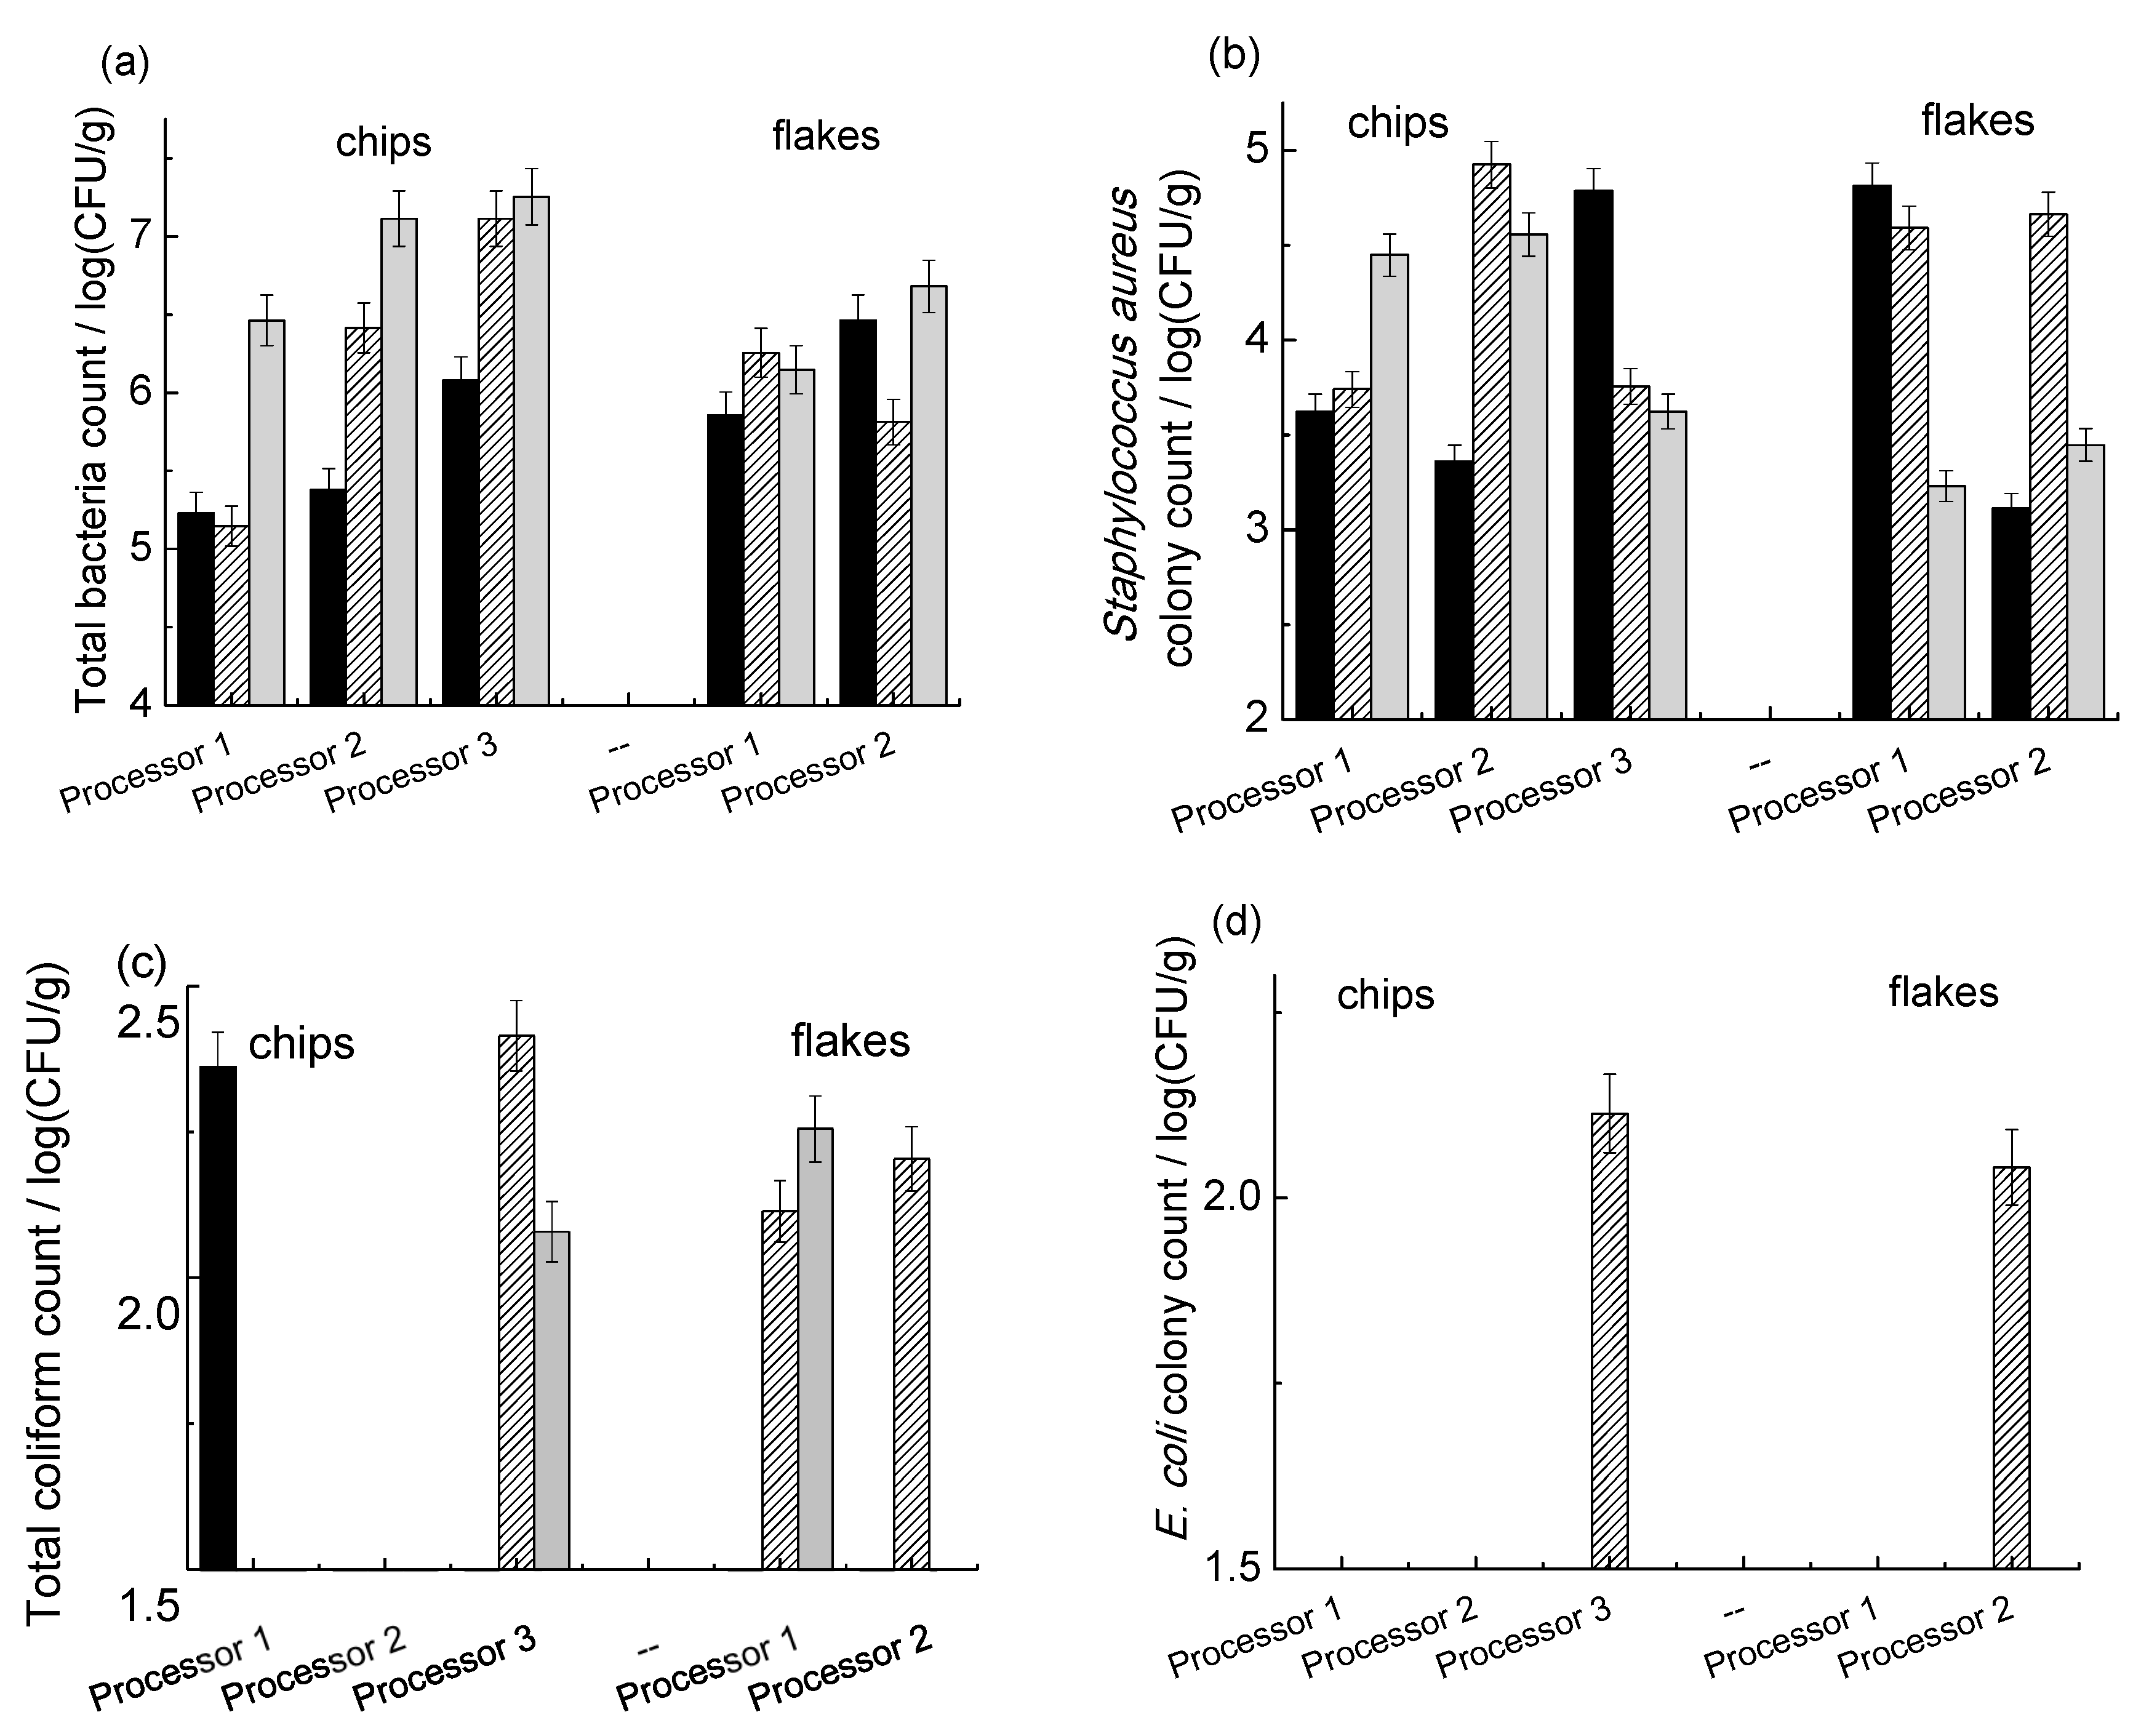
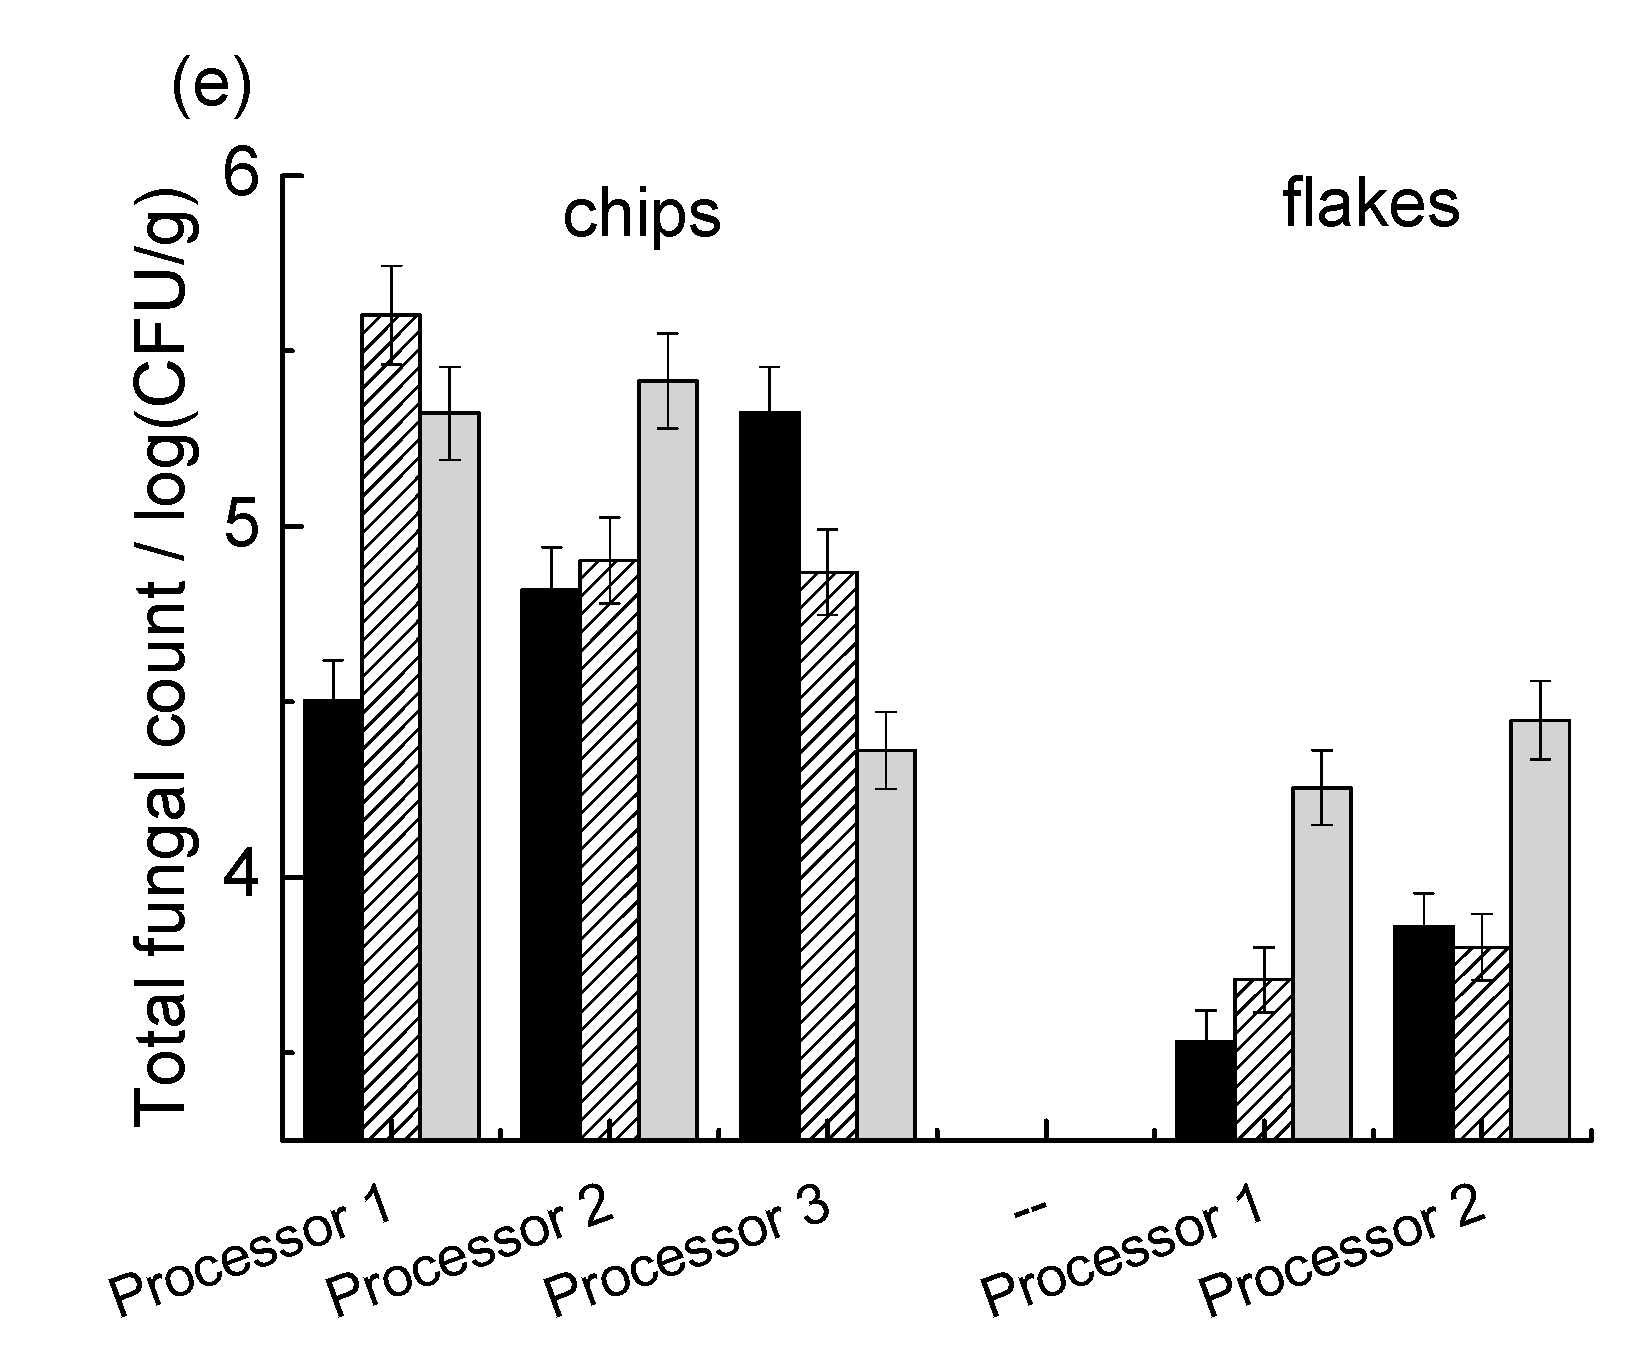
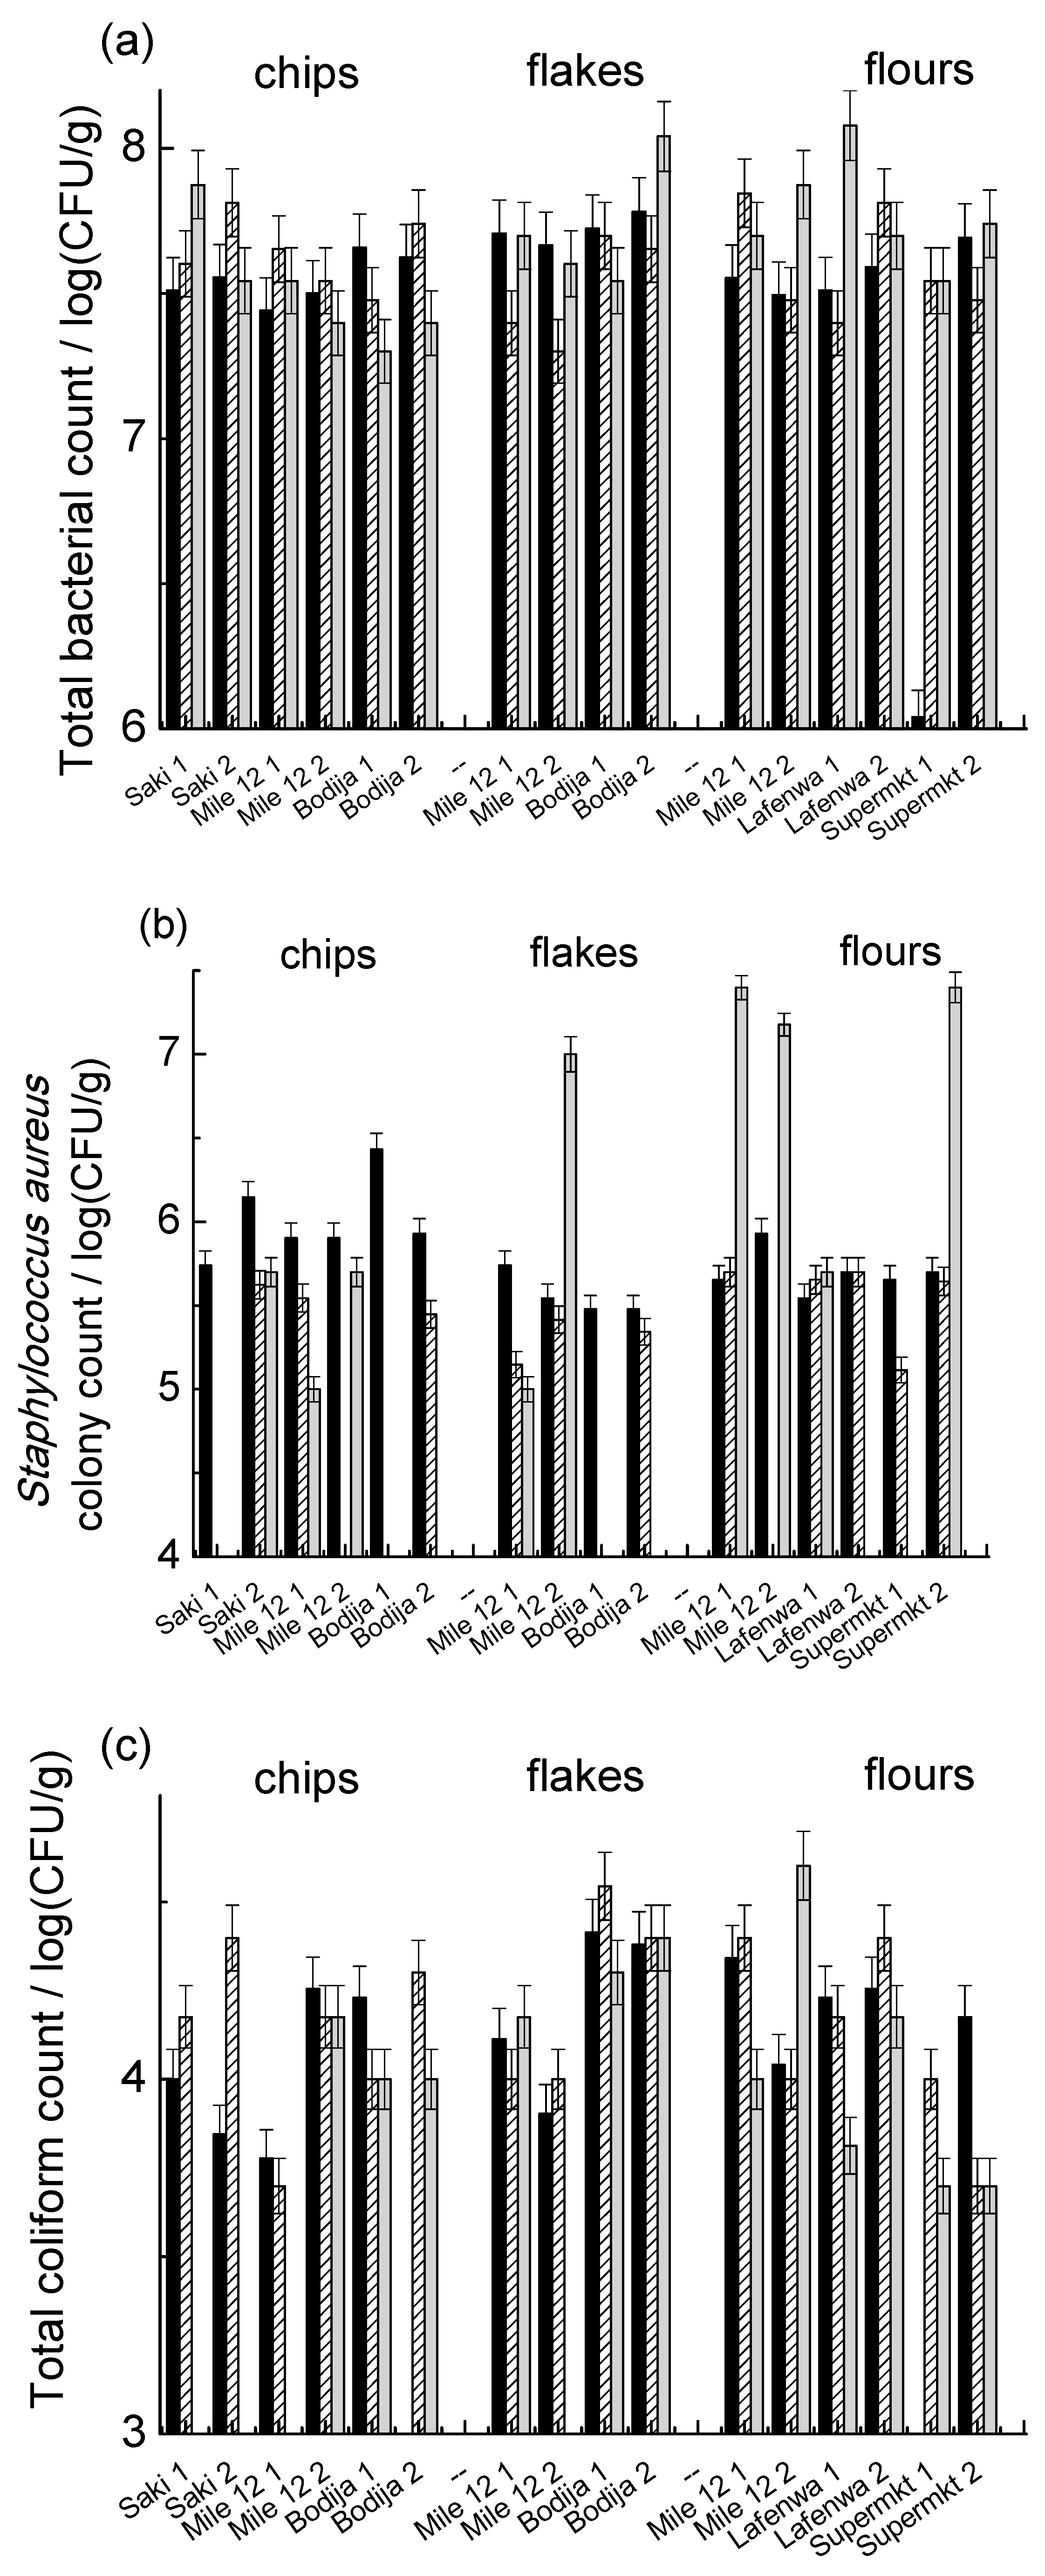
3.2. Microbiological Contamination of Yam, Chips, and Flour
3.3. Aflatoxin Contamination in Yam Chips, Flakes, and Flour
3.4. Heavy Metals Detection in Yam Chips, Flakes, and Flours
3.5. Pesticide Residues
4. Conclusions
- No significant difference was observed in the moisture levels between the freshly produced samples and the markets ones.
- Microbial contamination levels were observed in all samples, irrespective of the kind of food item or sources; overall, however, freshly processed foodstuff showed much lower contaminant concentrations (i.e., at least one order of magnitude lower for total bacterial counts).
- Similarly, heavy metal concentrations (Pd, Cd, and Ni) were higher in the market samples (especially the yam flour) than in those obtained from the processors.
- No aflatoxin was detected in the freshly produced foodstuffs, while higher levels were found in some market samples.
- No pesticide was detected in any samples.
Author Contributions
Funding
Conflicts of Interest
References
- Akissoe, N.H.; Hounhouigan, J.D.; Mestres, C.; Nago, M. How blanching and drying affect the colour and functional characteristics of yam (Dioscorea cayenensis rotundata) flours. Food Chem. 2003, 82, 257–264. [Google Scholar] [CrossRef]
- Eke-Okoro, O.N.; Njoku, D.N.; Mbe, J.O.; Awah, J.I.; Amanze, N.J.; Eke-Okoro, O.C. Contribution of root and tuber crops in the Agricultural transformation agenda in Nigeria. J. Agric. Biol. Sci. 2014, 9, 1990–6145. [Google Scholar]
- Onyeka, T.J.; Pétro, D.; Ano, G.; Etienne, S.; Rubens, S. Resistance in water yam (Dioscorea alata) cultivars in the French West Indies to anthracnose disease based on tissue culture-derived whole-plant assay. Plant Pathol. 2006, 55, 671–678. [Google Scholar] [CrossRef]
- Degras, L. L’igname: plante à tubercule tropicale. In Collection Techniques Agricoles et productions tropicales; Maisonneuve et Larose et ACCT: Paris, France, 1986. [Google Scholar]
- Ferraro, V.; Piccirillo, C.; Tomlins, K.; Pintado, M.E. Cassava (Manihot esculenta Crantz) and yam (Dioscorea spp.) crops and their derived foodstuff: Safety, security and nutritional value. Crit. Rev. Food Sci. Nutr. 2016, 56, 2714–2727. [Google Scholar] [CrossRef] [PubMed]
- Scott, G.J.; Rosegrant, M.W.; Ringler, C. Global projections for root and tuber crops to the year 2020. Food Policy 2000, 25, 561–597. [Google Scholar] [CrossRef]
- Afoakwa, E.O.; Sefa-Dedeh, S. Chemical composition and quality changes in Dioscorea dumentorum pax tubers after harvest. Food Chem. 2001, 75, 85–91. [Google Scholar] [CrossRef]
- Bankole, S.A.; Mabekoje, O.O. Mycoflora and occurrence of aflatoxin B1 in dried yam chips from Ogun and Oyo, Nigeria. Mycopathologia 2004, 157, 111–115. [Google Scholar] [CrossRef]
- Sanni, S.A.; Oguntona, C.R.B.; Bamgbose, A.M. Iron bioavailability and utilization in rats fed cassava fufu flour diet fortified with different sources of iron. J. Food Agric. Environ. 2009, 7, 131–135. [Google Scholar]
- Girardin, O. Postharvest Technology of the Yam: A Study of Improved Traditional Storage in Côte d’Ivoire. Ph.D. Thesis, Ecole Polytechnique Fédérale de Zurich, Zürich, Switzerland, 1996. [Google Scholar]
- Osunde, Z.D. Minimizing Postharvest Losses in Yam (Dioscorea spp.): Treatments and Techniques. In Using Food Science and Technology to Improve Nutrition and Promote National Development; Robertson, G.R., Lupien, J.R., Eds.; International Union of Food Science and Technology: Toronto, ON, Canada, 2008. [Google Scholar]
- Jonathan, G.; Ajayi, I.; Omitade, Y. Nutritional compositions, fungi and aflatoxins detection in stored ‘gbodo’ (fermented Dioscorea rotundata) and ‘elubo ogede’ (fermented Musa parasidiaca) from South western Nigeria. Afr. J. Food Sci. 2011, 5, 105–110. [Google Scholar]
- Omohimi, C.; Piccirillo, C.; Roriz, M.; Ferraro, V.; Vasconcelos, W.M.; Sanni, L.O.; Pintado, M.M.; Abayomi, L.A. Study of the proximate and mineral composition of different Nigerian yam chips, flakes and flours. J. Food Sci. Technol. 2017, 55, 42–51. [Google Scholar] [CrossRef]
- Babajide, J.M.; Oyewole, O.B.; Henshaw, F.O.; Sanni, L.O.; Asiedu, R. Effect of processing variables on the pasting properties of traditional dry-yam slices (Gbodo). In Proceedings of the 14th Triennial Symposium of the International Society for Tropical Root Crops, Kerala, India, 20–26 November 2006. [Google Scholar]
- Ayodele, B.C.; Bolade, M.K.; Usman, M.A. Quality characteristics and acceptability of “amala” (yam-based thick paste) as influenced by particle size categorization of yam (Discorea rotundata) flour. Food Sci. Technol. Int. 2013, 19, 22–27. [Google Scholar] [CrossRef] [PubMed]
- Dabonne, S.; Koffi, B.P.K.; Kouadio, E.J.P.; Koffi, A.G.; Due, E.A.; Kouame, L.P. Traditional utensils: Potential sources of poisoning by heavy metals. Br. J. Pharmacol. Toxicol. 2010, 1, 90–92. [Google Scholar]
- Dasan, B.G.; Boyaci, I.H.; Mutlu, M. Inactivation of aflatoxigenic fungi (Aspergillus spp.) on granular food model, maize, in an atmospheric pressure fluidized bed plasma system. Food Control 2016, 70, 1–8. [Google Scholar] [CrossRef]
- Ogara, I.M.; Zarafi, A.B.; Alabi, O.; Banwo, O.; Ezekiel, C.N.; Warth, B.; Sulyok, M.; Krska, R. Mycotoxins patterns in ear rot infected maize: A comprehensive case study in Nigeria. Food Control 2017, 73, 1159–1168. [Google Scholar] [CrossRef]
- Elekofehinti, O.O.; Omotuyi, I.O.; Olaremu, A.G.; Abayomi, T.G. Heavy metals distribution and lipid profile in the stomach of cow grazed in Akungba-Akoko, Ondo State, Nigeria. Afr. J. Biochem. Res. 2012, 6, 146–149. [Google Scholar]
- Orkwor, G.C.; Ugwu, B.O.; Eze, S.C. Yam Valorisation; Yam Chips for Urban Market (YCUM); Final Research Report; National Root Crops Research Institute: Umudike, Nigeria, 1997. [Google Scholar]
- Claudius-Cole, A.; Kenyon, L.; Coyne, D.L. Effect of pre-plant treatments of yam (Dioscorea rotundata) setts on the production of healthy seed yam, seed yam storage and consecutive ware tuber production. J. Agric. Rural Dev. Trop. Subtrop. 2017, 118, 297–306. [Google Scholar]
- Korada, R.R.; Naskar, S.K.; Edison, S. Insect pests and their management in yam production and storage: A word review. Int. J. Pest Manag. 2009, 56, 337–349. [Google Scholar] [CrossRef]
- Hell, K.; Mutegi, C.; Fandohan, P. Aflatoxin Control and Prevention Strategies in Maize for Sub-Saharan Africa. 2010. Available online: http://pub.jki.bund.de/index.php/JKA/article/view/545 (accessed on 8 February 2018).
- Coker, R.D. Controlling mycotoxin in oilseeds and oilseeds cakes. Chem. Ind. 1995, 7, 260–264. [Google Scholar]
- Melvin, S.S. Approaches in determining aflatoxin B1 in food materials using a range of analytical methods. Int. J. Adv. Res. 2013, 1, 56–59. [Google Scholar]
- Ediage, E.N.; Di Mavungu, J.D.; Monbaliu, S.; Van Peteghem, C.; De Saeger, S. A validated multianalyte LC-MS/MS method for quantification of 25 mycotoxins in cassava flour, peanut cake and maize samples. J. Agric. Food Chem. 2011, 59, 5173–5180. [Google Scholar] [CrossRef]
- Somorin, Y.M.; Bertuzzi, T.; Battilani, P.; Pietri, A. Aflatoxin and fumonisin contamination of yam flour from markets in Nigeria. Food Control 2012, 25, 53–58. [Google Scholar] [CrossRef]
- Abiala, M.A.; Ezekiel, C.N.; Chukwura, N.I.; Odebode, A.C. Toxigenic Aspergillus section Flavi and aflatoxins in dried yam chips in Oyo State, Nigeria. Acad. Arena 2011, 3, 42–49. [Google Scholar]
- AOAC. Official Methods of Analysis, 17th ed.; Association of Official Analytical Chemists: Washington, DC, USA, 2000. [Google Scholar]
- Barnett, H.L.; Hunter, B.B. Illustrated Genera of Imperfect Fungi, 4th ed.; Practice Hall: New York, NY, USA, 1987. [Google Scholar]
- Pitt, J.I.; Hocking, A.D. Fungi and Food Spoilage, 2nd ed.; Blackie Academic Professional: London, UK, 1997. [Google Scholar]
- Ghali, R.; Belouaer, I.; Hdiri, S.; Ghorbel, H.; Maaroufi, K.; Hedilli, A. Simultaneous HPLC determination of aflatoxins B1, B2, G1 and G2 in Tunisian sorghum and pistachios. J. Food Compos. Anal. 2009, 22, 751–755. [Google Scholar] [CrossRef]
- Bressy, F.C.; Brito, G.B.; Barbosa, I.S.; Teixeira, L.S.G.; Korn, M.G.A. Determination of trace element concentrations in tomato samples at different stages of maturation by ICP OES and ICP-MS following microwave-assisted digestion. Microchem. J. 2013, 109, 145–149. [Google Scholar] [CrossRef]
- Camino-Sanchez, F.J.; Zafra-Gomez, A.; Ruiz-Garcia, J.; Bermudez-Peinado, R.; Ballesteros, O.; Navalon, A.; Vilchez, J.L. UNE-EN ISO/IEC 17025-2005 accredited method for the determination of 121 pesticides residues in fruits and vegetables by gas chromatography-tandem mass spectrometry. J. Food Compos. Anal. 2011, 24, 427–440. [Google Scholar] [CrossRef]
- Gnonlonfin, G.J.B.; Hell, K.; Fandohan, P.; Siame, A.B. Mycoflora and natural occurrence of aflatoxins and fumonisin B1 in cassava and yam chips from Benin, West Africa. Int. J. Food Microb. 2008, 122, 140–147. [Google Scholar] [CrossRef]
- Abulude, F.O.; Ojeridan, V.A. Development and quality evaluation of fortified ‘amala’. Acta Sci. Pol. Technol. Aliment. 2006, 5, 127–134. [Google Scholar]
- Mestres, C.; Bassa, S.; Fagbohun, E.; Nago, M.; Hell, K.; Vernier, P.; Champiat, D.; Hounhouigan, J.; Cardwell, K.F. Yam chip food sub-sector: Hazardous practices and presence of aflatoxins in Benin. J. Stored Prod. Res. 2000, 40, 575–585. [Google Scholar] [CrossRef]
- Frazier, W.C.; Westhoff, D.C. Food Microbiology, 18th ed.; McGraw-Hill Inc.: New York, NY, USA, 2003. [Google Scholar]
- International Commission on Microbiological Specifications for Foods (ICMSF). Microorganisms in Foods 6: Microbial Ecology of Food Commodities; Springer: New York, NY, USA, 1998. [Google Scholar]
- Djeri, B.; Ameyapoh, Y.; Karou, D.S.; Anani, K.; Soncy, K.; Adjrah, Y.; Souza, C. Assessment of microbiological qualities of yam chips marketed in Togo. Adv. J. Food Sci. Technol. 2010, 2, 236–241. [Google Scholar]
- Somorin, Y.M.; Bankole, M.O.; Omemu, A.M.; Atanda, O.O. Impact of milling on the microbiological quality of yam flour in Southwestern Nigeria. Res. J. Microb. 2011, 6, 480–487. [Google Scholar] [CrossRef]
- Madueke, S.N.; Awe, S.; Jonah, A.I. Microbiological analysis of street foods along Lokoja-Abuja express way, Lokoja. Am. J. Res. Commun. 2014, 2, 196–211. [Google Scholar]
- Makun, H.A.; Gbodi, T.A.; Akanya, H.O.; Salako, E.A.; Ogbadu, G.H. Fungi and some mycotoxins found in mouldy Sorghum in Niger State, Nigeria. World J. Agric. Sci. 2009, 5, 5–17. [Google Scholar]
- Jimoh, K.O.; Kolapo, A.L. Mycoflora and Aflatoxin Production in Market Samples of Some Selected Nigerian Foodstuffs. Res. J. Microb. 2008, 3, 169–174. [Google Scholar]
- Adegoke, G.O. Understanding Food Microbiology, 2nd ed.; Shalom Press: Ibadan, Nigeria, 2004. [Google Scholar]
- Bankole, S.; Shollenberg, M.; Drochner, W. Mycotoxins in food systems in Sub Saharan Africa: A review. Mycotoxin Res. 2006, 22, 163–169. [Google Scholar] [CrossRef] [PubMed]
- European Commission. Commission Regulation No 165/2010 of 26 February 2010 Amending Regulation (EC) No 1881/2006 Setting Maximum Levels for Certain Contaminants in Foodstuffs as Regards Aflatoxins; Official Journal of the European Union, 27.02.2010; European Commission: Brussels, Belgium, 2010. [Google Scholar]
- Bankole, S.A.; Adebanjo, A. Mycotoxins in food in West Africa: Current situation and possibilities of controlling it. Afr. J. Biotechnol. 2003, 2, 254–263. [Google Scholar]
- Bassa, S.; Mestre, C.; Hell, K.; Vervia, P.; Cardwell, K. First report of aflatoxin in dried yam chips in Benin. Plant Dis. 2001, 85, 1032. [Google Scholar] [CrossRef]
- Orun, T.V.; Bigelow, D.M.; Nelson, M.R.; Cotty, P.J. Spatial analysis of Aspergillus flavus S and L strains cottons: A college of Agriculture report. Univ. Ariz. 1998, 81, 567–580. [Google Scholar]
- Oboh, G.; Akindahunsi, A.A.; Oshodi, A.A. Aflatoxin and moisture content of micro-fungi. Appl. Trop. Agric. 2000, 5, 154–157. [Google Scholar]
- Okigbo, R.N.; Nmeka, I.A. Control of yam tuber rot with leaf extract of Xylopia aethiopica and Zingiber officinale. Afr. J. Biotechnol. 2005, 4, 804–807. [Google Scholar]
- CODEX, STAN. General Standard for Contaminants and Toxins in Food and Feed; FAO/WHO: Rome, Italy, 2010. [Google Scholar]
- Viverette, L.; Mielke, H.W.; Brisco, M.; Dixin, A.; Schaefer, J.; Pierre, K. Environmental health in minority and other underserved populations: Benign methods for identifying lead hazards at day care centers of New Orleans. Environ. Geochem. Health 1996, 18, 41–45. [Google Scholar] [CrossRef]
- Awofolu, O.R. A Survey of Trace Metals in Vegetation, Soil and Lower Animal along some selected major Roads in Metropolitan City of Lagos. Environ. Monit. Assess. 2005, 105, 431–447. [Google Scholar] [CrossRef]
- Khan, M.A.; Khan, S.; Khan, A.; Alam, M. Soil contamination with cadmium, consequences and remediation using organic amendments. Sci. Total Environ. 2017, 601–602, 1591–1605. [Google Scholar] [CrossRef] [PubMed]
- Walker, J.M. Regulation by Other Countries in Foods and the Human Environment. In Proceeding No. 2 “Cadmium accumulation in Australian Agriculture”; Australian Government Publishing Service: Canberra, Australia, 1998; pp. 176–185. [Google Scholar]
- Shin, M.; Cho, Y.; Park, C.; Sohn, H.; Lim, J.; Kwun, I. The contents of heavy metals (Cd, Cr, As, Pb, Ni, and Sn) in the selected commercial yam powder products in South Korea. Nutr. Food Sci. 2013, 18, 249–255. [Google Scholar] [CrossRef] [PubMed]
- Iweala, E.E.J.; Olugbuyiro, J.A.O.; Durodola, B.M.; Fubara-Manuel, D.R.; Okoli, A.O. Metal Contamination of Foods and Drinks Consumed in Ota, Nigeria. Res. J. Environ. Toxicol. 2014, 8, 92–97. [Google Scholar] [CrossRef]
- Prasher, D. Heavy metals and noise exposure: Health effects. Noise Health 2009, 11, 11–144. [Google Scholar] [CrossRef]
- Apau, J.; Acheampong, A.; Appiah, J.A.; Ansong, E. Levels and Health Risk Assessment of Heavy Metals in Tubers from Markets in the Kumasi Metropolis, Ghana. Int. J. Sci. Technol. 2014, 3, 534–539. [Google Scholar]
- Galadima, A.; Muhammad, N.U.; Garba, Z.N. Spectroscopic investigation of heavy metals in waste waters from University students’ hall of residence. Int. J. Chem. 2010, 20, 239–244. [Google Scholar]
- Luckett, B.G.; Su, L.G.; Rood, J.C.; Fontham, E.T. Cadmium exposure and pancreatic cancer in South Louisiana. J. Environ. Public Health 2012, 10, 180–186. [Google Scholar] [CrossRef]


| Sample | Batch A | Batch B | Batch C |
|---|---|---|---|
| Yam Chips | |||
| Processor 1 | 12.67 ± 0.58 a, A | 13.33 ± 0.58 a, A | 11.67 ± 0.58 b, A |
| Processor 2 | 14.33 ± 0.58 a, B | 10.33 ± 0.58 b, B | 12.33 ± 0.58 c, A |
| Processor 3 | 12.67 ± 1.15 a, AB | 14 ± 0.0 a, A | 13.67 ± 0.58 a, B |
| Yam Flakes | |||
| Processor 1 | 10.33 ± 0.58 a, A | 8.33 ± 0.58 b, A | 10 ± 2.0 ab, A |
| Processor 2 | 9.33 ± 0.58 a, A | 7.67 ± 0.58 b, A | 14.67 ± 2.31 c, B |
| Sample | Batch A | Batch B | Batch C |
|---|---|---|---|
| Yam Chips | |||
| Saki 1 | 10.00 ± 3.26 a, A | 12.87 ± 0.25 b, A | 8.67 ± 2.31 c, A |
| Saki 2 | 11.00 ± 2.55 a, B | 11.81 ± 0.34 b, B | 8.0 ± 0.00 c, A |
| Mile12 1 | 11.40 ± 0.28 a, B | 13.10 ± 0.34 a, C | 12.67 ± 1.16 a, B |
| Mile12 2 | 12.10 ± 0.42 a, C | 12.38 ± 0.03 a, D | 12.00 ± 0.00 a, B |
| Bodija 1 | 10.60 ± 0.28 a, D | 12.74 ± 0.36 b, D | 12.00 ± 0.00 c, B |
| Bodija 2 | 10.60 ± 0.28 a, D | 12.01 ± 0.19 b, E | 10.67 ± 1.16 c, B |
| Yam Flakes | |||
| Mile12 1 | 11.80 ± 0.28 a, A | 11.84 ± 0.39 a, A | 9.33 ± 2.31 a, AB |
| Mile12 2 | 10.00 ± 3.39 a, AB | 11.75 ± 0.14 a, A | 11.33 ± 1.16 a, B |
| Bodija 1 | 13.20 ± 0.00 a, B | 13.09 ± 0.03 b, B | 10.00 ± 2.00 b, AB |
| Bodija 2 | 15.40 ± 0.28 a, C | 12.13± 0.26 b, C | 7.33 ± 1.16 c, A |
| Yam Flour | |||
| Mile12 1 | 10.60 ± 3.11 a, A | 12.44± 0.15 b, A | 8.67 ± 1.16 b, A |
| Mile12 2 | 10.40 ± 0.57 a, A | 11.26 ± 0.17 b, B | 9.33± 1.16 ac, A |
| Lafenwa 1 | 10.20 ± 0.28 a, A | 14.61 ± 0.12 b, C | 10.67± 1.15 c, A |
| Lafenwa 2 | 9.20 ± 0.00 a, B | 13.81 ± 0.18 b, D | 10.68 ± 1.17 c, AB |
| Supermarket 1 | 10.00 ± 0.00 a, A | 10.03 ± 0.18 a, E | 12.67 ± 1.16 c, B |
| Supermarket 2 | 10.00 ± 0.57 a, A | 9.66 ± 0.09 a, E | 12.00 ± 0.00 b, B |
| Fungal Isolate | Frequency of Occurrence (%) in Market Samples (N = 16/batch) | Frequency of Occurrence (%) in Freshly Processed Samples (N = 5/batch) | ||||
|---|---|---|---|---|---|---|
| Batch A | Batch B | Batch C | Batch A | Batch B | Batch C | |
| Aspergillus flavus | 12.5 | - | 62.5 | 40 | 20 | - |
| Aspergillus niger | 93.75 | 56.25 | 56.25 | 100 | 80 | 80 |
| Aspergilus spp. | 68.75 | - | - | 60 | 60 | 40 |
| Aspergillus fumigatus | 37.5 | 31.25 | 12.5 | - | - | 20 |
| Penicillium verricosum | - | 6.25 | 6.25 | 20 | - | - |
| Penicillium marneffei | - | 6.25 | 6.25 | - | - | - |
| Penicillium spp. | 87.5 | 25 | 18.75 | 60 | 20 | 20 |
| Mucor spp. | - | 25 | 25 | - | - | 20 |
| Fusarium spp. | 25 | 62.5 | 62.5 | 20 | - | 40 |
| Alternaria | 31.25 | - | - | 20 | 20 | - |
| Sample | Batch A | Batch B | Batch C | |||||||||
|---|---|---|---|---|---|---|---|---|---|---|---|---|
| B1 | B2 | G1 | G2 | B1 | B2 | G1 | G2 | B1 | B2 | G1 | G2 | |
| Yam Chips | ||||||||||||
| Saki 1 | - | - | - | - | - | - | - | - | - | - | - | - |
| Saki 2 | - | - | - | - | - | - | - | - | - | - | - | - |
| Mile12 1 | - | - | - | - | - | - | - | - | - | - | - | - |
| Mile12 2 | - | - | - | - | - | - | - | - | - | - | - | - |
| Bodija 1 | - | - | - | - | 0.8 | - | 0.6 | - | 0.8 | - | 0.6 | - |
| Bodija 2 | - | - | - | - | - | - | - | - | - | - | - | - |
| Yam Flakes | ||||||||||||
| Mile12 1 | - | - | - | - | - | - | - | - | - | - | - | - |
| Mile12 2 | - | - | - | - | - | - | - | - | - | - | - | - |
| Bodija 1 | - | - | - | - | 1.2 | - | 1 | - | - | - | - | - |
| Bodija 2 | - | - | - | - | - | - | - | - | - | - | - | - |
| Yam Flour | ||||||||||||
| Mile12 1 | 1 | - | 1.8 | 0.1 | 1 | - | 1 | - | - | - | - | - |
| Mile12 2 | 2.5 | 0.2 | 2.9 | 0.2 | 2.9 | 0.1 | 1.8 | 0.1 | 0.3 | - | 0.5 | - |
| Lafenwa 1 | 0.7 | - | 0.7 | - | 3.4 | 0.7 | - | - | - | - | - | - |
| Lafenwa 2 | 3.4 | 0.2 | 0.7 | - | 0.5 | - | - | - | - | - | - | - |
| Supermarket 1 | - | - | 0.5 | - | - | - | - | - | - | - | - | - |
| Supermarket 2 | - | - | - | - | - | - | - | - | - | - | - | - |
| Sample | Batch A | Batch B | Batch C | ||||||
|---|---|---|---|---|---|---|---|---|---|
| Pb | Cd | Ni | Pb | Cd | Ni | Pb | Cd | Ni | |
| Yam Chips | |||||||||
| Processor 1 | - | - | 0.12 * | - | - | 0.11 * | 0.42 * | - | 0.01 |
| Processor 2 | 0.23 * | - | - | 0.07 | - | 0.25 * | - | - | 0.16 * |
| Processor 3 | 0.35 * | - | 0.06 * | - | - | 0.14 * | - | - | 0.02 |
| Yam Flakes | |||||||||
| Processor 1 | - | - | 0.18 * | - | - | 0.27 * | 0.58 * | - | 0.14 * |
| Processor 2 | - | - | 0.16 * | - | - | 0.13 * | 0.64 * | - | 0.22 * |
| Sample | Batch A | Batch B | Batch C | ||||||
|---|---|---|---|---|---|---|---|---|---|
| Pb | Cd | Ni | Pb | Cd | Ni | Pb | Cd | Ni | |
| Yam Chips | |||||||||
| Saki 1 | - | 0.03 | 0.19 * | 0.70 * | 0.03 | 0.23 * | - | - | 0.12 * |
| Saki 2 | 1.02 * | 0.01 | 0.22 * | 0.88 * | 0.03 | 0.18 * | - | - | 0.08 * |
| Mile12 1 | - | 0.01 | 0.17 * | - | - | 0.45 * | - | - | 0.09 * |
| Mile12 2 | - | 0.04 | 0.30 * | - | - | 0.14 * | 0.27 * | - | 0.07 * |
| Bodija 1 | - | - | 0.22 * | - | - | 0.10 * | - | - | 0.11 * |
| Bodija 2 | - | 0.03 | 0.27 * | 0.06 | - | 0.32 * | 0.55 * | - | 0.20 * |
| Yam Flakes | |||||||||
| Mile12 1 | - | - | 0.27 * | 0.62 * | - | 0.41 * | 0.37 * | - | 0.01 |
| Mile12 2 | 0.09 | - | 0.21 * | - | - | 0.43 * | 0.28 * | - | 0.25 * |
| Bodija 1 | 0.32 * | 0.05 | 0.94 * | 0.17 | - | 0.77 * | 0.06 | - | 0.06 * |
| Bodija 2 | 0.68 * | 0.12* | 0.33 * | 0.24 * | 0.02 | 0.35 * | 0.24 * | - | 0.08 * |
| Yam Flour | |||||||||
| Mile12 1 | 1.56 * | 0.02 | 0.44 * | - | - | 0.29 * | - | - | 0.07 * |
| Mile12 2 | - | 0.11* | 0.45 * | - | 0.02 | 0.36 * | 0.92 * | 0.09 * | 0.52 * |
| Lafenwa 1 | 0.57 * | 0.01 | 0.13 * | 0.45 * | 0.04 | 0.85 * | 0.73 * | - | 0.13 * |
| Lafenwa 2 | - | - | 0.17 * | 0.19 | - | 0.32 * | 1.52 * | - | 0.09 * |
| Supermarket 1 | - | - | 0.19 * | - | - | 0.16 * | 0.41 * | - | - |
| Supermarket 2 | 0.18 | 0.03 | 0.14 * | 0.63 * | - | 0.24 * | 0.30 * | - | 0.09 * |
© 2019 by the authors. Licensee MDPI, Basel, Switzerland. This article is an open access article distributed under the terms and conditions of the Creative Commons Attribution (CC BY) license (http://creativecommons.org/licenses/by/4.0/).
Share and Cite
Omohimi, C.; Piccirillo, C.; Ferraro, V.; Roriz, M.C.; Omemu, M.A.; Santos, S.M.D.; Da Ressurreição, S.; Abayomi, L.; Adebowale, A.; Vasconcelos, M.W.; et al. Safety of Yam-Derived (Dioscorea rotundata) Foodstuffs—Chips, Flakes and Flour: Effect of Processing and Post-Processing Conditions. Foods 2019, 8, 12. https://doi.org/10.3390/foods8010012
Omohimi C, Piccirillo C, Ferraro V, Roriz MC, Omemu MA, Santos SMD, Da Ressurreição S, Abayomi L, Adebowale A, Vasconcelos MW, et al. Safety of Yam-Derived (Dioscorea rotundata) Foodstuffs—Chips, Flakes and Flour: Effect of Processing and Post-Processing Conditions. Foods. 2019; 8(1):12. https://doi.org/10.3390/foods8010012
Chicago/Turabian StyleOmohimi, Celestina, Clara Piccirillo, Vincenza Ferraro, Mariana C. Roriz, Mobolaji A. Omemu, Sandra M. Dias Santos, Sandrine Da Ressurreição, Louise Abayomi, Abdulraqaz Adebowale, Marta W. Vasconcelos, and et al. 2019. "Safety of Yam-Derived (Dioscorea rotundata) Foodstuffs—Chips, Flakes and Flour: Effect of Processing and Post-Processing Conditions" Foods 8, no. 1: 12. https://doi.org/10.3390/foods8010012
APA StyleOmohimi, C., Piccirillo, C., Ferraro, V., Roriz, M. C., Omemu, M. A., Santos, S. M. D., Da Ressurreição, S., Abayomi, L., Adebowale, A., Vasconcelos, M. W., Obadina, O., Sanni, L., & Pintado, M. M. E. (2019). Safety of Yam-Derived (Dioscorea rotundata) Foodstuffs—Chips, Flakes and Flour: Effect of Processing and Post-Processing Conditions. Foods, 8(1), 12. https://doi.org/10.3390/foods8010012