Acceptability of Pulse-Fortified Foods by Two Groups: Participants in a Clinical Trial and Participants in a Consumer Acceptability Panel

 ,
,  ,
,  ,
, 
Abstract
:1. Introduction
2. Materials and Methods
2.1. Materials
2.2. Samples
Cooking
2.3. Sample Preparation and Presentation for Sensory Evaluation
2.4. Sensory Methods
2.4.1. Consumer Acceptability Study
Recruitment
Sample Evaluation
2.4.2. Clinical Trial Participants—Acceptability
2.4.3. Statistical Analysis
3. Results and Discussion
3.1. Nutrients
3.2. Demographics
3.3. Sample Evaluation
3.4. Regression Analysis
4. Conclusions
Author Contributions
Funding
Acknowledgments
Conflicts of Interest
References
- Hall, C.; Hillen, C.; Robinson, J.G. Composition, nutritional value, and health benefits of pulses. Cereal Chem. 2017, 94, 11–31. [Google Scholar] [CrossRef]
- Ekmekcioglu, C.; Wallner, P.; Kundi, M.; Weisz, U.; Haas, W.; Hutter, H.P. Red meat, diseases, and healthy alternatives: A critical review. Crit. Rev. Food Sci. Nutr. 2018, 58, 247–261. [Google Scholar] [CrossRef] [PubMed]
- Gao, Y.; Yue, J. Dietary Fibre and Human Health; John Wiley and Sons Inc.: Hoboken, NJ, USA, 2012. [Google Scholar]
- Finley, J.W.; Burrell, J.B.; Reeves, P.G. Pinto bean consumption changes SCFA profiles in fecal fermentations, bacterial populations of the lower bowel, and lipid profiles in blood of humans. J. Nutr. 2007, 137, 2391–2398. [Google Scholar] [CrossRef] [PubMed]
- Ha, V.; Sievenpiper, J.L.; de Souza, R.J.; Jayalath, V.H.; Mirrahimi, A.; Agarwal, A.; Chiavaroli, L.; Mejia, S.B.; Sacks, F.M.; Di Buono, M.; et al. Effect of dietary pulse intake on established therapeutic lipid targets for cardiovascular risk reduction: A systematic review and meta-analysis of randomized controlled trials. Can. Med. Assoc. J. 2014, 186, E252–E262. [Google Scholar] [CrossRef] [PubMed]
- Jayalath, V.H.; Souza, R.J.; Sievenpiper, J.L.; Ha, V.; Chiavaroli, L.; Mirrahimi, A.; Di Buono, M.; Bernstein, A.M.; Leiter, L.A.; Kris-Etherton, P.M.; et al. Effect of dietary pulses on blood pressure: A systematic review and meta-analysis of controlled feeding trials. Am. J. Hypertens. 2014, 27, 56–64. [Google Scholar] [CrossRef] [PubMed]
- Mollard, R.C.; Luhovyy, B.L.; Panahi, S.; Nunez, M.; Hanley, A.; Anderson, G.H. Regular consumption of pulses for 8 weeks reduces metabolic syndrome risk factors in overweight and obese adults. Br. J. Nutr. 2012, 108, S111–S122. [Google Scholar] [CrossRef] [PubMed]
- Kim, S.J.; de Souza, R.J.; Choo, V.L.; Ha, V.; Cozma, A.I.; Chiavaroli, L.; Mirrahimi, A.; Blanco Mejia, S.; Di Buono, M.; Bernstein, A.M.; et al. Effects of dietary pulse consumption on body weight: A systematic review and meta-analysis of randomized controlled trials. Am. J. Clin. Nutr. 2016, 103, 1213–1223. [Google Scholar] [CrossRef] [PubMed]
- Sievenpiper, J.L.; Kendall, C.W.C.; Esfahani, A.; Wong, J.M.W.; Carleton, A.J.; Jiang, H.Y.; Bazinet, R.P.; Vidgen, E.; Jenkins, D.J.A. Effect of non-oil-seed pulses on glycaemic control: A systematic review and meta-analysis of randomised controlled experimental trials in people with and without diabetes. Diabetologia 2009, 52, 1479–1495. [Google Scholar] [CrossRef] [PubMed]
- Mollard, R.C.; Zykus, A.; Luhovyy, B.L.; Nunez, M.F.; Wong, C.L.; Anderson, G.H. The acute effects of a pulse-containing meal on glycaemic responses and measures of satiety and satiation within and at a later meal. Br. J. Nutr. 2012, 108, 509–517. [Google Scholar] [CrossRef] [PubMed]
- Zhu, B.B.; Sun, Y.; Qi, L.; Zhong, R.; Miao, X. Dietary legume consumption reduces risk of colorectal cancer: Evidence from a meta-analysis of cohort studies. Sci. Rep. 2015, 5. [Google Scholar] [CrossRef] [PubMed]
- Zahradka, P.; Wright, B.; Weighell, W.; Blewett, H.; Baldwin, A.; O, K.; Guzman, R.P.; Taylor, C.G. Daily non-soy legume consumption reverses vascular impairment due to peripheral artery disease. Atherosclerosis 2013, 230, 310–314. [Google Scholar] [CrossRef] [PubMed]
- Mudryj, A.N.; Yu, N.; Hartman, T.J.; Mitchell, D.C.; Lawrence, F.R.; Aukema, H.M. Pulse consumption in Canadian adults influences nutrient intakes. Br. J. Nutr. 2012, 108, S27–S36. [Google Scholar] [CrossRef] [PubMed]
- Government of Alberta. Factors Influencing Pulse Consumption in Canada. 2010. Available online: https://www1.agric.gov.ab.ca/$Department/deptdocs.nsf/all/sis13117/$FILE/v2_factors_influencing_pulse_keyfindings_feb24_2010.pdf (accessed on 27 July 2018).
- Rebello, C.J.; Greenway, F.L.; Finley, J.W. Whole grains and pulses: A comparison of the nutritional and health benefits. J. Agric. Food Chem. 2014, 62, 7029–7049. [Google Scholar] [CrossRef] [PubMed]
- Austria, J.A.; Aliani, M.; Malcolmson, L.J.; Dibrov, E.; Blackwood, D.P.; Maddaford, T.G.; Guzman, R.; Pierce, G.N. Daily choices of functional foods supplemented with milled flaxseed by a patient population over one year. J. Funct. Foods 2016, 26, 772–780. [Google Scholar] [CrossRef]
- Padhi, E.M.T.; Ramdath, D.D.; Carson, S.J.; Hawke, A.; Blewett, H.J.; Wolever, T.M.S.; Vella, D.; Seetharaman, K.; Duizer, L.M.; Duncan, A.M. Liking of soy flour muffins over time and the impact of a health claim on willingness to consume. Food Res. Int. 2015, 77, 491–497. [Google Scholar] [CrossRef]
- Ramdath, D.D.; Wolever, T.M.S.; Siow, Y.C.; Ryland, D.; Hawke, A.; Taylor, C.; Zahradka, P.; Aliani, M. Effect of processing on postprandial glycemic response and consumer acceptability of lentil-containing food items. Foods 2018, 7, 76. [Google Scholar] [CrossRef] [PubMed]
- Baldwin, A.; Zahradka, P.; Weighell, W.; Guzman, R.P.; Taylor, C.G. Feasibility and tolerability of daily pulse consumption in individuals with peripheral artery disease. Can. J. Diet. Pract. Res. 2017, 78, 187–191. [Google Scholar] [CrossRef] [PubMed]
- Stone, H.; Sidel, J.L. Sensory Evaluation Practices; Academic Press: Amsterdam, The Netherlands, 2004. [Google Scholar]
- Mammasse, N.; Schlich, P. Adequate number of consumers in a liking test. Insights from resampling in seven studies. Food Qual. Preference 2014, 31, 124–128. [Google Scholar] [CrossRef]
- Schutz, H.G. A food action rating scale for measuring food acceptance. J. Food Sci. 1965, 30, 365–374. [Google Scholar] [CrossRef]
- O’Mahony, M. Sensory Evaluation of Food: Statistical Methods and Procedures; Marcel Dekker, Inc.: New York, NY, USA, 1986. [Google Scholar]
- Jha, A.B.; Ashokkumar, K.; Diapari, M.; Ambrose, S.J.; Zhang, H.X.; Tar’an, B.; Bett, K.E.; Vandenberg, A.; Warkentin, T.D.; Purves, R.W. Genetic diversity of folate profiles in seeds of common bean, lentil, chickpea and pea. J. Food Compos. Anal. 2015, 42, 134–140. [Google Scholar] [CrossRef]
- Giordano, D.; Reyneri, A.; Blandino, M. Folate distribution in barley (Hordeum vulgare L.), common wheat (Triticum aestivum L.) and durum wheat (Triticum turgidum durum Desf.) pearled fractions. J. Sci. Food Agric. 2016, 96, 1709–1715. [Google Scholar] [CrossRef] [PubMed]
- Anguah, K.O.B.; Lovejoy, J.C.; Craig, B.A.; Gehrke, M.M.; Palmer, P.A.; Eichelsdoerfer, P.E.; McCrory, M.A. Can the palatability of healthy, satiety-promoting foods increase with repeated exposure during weight loss? Foods 2017, 6, 16. [Google Scholar] [CrossRef] [PubMed]
- Mkanda, A.V.; Minnaar, A.; de Kock, H.L. Relating consumer preferences to sensory and physicochemical properties of dry beans (Phaseolus vulgaris). J. Sci. Food Agric. 2007, 87, 2868–2879. [Google Scholar] [CrossRef]
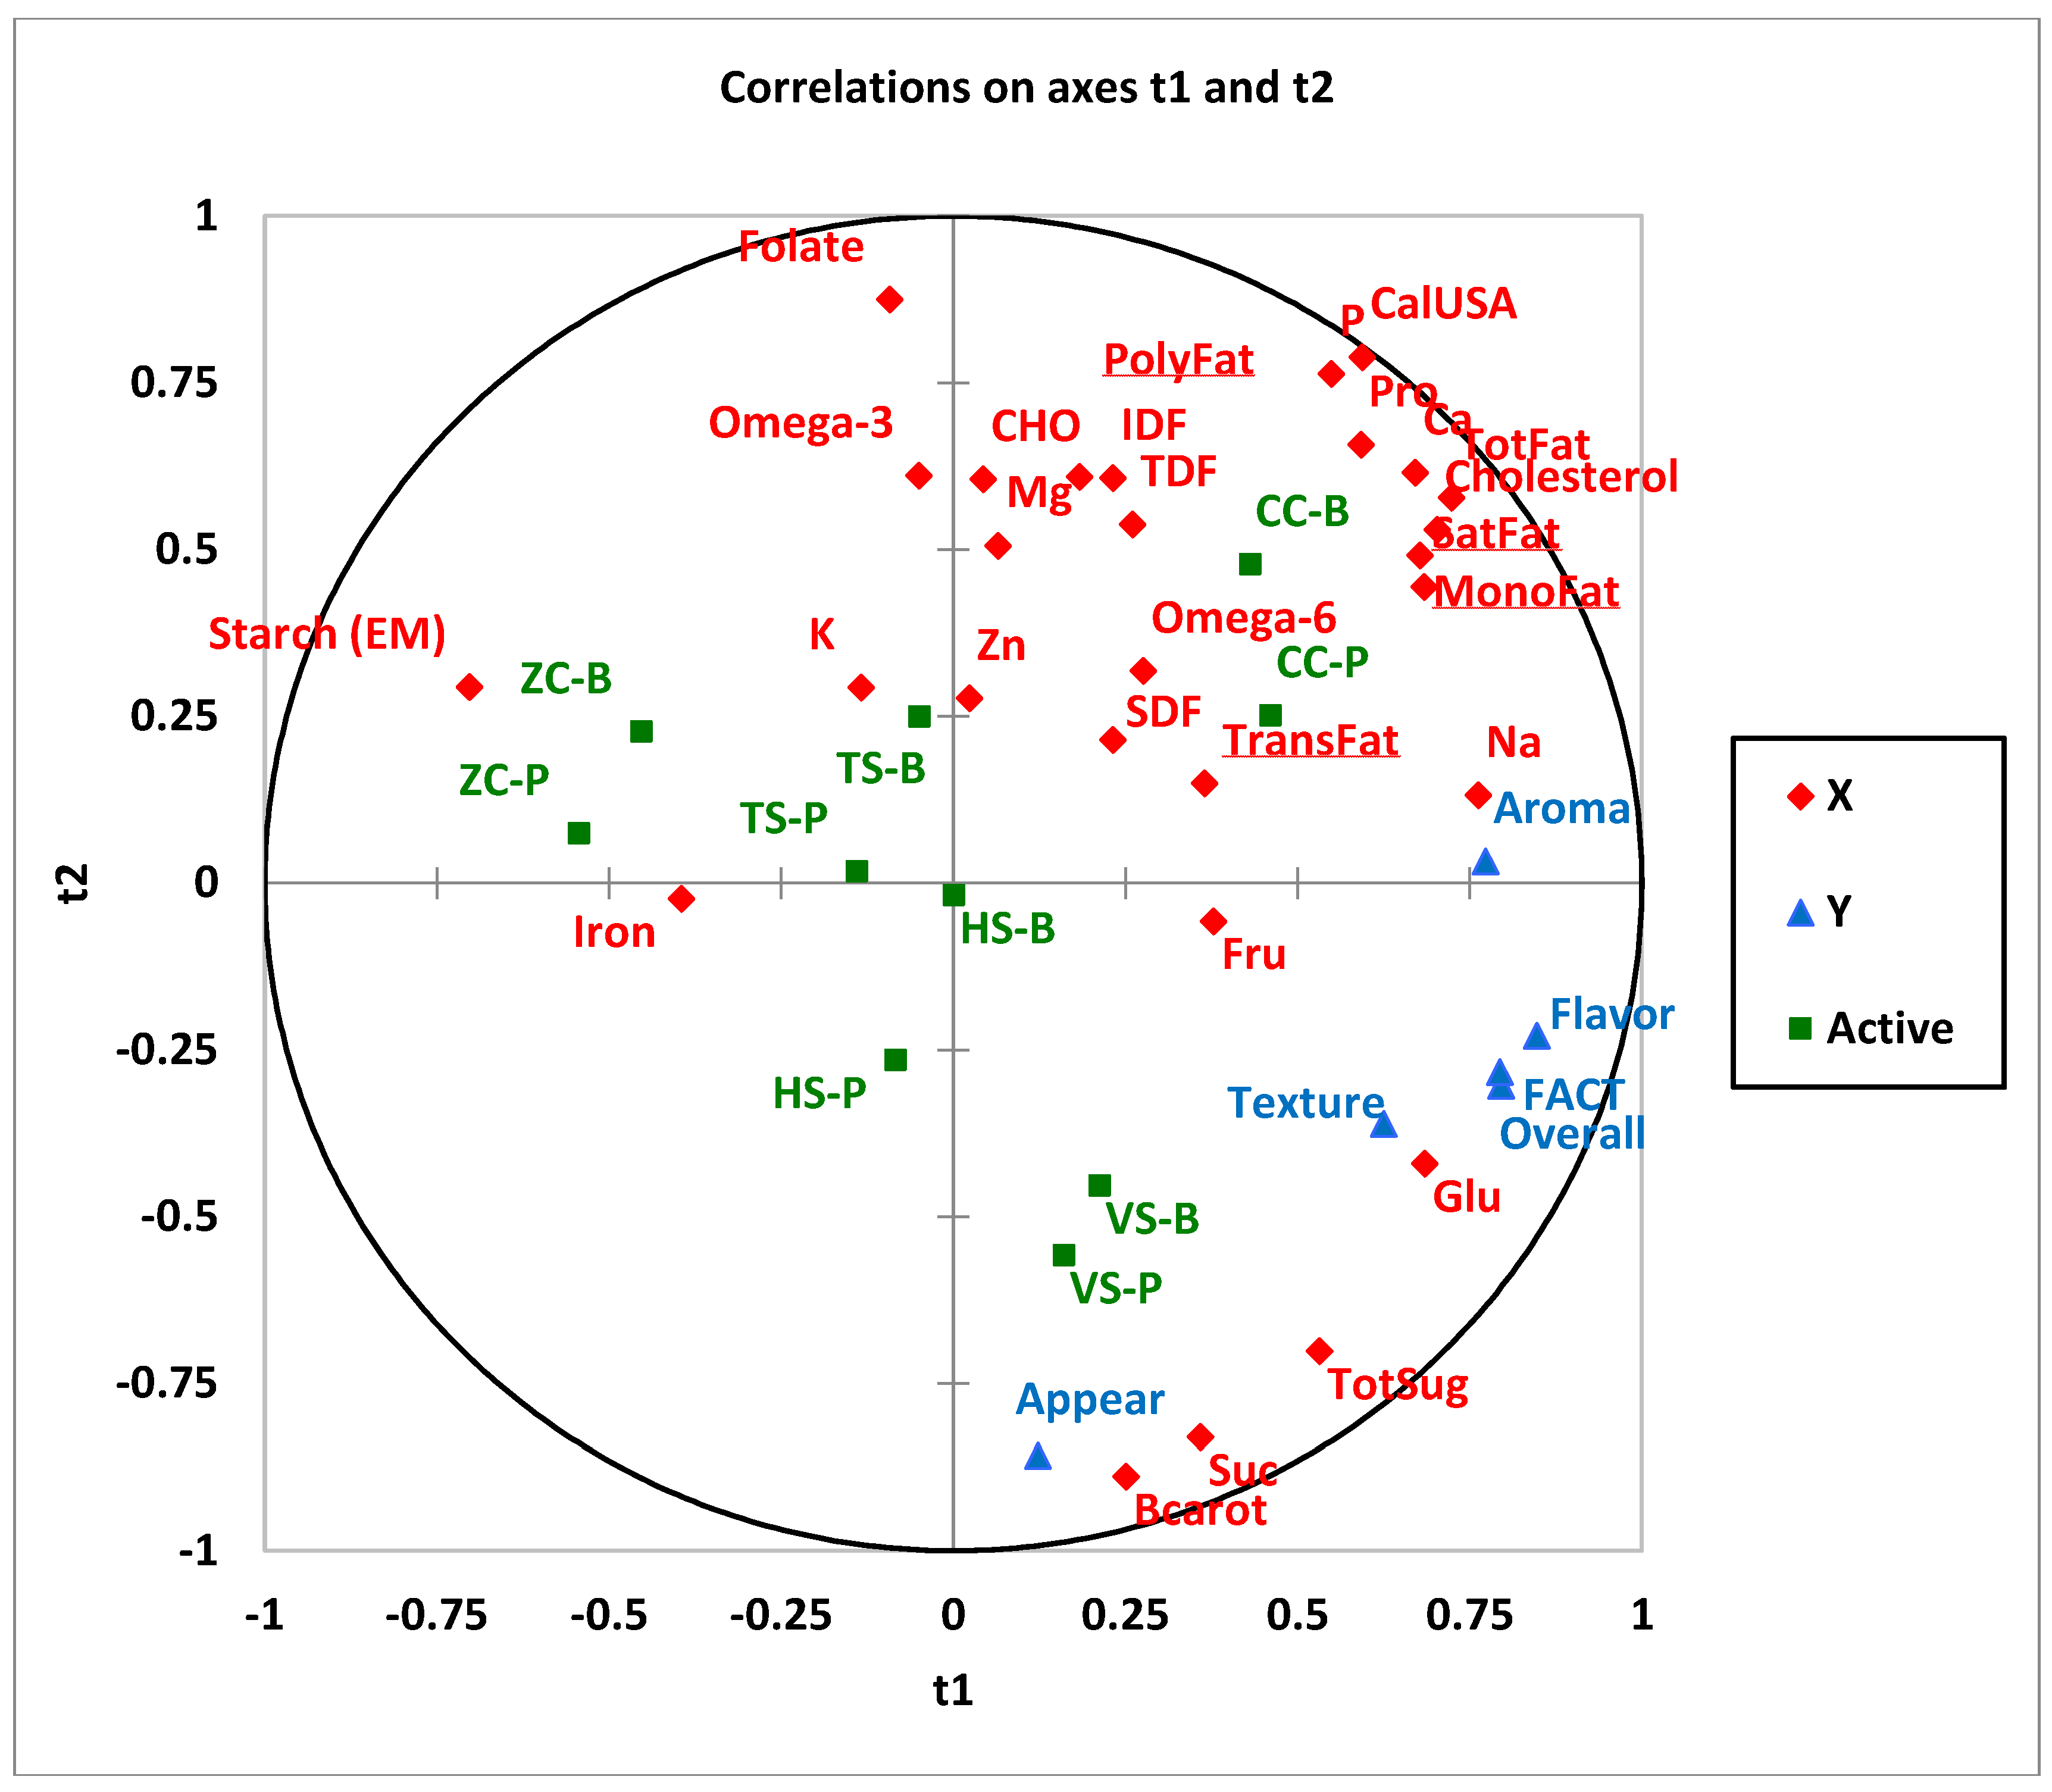
 are nutrients and Y variables
  are acceptability measurements including appearance, aroma, flavor, texture, overall acceptability, and FACT (frequency of eating the sample). 10 samples (Active)
  TS-B, Tortellini Soup Bean; TS-P, Tortellini Soup Pea; VS-B, Vegetable Soup Bean; VS-P, Vegetable Soup Pea; ZC-B, Zucchini Casserole Bean; ZC-P, Zucchini Casserole Pea; CC-B, Chicken Casserole Bean; CC-P, Chicken Casserole Pea; HS-B, Hamburger Soup Bean; HS-P, Hamburger Soup Pea. Abbreviations: IDF, insoluble dietary fibre; Mg, magnesium; CalUSA, Calories USA; TotFat, Total Fat; SatFat, Saturated Fat; MonoFat, Monounsaturated Fat; PolyFat, Polyunsaturated Fat; Na, Sodium; K, Potassium; CHO, Carbohydrate; TDF, Total Dietary Fibre; TotSug, Total Sugar; Fru, Fructose; Glu, Glucose; Suc, Sucrose; Bcarot, Beta Carotene; Ca, Calcium; P, Phosphorous; SDF, Soluble Dietary Fibre; Zn, Zinc.
are nutrients and Y variables are acceptability measurements including appearance, aroma, flavor, texture, overall acceptability, and FACT (frequency of eating the sample). 10 samples (Active) TS-B, Tortellini Soup Bean; TS-P, Tortellini Soup Pea; VS-B, Vegetable Soup Bean; VS-P, Vegetable Soup Pea; ZC-B, Zucchini Casserole Bean; ZC-P, Zucchini Casserole Pea; CC-B, Chicken Casserole Bean; CC-P, Chicken Casserole Pea; HS-B, Hamburger Soup Bean; HS-P, Hamburger Soup Pea. Abbreviations: IDF, insoluble dietary fibre; Mg, magnesium; CalUSA, Calories USA; TotFat, Total Fat; SatFat, Saturated Fat; MonoFat, Monounsaturated Fat; PolyFat, Polyunsaturated Fat; Na, Sodium; K, Potassium; CHO, Carbohydrate; TDF, Total Dietary Fibre; TotSug, Total Sugar; Fru, Fructose; Glu, Glucose; Suc, Sucrose; Bcarot, Beta Carotene; Ca, Calcium; P, Phosphorous; SDF, Soluble Dietary Fibre; Zn, Zinc.
TS-B, Tortellini Soup Bean; TS-P, Tortellini Soup Pea; VS-B, Vegetable Soup Bean; VS-P, Vegetable Soup Pea; ZC-B, Zucchini Casserole Bean; ZC-P, Zucchini Casserole Pea; CC-B, Chicken Casserole Bean; CC-P, Chicken Casserole Pea; HS-B, Hamburger Soup Bean; HS-P, Hamburger Soup Pea. Abbreviations: IDF, insoluble dietary fibre; Mg, magnesium; CalUSA, Calories USA; TotFat, Total Fat; SatFat, Saturated Fat; MonoFat, Monounsaturated Fat; PolyFat, Polyunsaturated Fat; Na, Sodium; K, Potassium; CHO, Carbohydrate; TDF, Total Dietary Fibre; TotSug, Total Sugar; Fru, Fructose; Glu, Glucose; Suc, Sucrose; Bcarot, Beta Carotene; Ca, Calcium; P, Phosphorous; SDF, Soluble Dietary Fibre; Zn, Zinc.
are nutrients and Y variables are acceptability measurements including appearance, aroma, flavor, texture, overall acceptability, and FACT (frequency of eating the sample). 10 samples (Active) TS-B, Tortellini Soup Bean; TS-P, Tortellini Soup Pea; VS-B, Vegetable Soup Bean; VS-P, Vegetable Soup Pea; ZC-B, Zucchini Casserole Bean; ZC-P, Zucchini Casserole Pea; CC-B, Chicken Casserole Bean; CC-P, Chicken Casserole Pea; HS-B, Hamburger Soup Bean; HS-P, Hamburger Soup Pea. Abbreviations: IDF, insoluble dietary fibre; Mg, magnesium; CalUSA, Calories USA; TotFat, Total Fat; SatFat, Saturated Fat; MonoFat, Monounsaturated Fat; PolyFat, Polyunsaturated Fat; Na, Sodium; K, Potassium; CHO, Carbohydrate; TDF, Total Dietary Fibre; TotSug, Total Sugar; Fru, Fructose; Glu, Glucose; Suc, Sucrose; Bcarot, Beta Carotene; Ca, Calcium; P, Phosphorous; SDF, Soluble Dietary Fibre; Zn, Zinc. are nutrients and Y variables are acceptability measurements including appearance, aroma, flavor, texture, overall acceptability, and FACT (frequency of eating the sample). 10 samples (Active) TS-B, Tortellini Soup Bean; TS-P, Tortellini Soup Pea; VS-B, Vegetable Soup Bean; VS-P, Vegetable Soup Pea; ZC-B, Zucchini Casserole Bean; ZC-P, Zucchini Casserole Pea; CC-B, Chicken Casserole Bean; CC-P, Chicken Casserole Pea; HS-B, Hamburger Soup Bean; HS-P, Hamburger Soup Pea. Abbreviations: IDF, insoluble dietary fibre; Mg, magnesium; CalUSA, Calories USA; TotFat, Total Fat; SatFat, Saturated Fat; MonoFat, Monounsaturated Fat; PolyFat, Polyunsaturated Fat; Na, Sodium; K, Potassium; CHO, Carbohydrate; TDF, Total Dietary Fibre; TotSug, Total Sugar; Fru, Fructose; Glu, Glucose; Suc, Sucrose; Bcarot, Beta Carotene; Ca, Calcium; P, Phosphorous; SDF, Soluble Dietary Fibre; Zn, Zinc.
are nutrients and Y variables are acceptability measurements including appearance, aroma, flavor, texture, overall acceptability, and FACT (frequency of eating the sample). 10 samples (Active) TS-B, Tortellini Soup Bean; TS-P, Tortellini Soup Pea; VS-B, Vegetable Soup Bean; VS-P, Vegetable Soup Pea; ZC-B, Zucchini Casserole Bean; ZC-P, Zucchini Casserole Pea; CC-B, Chicken Casserole Bean; CC-P, Chicken Casserole Pea; HS-B, Hamburger Soup Bean; HS-P, Hamburger Soup Pea. Abbreviations: IDF, insoluble dietary fibre; Mg, magnesium; CalUSA, Calories USA; TotFat, Total Fat; SatFat, Saturated Fat; MonoFat, Monounsaturated Fat; PolyFat, Polyunsaturated Fat; Na, Sodium; K, Potassium; CHO, Carbohydrate; TDF, Total Dietary Fibre; TotSug, Total Sugar; Fru, Fructose; Glu, Glucose; Suc, Sucrose; Bcarot, Beta Carotene; Ca, Calcium; P, Phosphorous; SDF, Soluble Dietary Fibre; Zn, Zinc.
are nutrients and Y variables are acceptability measurements including appearance, aroma, flavor, texture, overall acceptability, and FACT (frequency of eating the sample). 10 samples (Active) TS-B, Tortellini Soup Bean; TS-P, Tortellini Soup Pea; VS-B, Vegetable Soup Bean; VS-P, Vegetable Soup Pea; ZC-B, Zucchini Casserole Bean; ZC-P, Zucchini Casserole Pea; CC-B, Chicken Casserole Bean; CC-P, Chicken Casserole Pea; HS-B, Hamburger Soup Bean; HS-P, Hamburger Soup Pea. Abbreviations: IDF, insoluble dietary fibre; Mg, magnesium; CalUSA, Calories USA; TotFat, Total Fat; SatFat, Saturated Fat; MonoFat, Monounsaturated Fat; PolyFat, Polyunsaturated Fat; Na, Sodium; K, Potassium; CHO, Carbohydrate; TDF, Total Dietary Fibre; TotSug, Total Sugar; Fru, Fructose; Glu, Glucose; Suc, Sucrose; Bcarot, Beta Carotene; Ca, Calcium; P, Phosphorous; SDF, Soluble Dietary Fibre; Zn, Zinc.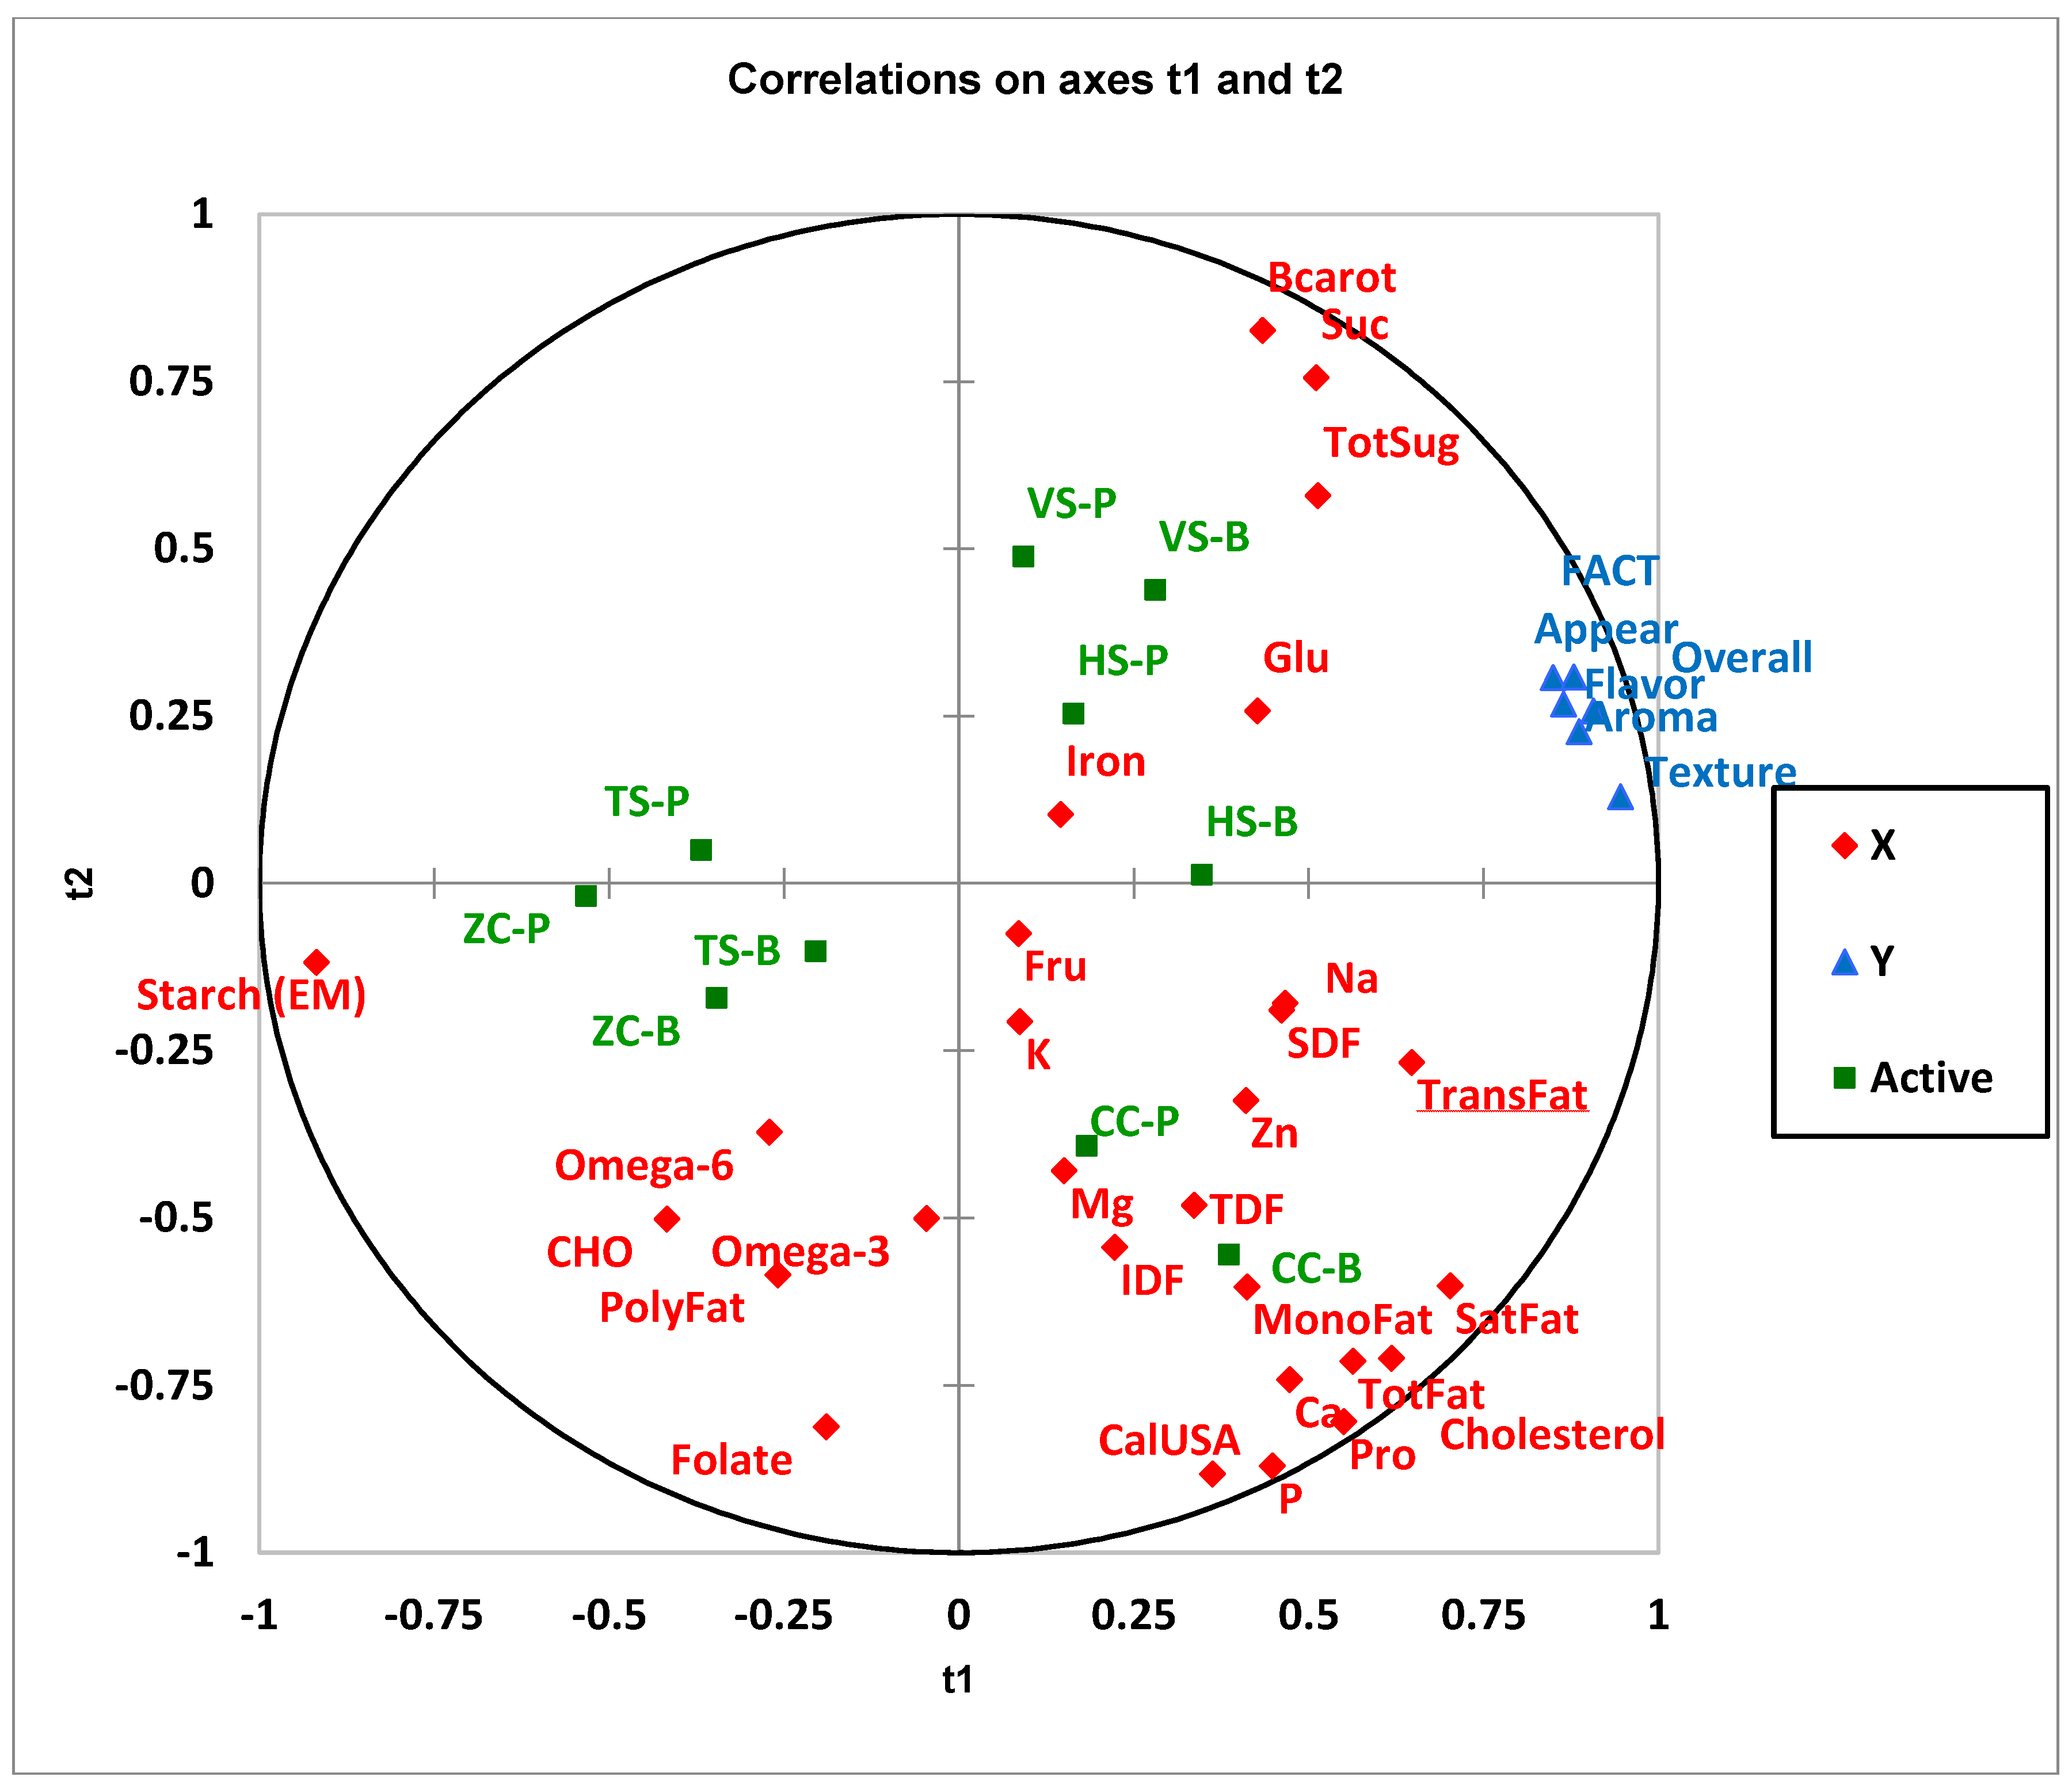


| Study Food Formulation Ingredients-Amounts for 1 Portion | ||||||||||
|---|---|---|---|---|---|---|---|---|---|---|
| Food Item and Pulse Type | Zucchini Casserole—Navy Bean, or Yellow Pea | Vegetable Soup—Black Bean, or Yellow Pea | Chicken Casserole—Great Northern Bean, or Green Pea | Tortellini Soup—Pinto Bean, or Green Pea | Hamburger Soup—All Four Bean Types, or Both Pea Types | |||||
| Study Food Raw Ingredients | g | % (w/w) | g | % (w/w) | g | % (w/w) | g | % (w/w) | g | % (w/w) |
| Black pepper | 0.1 | 0.03 | 0.03 | 0.02 | ||||||
| Canola oil | 1.0 | 0.4 | 1.0 | 0.3 | 1.0 | 0.6 | 1.0 | 0.5 | ||
| Carrot, fresh, sliced | 25.0 | 8.4 | ||||||||
| Chicken powder, 25% less salt | 4.5 | 1.5 | 4.5 | 2.7 | ||||||
| Chicken, thigh, boneless, skinless | 40.0 | 23.9 | ||||||||
| Corn, niblets, frozen | 45.0 | 15.1 | ||||||||
| Cumin, dried | 0.03 | 0.01 | 0.03 | 0.01 | 0.03 | 0.02 | 0.03 | 0.01 | 0.03 | 0.01 |
| Garlic, minced | 4.0 | 1.7 | 3.0 | 1.0 | 3.0 | 1.8 | 3.0 | 1.4 | 3.0 | 1.2 |
| Green pepper, fresh, chopped | 30.0 | 17.9 | 20.0 | 9.4 | ||||||
| Ground beef, lean | 40.0 | 15.5 | ||||||||
| Italian seasoning | 0.2 | 0.09 | ||||||||
| Mixed vegetables | 40.0 | 15.5 | ||||||||
| Mozzarella cheese, part-skim (18% fat) | 10.0 | 6.0 | ||||||||
| Mushrooms, white, fresh, sliced | 25.0 | 10.6 | 20.0 | 9.4 | ||||||
| Onion soup, dried | 4.5 | 1.8 | ||||||||
| Onion, fresh large yellow, diced | 30.0 | 12.7 | 50.0 | 16.7 | 30.0 | 17.9 | 25.0 | 11.7 | 20.0 | 7.8 |
| Oregano, leaves, dried | 0.16 | 0.07 | 0.1 | 0.06 | ||||||
| Parsley, dried | 0.1 | 0.03 | ||||||||
| Pasta, baby shells | 15.0 | 6.4 | ||||||||
| Red pepper, sweet, fresh, chopped | 30.0 | 17.9 | 20.0 | 9.4 | ||||||
| Salt | 0.06 | 0.03 | ||||||||
| Summer savory, dried | 0.1 | 0.03 | ||||||||
| Thyme, dried leaves | 0.12 | 0.05 | 0.1 | 0.03 | ||||||
| Tomato sauce, low sodium | 20.0 | 6.7 | 10.0 | 3.9 | ||||||
| Tomatoes, canned, diced, Italian style | 40.0 | 15.5 | ||||||||
| Tomatoes, canned, diced | 60.0 | 25.5 | 70.0 | 23.4 | ||||||
| Tortellini, rainbow, three cheese | 20.0 | 9.4 | ||||||||
| Vegetable powder | 4.5 | 2.1 | ||||||||
| Water | 60.0 | 25.5 | 80.0 | 26.8 | 13.0 | 7.8 | 80.0 | 37.4 | 100.0 | 38.8 |
| Yogurt, low fat (1.6%), plain | 6.0 | 3.6 | ||||||||
| Zucchini, fresh, diced | 40.0 | 17.0 | 20.0 | 9.4 | ||||||
| Study Food Raw Ingredients—Total Weight | 235.4 | 298.9 | 167.7 | 213.7 | 257.5 | |||||
| Pulse—Cooked Weight | 120.0 | 120.0 | 120.0 | 120.0 | 120.0 | |||||
| Study Food—Total Cooked Weight | 325 | 360 | 251 | 307 | 323 | |||||
| Pulse—% of Cooked Study Food | 36.9 | 33.3 | 47.8 | 39.1 | 37.2 | |||||
| Nutrient | Unit | Zucchini Casserole | Vegetable Soup | Chicken Casserole | Tortellini Soup | Hamburger Soup | Method of Analysis | |||||
|---|---|---|---|---|---|---|---|---|---|---|---|---|
| Navy Bean | Yellow Pea | Black Bean | Yellow Pea | Great Northern Bean | Green Pea | Pinto Bean | Green Pea | 4 Bean Types | 2 Pea Types | |||
| Serving size | g | 325 | 325 | 360 | 360 | 251 | 251 | 307 | 307 | 323 | 323 | |
| Energy | Cal USA | 283 | 263 | 288 | 281 | 279 | 237 | 295 | 270 | 294 | 275 | Atwater Factors |
| Energy | Cal Canada | 244 | 237 | 248 | 252 | 241 | 215 | 246 | 246 | 252 | 242 | Health Canada 20 |
| Total fat as triglycerides by GC | g | 3.19 | 2.93 | 3.71 | 3.53 | 4.64 | 4.19 | 3.96 | 3.96 | 4.91 | 3.97 | AOAC 996.06 |
| Saturated fatty acids | g | 0.59 | 0.49 | 0.79 | 0.68 | 1.68 | 1.48 | 0.83 | 0.80 | 1.91 | 1.42 | |
| Cis-monounsaturated fatty acids | g | 0.88 | 0.91 | 1.12 | 1.19 | 1.38 | 1.42 | 1.35 | 1.57 | 1.52 | 1.29 | |
| Cis-polyunsaturated fatty acids | g | 1.56 | 1.37 | 1.55 | 1.44 | 1.28 | 1.03 | 1.54 | 1.38 | 1.03 | 0.94 | |
| Omega-6 fatty acids | g | 1.04 | 1.14 | 1.15 | 1.26 | 0.90 | 0.88 | 1.04 | 1.07 | 0.68 | 0.78 | |
| Omega-3 fatty acids | g | 0.52 | 0.23 | 0.40 | 0.18 | 0.38 | 0.15 | 0.49 | 0.28 | 0.36 | 0.16 | |
| Trans fatty acids | g | <0.01 | <0.01 | <0.01 | <0.01 | 0.05 | 0.06 | <0.01 | <0.01 | 0.16 | 0.10 | |
| Conjugated linoleic acid | g | <0.01 | <0.01 | <0.01 | <0.01 | <0.01 | <0.01 | <0.01 | <0.01 | <0.01 | <0.01 | |
| Cholesterol | mg | <1.0 | <1.0 | <1.0 | <1.0 | 37.1 | 29.0 | <1.0 | <1.0 | 17.8 | 13.6 | AOAC 994.19 |
| Carbohydrate | g | 44.2 | 45.8 | 47.5 | 47.9 | 36.1 | 31.0 | 49.1 | 44.8 | 41.0 | 40.7 | Calculation |
| Soluble dietary fibre | g | 2.6 | 1.3 | 4.7 | 0.7 | 4.0 | 0.4 | 3.4 | 0.6 | 2.6 | 3.2 | AOAC 991.42; AOAC 985.29 |
| Insoluble dietary fibre | g | 16.6 | 12.4 | 15.8 | 14.0 | 14.6 | 10.3 | 20.9 | 12.0 | 18.4 | 12.3 | AOAC 991.42 |
| Total dietary fibre | g | 19.2 | 13.7 | 20.5 | 14.8 | 18.6 | 10.8 | 24.3 | 12.6 | 21.0 | 15.5 | AOAC 985.29 |
| Total sugars | g | 4.2 | 3.3 | 10.1 | 10.4 | 4.3 | 3.4 | 3.7 | 4.0 | 4.5 | 4.5 | AOAC 982.14 |
| Fructose | g | 2.11 | 2.15 | 2.56 | 2.70 | 1.78 | 1.55 | 1.69 | 1.75 | 1.58 | 1.58 | |
| Glucose | g | 1.30 | 1.17 | 2.56 | 2.99 | 1.61 | 1.40 | 1.20 | 1.60 | 1.00 | 1.45 | |
| Sucrose | g | 0.81 | <0.2 | 5.04 | 4.68 | 0.88 | 0.43 | 0.89 | 0.64 | 2.00 | 1.65 | |
| Maltose | g | <0.5 | <0.5 | <0.5 | <0.5 | <0.5 | <0.5 | <0.5 | <0.5 | <0.5 | <0.5 | |
| Lactose | g | <0.5 | <0.5 | <0.5 | <0.5 | <0.5 | <0.5 | <0.5 | <0.5 | <0.5 | <0.5 | |
| Starch by enzymatic method | % (w/w) | 11.57 | 13.23 | 6.80 | 7.56 | 5.20 | 4.95 | 10.59 | 14.92 | 6.69 | 7.78 | AOAC 979.10 |
| Protein (factor 6.25) | g | 19.53 | 13.59 | 16.34 | 14.54 | 22.87 | 18.79 | 15.66 | 13.91 | 21.38 | 18.86 | AOAC 992.15 |
| Beta carotene | IU | 455 | 510 | 4342 | 3139 | 259 | 288 | 350 | 473 | 1331 | 1596 | AOAC 2001.13 |
| Folate | mcg | 88.7 | 82.6 | 37.4 | 26.3 | 100.1 | 34.0 | 83.8 | 56.5 | 58.5 | 26.8 | AOAC 944.12 |
| Calcium | mg | 124.2 | 88.1 | 144.7 | 102.6 | 172.7 | 118.7 | 112.1 | 85.7 | 107.6 | 70.7 | AOAC 984.27 |
| Iron | mg | 5.2 | 3.9 | 4.7 | 3.6 | 3.0 | 1.6 | 3.7 | 3.1 | 6.1 | 4.5 | AOAC 984.27 |
| Magnesium | mg | 96.5 | 78.7 | 105.1 | 75.2 | 84.1 | 46.0 | 95.2 | 70.6 | 91.4 | 65.9 | AOAC 984.27 |
| Phosphorus | mg | 295.4 | 225.9 | 275.0 | 202.3 | 366.5 | 253.7 | 259.1 | 213.1 | 299.1 | 216.4 | AOAC 984.27 |
| Potassium | mg | 874 | 640 | 860 | 644 | 725 | 234 | 728 | 531 | 788 | 497 | AOAC 984.27 |
| Sodium | mg | 160.9 | 156.7 | 676.8 | 615.6 | 625.0 | 438.6 | 718.4 | 724.5 | 513.6 | 426.4 | AOAC 984.27 |
| Zinc | mg | 2.5 | 2.7 | 2.2 | 2.3 | 2.7 | 1.6 | 2.1 | 2.1 | 3.6 | 3.5 | AOAC 984.27 |
| Moisture | g | 255.2 | 260.2 | 288.1 | 290.5 | 183.4 | 158.0 | 234.2 | 240.8 | 252.0 | 256.6 | AOAC 964.22 Soups; 950.46Ba Casseroles |
| Ash | g | 2.73 | 2.41 | 4.18 | 3.49 | 3.89 | 2.97 | 4.11 | 3.53 | 3.59 | 2.97 | AOAC 920.153 |
| Foods Containing Beans | Foods Containing Peas | |||
|---|---|---|---|---|
| Consumer | Clinical Trial | Consumer | Clinical Trial | |
| Gender | ||||
| Female | 78 (70.9) | 41 (69.5) | 77 (71.3) | 39 (67.2) |
| Male | 32 (29.1) | 18 (30.5) | 31 (28.7) | 19 (32.8) |
| Age | ||||
| 18–24 years | 37 (33.6) | 0 | 36 (33.3) | 0 |
| 25–34 years | 28 (25.5) | 4 (6.8) | 28 (25.9) | 5 (8.6) |
| 35–44 years | 15 (13.6) | 5 (8.5) | 14 (13.0) | 4 (6.9) |
| 45–54 years | 14 (12.7) | 12 (20.3) | 14 (13.0) | 16 (27.6) |
| 55–64 years | 11 (10.0) | 22 (37.3) | 11 (10.2) | 22 (37.9) |
| 65 years and over | 5 (4.5) | 16 (27.1) | 5 (4.6) | 11 (19.0) |
| Total Number | 110 | 59 | 108 | 58 |
| Consumer Participants | Clinical Trial Participants | |||||||||||||||||||
|---|---|---|---|---|---|---|---|---|---|---|---|---|---|---|---|---|---|---|---|---|
| Sample | Pulse Type | F Values | Sample | Pulse Type | F Values | |||||||||||||||
| Attribute | ZC 2 | VS | CC | TS | HS | Bean | Pea | Sample (S) | Pulse (P) | P × S | ZC | VS | CC | TS | HS | Bean | Pea | Sample (S) | Pulse (P) | P × S |
| Aroma 3 | 6.4 b (1.5) | 6.7 ab (1.5) | 6.8 a (1.5) | 6.7 ab (1.6) | 6.5 ab (1.5) | 6.7 (1.5) | 6.6 (1.5) | 3.23 * | 0.98 NS 1 | † | 5.6 c (1.8) | 7.0 a (1.5) | 6.9 ab (1.6) | 6.3 b (1.6) | 7.0 a (1.5) | 6.6 (1.7) | 6.5 (1.7) | 16.83 *** | 0.36 NS | † |
| Appearance 3 | 6.2 bc (1.6) | 7.1 a (1.4) | 6.0 c (1.7) | 5.9 c (1.7) | 6.5 b (1.5) | 6.3 (1.7) | 6.4 (1.6) | 18.78 *** | 0.92 NS | 2.81 * | 6.0 c (1.7) | 7.1a (1.4) | 6.6 ab (1.6) | 6.3 bc (1.7) | 7.0 a (1.5) | 6.8 a (1.6) | 6.4 b (1.7) | 10.43 *** | 12.92 *** | † |
| Flavor 3 | 4.9 c (1.8) | 7.2 ab (1.4) | 7.2 a (1.3) | 6.9 ab (1.5) | 6.8 b (1.6) | 6.5 (1.8) | 6.7 (1.7) | 85.36 *** | 1.71 NS | † | 5.4 c (2.0) | 7.1a (1.7) | 6.9 a (1.7) | 6.3 b (1.8) | 7.3 a (1.6) | 6.6 (2.0) | 6.6 (1.8) | 22.74 *** | 0.08 NS | † |
| Texture 3 | 5.3 b (1.8) | 6.9 a (1.5) | 6.5 a (1.8) | 6.7 a (1.5) | 6.7 a (1.6) | 6.4 (1.8) | 6.4 (1.6) | 35.39 *** | 0.09 NS | 8.90 *** | 5.4 b (2.0) | 6.7a (1.7) | 6.6 a (1.8) | 5.7 b (1.8) | 6.6 a (1.8) | 6.5 a (1.8) | 6.0 b (2.0) | 12.83 *** | 10.92 ** | † |
| Overall Acceptability 3 | 4.9 c (1.7) | 7.1 a (1.4) | 6.8 ab (1.6) | 6.7 ab (1.5) | 6.6 b (1.6) | 6.4 (1.8) | 6.4 (1.7) | 68.15 *** | 0.03 NS | 3.73 ** | 5.5 c (2.2) | 7.2 a (1.5) | 6.8 ab (1.9) | 6.3 b (1.9) | 7.2 a (1.6) | 6.8 a (1.9) | 6.4 b (1.9) | 18.02 *** | 7.18 ** | † |
| FACT 4 | 4.2 c (1.7) | 6.3 a (1.7) | 6.0 ab (1.8) | 6.0 ab (1.5) | 5.8 b (1.7) | 5.6 (1.9) | 5.7 (1.8) | 52.35 *** | 0.07 NS | 3.17 * | 4.6 c (2.2) | 6.5 a (1.7) | 6.1 ab (1.9) | 5.5 b (1.9) | 6.4 a (1.8) | 5.9 (2.1) | 5.8 (2.0) | 20.45 *** | 0.25 NS | † |
© 2018 by the authors. Licensee MDPI, Basel, Switzerland. This article is an open access article distributed under the terms and conditions of the Creative Commons Attribution (CC BY) license (http://creativecommons.org/licenses/by/4.0/).
Share and Cite
Ryland, D.; Zahradka, P.; Taylor, C.G.; Bell, R.C.; Aliani, M. Acceptability of Pulse-Fortified Foods by Two Groups: Participants in a Clinical Trial and Participants in a Consumer Acceptability Panel. Foods 2018, 7, 129. https://doi.org/10.3390/foods7080129
Ryland D, Zahradka P, Taylor CG, Bell RC, Aliani M. Acceptability of Pulse-Fortified Foods by Two Groups: Participants in a Clinical Trial and Participants in a Consumer Acceptability Panel. Foods. 2018; 7(8):129. https://doi.org/10.3390/foods7080129
Chicago/Turabian StyleRyland, Donna, Peter Zahradka, Carla G. Taylor, Rhonda C. Bell, and Michel Aliani. 2018. "Acceptability of Pulse-Fortified Foods by Two Groups: Participants in a Clinical Trial and Participants in a Consumer Acceptability Panel" Foods 7, no. 8: 129. https://doi.org/10.3390/foods7080129
APA StyleRyland, D., Zahradka, P., Taylor, C. G., Bell, R. C., & Aliani, M. (2018). Acceptability of Pulse-Fortified Foods by Two Groups: Participants in a Clinical Trial and Participants in a Consumer Acceptability Panel. Foods, 7(8), 129. https://doi.org/10.3390/foods7080129