Moderate Food Preferences and Depression with Grey Matter as a Potential Mediator: A Large-Scale Longitudinal Study


Abstract
1. Introduction
2. Methods
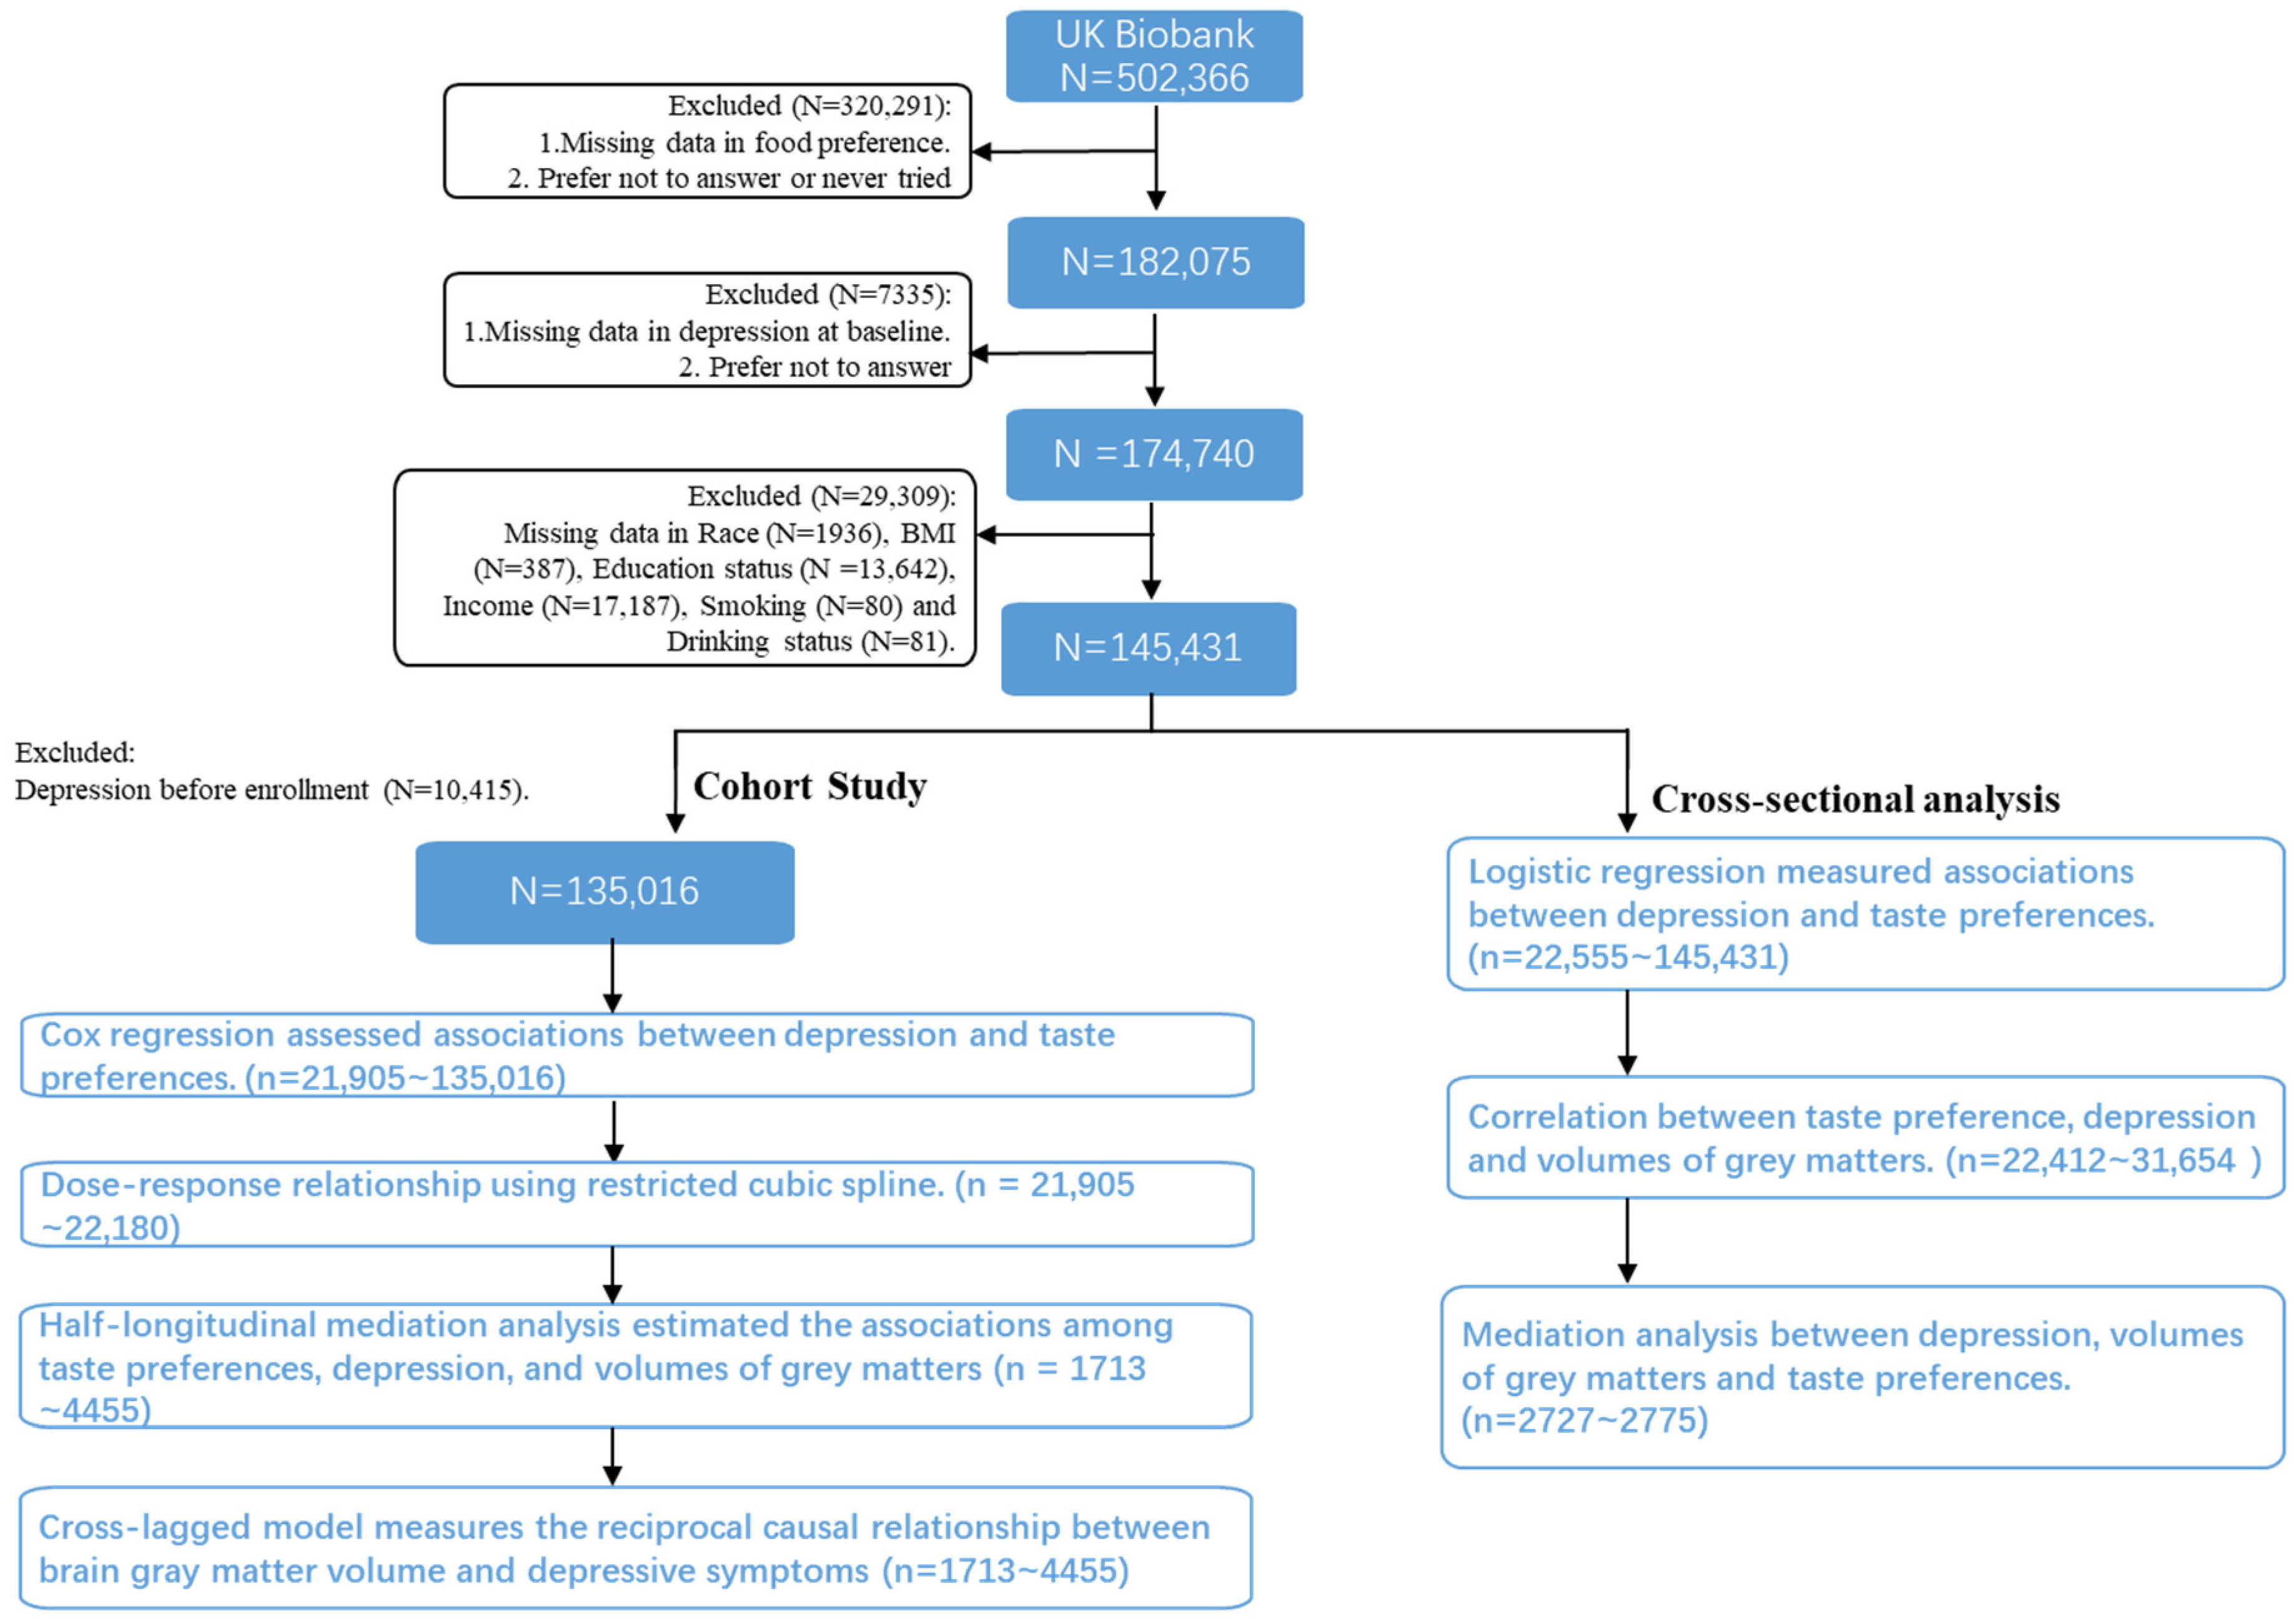
2.1. Study Populations
2.2. Food Preferences Questionnaire
2.3. Depression Outcome
2.4. Brain Magnetic Resonance Imaging
2.5. Covariates
2.6. Statistical Analysis
3. Results
3.1. Baseline Characteristics
3.2. The Associations Between Food Preferences and Depression/Depressive Symptoms: Cohort Study
3.3. The Associations Between Food Preferences and Depressive Symptoms: Cross-Sectional Study
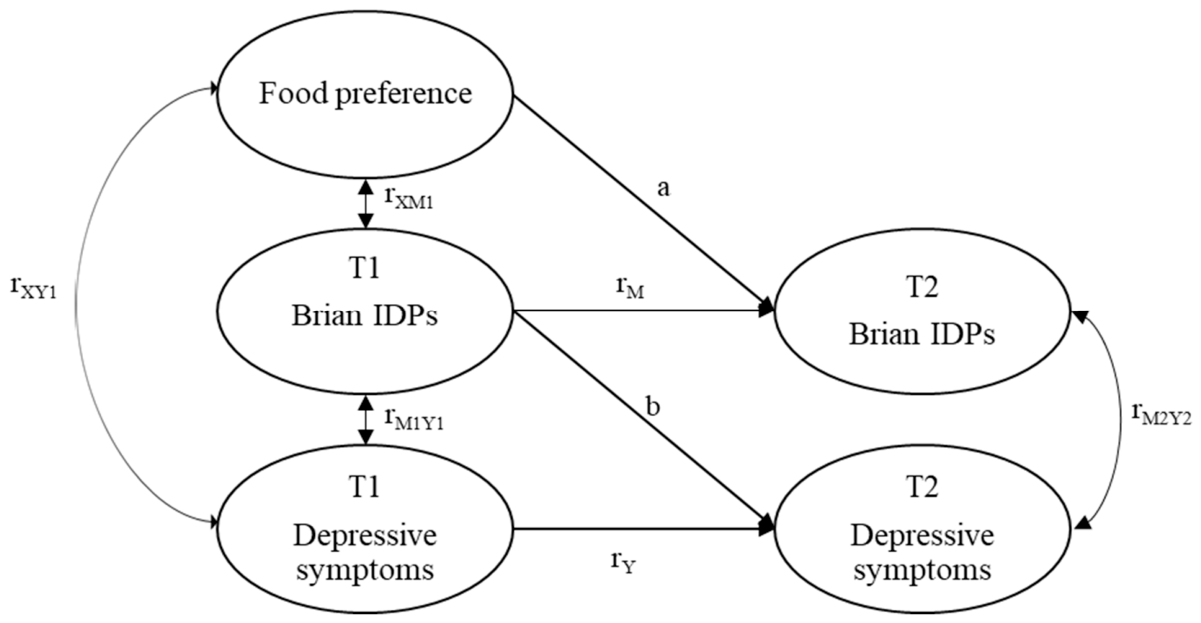
3.4. Half-Longitudinal Mediation Analysis
3.5. Mediation Analysis in Cross-Sectional Study
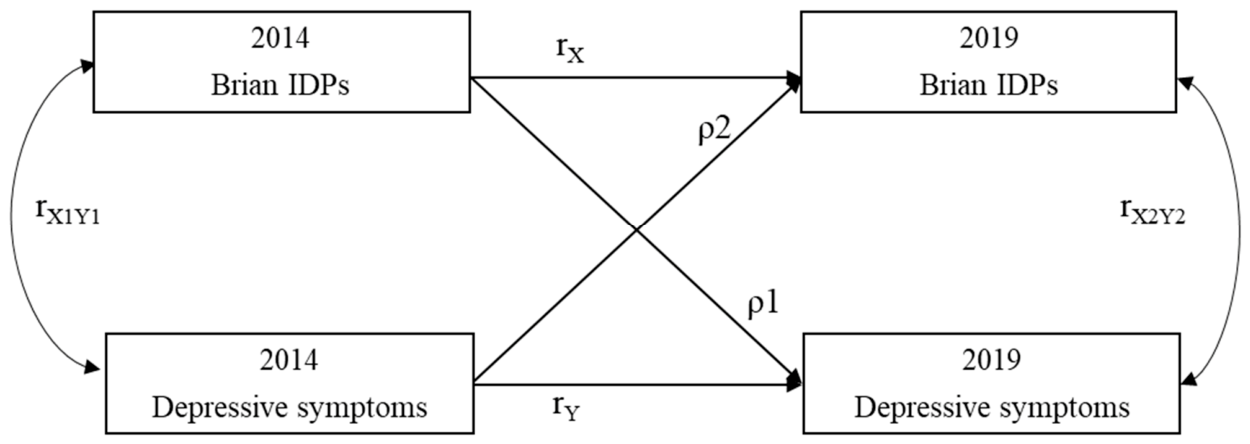
3.6. Cross-Lagged Model in Cohort Study
4. Discussion
5. Conclusions
Supplementary Materials
Author Contributions
Funding
Institutional Review Board Statement
Informed Consent Statement
Data Availability Statement
Conflicts of Interest
Abbreviations
| BMI | Body Mass Index |
| CFI | Comparative Fit Index |
| CMIN/DF | Chi-square/degrees of freedom |
| FFQs | Food Frequency Questionnaires |
| GWAS | Genome-Wide Association Studies |
| ICD-10 | International Classification of Diseases, 10th Revision |
| IDPs | Imaging-Derived Phenotypes |
| PHQ-2 | Patient Health Questionnaire-2 |
| RCS | Restricted Cubic Spline |
| RMSEA | Root Mean Square Error of Approximation |
| SRMR | Standard Root-Mean-Square |
| TLI | Tucker-Lewis Index |
References
- McCarron, R.M.; Shapiro, B.; Rawles, J.; Luo, J. Depression. Ann. Intern. Med. 2021, 174, Itc65–Itc80. [Google Scholar] [CrossRef] [Scilit] [PubMed]
- Rong, J.; Wang, X.; Cheng, P.; Li, D.; Zhao, D. Global, regional and national burden of depressive disorders and attributable risk factors, from 1990 to 2021: Results from the 2021 Global Burden of Disease study. Br. J. Psychiatry 2025, 227, 688–697. [Google Scholar] [CrossRef] [Scilit] [PubMed]
- World Mental Health Today Latest Data. Available online: https://iris.who.int/server/api/core/bitstreams/31714489-1345-4439-8b37-6cbdc52e15ca/content (accessed on 25 July 2026).
- Read, J.R.; Sharpe, L.; Modini, M.; Dear, B.F. Multimorbidity and depression: A systematic review and meta-analysis. J. Affect. Disord. 2017, 221, 36–46. [Google Scholar] [CrossRef] [Scilit] [PubMed]
- Yap, M.B.; Pilkington, P.D.; Ryan, S.M.; Jorm, A.F. Parental factors associated with depression and anxiety in young people: A systematic review and meta-analysis. J. Affect. Disord. 2014, 156, 8–23. [Google Scholar] [CrossRef] [Scilit] [PubMed]
- Cleary, J.L.; Fang, Y.; Zahodne, L.B.; Bohnert, A.S.B.; Burmeister, M.; Sen, S. Polygenic Risk and Social Support in Predicting Depression Under Stress. Am. J. Psychiatry 2023, 180, 139–145. [Google Scholar] [CrossRef] [Scilit] [PubMed]
- Gronemann, F.H.; Jacobsen, R.K.; Wium-Andersen, M.K.; Jørgensen, M.B.; Osler, M.; Jørgensen, T.S.H. Association of Familial Aggregation of Major Depression with Risk of Major Depression. JAMA Psychiatry 2023, 80, 350–359. [Google Scholar] [CrossRef] [Scilit] [PubMed]
- Cruz-Pereira, J.S.; Rea, K.; Nolan, Y.M.; O’Leary, O.F.; Dinan, T.G.; Cryan, J.F. Depression’s Unholy Trinity: Dysregulated Stress, Immunity, and the Microbiome. Annu. Rev. Psychol. 2020, 71, 49–78. [Google Scholar] [CrossRef] [Scilit] [PubMed]
- Machlitt-Northen, S.; Keers, R.; Munroe, P.B.; Howard, D.M.; Trubetskoy, V.; Pluess, M. Polygenic scores for schizophrenia and major depression are associated with psychosocial risk factors in children: Evidence of gene-environment correlation. J. Child Psychol. Psychiatry 2022, 63, 1140–1152. [Google Scholar] [CrossRef] [Scilit] [PubMed]
- Gibson-Smith, D.; Bot, M.; Brouwer, I.A.; Visser, M.; Giltay, E.J.; Penninx, B. Association of food groups with depression and anxiety disorders. Eur. J. Nutr. 2020, 59, 767–778. [Google Scholar] [CrossRef] [Scilit] [PubMed]
- Ekinci, G.N.; Sanlier, N. The relationship between nutrition and depression in the life process: A mini-review. Exp. Gerontol. 2023, 172, 112072. [Google Scholar] [CrossRef] [Scilit] [PubMed]
- Marx, W.; Lane, M.; Hockey, M.; Aslam, H.; Berk, M.; Walder, K.; Borsini, A.; Firth, J.; Pariante, C.M.; Berding, K.; et al. Diet and depression: Exploring the biological mechanisms of action. Mol. Psychiatry 2021, 26, 134–150. [Google Scholar] [CrossRef] [Scilit] [PubMed]
- Molendijk, M.; Molero, P.; Ortuño Sánchez-Pedreño, F.; Van der Does, W.; Angel Martínez-González, M. Diet quality and depression risk: A systematic review and dose-response meta-analysis of prospective studies. J. Affect. Disord. 2018, 226, 346–354. [Google Scholar] [CrossRef] [Scilit] [PubMed]
- Wang, A.; Wan, X.; Zhuang, P.; Jia, W.; Ao, Y.; Liu, X.; Tian, Y.; Zhu, L.; Huang, Y.; Yao, J.; et al. High fried food consumption impacts anxiety and depression due to lipid metabolism disturbance and neuroinflammation. Proc. Natl. Acad. Sci. USA 2023, 120, e2221097120. [Google Scholar] [CrossRef] [Scilit] [PubMed]
- Zou, L.; Tian, Y.; Wang, Y.; Chen, D.; Lu, X.; Zeng, Z.; Chen, Z.; Lin, C.; Liang, Y. High-cholesterol diet promotes depression- and anxiety-like behaviors in mice by impact gut microbe and neuroinflammation. J. Affect. Disord. 2023, 327, 425–438. [Google Scholar] [CrossRef] [Scilit] [PubMed]
- Carbonneau, E.; Bradette-Laplante, M.; Lamarche, B.; Provencher, V.; Bégin, C.; Robitaille, J.; Desroches, S.; Vohl, M.C.; Corneau, L.; Lemieux, S. Development and Validation of the Food Liking Questionnaire in a French-Canadian Population. Nutrients 2017, 9, 337. [Google Scholar] [CrossRef] [Scilit] [PubMed]
- Schatzkin, A.; Kipnis, V.; Carroll, R.J.; Midthune, D.; Subar, A.F.; Bingham, S.; Schoeller, D.A.; Troiano, R.P.; Freedman, L.S. A comparison of a food frequency questionnaire with a 24-hour recall for use in an epidemiological cohort study: Results from the biomarker-based Observing Protein and Energy Nutrition (OPEN) study. Int. J. Epidemiol. 2003, 32, 1054–1062. [Google Scholar] [CrossRef] [Scilit] [PubMed]
- Charlot, K.; Malgoyre, A.; Bourrilhon, C. Proposition for a shortened version of the Leeds Food Preference Questionnaire (LFPQ). Physiol. Behav. 2019, 199, 244–251. [Google Scholar] [CrossRef] [Scilit] [PubMed]
- Birch, L.L. Development of food preferences. Annu. Rev. Nutr. 1999, 19, 41–62. [Google Scholar] [CrossRef] [Scilit] [PubMed]
- Navratilova, H.F.; Whetton, A.D.; Geifman, N. Artificial intelligence driven definition of food preference endotypes in UK Biobank volunteers is associated with distinctive health outcomes and blood based metabolomic and proteomic profiles. J. Transl. Med. 2024, 22, 881. [Google Scholar] [CrossRef] [Scilit] [PubMed]
- Yang, F.; Li, R.; Ren, X.; Cao, B.; Gao, X. Association Between Perceived Levels of Stress and Self-Reported Food Preferences Among Males and Females: A Stated Preference Approach Based on the China Health and Nutrition Survey. Front. Public Health 2022, 10, 850411. [Google Scholar] [CrossRef] [Scilit] [PubMed]
- Ikeda, M.; Brown, J.; Holland, A.J.; Fukuhara, R.; Hodges, J.R. Changes in appetite, food preference, and eating habits in frontotemporal dementia and Alzheimer’s disease. J. Neurol. Neurosurg. Psychiatry 2002, 73, 371–376. [Google Scholar] [CrossRef] [Scilit] [PubMed]
- Nagai, N.; Fujishima, Y.; Tokuzawa, C.; Takayanagi, S.; Yamamoto, M.; Hara, T.; Kimura, Y.; Nagao, H.; Obata, Y.; Fukuda, S.; et al. Food Preference Assessed by the Newly Developed Nutrition-Based Japan Food Preference Questionnaire and Its Association with Dietary Intake in Abdominal-Obese Subjects. Nutrients 2024, 16, 4252. [Google Scholar] [CrossRef] [Scilit] [PubMed]
- Berridge, K.C. ‘Liking’ and ‘wanting’ food rewards: Brain substrates and roles in eating disorders. Physiol. Behav. 2009, 97, 537–550. [Google Scholar] [CrossRef] [Scilit] [PubMed]
- Grogans, S.E.; Fox, A.S.; Shackman, A.J. The Amygdala and Depression: A Sober Reconsideration. Am. J. Psychiatry 2022, 179, 454–457. [Google Scholar] [CrossRef] [Scilit] [PubMed]
- Kroemer, N.B.; Opel, N.; Teckentrup, V.; Li, M.; Grotegerd, D.; Meinert, S.; Lemke, H.; Kircher, T.; Nenadic, I.; Krug, A.; et al. Functional Connectivity of the Nucleus Accumbens and Changes in Appetite in Patients with Depression. JAMA Psychiatry 2022, 79, 993–1003. [Google Scholar] [CrossRef] [Scilit] [PubMed]
- Coccurello, R. Anhedonia in depression symptomatology: Appetite dysregulation and defective brain reward processing. Behav. Brain Res. 2019, 372, 112041. [Google Scholar] [CrossRef] [Scilit] [PubMed]
- Du, M.; Liu, J.; Chen, Z.; Huang, X.; Li, J.; Kuang, W.; Yang, Y.; Zhang, W.; Zhou, D.; Bi, F.; et al. Brain grey matter volume alterations in late-life depression. J. Psychiatry Neurosci. 2014, 39, 397–406. [Google Scholar] [CrossRef] [Scilit] [PubMed]
- May-Wilson, S.; Matoba, N.; Wade, K.H.; Hottenga, J.J.; Concas, M.P.; Mangino, M.; Grzeszkowiak, E.J.; Menni, C.; Gasparini, P.; Timpson, N.J.; et al. Large-scale GWAS of food liking reveals genetic determinants and genetic correlations with distinct neurophysiological traits. Nat. Commun. 2022, 13, 2743. [Google Scholar] [CrossRef] [Scilit] [PubMed]
- Gaudio, S.; Rukh, G.; Di Ciommo, V.; Berkins, S.; Wiemerslage, L.; Schiöth, H.B. Higher fresh fruit intake relates to larger grey matter volumes in areas involved in dementia and depression: A UK Biobank study. NeuroImage 2023, 283, 120438. [Google Scholar] [CrossRef] [Scilit] [PubMed]
- Binnewies, J.; Nawijn, L.; van Tol, M.J.; van der Wee, N.J.A.; Veltman, D.J.; Penninx, B. Associations between depression, lifestyle and brain structure: A longitudinal MRI study. NeuroImage 2021, 231, 117834. [Google Scholar] [CrossRef] [Scilit] [PubMed]
- Simmons, W.K.; Burrows, K.; Avery, J.A.; Kerr, K.L.; Bodurka, J.; Savage, C.R.; Drevets, W.C. Depression-Related Increases and Decreases in Appetite: Dissociable Patterns of Aberrant Activity in Reward and Interoceptive Neurocircuitry. Am. J. Psychiatry 2016, 173, 418–428. [Google Scholar] [CrossRef] [Scilit] [PubMed]
- Du Preez, A.; Lefèvre-Arbogast, S.; González-Domínguez, R.; Houghton, V.; de Lucia, C.; Low, D.Y.; Helmer, C.; Féart, C.; Delcourt, C.; Proust-Lima, C.; et al. Impaired hippocampal neurogenesis in vitro is modulated by dietary-related endogenous factors and associated with depression in a longitudinal ageing cohort study. Mol. Psychiatry 2022, 27, 3425–3440. [Google Scholar] [CrossRef] [Scilit] [PubMed]
- Du Preez, A.; Lefèvre-Arbogast, S.; González-Domínguez, R.; Houghton, V.; de Lucia, C.; Lee, H.; Low, D.Y.; Helmer, C.; Féart, C.; Delcourt, C.; et al. Association of dietary and nutritional factors with cognitive decline, dementia, and depressive symptomatology in older individuals according to a neurogenesis-centred biological susceptibility to brain ageing. Age Ageing 2024, 53, ii47–ii59. [Google Scholar] [CrossRef] [Scilit] [PubMed]
- Contreras-Rodriguez, O.; Reales-Moreno, M.; Fernández-Barrès, S.; Cimpean, A.; Arnoriaga-Rodríguez, M.; Puig, J.; Biarnés, C.; Motger-Albertí, A.; Cano, M.; Fernández-Real, J.M. Consumption of ultra-processed foods is associated with depression, mesocorticolimbic volume, and inflammation. J. Affect. Disord. 2023, 335, 340–348. [Google Scholar] [CrossRef] [Scilit] [PubMed]
- Moore, K.; Hughes, C.F.; Ward, M.; Hoey, L.; McNulty, H. Diet, nutrition and the ageing brain: Current evidence and new directions. Proc. Nutr. Soc. 2018, 77, 152–163. [Google Scholar] [CrossRef] [Scilit] [PubMed]
- Pinto-Sanchez, M.I.; Hall, G.B.; Ghajar, K.; Nardelli, A.; Bolino, C.; Lau, J.T.; Martin, F.P.; Cominetti, O.; Welsh, C.; Rieder, A.; et al. Probiotic Bifidobacterium longum NCC3001 Reduces Depression Scores and Alters Brain Activity: A Pilot Study in Patients with Irritable Bowel Syndrome. Gastroenterology 2017, 153, 448–459.e448. [Google Scholar] [CrossRef] [Scilit] [PubMed]
- Sudlow, C.; Gallacher, J.; Allen, N.; Beral, V.; Burton, P.; Danesh, J.; Downey, P.; Elliott, P.; Green, J.; Landray, M.; et al. UK biobank: An open access resource for identifying the causes of a wide range of complex diseases of middle and old age. PLoS Med. 2015, 12, e1001779. [Google Scholar] [CrossRef] [Scilit] [PubMed]
- Kroenke, K.; Spitzer, R.L.; Williams, J.B. The Patient Health Questionnaire-2: Validity of a two-item depression screener. Med. Care 2003, 41, 1284–1292. [Google Scholar] [CrossRef] [Scilit] [PubMed]
- Jenkinson, M.; Smith, S. A global optimisation method for robust affine registration of brain images. Med. Image Anal. 2001, 5, 143–156. [Google Scholar] [CrossRef] [Scilit] [PubMed]
- Alfaro-Almagro, F.; Jenkinson, M.; Bangerter, N.K.; Andersson, J.L.R.; Griffanti, L.; Douaud, G.; Sotiropoulos, S.N.; Jbabdi, S.; Hernandez-Fernandez, M.; Vallee, E.; et al. Image processing and Quality Control for the first 10,000 brain imaging datasets from UK Biobank. NeuroImage 2018, 166, 400–424. [Google Scholar] [CrossRef] [Scilit] [PubMed]
- Baron, R.M.; Kenny, D.A. The moderator–mediator variable distinction in social psychological research: Conceptual, strategic, and statistical considerations. J. Personal. Soc. Psychol. 1986, 51, 1173–1182. [Google Scholar] [CrossRef] [Scilit] [PubMed]
- Sobel, M.E. Asymptotic confidence intervals for indirect effects in structural equation models. Sociol. Methodol. 1982, 13, 290–312. [Google Scholar] [CrossRef] [Scilit]
- Cole, D.A.; Maxwell, S.E. Testing mediational models with longitudinal data: Questions and tips in the use of structural equation modeling. J. Abnorm. Psychol. 2003, 112, 558–577. [Google Scholar] [CrossRef] [Scilit] [PubMed]
- Hu, L.; Bentler, P.M. Cutoff criteria for fit indexes in covariance structure analysis: Conventional criteria versus new alternatives. Struct. Equ. Model. Multidiscip. J. 1999, 6, 1–55. [Google Scholar] [CrossRef] [Scilit]
- Habhab, S.; Sheldon, J.P.; Loeb, R.C. The relationship between stress, dietary restraint, and food preferences in women. Appetite 2009, 52, 437–444. [Google Scholar] [CrossRef] [Scilit] [PubMed]
- Navratilova, H.F.; Whetton, A.D.; Geifman, N. Integrating Food Preference Profiling, Behavior Change Strategies, and Machine Learning for Cardiovascular Disease Prevention in a Personalized Nutrition Digital Health Intervention: Conceptual Pipeline Development and Proof-of-Principle Study. J. Med. Internet Res. 2025, 27, e75106. [Google Scholar] [CrossRef] [Scilit] [PubMed]
- Fukuda, T.; Ohnuma, T.; Obara, K.; Kondo, S.; Arai, H.; Ano, Y. Supplementation with Matured Hop Bitter Acids Improves Cognitive Performance and Mood State in Healthy Older Adults with Subjective Cognitive Decline. J. Alzheimer’s Dis. 2020, 76, 387–398. [Google Scholar] [CrossRef] [Scilit] [PubMed]
- Fukuda, T.; Ohya, R.; Kobayashi, K.; Ano, Y. Matured Hop Bitter Acids in Beer Improve Lipopolysaccharide-Induced Depression-Like Behavior. Front. Neurosci. 2019, 13, 41. [Google Scholar] [CrossRef] [Scilit] [PubMed]
- Ferraris, C.; Scarlett, C.J.; Bucher, T.; Beckett, E.L. Liking of salt is associated with depression, anxiety, and stress. Chem. Senses 2023, 48, bjad038. [Google Scholar] [CrossRef] [Scilit] [PubMed]
- Zhang, C.; Ma, W.; Chen, Z.; He, C.; Zhang, Y.; Tao, Q. The Association between Spicy Food Consumption and Psychological Health in Chinese College Students: A Cross-Sectional Study. Nutrients 2022, 14, 4508. [Google Scholar] [CrossRef] [Scilit] [PubMed]
- Yu, X.; Zhu, G.; Zhang, Y.; Li, J.; Tang, L.; Xu, Y. Heterogeneity of depressive mood and its influences on adolescents: A latent profile analysis. J. Affect. Disord. 2025, 387, 119431. [Google Scholar] [CrossRef] [Scilit] [PubMed]
- Montero, M.L.; Duizer, L.M.; Ross, C.F. Sensory Perception and Food-Evoked Emotions of Older Adults Assessing Microwave-Processed Meals with Different Salt Concentrations. Foods 2024, 13, 631. [Google Scholar] [CrossRef] [Scilit] [PubMed]
- He, B.; Shao, M.; Wu, J.; Wang, J.; Wei, Z.; Chen, L.; Meng, J. The analgesic effect and neural mechanism of spicy food intake. Soc. Cogn. Affect. Neurosci. 2025, 20, nsaf040. [Google Scholar] [CrossRef] [Scilit] [PubMed]
- Pasierski, M.; Szulczyk, B. Beneficial Effects of Capsaicin in Disorders of the Central Nervous System. Molecules 2022, 27, 2484. [Google Scholar] [CrossRef] [Scilit] [PubMed]
- Barma, M.D.; Purohit, B.M.; Priya, H.; Malhotra, S.; Bhadauria, U.S.; Duggal, R. Sweet Misery: Association of Sugar Consumption with Anxiety and Depression—A Systematic Review. Obes. Rev. Off. J. Int. Assoc. Study Obes. 2025, 27, 1–19. [Google Scholar] [CrossRef] [Scilit] [PubMed]
- Popovic, D.; Weyer, C.; Dwyer, D.B.; Griffiths, S.L.; Lalousis, P.A.; Barnes, N.M.; Vetter, C.; Neuner, L.M.; Buciuman, M.O.; Sarisik, E.; et al. Multivariate Brain-Blood Signatures in Early-Stage Depression and Psychosis. JAMA Psychiatry 2026, 83, 172–184. [Google Scholar] [CrossRef] [Scilit] [PubMed]
- Ancelin, M.L.; Carrière, I.; Artero, S.; Maller, J.; Meslin, C.; Ritchie, K.; Ryan, J.; Chaudieu, I. Lifetime major depression and grey-matter volume. J. Psychiatry Neurosci. 2019, 44, 45–53. [Google Scholar] [CrossRef] [Scilit] [PubMed]
- Vom Hofe, I.; Luik, A.I.; Vernooij, M.W.; van den Berg, E.; Wolters, F.J. Subcortical grey matter structures in relation to symptoms of depression and anxiety on the spectrum from cognitively healthy to dementia. J. Affect. Disord. 2025, 391, 119998. [Google Scholar] [CrossRef] [Scilit] [PubMed]
- Manto, M.; Adamaszek, M.; Apps, R.; Carlson, E.; Guarque-Chabrera, J.; Heleven, E.; Kakei, S.; Khodakhah, K.; Kuo, S.H.; Lin, C.R.; et al. Consensus Paper: Cerebellum and Reward. Cerebellum 2024, 23, 2169–2192. [Google Scholar] [CrossRef] [Scilit] [PubMed]
- Bogoian, H.R.; King, T.Z.; Turner, J.A.; Semmel, E.S.; Dotson, V.M. Linking depressive symptom dimensions to cerebellar subregion volumes in later life. Transl. Psychiatry 2020, 10, 201. [Google Scholar] [CrossRef] [Scilit] [PubMed]



| Traits | All Participants Free from Depression at Baseline (N = 135,016) | Participants with Depression During Follow-Up (N = 5510) | Participants Free of Depression During Follow-Up (N = 129,506) | p-Values * |
|---|---|---|---|---|
| Age | 55.42 (7.68) | 57.50 (7.66) | 55.33 (7.66) | <0.001 |
| Sex | 0.63 | |||
| Female | 73,928 (54.75%) | 2999 (54.43%) | 70,929 (54.77%) | |
| Male | 61,088 (45.25%) | 2511 (45.57%) | 58,577 (45.23%) | |
| Ethnic background | 0.022 | |||
| White | 137,714 (97.32%) | 5395 (97.91%) | 126,011 (97.30%) | |
| Mixed | 683 (0.51%) | 25 (0.45%) | 658 (0.51%) | |
| Asian or Asian British | 1087 (0.80%) | 34 (0.62%) | 1053 (0.81%) | |
| Black or Black British | 874 (0.65%) | 31 (0.56%) | 843 (0.65%) | |
| Chinese | 299 (0.22%) | 2 (0.03%) | 297 (0.23%) | |
| Other ethnic group | 667 (0.49%) | 23 (0.42%) | 644 (0.50%) | |
| Average total household income | <0.001 | |||
| Less than 18,000 | 14,661 (10.86%) | 1024 (18.58%) | 13,637 (10.53%) | |
| 18,000 to 30,999 | 30,006 (22.22%) | 1556 (28.24%) | 28,450 (21.97%) | |
| 31,000 to 51,999 | 40,173 (29.75%) | 1563 (28.37%) | 38,610 (29.81%) | |
| 52,000 to 100,000 | 38,321 (28.38%) | 1107 (20.09%) | 37,214 (28.74%) | |
| Greater than 100,000 | 11,855 (8.78%) | 260 (4.72%) | 11,595 (8.95%) | |
| BMI | 26.58 (4.42) | 27.90 (5.28) | 26.52 (4.37) | <0.001 |
| Smoke | <0.001 | |||
| Never | 79,569 (58.93%) | 2700 (49.00%) | 76,869 (59.36%) | |
| Previous | 46,282 (34.27%) | 2219 (40.27%) | 44,063 (34.02%) | |
| Current | 9165 (6.78%) | 576 (10.54%) | 8589 (6.63%) | |
| Education | <0.001 | |||
| College or University degree | 738,211 (50.76%) | 2498 (45.34%) | 66,035 (50.99%) | |
| A levels/AS levels or equivalent | 19,418 (14.38%) | 777 (14.10%) | 18,641 (14.39%) | |
| O levels/GCSEs or equivalent | 27,670 (20.49%) | 1270 (23.05%) | 26,400 (20.39%) | |
| CSEs or equivalent | 5113 (3.79%) | 228 (4.14%) | 4885 (3.77%) | |
| NVQ or HND or HNC or equivalent | 7236 (5.36%) | 408 (7.40%) | 6828 (5.27%) | |
| Other professional qualifications, e.g., nursing, teaching | 7046 (5.22%) | 329 (5.97%) | 6717 (5.19%) | |
| Drink | <0.001 | |||
| Never | 3293 (2.44%) | 169 (3.06%) | 3124 (2.41%) | |
| Previous | 3062 (2.27%) | 217 (3.94%) | 2845 (2.20%) | |
| Current | 128,661 (95.29%) | 5122 (92.95%) | 123,539 (95.39%) | |
| Physical activity | <0.001 | |||
| Walking for pleasure (not as a means of transport) | 75,257 (55.74%) | 2884 (52.34%) | 72,373 (55.88%) | |
| Other exercises (e.g., swimming, cycling, keep fit, bowling) | 11,952 (8.85%) | 479 (8.69%) | 11,473 (8.86%) | |
| Strenuous sports | 869 (0.64%) | 25 (0.45%) | 844 (0.65%) | |
| Light DIY (e.g., pruning, watering the lawn) | 4957 (3.67%) | 289 (5.25%) | 4668 (3.60%) | |
| Heavy DIY (e.g., weeding, lawn mowing, carpentry, digging) | 1470 (1.09%) | 82 (1.49%) | 1388 (1.07%) | |
| Systolic blood pressure | 135.94 (17.95) | 137.64 (18.22) | 135.87 (17.93) | <0.001 |
| Diastolic blood pressure | 81.71 (9.95) | 82.27 (10.09) | 81.69 (9.94) | <0.001 |
| Total Cholesterol | 4.61 (0.91) | 4.52 (0.97) | 4.61 (0.90) | <0.001 |
| HDL Cholesterol | 1.33 (0.33) | 1.32 (0.34) | 1.34 (0.33) | 0.04 |
| Total Triglycerides | 1.25 (0.55) | 1.29 (0.59) | 1.24 (0.55) | 0.002 |
| Glucose | 3.48 (0.99) | 3.58 (1.33) | 3.48 (0.97) | 0.005 |
| Variable | Model 1 HR (95%CI) | Model 2 HR (95%CI) | Model 3 HR (95%CI) | p for Trend |
|---|---|---|---|---|
| Liking for bitter foods | 0.005 | |||
| 1 | 1.322 (1.212~1.442) ** | 1.267 (1.160~1.383) ** | 1.210 (0.985~1.487) | |
| 2 | 1.090 (0.984~1.208) | 1.062 (0.959~1.178) | 0.850 (0.658~1.098) | |
| 3 | 1.034 (0.938~1.140) | 1.023 (0.927~1.127) | 0.996 (0.791~1.254) | |
| 4 | 0.921 (0.835~1.016) | 0.921 (0.835~1.016) | 0.822 (0.647~1.043) | |
| 5 | Ref | Ref | Ref | |
| 6 | 0.861 (0.784~0.946) ** | 0.884 (0.804~0.971) ** | 0.800 (0.637~1.005) | |
| 7 | 0.839 (0.762~0.923) ** | 0.860 (0.781~0.947) ** | 0.698 (0.547~0.891) ** | |
| 8 | 0.754 (0.657~0.865) ** | 0.771 (0.672~0.885) ** | 0.886 (0.651~1.204) | |
| 9 | 0.973 (0.810~1.170) | 1.004 (0.835~1.207) | 0.732 (0.441~1.215) | |
| Liking for salty foods | 0.305 | |||
| 1 | 1.071 (0.963~1.191) | 1.020 (0.916~1.134) | 0.993 (0.780~1.266) | |
| 2 | 0.956 (0.849~1.077) | 0.919 (0.816~1.036) | 0.895 (0.679~1.178) | |
| 3 | 0.976 (0.872~1.092) | 0.950 (0.849~1.063) | 0.983 (0.763~1.265) | |
| 4 | 0.909 (0.812~1.018) | 0.907 (0.810~1.015) | 1.053 (0.826~1.342) | |
| 5 | Ref | Ref | Ref | |
| 6 | 0.863 (0.779~0.956) ** | 0.893 (0.806~0.989) * | 0.895 (0.710~1.128) | |
| 7 | 0.879 (0.794~0.973) * | 0.924 (0.834~1.022) | 0.932 (0.742~1.172) | |
| 8 | 0.834 (0.736~0.944) ** | 0.889 (0.785~1.007) | 0.707 (0.526~0.951) * | |
| 9 | 0.965(0.834~1.117) | 1.047 (0.904~1.212) | 0.915 (0.649~1.290) | |
| Liking for spicy foods | 0.001 | |||
| 1 | 1.208 (1.061~1.374) ** | 1.186 (1.042~1.349) ** | 0.959 (0.719~1.280) | |
| 2 | 1.144 (0.986~1.329) | 1.125 (0.969~1.307) | 0.714 (0.495~1.031) | |
| 3 | 0.998 (0.858~1.160) | 0.991 (0.852~1.153) | 0.713 (0.497~1.023) | |
| 4 | 0.933 (0.806~1.081) | 0.937 (0.809~1.085) | 0.704 (0.502~0.989) * | |
| 5 | Ref | Ref | Ref | |
| 6 | 0.857 (0.760~0.966) * | 0.900 (0.798~1.015) | 0.754 (0.577~0.984) * | |
| 7 | 0.802 (0.717~0.898) ** | 0.852 (0.761~0.953) ** | 0.635 (0.494~0.816) ** | |
| 8 | 0.741 (0.660~0.831) ** | 0.802 (0.714~0.900) ** | 0.623 (0.482~0.806) ** | |
| 9 | 0.816 (0.727~0.915) ** | 0.915 (0.816~1.027) | 0.651 (0.503~0.842) ** | |
| Liking for sweet foods | 0.222 | |||
| 1 | 1.042 (0.896~1.211) | 0.994 (0.855~1.156) | 1.139 (0.803~1.617) | |
| 2 | 0.973 (0.848~1.116) | 0.950 (0.828~1.090) | 1.157 (0.842~1.591) | |
| 3 | 0.822 (0.724~0.934) ** | 0.813 (0.715~0.923) ** | 1.004 (0.745~1.353) | |
| 4 | 0.947 (0.843~1.065) | 0.951 (0.846~1.070) | 0.986 (0.738~1.318) | |
| 5 | Ref | Ref | Ref | |
| 6 | 0.854 (0.776~0.940) ** | 0.886 (0.805~0.976) * | 1.008 (0.794~1.280) | |
| 7 | 0.875 (0.798~0.961) ** | 0.913 (0.832~1.002) | 1.036 (0.822~1.305) | |
| 8 | 0.937 (0.848~1.036) | 0.986 (0.892~1.090) | 1.105 (0.862~1.418) | |
| 9 | 1.054 (0.950~1.170) | 1.149 (1.035~1.275) ** | 1.250 (0.966~1.617) |
| X | Mediators | CHIS/DF | RMSEA | CFI | SRMR | TLI |
|---|---|---|---|---|---|---|
| Liking for salty foods | Volume of peripheral cortical grey matter | 2.048 | 0.018 | 1.000 | 0.008 | 0.999 |
| Liking for salty foods | Volume of ventricular cerebrospinal fluid | 1.990 | 0.017 | 1.000 | 0.009 | 0.999 |
| Liking for salty foods | Volume of grey matter | 1.926 | 0.017 | 1.000 | 0.008 | 0.999 |
| Liking for salty foods | Volume of brain, grey+white matter | 1.902 | 0.017 | 1.000 | 0.008 | 0.999 |
| Liking for sweet foods | Volume of grey matter in Lateral Occipital Cortex, inferior division (right) | 4.757 | 0.032 | 0.999 | 0.011 | 0.997 |
| Liking for sweet foods | Volume of grey matter in Planum Temporale (left) | 4.863 | 0.032 | 0.999 | 0.011 | 0.997 |
| Liking for sweet foods | Volume of grey matter in VI Cerebellum (vermis) | 4.763 | 0.032 | 0.999 | 0.011 | 0.996 |
| X | Mediators | rXY1 | rM1Y1 | rXM1 | rM2Y2 | rM | rY | a | b | ab (95%CI) a |
|---|---|---|---|---|---|---|---|---|---|---|
| Liking for salty foods | Volume of peripheral cortical grey matter | 1.47 × 10⁻¹ ** | 4.96 × 10⁻² ** | 1.78 × 10⁻¹ ** | −2.25 × 10⁻³ | 9.47 × 10⁻¹ ** | 5.24 × 10⁻¹ ** | 6.76 × 10⁻³ * | 3.91 × 10⁻² * | 5.60 × 10⁻⁵ (8.95 × 10⁻⁶, 1.21 × 10⁻⁴) |
| Liking for salty foods | Volume of ventricular cerebrospinal fluid | 1.47 × 10⁻¹ ** | −5.14 × 10⁻² ** | −1.61 × 10⁻¹ ** | 2.68 × 10⁻³ | 9.79 × 10⁻¹ ** | 5.24 × 10⁻¹ ** | −2.84 × 10⁻³ * | −3.93 × 10⁻² ** | 2.00 × 10⁻⁵ (2.69 × 10⁻⁶, 4.20 × 10⁻⁵) |
| Liking for salty foods | Volume of grey matter | 1.47 × 10⁻¹ ** | 4.65 × 10⁻² ** | 1.85 × 10⁻¹ ** | −2.98 × 10⁻³ | 9.40 × 10⁻¹ ** | 5.23 × 10⁻¹ ** | 6.19 × 10⁻³ * | 4.57 × 10⁻² ** | 5.92 × 10⁻⁵ (8.52 × 10⁻⁶, 1.24 × 10⁻⁴) |
| Liking for salty foods | Volume of brain, grey + white matter | 1.47 × 10⁻¹ ** | 4.14 × 10⁻² * | 1.85 × 10⁻¹ ** | −2.45 × 10⁻³ | 9.46 × 10⁻¹ ** | 5.23 × 10⁻¹ ** | 4.85 × 10⁻³ * | 4.60 × 10⁻² ** | 4.47 × 10⁻⁵ (5.28 × 10⁻⁶, 1.06 × 10⁻⁴) |
| Liking for sweet foods | Volume of grey matter in Lateral Occipital Cortex, inferior division (right) | 6.79 × 10⁻² * | 3.57 × 10⁻³ | −9.24 × 10⁻³ | 8.73 × 10⁻⁴ | 9.71 × 10⁻¹ ** | 5.34 × 10⁻¹ ** | 4.86 × 10⁻³ * | −2.75 × 10⁻² * | −1.18 × 10⁻⁴ (−2.99 × 10⁻⁴, −9.21 × 10⁻⁷) |
| Liking for sweet foods | Volume of grey matter in VI Cerebellum (vermis) | 6.79 × 10⁻² * | 3.47 × 10⁻³ | 4.89 × 10⁻² | 3.05 × 10⁻³ | 9.30 × 10⁻¹ ** | 5.34 × 10⁻¹ ** | 1.01 × 10⁻² ** | 3.27 × 10⁻² * | −1.11 × 10⁻⁴ (−2.68 × 10⁻⁴, −1.05 × 10⁻⁵) |
| Liking for sweet foods | Volume of grey matter in Planum Temporale (left) | 6.79 × 10⁻² * | 2.50 × 10⁻² | 3.77 × 10⁻² | 1.88 × 10⁻³ | 9.78 × 10⁻¹ ** | 5.35 × 10⁻¹ ** | 3.17 × 10⁻³ * | −2.61 × 10⁻² * | 3.42 × 10⁻⁴ (8.79 × 10⁻⁵, 7.31 × 10⁻⁴) |
| Brain Volumes | ρ1 | p-Value | ρ2 | p-Value |
|---|---|---|---|---|
| Volume of grey matter in VI Cerebellum (vermis) | 1.22 × 10⁻⁴ | 0.014 | −3.68 | 0.047 |
| Volume of grey matter in Lateral Occipital Cortex, inferior division (right) | −2.07 × 10⁻⁵ | 0.028 | −8.64 | 0.203 |
| Volume of grey matter in Planum Temporale (left) | −3.01 × 10⁻⁵ | 0.230 | 0.41 | 0.820 |
| Volume of peripheral cortical grey matter (normalised for head size) | −4.74 × 10⁻⁷ | 0.279 | 40.46 | 0.868 |
| Volume of grey matter (normalised for head size) | −1.90 × 10⁻⁷ | 0.620 | 49.36 | 0.865 |
| Volume of ventricular cerebrospinal fluid (normalised for head size) | 1.81 × 10⁻⁷ | 0.813 | −3.46 | 0.949 |
| Volume of brain, grey+white matter (normalised for head size) | −5.25 × 10⁻⁹ | 0.980 | −159.04 | 0.718 |
Disclaimer/Publisher’s Note: The statements, opinions and data contained in all publications are solely those of the individual author(s) and contributor(s) and not of MDPI and/or the editor(s). MDPI and/or the editor(s) disclaim responsibility for any injury to people or property resulting from any ideas, methods, instructions or products referred to in the content. |
© 2026 by the authors. Licensee MDPI, Basel, Switzerland. This article is an open access article distributed under the terms and conditions of the Creative Commons Attribution (CC BY) license.
Share and Cite
Cao, Y.; Li, Z.; Wang, T.; Guo, T.; Zhang, D. Moderate Food Preferences and Depression with Grey Matter as a Potential Mediator: A Large-Scale Longitudinal Study. Foods 2026, 15, 2963. https://doi.org/10.3390/foods15172963
Cao Y, Li Z, Wang T, Guo T, Zhang D. Moderate Food Preferences and Depression with Grey Matter as a Potential Mediator: A Large-Scale Longitudinal Study. Foods. 2026; 15(17):2963. https://doi.org/10.3390/foods15172963
Chicago/Turabian StyleCao, Yi, Zhaoying Li, Tong Wang, Tengxiao Guo, and Dongfeng Zhang. 2026. "Moderate Food Preferences and Depression with Grey Matter as a Potential Mediator: A Large-Scale Longitudinal Study" Foods 15, no. 17: 2963. https://doi.org/10.3390/foods15172963
APA StyleCao, Y., Li, Z., Wang, T., Guo, T., & Zhang, D. (2026). Moderate Food Preferences and Depression with Grey Matter as a Potential Mediator: A Large-Scale Longitudinal Study. Foods, 15(17), 2963. https://doi.org/10.3390/foods15172963