Survey Validation and Optimization to Assess Public Awareness of Origin Protected Designation (PDO) Cheeses: Majorero and Palmero Cases

 ,
,  ,
,  ,
,
Abstract
1. Introduction
2. Materials and Methods
2.1. Sampling Procedure
2.2. Sample, Respondent Profile and Demographics
- •
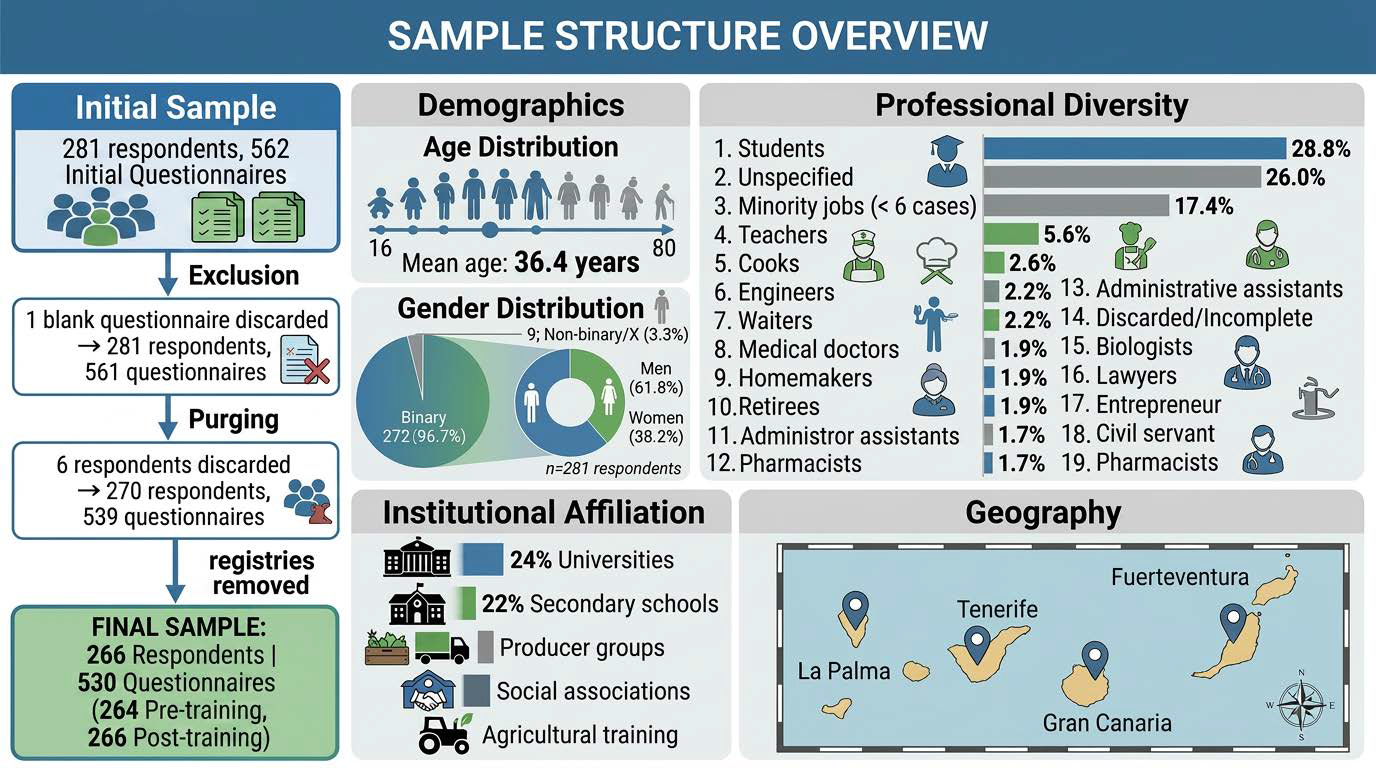
- Age: Participants ranged in age from 16 to 80 years (mean ± SD: 36.4 ± 17.1 years). The inclusion of participants aged 16 years reflected the eligibility criteria for the organized training activities and was consistent with the applicable ethical procedures. Age was analyzed as a continuous quantitative variable to preserve statistical information and avoid arbitrary categorization. The age distribution was skewed toward younger participants, with 25% younger than 20 years, 50% younger than 32 years, and 75% younger than 52 years.
- •
- Binary Gender: Initial sample comprised 333 questionnaires from 167 men (61.8%) and 210 questionnaires from 105 women (38.2%).
- •
- Non-Binary Gender: 18 questionnaires from 9 respondents (3.3%) identifying as “X” or non-binary and 543 from 272 binary respondents (96.7%).
- •
- Profession: Occupations were diverse, led by students (155; 28.8%), followed by teachers (30; 5.6%), cooks (14; 2.6%), engineers (12; 2.2%), waiter (12; 2.2%), medical doctors (10; 1.9%), homemakers (10; 1.9%), retirees (10; 1.9%), administrative assistants (10; 1.9%), biologists (9; 1.7%), lawyers (8; 1.5%), entrepreneur (8; 1.5%), civil servant (8; 1.5%) and pharmacists (8; 1.5%). A 17.4% was represented by minority job possibilities below 6 cases. In further 140 questionnaires (26%), respondents did not specify a profession, and 9 (1.7%) questionnaires were discarded due to the finding of incomplete registries.
- •
- Recruitment setting: Participants were recruited through a broad range of educational institutions, professional organizations, and community groups across the Canary Islands. The largest proportions were recruited from secondary schools (22%) and universities (24%), followed by agricultural training centers (9%), cultural or social associations (11%), and producer or professional organizations (15%). Smaller proportions (<5%) were recruited from research institutes, local businesses, and specialized training courses. Recruitment was conducted across Fuerteventura, Tenerife, Gran Canaria, and La Palma, ensuring representation of both the general public and stakeholders associated with the cheese sector.
2.3. Survey Design and Structure
- 1.
- Sociodemographic Information (6 items)
- ∘
- Age, gender, profession, and a personal identifier code to ensure anonymity and data protection.
- ∘
- Cheese preference (yes/no).
- ∘
- Previous training in sensory analysis (yes/no), including an open field to specify the product(s).
- 2.
- General Knowledge and Training (5 items, including 1 open-ended)
- ∘
- Self-assessed knowledge of Canarian cheeses, PDOs, and sensory analysis (3 items, each scored on a 3-point scale: low, medium, high).
- ∘
- Previous training in sensory analysis (1 item, yes/no).
- ∘
- Specification of product(s) evaluated in training (1 open response).
- 3.
- Sensory Perception and Self-Assessment (27 items). Respondents rated their ability to identify sensory parameters on a 5-point Likert scale (1 = very difficult, 5 = very easy).
- ∘
- Visual and textural attributes (12 items): external appearance, appearance when cut, tactile texture, roughness, elasticity, humidity, texture in mouth, firmness, friability, oral humidity, adherence, solubility, and granulosity.
- ∘
- Olfactory attributes (7 items): general aroma, intensity, lactic family, vegetal family, fruity family, roasted family, and spices family, with an open option for “other families.”
- ∘
- Taste attributes (8 items): salty, sweet, acidic, bitter, spicy, astringent, aftertaste, and persistence, with an open option for “other tastes.”
- 4.
- Knowledge and Perceptions of PDO (69 items total)Statements were evaluated as true, false, or don’t know (NS).
- ∘
- General PDO knowledge (29 items): addressed hygienic–sanitary guarantees, added value, sustainability, fraud prevention, territorial link, breed association, production rules, labeling, EU protection, permitted species, and producer/administration responsibilities.
- ∘
- PDO Majorero (20 items): covered permitted breeds and herdbook standards, production zones, use of sheep milk, maturation practices, labeling requirements, counter-labels, coatings, use of coagulants, role of the breed, and producer registration.
- ∘
- PDO Palmero (20 items): mirrored the Majorero block, addressing Palmera goat requirements, production zones, maturation practices, labeling, coatings, use of coagulants, role of the breed, and producer registration.
- 5.
- Labeling and Differentiation (7 items: 5 ranked + 2 open-ended)
- ∘
- Ranking task (1–5) of factors that should differentiate PDO cheeses on labels: island, breed, feeding system, producer, and production method.
- ∘
- Open fields for additional labeling elements (e.g., “other elements to be included”) and for final comments.
2.4. Survey Administration
2.5. Survey Timing Rationale
2.6. Educational Intervention
2.7. Statistical Analysis
2.7.1. A Priori Assumptions
2.7.2. Canonical Discriminant Analysis (CDA)
- Hypothesis–Error (HE) plots visualize explained (H) vs. residual (E) variation. Ellipses representing group means indicate separation: an elongated H ellipse relative to a circular E ellipse denotes strong discrimination. Wilks’ Lambda is computed as Λ = |E|/|E + H|, with smaller Λ indicating stronger group separation. Permutation tests (e.g., 10,000 iterations) assess significance when assumptions are unmet. Although XLSTAT does not produce HE plots directly, canonical score plots serve as a useful proxy for visualizing group separation.
2.7.3. Explanatory Variables
2.7.4. Clustering Variable
2.7.5. Variable Selection
2.7.6. Sample Size
2.7.7. Multicollinearity
2.7.8. Canonical Correlation and Model Reliability
2.7.9. Tests of Model Adequacy
2.7.10. Standardized Discriminant Coefficients and Loadings
2.7.11. Cross-Validation
2.7.12. Post Hoc Statistical Power Analysis
3. Results
3.1. A Priori Assumptions
3.2. Descriptive Statistics
3.3. Canonical Discriminant Analysis
3.3.1. Multicollinearity Analysis
3.3.2. Canonical Correlation Dimensions, Efficiency and Model Reliability
Canonical Correlation Dimensions and Bartlett’s Test
Wilks’ Lambda Test
Pillai’s Trace Criterion
Canonical Standardized Coefficients, Loadings, and Spatial Representation
Cross-Validation
3.4. Post Hoc Statistical Power Analysis
4. Discussion
5. Conclusions
Supplementary Materials
Author Contributions
Funding
Institutional Review Board Statement
Informed Consent Statement
Data Availability Statement
Acknowledgments
Conflicts of Interest
Abbreviations
| PDO | Protected Designation of Origin |
| EU | European Union |
| ICIA | Instituto Canario de Investigaciones Agrarias |
| ANCAM | Asociación Nacional de Criadores de Cabras de Raza Majorera |
| ACP | Asociación de Criadores de Cabra Palmera |
| CDA | Canonical Discriminant Analysis |
| LOOCV | Leave-One-Out Cross-Validation |
| ROC | Receiver Operating Characteristic |
| AUC | Area Under the Curve |
| VIF | Variance Inflation Factor |
| ROUT | Robust Regression and Outlier Removal |
| HE | Hypothesis–Error |
| PGI | Protected Geographical Indication |
| SD | Standard Deviation |
| SPSS | Statistical Package for the Social Sciences |
References
- Lambert-Derkimba, A.; Minéry, S.; Barbat, A.; Casabianca, F.; Verrier, E. Consequences of the inscription of local breeds in protected designation of origin cow cheese specifications for the genetic management of the herds. Animal 2010, 4, 1976–1986. [Google Scholar] [CrossRef] [Scilit] [PubMed]
- Erraach, Y.; Sayadi, S.; Parra-López, C. Consumer-stated preferences towards Protected Designation of Origin (PDO) labels in a traditional olive-oil-producing country: The case of Spain. New Medit 2014, 13, 11–19. [Google Scholar]
- Magliulo, R.; Valentino, V.; Balivo, A.; Esposito, A.; Genovese, A.; Ercolini, D.; De Filippis, F. Microbiome signatures associated with flavor development differentiate Protected Designation of Origin water Buffalo Mozzarella cheese from different production areas. Food Res. Int. 2024, 192, 114798. [Google Scholar] [CrossRef] [Scilit] [PubMed]
- Moatsou, G.; Govaris, A. White brined cheeses: A diachronic exploitation of small ruminants milk in Greece. Small Rumin. Res. 2011, 101, 113–121. [Google Scholar] [CrossRef] [Scilit]
- Moatsou, G.; Samolada, M.; Katsabeki, A.; Anifantakis, E. Casein fraction of ovine milk from indigenous Greek breeds. Le Lait 2004, 84, 285–296. [Google Scholar] [CrossRef] [Scilit]
- Balivo, A.; Masucci, F.; Parlato, S.; Serrapica, F.; Romano, R.; Di Francia, A.; Genovese, A. Can hydroponic forage affect the chemical and sensory properties of PDO buffalo Mozzarella cheese? Int. J. Dairy Technol. 2025, 78, e13147. [Google Scholar] [CrossRef] [Scilit]
- Freitas, A.C.; Macedo, A.C.; Malcata, F.X. Review: Technological and sensory aspects of cheeses with designation of origin produced in the Iberian Peninsula from sheep and goat milk. Food Sci. Technol. Int. 2000, 6, 351–370. [Google Scholar] [CrossRef] [Scilit]
- Ministerio de Agricultura, Pesca y Alimentación. Orden de 6 de septiembre de 1996 por la que se ratifica el Reglamento de la Denominación de Origen Queso Majorero y de su Consejo Regulador. Bol. Of. Estado 1996, 223, 27883–27890. [Google Scholar]
- Cardin, M.; Cardazzo, B.; Mounier, J.; Novelli, E.; Coton, M.; Coton, E. Authenticity and typicity of traditional cheeses: A review on geographical origin authentication methods. Foods 2022, 11, 3379. [Google Scholar] [CrossRef] [Scilit] [PubMed]
- Winkler, A.M.; Renaud, O.; Smith, S.M.; Nichols, T.E. Permutation inference for canonical correlation analysis. NeuroImage 2020, 220, 117065. [Google Scholar] [CrossRef] [Scilit] [PubMed]
- Ministerio de Agricultura, Pesca y Alimentación. Orden de 31 de agosto de 2001 por la que se ratifica el Reglamento de la Denominación de Origen “Queso Palmero” y de su Consejo Regulador. Bol. Of. Estado 2001, 218, 34210–34217. [Google Scholar]
- Fresno, M.; Álvarez, S.; Arteaga, A.L.; Benito, D.T.; Esparza, M.R.; Fabelo, F.; Fernández, E.; González, E.; González, R.; Martínez, A.; et al. Caracterización de la producción de queso en las Islas Canarias (España). Actas Iberoam. Conserv. Anim. 2012, 2, 243–247. [Google Scholar]
- Fresno Baquero, M.R.; Álvarez Ríos, S. Análisis Sensorial de Los Quesos de Cabra de Pasta Prensada: Queso Majorero DOP Y Queso Palmero DOP; Instituto Canario de Investigaciones Agrarias: Tenerife, Spain, 2007. [Google Scholar]
- Castro, N.; Capote, J.; Bruckmaier, R.M.; Argüello, A. Effects of milking frequency on the milk yield and milk composition of dairy goats. J. Dairy Sci. 2009, 92, 1903–1907. [Google Scholar] [CrossRef] [Scilit] [PubMed]
- Argüello, A.; Castro, N.; Capote, J.; Solomon, M.; Alvarez, S. Effects of diet and live weight at slaughter on kid meat quality. Meat Sci. 2005, 70, 173–179. [Google Scholar] [CrossRef] [Scilit] [PubMed]
- Török, Á.; Gorton, M.; Yeh, C.-H.; Czine, P.; Balogh, P. Understanding consumers’ preferences for protected geographical indications: A choice experiment with Hungarian sausage consumers. Foods 2022, 11, 997. [Google Scholar] [CrossRef] [Scilit] [PubMed]
- Monier-Dilhan, S. Food labels: Consumer’s information or consumer’s confusion. OCL 2018, 25, 9. [Google Scholar] [CrossRef] [Scilit]
- Thøgersen, J. How does origin labelling on food packaging influence consumer product evaluation and choices? A systematic literature review. Food Policy 2023, 119, 102503. [Google Scholar] [CrossRef] [Scilit]
- Savelli, E.; Bravi, L.; Francioni, B.; Murmura, F.; Pencarelli, T. PDO labels and food preferences: Results from a sensory analysis. Br. Food J. 2020, 123, 1170–1189. [Google Scholar] [CrossRef] [Scilit]
- Menozzi, D.; Yeh, C.-H.; Cozzi, E.; Arfini, F. Consumer preferences for cheese products with quality labels: The case of Parmigiano Reggiano and Comté. Animals 2022, 12, 1299. [Google Scholar] [CrossRef] [Scilit] [PubMed]
- Teuber, R. Consumers’ and producers’ expectations towards geographical indications: Empirical evidence for a German case study. Br. Food J. 2011, 113, 900–918. [Google Scholar] [CrossRef] [Scilit]
- Fandos Herrera, C.; Flavián Blanco, C. Consequences of consumer trust in PDO food products: The role of familiarity. J. Prod. Brand Manag. 2011, 20, 282–296. [Google Scholar] [CrossRef] [Scilit]
- Moreira, M.J.; García-Díez, J.; de Almeida, J.M.M.M.; Saraiva, C. Consumer knowledge about food labeling and fraud. Foods 2021, 10, 1095. [Google Scholar] [CrossRef] [Scilit] [PubMed]
- Bravo, I.; Colamatteo, I.; Balzano, S.; Cappelli, L.; Iannucci, E. Consumer behaviour regarding certified food. Sustainability 2024, 16, 3757. [Google Scholar] [CrossRef] [Scilit]
- Hair, J.F.; Black, W.C.; Babin, B.J.; Anderson, R.E.; Tatham, R.L. Multivariate Data Analysis; Prentice Hall: Upper Saddle River, NJ, USA, 1998. [Google Scholar]
- Razali, N.M.; Wah, Y.B. Power comparisons of Shapiro–Wilk, Kolmogorov–Smirnov, Lilliefors and Anderson–Darling tests. J. Stat. Model. Anal. 2011, 2, 21–33. [Google Scholar]
- Glogovețan, A.-I.; Dabija, D.-C.; Fiore, M.; Pocol, C.B. Consumer perception and understanding of European Union quality schemes: A systematic literature review. Sustainability 2022, 14, 1667. [Google Scholar] [CrossRef] [Scilit]
- Tabachnick, B.G.; Fidell, L.S. Using Multivariate Statistics, 3rd ed.; HarperCollins College Publishers: New York, NY, USA, 1996. [Google Scholar]
- Motulsky, H.J.; Brown, R.E. Detecting outliers when fitting data with nonlinear regression—A new method based on robust nonlinear regression and the false discovery rate. BMC Bioinform. 2006, 7, 123. [Google Scholar] [CrossRef] [Scilit] [PubMed]
- Tabachnick, B.G.; Fidell, L.S.; Ullman, J.B. Using Multivariate Statistics; Pearson Education: Boston, MA, USA, 2007. [Google Scholar]
- Cross Validated. Discriminant Analysis vs. Logistic Regression. Available online: https://stats.stackexchange.com (accessed on 15 November 2025).
- Tillmanns, S.; Krafft, M. Discriminant analysis. In Handbook of Market Research; Baumgartner, H., Roberts, J.H., Eds.; Springer: Cham, Switzerland, 2021. [Google Scholar]
- Poulsen, J.; French, A. Discriminant Function Analysis (DA); San Francisco State University: San Francisco, CA, USA, 2008. [Google Scholar]
- Santos, S.; Gonçalves, H.M. Multichannel consumer behaviors in the mobile environment: Using fsQCA and discriminant analysis to understand webrooming motivations. J. Bus. Res. 2019, 101, 757–766. [Google Scholar] [CrossRef] [Scilit]
- Martins-Bessa, A.; Quaresma, M.; Leiva, B.; Calado, A.; Arando, A.; Marín, C.; Navas, F.J. Age-related linear and nonlinear modelling of semen quality parameters in Miranda donkeys. Ital. J. Anim. Sci. 2021, 20, 1029–1041. [Google Scholar] [CrossRef] [Scilit]
- Marín Navas, C.; Delgado Bermejo, J.V.; McLean, A.K.; León Jurado, J.M.; Navas González, F.J. Discriminant canonical analysis of the contribution of Spanish and Arabian purebred horses to the genetic diversity and population structure of Hispano-Arabian horses. Animals 2021, 11, 269. [Google Scholar] [CrossRef] [Scilit] [PubMed]
- Roy, A.; Khattree, R. Classification rules for repeated measures data from biomedical research. In Computational Methods in Biomedical Research; Chapman and Hall/CRC: Boca Raton, FL, USA, 2007; pp. 323–370. [Google Scholar]
- Pardoe, I.; Yin, X.; Cook, R.D. Graphical tools for quadratic discriminant analysis. Technometrics 2007, 49, 172–183. [Google Scholar] [CrossRef] [Scilit]
- Lix, L.M.; Sajobi, T.T. Discriminant analysis for repeated measures data: A review. Front. Psychol. 2010, 1, 146. [Google Scholar] [CrossRef] [Scilit] [PubMed]
- Sajobi, T.T.; Lix, L.M.; Dansu, B.M.; Laverty, W.; Li, L. Robust descriptive discriminant analysis for repeated measures data. Comput. Stat. Data Anal. 2012, 56, 2782–2794. [Google Scholar] [CrossRef] [Scilit]
- Stratton, S.J. Quasi-experimental design (pre-test and post-test studies) in prehospital and disaster research. Prehosp. Disaster Med. 2019, 34, 573–574. [Google Scholar] [CrossRef] [Scilit] [PubMed]
- Roy, A.; Khattree, R. On implementation of a test for Kronecker product covariance structure for multivariate repeated measures data. Stat. Methodol. 2005, 2, 297–306. [Google Scholar] [CrossRef] [Scilit]
- Navas González, F.J. Software utilities for data visualization and code management for genealogy reconstruction and high quality graph displayal. Arch. Zootec. 2023, 73, 68–70. [Google Scholar]
- Garcia-Vallvé, S.; Puigbò, P. DendroUPGMA: A Dendrogram Construction Utility; Universitat Rovira i Virgili: Tarragona, Spain, 2002; Available online: https://usuaris.tinet.cat/debb/UPGMA/ (accessed on 1 August 2026).
- Czine, P.; Török, Á.; Pető, K.; Horváth, P.; Balogh, P. The impact of food labeling and other factors on consumer preferences using discrete choice modeling—The example of traditional pork sausage. Nutrients 2020, 12, 1768. [Google Scholar] [CrossRef] [Scilit] [PubMed]
- Almutlaq, M.; Alrasheed, S.O.; Alfuraih, T.; Almarwani, R.; Aljabr, S.M.; Bhkli, A. Assessment of food-related knowledge and preferred awareness methods by the Saudi community: A cross-sectional study. BMC Public Health 2025, 25, 2742. [Google Scholar] [CrossRef] [Scilit] [PubMed]
- Tanase, M.O.; Nistoreanu, P.; Dina, R.; Georgescu, B.; Nicula, V.; Mirea, C.N. Generation Z Romanian students’ relation with rural tourism—An exploratory study. Sustainability 2023, 15, 8166. [Google Scholar] [CrossRef] [Scilit]
- Marcoz, E.M.; Melewar, T.C.; Dennis, C. The value of region of origin, producer and protected designation of origin label for visitors and locals: The case of Fontina cheese in Italy. Int. J. Tour. Res. 2016, 18, 236–250. [Google Scholar] [CrossRef] [Scilit]
- Bouhaddane, M.; Halawany-Darson, R.; Rochette, C.; Amblard, C. Legitimate or not, does it really matter? A reading of the PDO label’s legitimacy through consumers’ perception. Foods 2023, 12, 2365. [Google Scholar] [CrossRef] [Scilit] [PubMed]
- Ojeda, M.; Etaio, I.; Guerrero, L.; Fernández-Gil, M.P.; Pérez-Elortondo, F.J. Does consumer liking fit the sensory quality assessed by trained panelists in traditional food products? A study on PDO Idiazabal cheese. J. Sens. Stud. 2018, 33, e12318. [Google Scholar] [CrossRef] [Scilit]
- Pieniak, Z.; Aertsens, J.; Verbeke, W. Subjective and objective knowledge as determinants of organic vegetables consumption. Food Qual. Prefer. 2010, 21, 581–588. [Google Scholar] [CrossRef] [Scilit]
- Nacef, M.; Lelièvre-Desmas, M.; Symoneaux, R.; Jombart, L.; Flahaut, C.; Chollet, S. Consumers’ expectation and liking for cheese: Can familiarity effects resulting from regional differences be highlighted within a country? Food Qual. Prefer. 2019, 72, 188–197. [Google Scholar] [CrossRef] [Scilit]
- Racette, C.M.; Drake, M.A. Consumer perception of natural hot-pepper cheeses. J. Dairy Sci. 2022, 105, 2166–2179. [Google Scholar] [CrossRef] [Scilit] [PubMed]
- Clarkson, J.J.; Janiszewski, C.; Cinelli, M.D. The desire for consumption knowledge. J. Consum. Res. 2013, 39, 1313–1329. [Google Scholar] [CrossRef] [Scilit]
- Chocarro, R.; Cortinas, M.; Elorz, M. El impacto del conocimiento de la categoría de producto en el uso de señales extrínsecas por parte de los consumidores: Un estudio sobre productos agroalimentarios. Food Qual. Prefer. 2009, 20, 176–186. [Google Scholar]
- Kim, J.-H.; Seo, G.-R.-O.-D.-N. Comparison of discriminant analyses for consumers’ taste grade on Hanwoo. Korean J. Agric. Sci. 2008, 21, 969–980. [Google Scholar] [CrossRef] [Scilit]
- Hufnagel, F. Market Insights to Business Strategy: A Foundational Study for a European Insect-Based Food Start-Up. Master’s Thesis, Universidade Católica Portuguesa, Lisboa, Portugal, 2023. [Google Scholar]
- Amoneit, M.; Gellrich, L.; Weckowska, D. Consumer acceptance of alternative proteins: Exploring determinants of the consumer willingness to buy in Germany. Foods 2025, 14, 2427. [Google Scholar] [CrossRef] [Scilit] [PubMed]
- Rojas, C.A.M.; Bernui, I.; Oriondo, R.; Estrada, E.; Villarreal, C.; Espinoza, S. Validez y reproducibilidad de un cuestionario de frecuencia de consumo de calcio para mujeres entre 30 y 50 años. An. Fac. Med. 2013, 72, 191–196. [Google Scholar] [CrossRef] [Scilit]



| Statistical Technique | Purpose | Main Indicators/Statistics | Interpretation | References |
|---|---|---|---|---|
| Assumption checking | Verify suitability of the data for multivariate analyses | Shapiro–Francia test, Q–Q plots, Levene’s test, VIF, ROUT outlier detection | Normality, homogeneity, absence of influential outliers, and acceptable multicollinearity (VIF < 5) support the validity of subsequent analyses. | [25,11,26,27,28,29,30,31,32,33,34,35,36] |
| Canonical Discriminant Analysis (CDA) | Identify variables that best discriminate between pre- and post-training responses | Canonical functions, canonical correlations, standardized discriminant coefficients, structure coefficients (loadings) | Larger canonical correlations and higher absolute loadings indicate variables with greater discriminatory capacity. | [38,39,40,8,41,42,43] |
| Variable selection | Select the most informative predictors for discrimination | Forward stepwise multinomial logistic regression | Retains variables providing the greatest discriminatory information while reducing redundancy. | [38,39,40,8,41,42,43] |
| Model adequacy | Evaluate the statistical significance and robustness of the discriminant model | Wilks’ Lambda, Bartlett’s test, Pillai’s Trace | Smaller Wilks’ Lambda and significant Bartlett’s test indicate better group discrimination; higher Pillai’s Trace reflects stronger multivariate effects and robustness. | [38,39,40,8,41,42,43] |
| Group separation | Quantify discrimination between groups | Group centroids, squared Mahalanobis distances | Greater distances indicate stronger separation between pre- and post-training groups. | [44] |
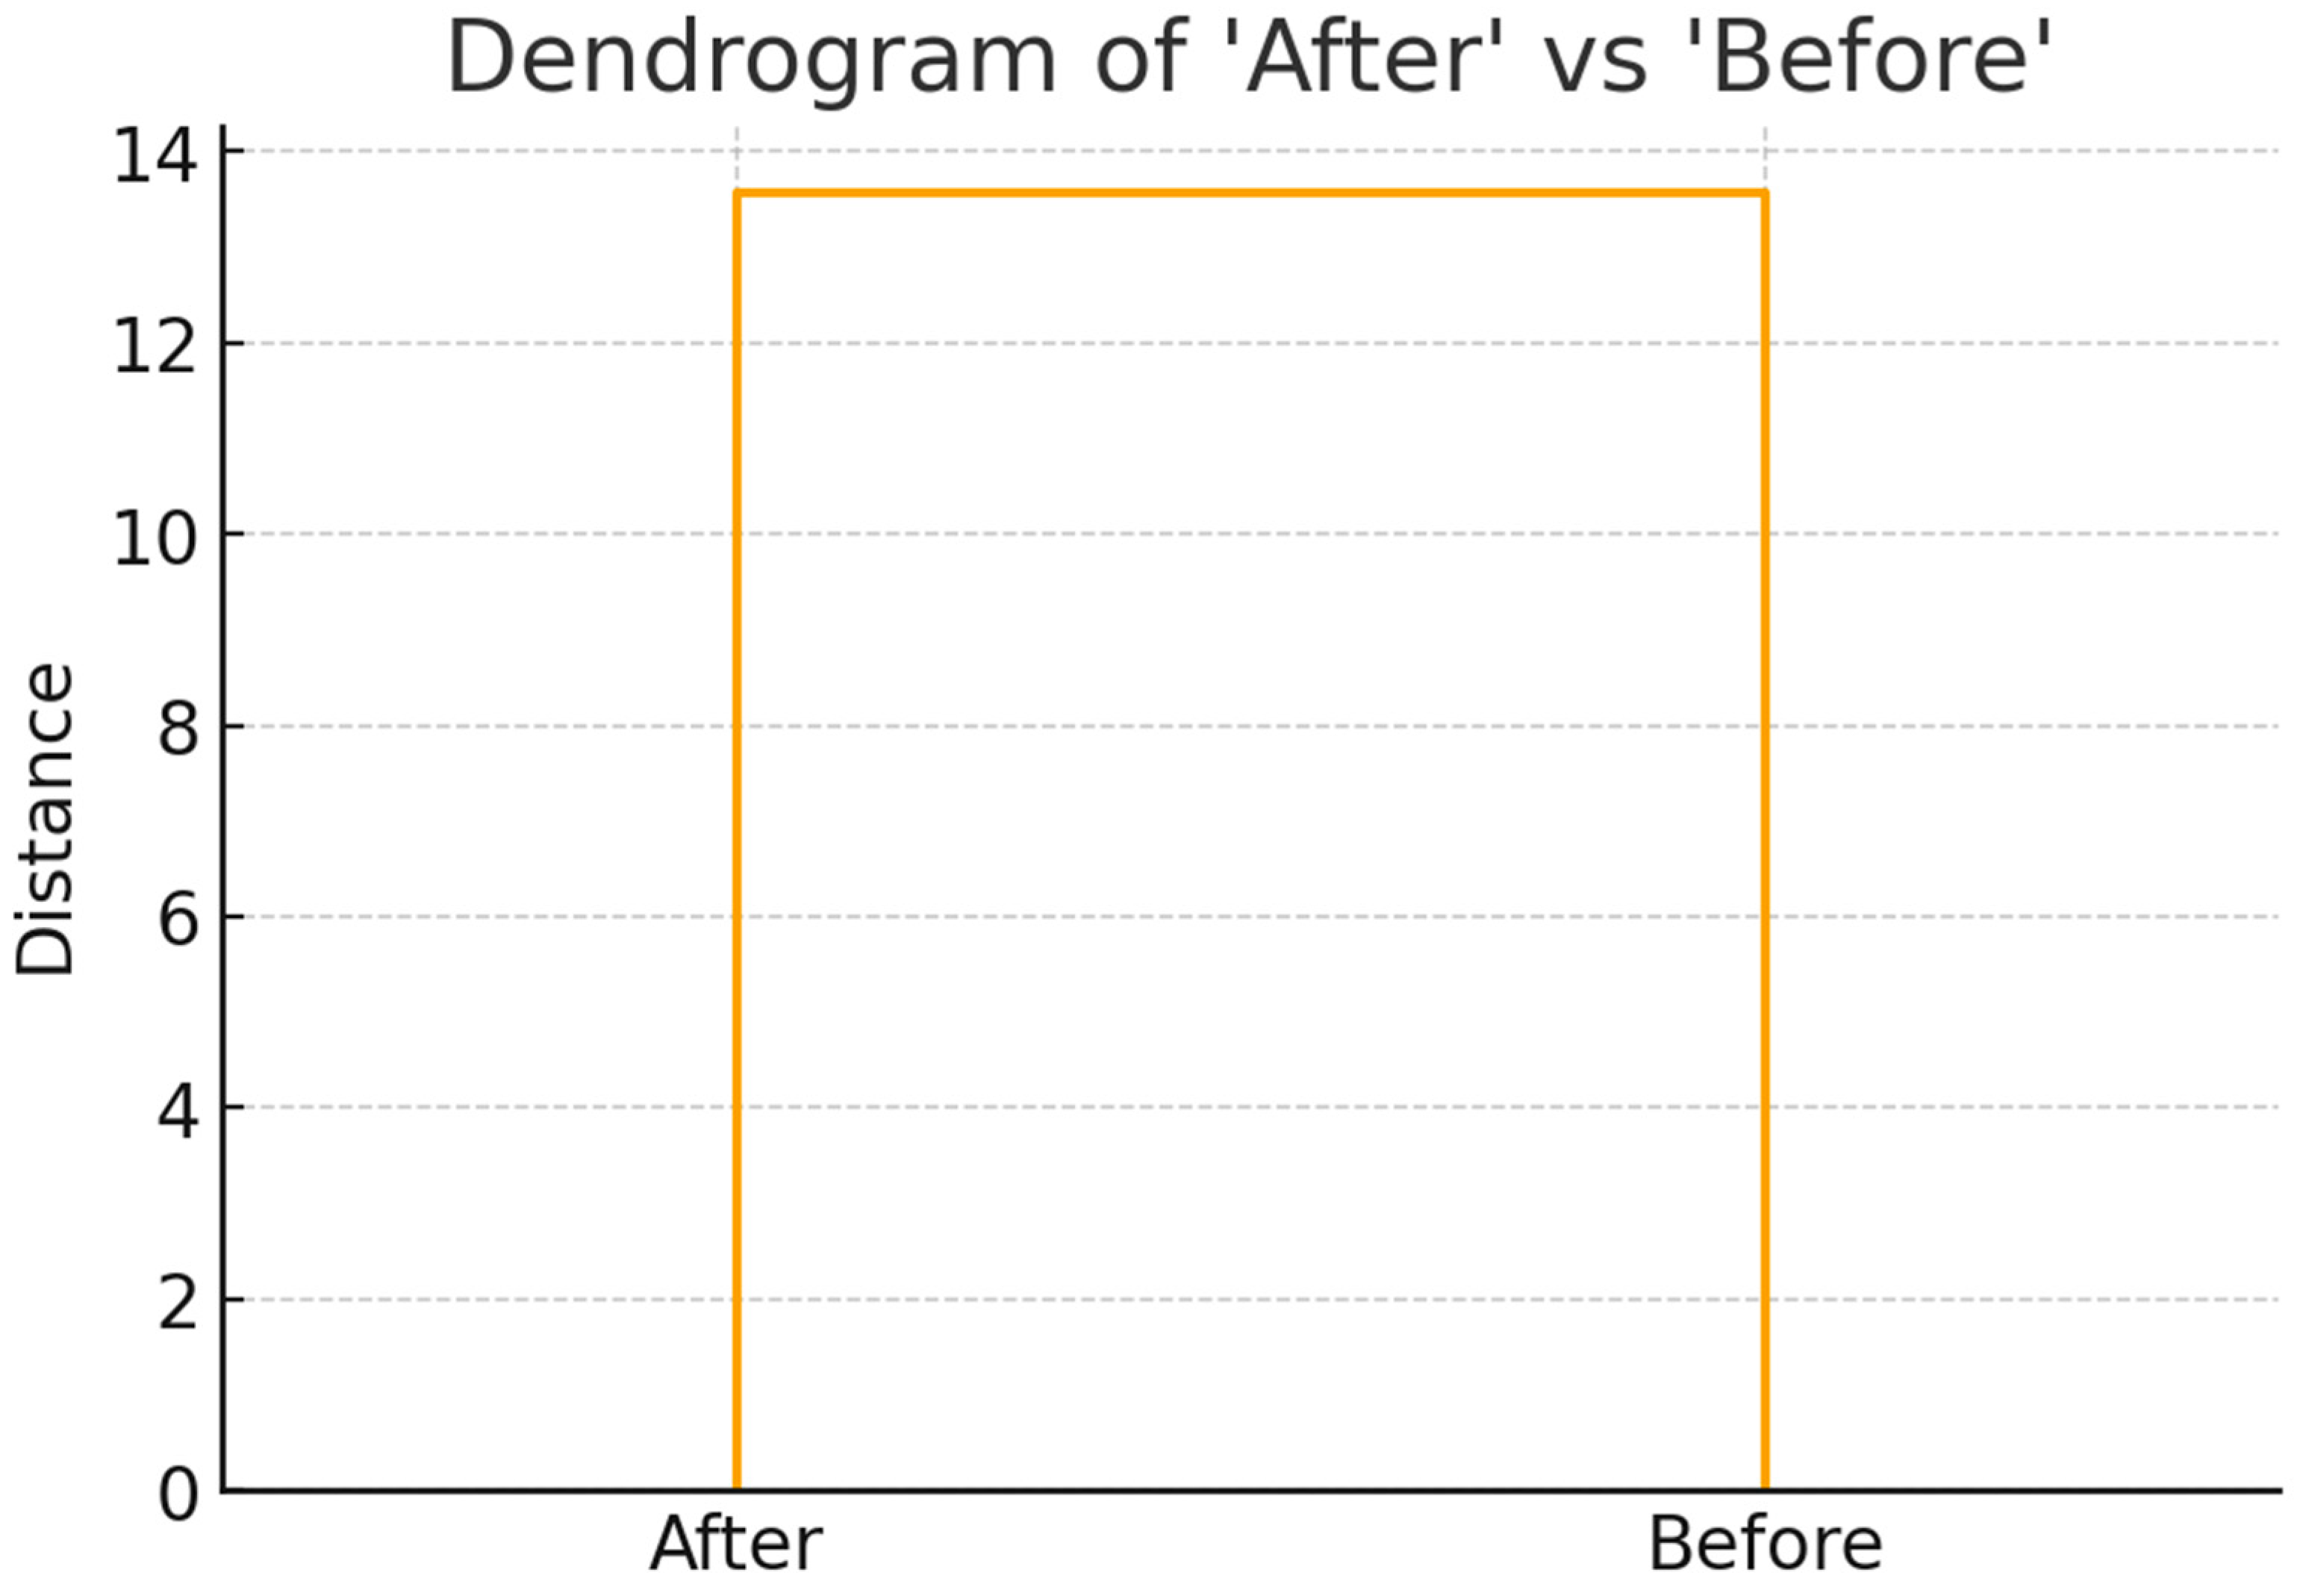
| Hierarchical clustering | Visualize relationships among groups | Euclidean distances derived from Mahalanobis distances; dendrogram | Closer clusters indicate greater similarity; larger branch lengths indicate greater dissimilarity. | [44] |
| Cross-validation | Assess predictive robustness and generalizability | Leave-One-Out Cross-Validation (LOOCV), classification accuracy | Higher classification accuracy indicates greater predictive performance and model stability. | [2,3,25] |
| Classification validation | Determine whether classification exceeds chance expectations | Press’s Q statistic | Significant Press’s Q indicates that classification accuracy is significantly better than chance. | [2,3,25] |
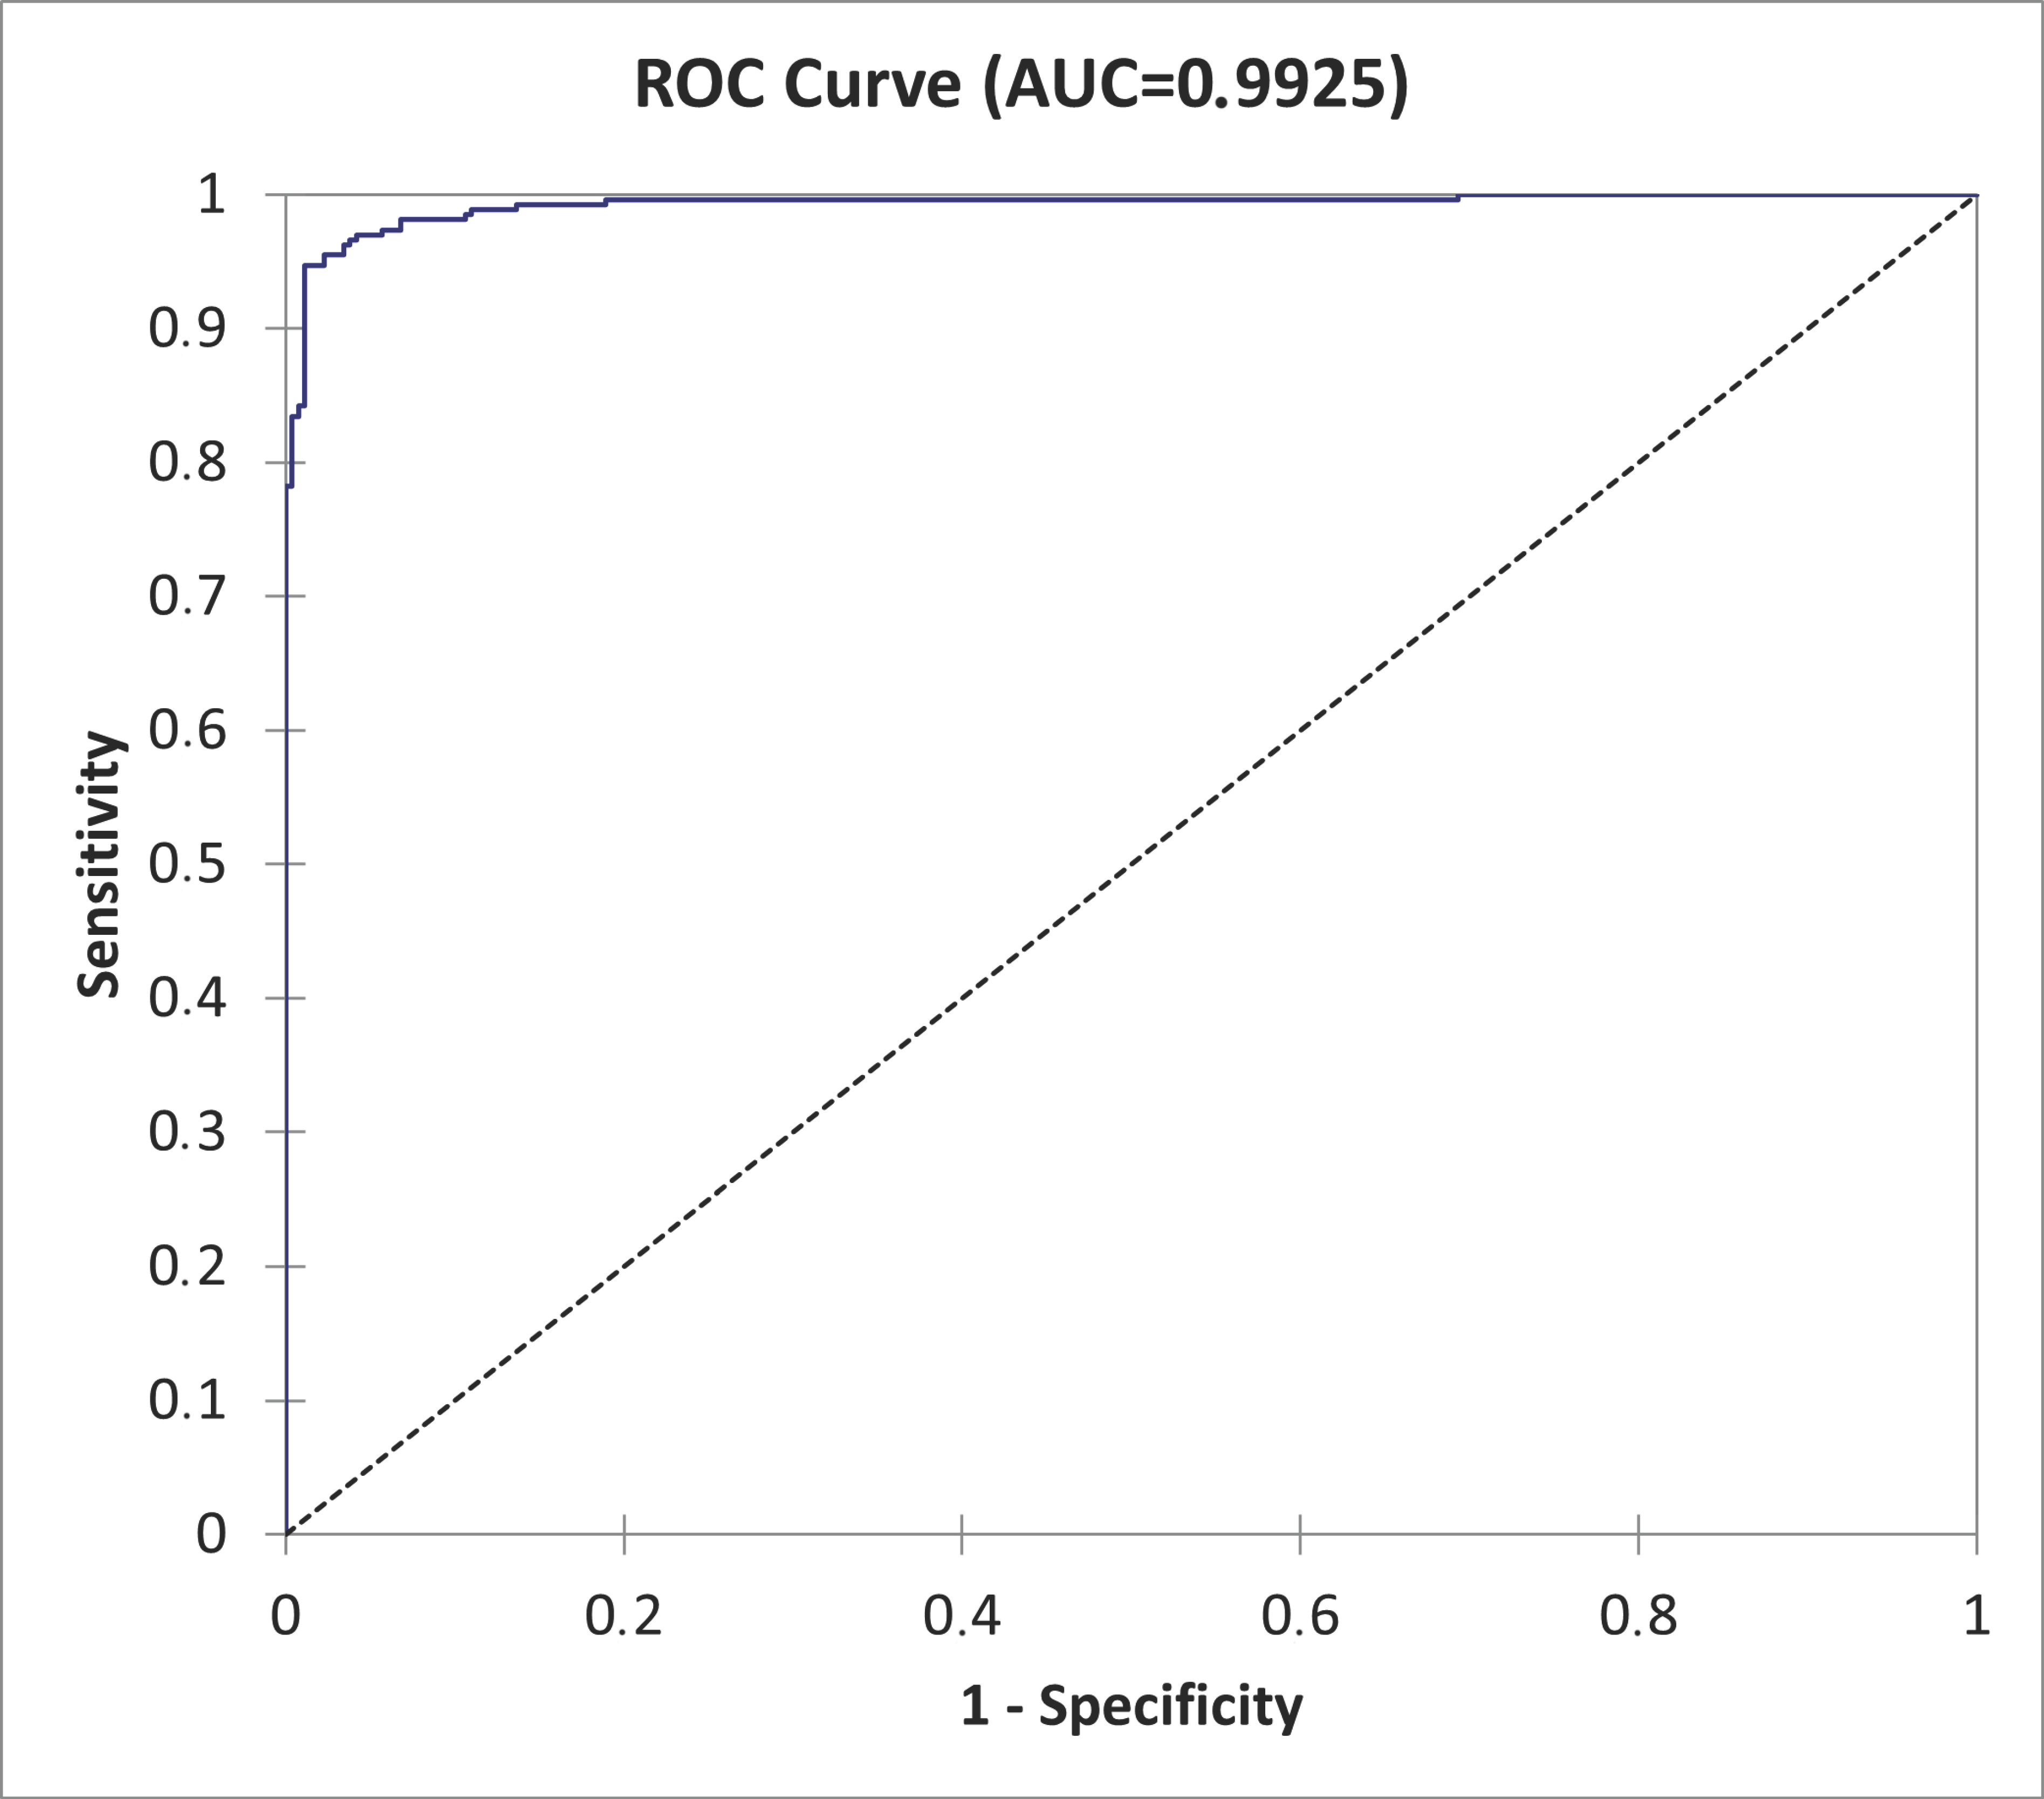
| Diagnostic performance | Evaluate the model’s ability to distinguish between groups | ROC curve, Area Under the Curve (AUC) | AUC values close to 1.0 indicate excellent discriminatory performance; values around 0.5 indicate no discrimination. | [2,3,25] |
| Main Conceptual Domain | Representative Questionnaire Items | Principal Topics Evaluated | Statistical Support (Wilks’ Lambda/F-value) | Significance Level | General Outcome After Training |
|---|---|---|---|---|---|
| Self-perceived knowledge and prior experience | Q3, Q4, Q5 | Knowledge of PDOs, sensory analysis, and previous training experience | 0.8394–0.9060/54.77–101.00 | p < 0.0001 | Participants reported higher levels of perceived knowledge in PDOs and sensory analysis, while previous training experience variables remained largely stable |
| Sensory texture perception | Q9–19 | Texture in mouth, friability, moisture, firmness, adhesiveness, granularity, elasticity, roughness, solubility | 0.7256–0.9864/7.26–199.66 | p < 0.0001 to p = 0.0073 | Significant improvements were observed in participants’ ability to identify and interpret texture-related sensory descriptors |
| Olfactory perception | Q20–27 | Aroma intensity, dairy, plant, roasted, spice, and additional aromatic families | 0.8522–0.9986/0.73–91.60 | p < 0.0001 to p = 0.3946 | Training improved recognition of olfactory descriptors, particularly dairy and plant aromatic families |
| Gustatory perception | Q28–33 | Salty, acidic, bitter, spicy, sweet, and astringent tastes | 0.8879–0.9999/0.05–66.67 | p < 0.0001 to p = 0.8319 | Participants improved recognition of several gustatory descriptors, especially acidic, bitter, salty, and spicy perceptions |
| PDO sanitary and sustainability misconceptions | Q37–40 | Hygienic-sanitary guarantees, ecological production, fraud prevention, added value | 0.9241–0.9997/0.18–43.34 | p < 0.0001 to p = 0.6688 | Training reduced misconceptions linking PDO certification exclusively with food safety, sustainability, or anti-fraud functions |
| PDO governance and management | Q41, Q42, Q49 | Role of farmers, administration, and PDO management systems | 0.9595–0.9995/0.28–22.31 | p < 0.0001 to p = 0.5987 | Improved understanding of governance structures and administrative responsibilities within PDO systems |
| PDO territorial linkage and geographical restrictions | Q44, Q53, Q55–57, Q62, Q71, Q73, Q92 | Territorial identity, production areas, maturation restrictions, grazing limitations | 0.7238–0.9999/0.03–201.52 | p < 0.0001 to p = 0.8595 | Strong improvements were observed in understanding geographical exclusivity and territorial production restrictions |
| PDO labeling and traceability systems | Q45, Q51, Q75, Q84, Q85, Q94 | Numbered counter-labels, registered dairies, traceability requirements | 0.7962–0.9998/0.09–135.11 | p < 0.0001 to p = 0.7688 | Participants showed greater understanding of official traceability systems and mandatory labeling requirements |
| PDO technological and cheesemaking regulations | Q58–60, Q78, Q79, Q99 | Cheesemaking specifications, coagulation temperatures, coagulants, technological restrictions | 0.8075–0.9999/0.03–125.90 | p < 0.0001 to p = 0.8536 | Training improved recognition of technological requirements and permitted traditional cheesemaking practices |
| Milk-origin and species restrictions | Q65, Q66, Q68, Q86 | Authorized milk species, breed-specific milk use, sheep milk allowance | 0.6345–0.9924/4.04–304.20 | p < 0.0001 to p = 0.0449 | Significant reductions in misconceptions regarding milk composition and authorized species were observed |
| Native breeds and herdbook registration | Q69, Q70, Q80, Q81, Q88, Q89, Q101 | Breed standards, herdbook registration, importance of native breeds | 0.8220–0.9997/0.16–114.30 | p < 0.0001 to p = 0.6915 | Participants demonstrated improved understanding of breed identity and the role of native breeds in PDO certification |
| Majorero PDO commercialization requirements | Q82, Q84, Q85 | Registered dairies and commercialization rules | 0.8665–0.9990/0.55–81.33 | p < 0.0001 to p = 0.4601 | Increased awareness of the legal requirements necessary to market cheeses under the Majorero PDO |
| Palmero PDO commercialization requirements | Q94–96 | Labeling, counter-labels, coatings, fresh-cheese protection | 0.7590–1.0000/0.00–167.68 | p < 0.0001 to p = 0.9713 | Improved understanding of Palmero PDO labeling and commercialization regulations |
| Labeling preferences | Q106, Q107 | Importance of island and breed identification on labels | 0.9860–1.0000/0.00–7.49 | p = 0.0064 to p = 0.9713 | Participants increasingly prioritized breed and territorial identity as differentiating labeling elements |
| Reduction in uncertainty responses | Multiple NONR items | “No Opinion/No Response” selections across PDO and sensory questions | 0.7623–0.9879/6.47–164.62 | p < 0.0001 to p = 0.0113 | Training substantially reduced uncertainty and indecision across most conceptual domains |
| Stable or non-significant variables | Product-experience variables and selected PDO items | Previous product experience, some already consolidated PDO concepts | 0.9950–1.0000/0.00–2.67 | p = 0.1028 to p = 0.9957 | Several variables remained stable due to already high baseline knowledge or low misconception prevalence |
Disclaimer/Publisher’s Note: The statements, opinions and data contained in all publications are solely those of the individual author(s) and contributor(s) and not of MDPI and/or the editor(s). MDPI and/or the editor(s) disclaim responsibility for any injury to people or property resulting from any ideas, methods, instructions or products referred to in the content. |
© 2026 by the authors. Licensee MDPI, Basel, Switzerland. This article is an open access article distributed under the terms and conditions of the Creative Commons Attribution (CC BY) license.
Share and Cite
Boyer Bustamante, E.; Fresno Baquero, M.d.R.; Barba Capote, C.J.; Bermejo Asensio, L.A.; Déniz Mesa, Á.; Navas González, F.J. Survey Validation and Optimization to Assess Public Awareness of Origin Protected Designation (PDO) Cheeses: Majorero and Palmero Cases. Foods 2026, 15, 2881. https://doi.org/10.3390/foods15162881
Boyer Bustamante E, Fresno Baquero MdR, Barba Capote CJ, Bermejo Asensio LA, Déniz Mesa Á, Navas González FJ. Survey Validation and Optimization to Assess Public Awareness of Origin Protected Designation (PDO) Cheeses: Majorero and Palmero Cases. Foods. 2026; 15(16):2881. https://doi.org/10.3390/foods15162881
Chicago/Turabian StyleBoyer Bustamante, Eva, María del Rosario Fresno Baquero, Cecilio José Barba Capote, Luis Alberto Bermejo Asensio, Álvaro Déniz Mesa, and Francisco Javier Navas González. 2026. "Survey Validation and Optimization to Assess Public Awareness of Origin Protected Designation (PDO) Cheeses: Majorero and Palmero Cases" Foods 15, no. 16: 2881. https://doi.org/10.3390/foods15162881
APA StyleBoyer Bustamante, E., Fresno Baquero, M. d. R., Barba Capote, C. J., Bermejo Asensio, L. A., Déniz Mesa, Á., & Navas González, F. J. (2026). Survey Validation and Optimization to Assess Public Awareness of Origin Protected Designation (PDO) Cheeses: Majorero and Palmero Cases. Foods, 15(16), 2881. https://doi.org/10.3390/foods15162881