


Structural and Physico-Chemical Changes of Mozzarella di Bufala Campana Cheese Influenced by Covering Liquid Composition


Abstract
1. Introduction
2. Materials and Methods
2.1. Experimental Trials
2.2. Preparation of Covering Liquids
2.3. Cheesemaking and Storage
2.4. Physical and Chemical Analyses
2.5. Texture Profile Analysis
2.6. Rheological Analyses
2.7. Statistical Analysis
3. Results and Discussion
3.1. Physico-Chemical Properties
3.2. Textural and Rheological Properties
4. Conclusions
Supplementary Materials
Author Contributions
Funding
Institutional Review Board Statement
Informed Consent Statement
Data Availability Statement
Acknowledgments
Conflicts of Interest
References
- Piscopo, A.; Mincione, A.; Summo, C.; Silletti, R.; Giacondino, C.; Rocco, I.; Pasqualone, A. Influence of the Mozzarella Type on Chemical and Sensory Properties of “Pizza Margherita”. Foods 2024, 13, 209. [Google Scholar] [CrossRef]
- Ercolini, D.; Filippis, F.; Storia, A.; Iacono, M. Remake” by High-Throughput Sequencing of the Microbiota Involved in the Production of Water Buffalo Mozzarella Cheese. Appl. Environ. Microbiol. 2012, 78, 8142–8145. [Google Scholar] [CrossRef] [PubMed]
- Levante, A.; Bertani, G.; Marrella, M.; Mucchetti, G.; Bernini, V.; Lazzi, C.; Neviani, E. The Microbiota of Mozzarella Di Bufala Campana PDO Cheese: A Study across the Manufacturing Process. Front. Microbiol. 2023, 14, 1196879. [Google Scholar] [CrossRef] [PubMed]
- Tremonte, P.; Nazzaro, F.; Coppola, R. Mozzarella Cheese. In Dairy Foods Processing; Gomes Da Cruz, A., Colombo Pimentel, T., Esmerino, E.A., Verruck, S., Eds.; Methods and Protocols in Food Science; Springer: New York, NY, USA, 2024; pp. 31–54. ISBN 978-1-07-164143-9. [Google Scholar]
- Ghiglietti, R.; Santarelli, S.; Francolino, S.; Perrone, A.; Locci, F.; Mucchetti, G. Glucides, lactic and citric acid and calcium content changes during cheese-making and storage of Mozzarella cheese: Comparison between “Mozzarella di Bufala Campana” and bovine Mozzarella cheese. Sci. Tec. Latt. Casearia 2004, 55, 227–249. [Google Scholar]
- Mucchetti, G.; Pugliese, A.; Paciulli, M. Characteristics of Some Important Italian Cheeses. In Mediterranean Foods Composition and Processing; Cruz, R.M.S., Vieira, M.C., Eds.; CRC Press: Boca Raton, FL, USA, 2016; pp. 1–34. ISBN 978-1-315-36923-5. [Google Scholar]
- European Commission. Amendment Application Pursuant to Article 9 and Article 17(2) of Council Regulation (EC) N. 510/2006; European Commission: Brussels, Belgium, 2007; Volume IT/PDO/117/0014/20.09.2002C90. [Google Scholar]
- Huang, X.; Kamgang Nzekoue, F.; Renzi, S.; Alesi, A.; Magdalena Coman, M.; Pucciarelli, S.; Sagratini, G.; Silvi, S. Influence of Modified Governing Liquid on Shelf-Life Parameters of High-Moisture Mozzarella Cheese. Food Res. Int. 2022, 159, 111627. [Google Scholar] [CrossRef]
- Franzoi, M.; Ghetti, M.; Monte, L.; Marchi, M. Investigation of Weight Loss in Mozzarella Cheese Using NIR Predicted Chemical Composition and Multivariate Analysis. J. Food Compos. Anal. 2021, 102, 104002. [Google Scholar] [CrossRef]
- Faccia, M.; Mastromatteo, M.; Conte, A.; Del Nobile, M.A. Influence of the Different Sodium Chloride Concentrations on Microbiological and Physico-Chemical Characteristics of Mozzarella Cheese. J. Dairy Res. 2012, 79, 390–396. [Google Scholar] [CrossRef]
- Paonessa, A. Influence of the preservation liquid of Mozzarella di Bufala Campana D.O.P. on some aspect of its preservation. Bubalus Bubalis 2004, 10, 30–36. [Google Scholar]
- Ricci, A.; Alinovi, M.; Martelli, F.; Bernini, V.; Garofalo, A.; Perna, G.; Neviani, E.; Mucchetti, G. Heat Resistance of Listeria Monocytogenes in Dairy Matrices Involved in Mozzarella Di Bufala Campana PDO Cheese. Front. Microbiol. 2021, 11, 581934. [Google Scholar] [CrossRef]
- Ricci, A.; Martelli, F.; Alinovi, M.; Garofalo, A.; Perna, G.; Neviani, E.; Mucchetti, G.; Bernini, V. Behaviour and Adhesion Capacity of Listeria Monocytogenes on Mozzarella Di Bufala Campana PDO Cheese and in Fluids Involved in the Production Process. Food Control 2022, 140, 109110. [Google Scholar] [CrossRef]
- Rutigliano, M.; Spadaccino, G.; Gagliardi, R.; Luccia, A.; Faccia, M.; Gatta, B. An Electrophoretic Approach to Reveal the Freshness of Buffalo Mozzarella Cheese. Int. Dairy J. 2022, 133, 105424. [Google Scholar] [CrossRef]
- Garnot, P.; Molle, D. Heat-Stability of Milk-Clotting Enzymes in Conditions Encountered in Swiss Cheese Making. J. Food Sci. 2006, 52, 75–77. [Google Scholar] [CrossRef]
- Mastromatteo, M.; Conte, A.; Lucera, A.; Saccotelli, M.A.; Buonocore, G.G.; Zambrini, A.V.; Del Nobile, M.A. Packaging Solutions to Prolong the Shelf Life of Fiordilatte Cheese: Bio-Based Nanocomposite Coating and Modified Atmosphere Packaging. LWT-Food Sci. Technol. 2015, 60, 230–237. [Google Scholar] [CrossRef]
- Faccia, M.; Gambacorta, G.; Natrella, G.; Caponio, F. Shelf Life Extension of Italian Mozzarella by Use of Calcium Lactate Buffered Brine. Food Control 2019, 100, 287–291. [Google Scholar] [CrossRef]
- Zappia, A.; Branca, M.L.; Piscopo, A.; Poiana, M. Evaluation of Different Salted Governing Liquids on Shelf Life Extension of Lacto-Fermented Mozzarella Cheese. J. Food Sci. Technol. 2020, 57, 4293–4298. [Google Scholar] [CrossRef]
- Zappia, A.; Branca, M.L.; Piscopo, A.; Poiana, M. Shelf Life Extension of Mozzarella Cheese Packed in Preserving Liquid with Calcium Lactate and Bergamot Juice Concentrate. J. Dairy Res. 2020, 87, 474–479. [Google Scholar] [CrossRef]
- European Commission. eAmbrosia—The EU Geographical Indications Register; European Commission: Brussels, Belgium, 2025. [Google Scholar]
- Alinovi, M.; Mucchetti, G. Effect of Freezing and Thawing Processes on High-Moisture Mozzarella Cheese Rheological and Physical Properties. LWT—Food Sci. Technol. 2020, 124, 109137. [Google Scholar] [CrossRef]
- AOAC. Official Methods of Analysis of the AOAC. Volume 2, 15th ed.; Association of Official Analytical Chemists, Inc.: Washington, DC, USA, 1990; Volume 2, ISBN 0-935584-42-0. [Google Scholar]
- Guo, M.R.; Kindstedt, P.S. Age-Related Changes in the Water Phase of Mozzarella Cheese. J. Dairy Sci. 1995, 78, 2099–2107. [Google Scholar] [CrossRef]
- Alinovi, M.; Wiking, L.; Corredig, M.; Mucchetti, G. Effect of Frozen and Refrigerated Storage on Proteolysis and Physicochemical Properties of High-Moisture Citric Mozzarella Cheese. J. Dairy Sci. 2020, 103, 7775–7790. [Google Scholar] [CrossRef]
- Arboatti, A.S.; Olivares, M.L.; Sabbag, N.G.; Costa, S.C.; Zorrilla, S.E.; Sihufe, G.A. The Influence of Sodium Chloride Reduction on Physicochemical, Biochemical, Rheological and Sensory Characteristics of Mozzarella Cheese. Dairy Sci. Technol. 2014, 94, 373–386. [Google Scholar] [CrossRef]
- Alinovi, M.; Corredig, M.; Mucchetti, G.; Carini, E. Water Status and Dynamics of High-Moisture Mozzarella Cheese as Affected by Frozen and Refrigerated Storage. Food Res. Int. 2020, 137, 109415. [Google Scholar] [CrossRef] [PubMed]
- Biegalski, J.; Cais-Sokolińska, D. Innovative Covering Liquids Stabilising Water–Fat Leachate from Fresh Mozzarella Cheese Used as Pizza Topping. Foods 2024, 13, 581. [Google Scholar] [CrossRef] [PubMed]
- Floury, J.; Jeanson, S.; Aly, S.; Lortal, S. Determination of the Diffusion Coefficients of Small Solutes in Cheese: A Review. Dairy Sci. Technol. 2010, 90, 477–508. [Google Scholar] [CrossRef]
- Yazici, F.; Akbulut, C. Impact of Whey pH at Drainage on the Physicochemical, Sensory, and Functional Properties of Mozzarella Cheese Made from Buffalo Milk. J. Agric. Food Chem. 2007, 55, 9993–10000. [Google Scholar] [CrossRef]
- Locci, F.; Ghiglietti, R.; Francolino, S.; Iezzi, R.; Mucchetti, G. Effect of Stretching with Brine on the Composition and Yield of High Moisture Mozzarella Cheese. Milchwissenschaft 2012, 67, 81–85. [Google Scholar]
- Paulson, B.M.; Mcmahon, D.J.; Oberg, C.J. Influence of Sodium Chloride on Appearance, Functionality, and Protein Arrangements in Nonfat Mozzarella Cheese. J. Dairy Sci. 1998, 81, 2053–2064. [Google Scholar] [CrossRef]
- Guo, M.R.; Gilmore, J.A.; Kindstedt, P.S. Effect of Sodium Chloride on the Serum Phase of Mozzarella Cheese1. J. Dairy Sci. 1997, 80, 3092–3098. [Google Scholar] [CrossRef]
- Gianferri, R.; D’Aiuto, V.; Curini, R.; Delfini, M.; Brosio, E. Proton NMR Transverse Relaxation Measurements to Study Water Dynamic States and Age-Related Changes in Mozzarella Di Bufala Campana Cheese. Food Chem. 2007, 105, 720–726. [Google Scholar] [CrossRef]
- McMahon, D.J.; Fife, R.L.; Oberg, C.J. Water Partitioning in Mozzarella Cheese and Its Relationship to Cheese Meltability. J. Dairy Sci. 1999, 82, 1361–1369. [Google Scholar] [CrossRef]
- Smith, J.R.; Hindmarsh, J.P.; Carr, A.J.; Golding, M.D.; Reid, D. Molecular Drivers of Structural Development in Mozzarella Cheese. J. Food Eng. 2017, 214, 257–265. [Google Scholar] [CrossRef]
- Kruif, C.G.; Anema, S.G.; Zhu, C.; Havea, P.; Coker, C. Water Holding Capacity and Swelling of Casein Hydrogels. Food Hydrocoll. 2015, 44, 372–379. [Google Scholar] [CrossRef]
- Petrella, G.; Pati, S.; Gagliardi, R.; Rizzuti, A.; Mastrorilli, P.; la Gatta, B.; Di Luccia, A. Study of Proteolysis in River Buffalo Mozzarella Cheese Using a Proteomics Approach. J. Dairy Sci. 2015, 98, 7560–7572. [Google Scholar] [CrossRef] [PubMed]
- Tidona, F.; Alinovi, M.; Francolino, S.; Brusa, G.; Ghiglietti, R.; Locci, F.; Mucchetti, G.; Giraffa, G. Partial Substitution of 40 g/100 g Fresh Milk with Reconstituted Low Heat Skim Milk Powder in High-Moisture Mozzarella Cheese Production: Rheological and Water-Related Properties. LWT-Food Sci. Technol. 2021, 137, 110391. [Google Scholar] [CrossRef]
- Henneberry, S.; Wilkinson, M.G.; Kilcawley, K.N.; Kelly, P.M.; Guinee, T.P. Interactive Effects of Salt and Fat Reduction on Composition, Rheology and Functional Properties of Mozzarella-Style Cheese. Dairy Sci. Technol. 2015, 95, 613–638. [Google Scholar] [CrossRef]
- Mucchetti, G.; Gatti, M.; Neviani, E. Electrical Conductivity Changes in Milk Caused by Acidification: Determining Factors. J. Dairy Sci. 1994, 77, 940–944. [Google Scholar] [CrossRef]
- Ricciardi, A.; Guidone, A.; Zotta, T.; Matera, A.; Claps, S.; Parente, E. Evolution of Microbial Counts and Chemical and Physico-Chemical Parameters in High-Moisture Mozzarella Cheese during Refrigerated Storage. LWT-Food Sci. Technol. 2015, 63, 821–827. [Google Scholar] [CrossRef]
- Murru, N.; Peruzy, M.F.; Carlo, E.; Mercogliano, R.; Aponte, M.; Morena, C.; Serluca, G.; Fraulo, P. Listeria Monocytogenes Survival during Production and Storage of Water Buffalo Mozzarella Cheese. Int. J. Dairy Technol. 2018, 71, 356–361. [Google Scholar] [CrossRef]
- Rinaldi, S.; Palocci, G.; Giovanni, S.; Iacurto, M.; Tripaldi, C. Chemical Characteristics and Oxidative Stability of Buffalo Mozzarella Cheese Produced with Fresh and Frozen Curd. Molecules 2021, 26, 1405. [Google Scholar] [CrossRef]
- Guinee, T.P.; Feeney, E.P.; Auty, M.A.E.; Fox, P.F. Effect of pH and Calcium Concentration on Some Textural and Functional Properties of Mozzarella Cheese. J. Dairy Sci. 2002, 85, 1655–1669. [Google Scholar] [CrossRef]
- Guinee, T.P. Protein in Cheese and Cheese Products: Structure-Function Relationships. In Advanced Dairy Chemistry: Volume 1B: Proteins: Applied Aspects; Springer: New York, NY, USA, 2016; pp. 347–415. ISBN 978-1-4939-2800-2. [Google Scholar]
- Salaün, F.; Mietton, B.; Gaucheron, F. Buffering Capacity of Dairy Products. Int. Dairy J. 2005, 15, 95–109. [Google Scholar] [CrossRef]
- Sheehan, J.J.; Guinee, T.P. Effect of pH and Calcium Level on the Biochemical, Textural and Functional Properties of Reduced-Fat Mozzarella Cheese. Int. Dairy J. 2004, 14, 161–172. [Google Scholar] [CrossRef]
- Thybo, C.D.; Lillevang, S.K.; Skibsted, L.H.; Ahrné, L. Calcium Balance during Direct Acidification of Milk for Mozzarella Cheese Production. LWT 2020, 131, 109677. [Google Scholar] [CrossRef]
- Deshwal, G.K.; Gómez-Mascaraque, L.G.; Fenelon, M.; Huppertz, T. A Review on the Effect of Calcium Sequestering Salts on Casein Micelles: From Model Milk Protein Systems to Processed Cheese. Molecules 2023, 28, 2085. [Google Scholar] [CrossRef] [PubMed]
- Sánchez-Macías, D.; Fresno, M.; Moreno-Indias, I.; Castro, N.; Morales-delaNuez, A.; Álvarez, S.; Argüello, A. Physicochemical Analysis of Full-Fat, Reduced-Fat, and Low-Fat Artisan-Style Goat Cheese. J. Dairy Sci. 2010, 93, 3950–3956. [Google Scholar] [CrossRef]
- To, C.M.; Kerkaert, B.; Bossier, S.; Gaver, D.; Meeren, P.; Guinee, T.P. Variations in the Biochemical and Functional Properties of Commercial Low-Moisture Part-Skim Mozzarella during 3 Months of Storage at 4 °C. Int. Dairy J. 2022, 128, 105320. [Google Scholar] [CrossRef]
- Masotti, F.; Cattaneo, S.; Stuknytė, M.; Noni, I. Status and Developments in Analogue Cheese Formulations and Functionalities. Trends Food Sci. Technol. 2018, 74, 158–169. [Google Scholar] [CrossRef]
- Bähler, B.; Kunz, A.; Hinrichs, J. Hot Brining of Pasta Filata Cheese: Effect of Sodium and Calcium Chloride on Composition, Yield, and Hardness. Dairy Sci. Technol. 2016, 96, 703–714. [Google Scholar] [CrossRef]
- Kindstedt, P.S.; Kiely, L.J.; Gilmore, J.A. Variation in Composition and Functional Properties within Brine-Salted Mozzarella Cheese. J. Dairy Sci. 1992, 75, 2913–2921. [Google Scholar] [CrossRef]
- Guinee, T.P.; Fox, P.F. Salt in Cheese: Physical, Chemical and Biological Aspects. In Cheese; Academic Press: Cambridge, MA, USA, 2017; pp. 317–375. ISBN 978-0-12-417012-4. [Google Scholar]
- Ribero, G.G.; Rubiolo, A.C.; Zorrilla, S.E. Influence of Immersion Freezing in NaCl Solutions and of Frozen Storage on the Viscoelastic Behavior of Mozzarella Cheese. J. Food Sci. 2007, 72, E301-C307. [Google Scholar] [CrossRef]
- To, C.M.; Nnadi, C.O.; Wang, T.; Vermeir, P.; Meulenaer, B.; Dewettinck, K.; Meeren, P. Impact of Sodium Orthophosphate, Sodium Pyrophosphate or Sodium Citrate Addition via Dry-Salting on the Properties of Low-Moisture Part Skim Mozzarella. Int. Dairy J. 2023, 137, 105527. [Google Scholar] [CrossRef]
 = 1%,
= 1%,  = 2%) during the 30 d refrigerated storage. Different letters indicate significant within-group differences (p < 0.05) based on LSD post hoc test.
= 1%, = 2%) during the 30 d refrigerated storage. Different letters indicate significant within-group differences (p < 0.05) based on LSD post hoc test.
= 2%) during the 30 d refrigerated storage. Different letters indicate significant within-group differences (p < 0.05) based on LSD post hoc test.
= 1%, = 2%) during the 30 d refrigerated storage. Different letters indicate significant within-group differences (p < 0.05) based on LSD post hoc test.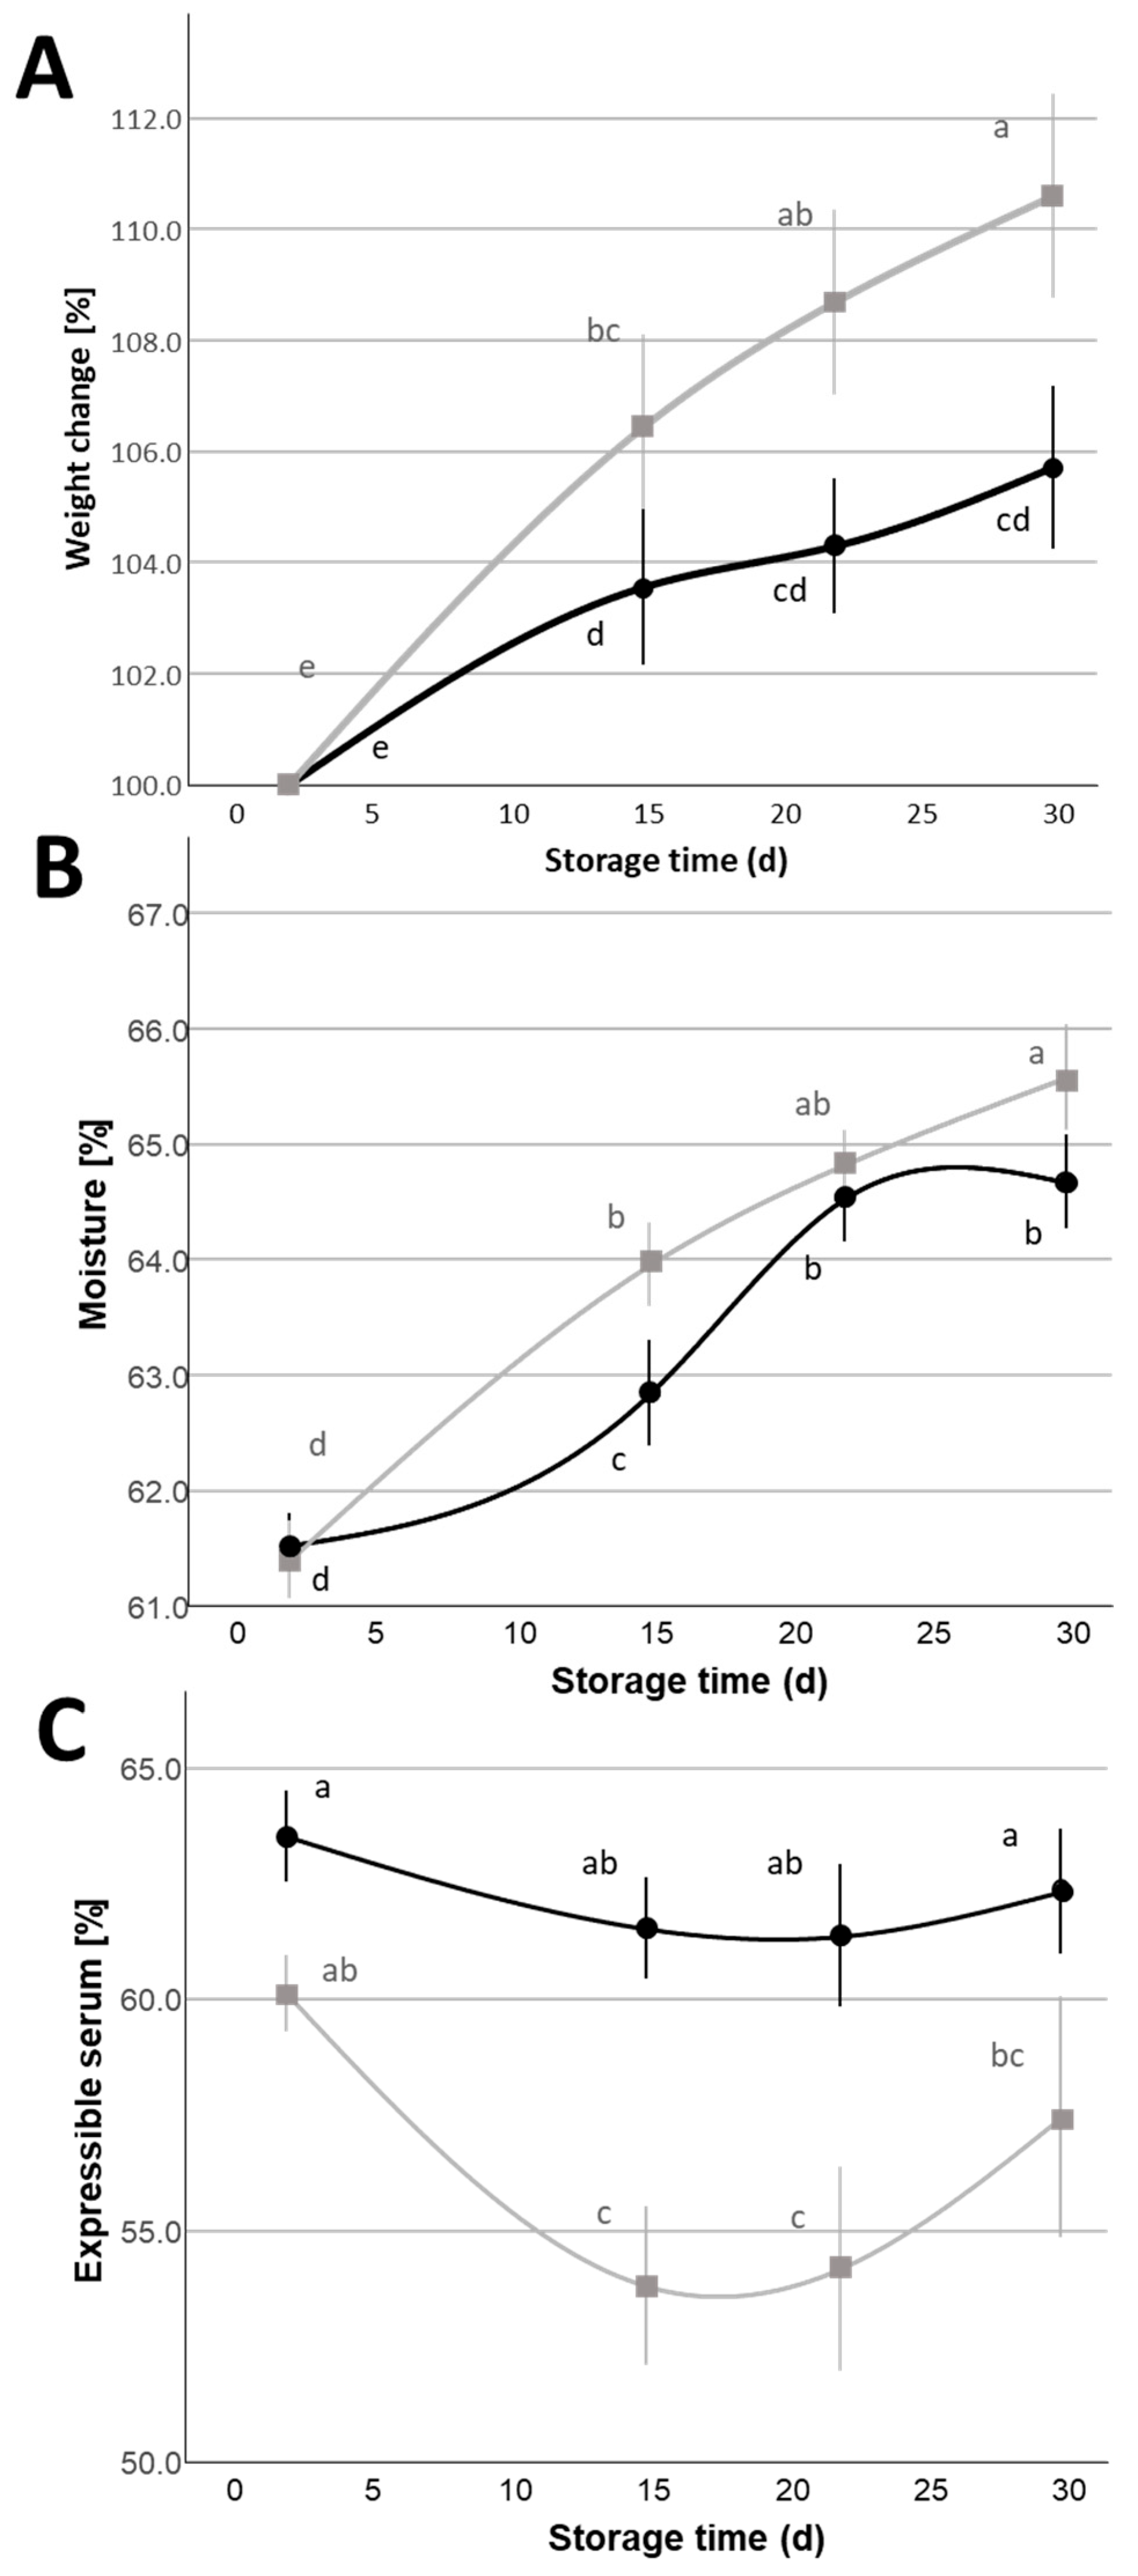 = citric acid, = lactic acid,
  = 1:1 citric:lactic acid mix) during the 30 d refrigerated storage. Different letters indicate significant within-group differences (p < 0.05) based on LSD post hoc test.
= citric acid, = lactic acid, = 1:1 citric:lactic acid mix) during the 30 d refrigerated storage. Different letters indicate significant within-group differences (p < 0.05) based on LSD post hoc test.
= 1:1 citric:lactic acid mix) during the 30 d refrigerated storage. Different letters indicate significant within-group differences (p < 0.05) based on LSD post hoc test.
= citric acid, = lactic acid, = 1:1 citric:lactic acid mix) during the 30 d refrigerated storage. Different letters indicate significant within-group differences (p < 0.05) based on LSD post hoc test.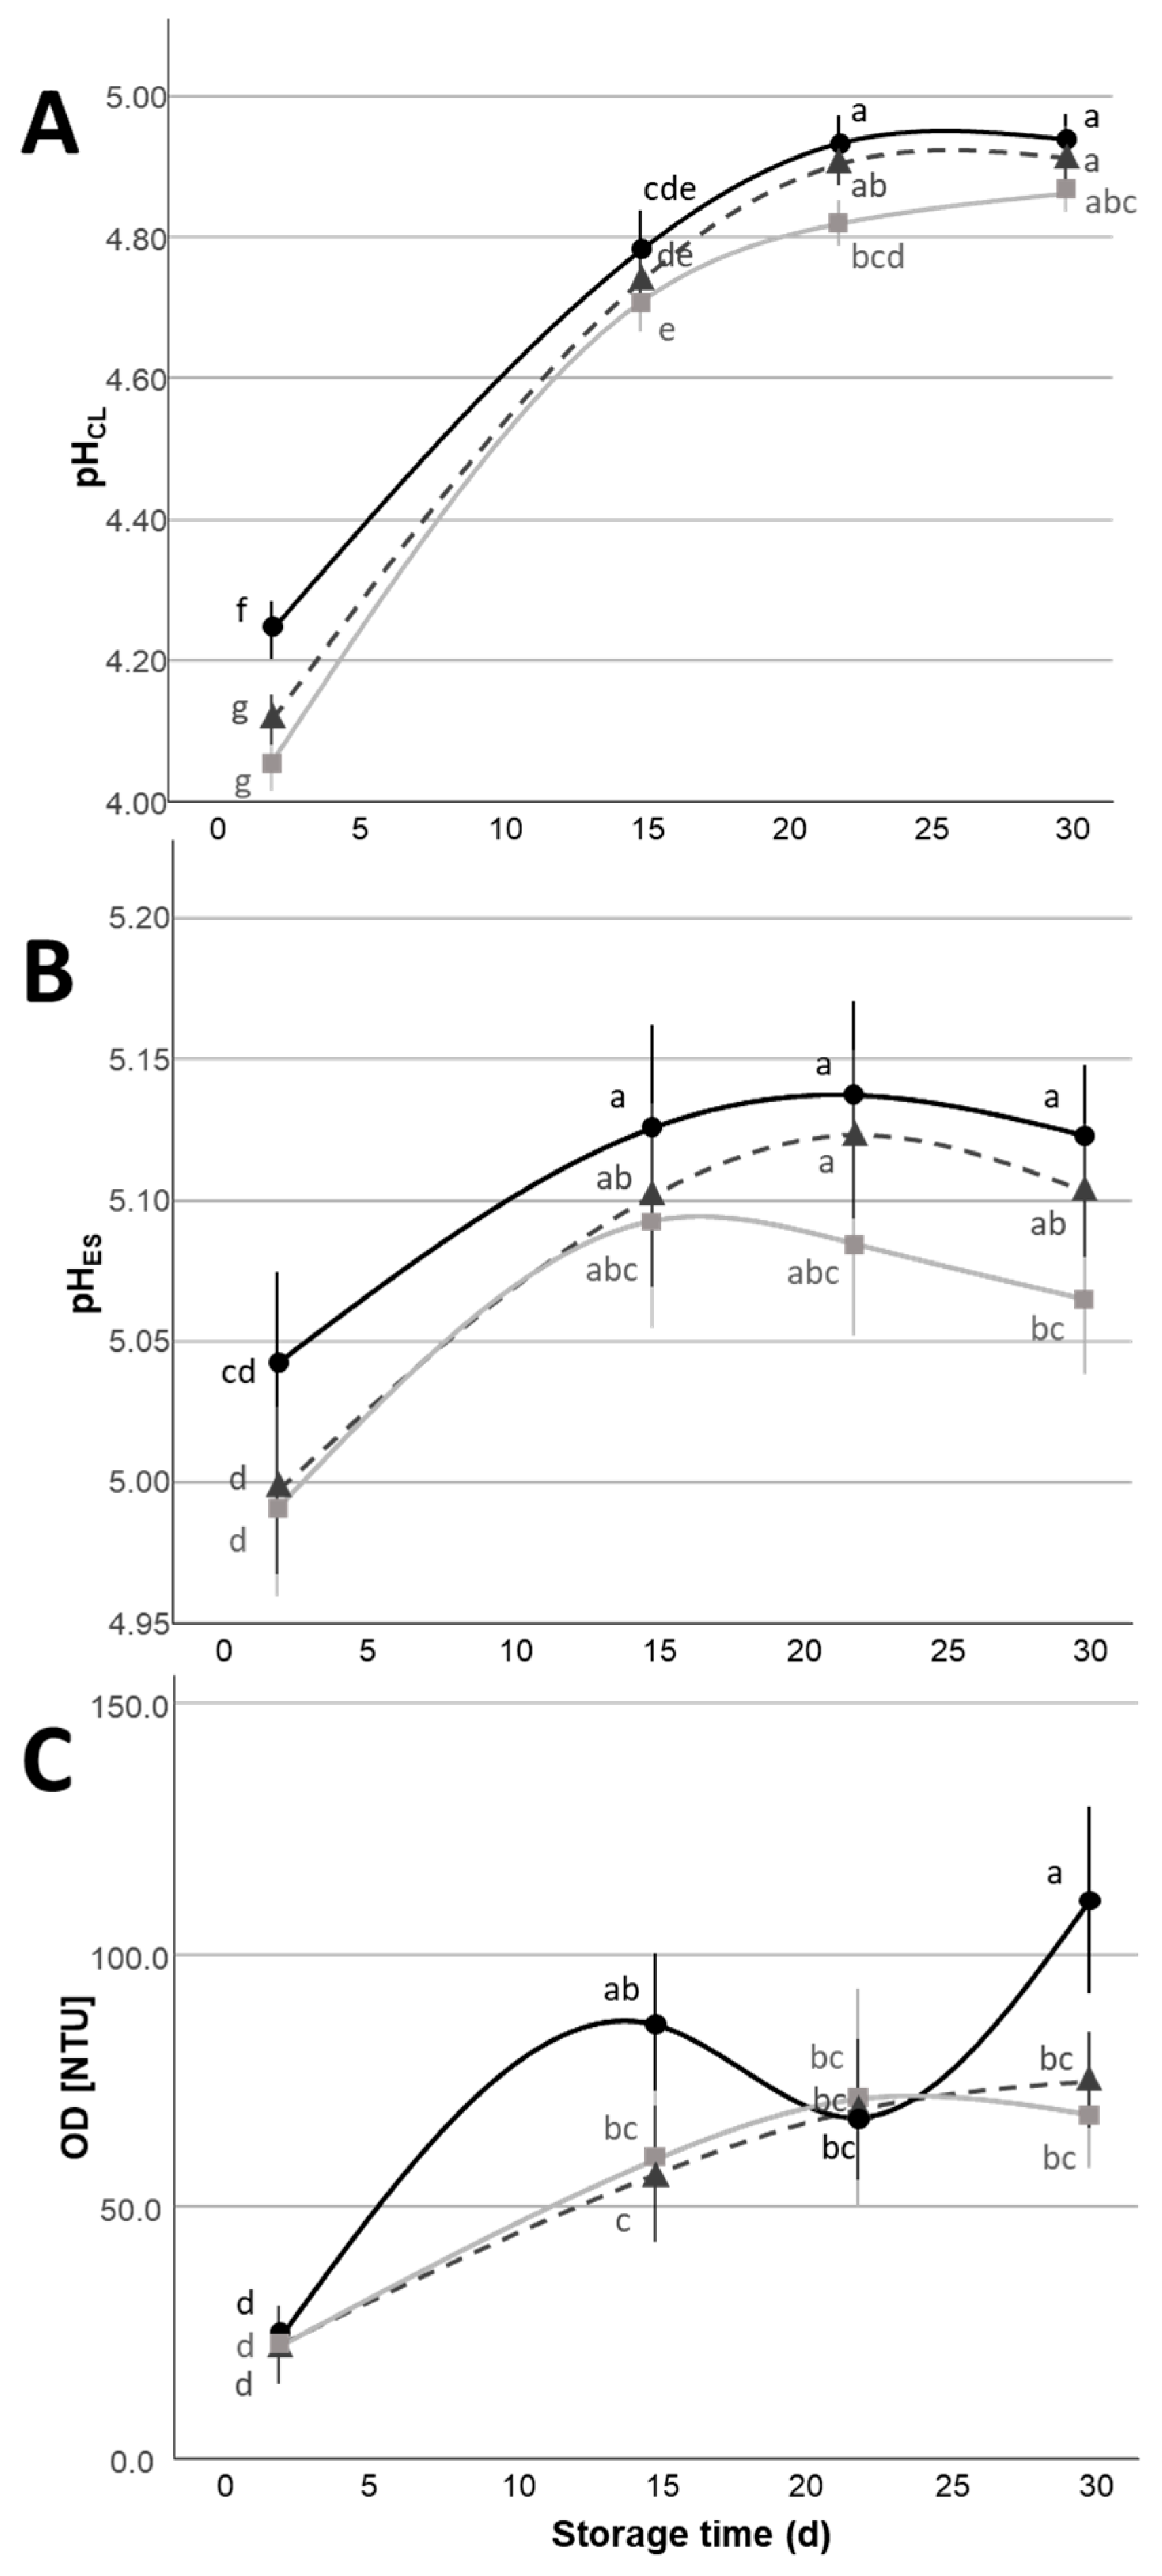 = 1%, = 2%) during the 30 d refrigerated storage. Different letters indicate significant within-group differences (p < 0.05) based on LSD post hoc test.
= 1%, = 2%) during the 30 d refrigerated storage. Different letters indicate significant within-group differences (p < 0.05) based on LSD post hoc test.
= 1%, = 2%) during the 30 d refrigerated storage. Different letters indicate significant within-group differences (p < 0.05) based on LSD post hoc test. = 1%, = 2%) during the 30 d refrigerated storage. Different letters indicate significant within-group differences (p < 0.05) based on LSD post hoc test.
= 1%, = 2%) during the 30 d refrigerated storage. Different letters indicate significant within-group differences (p < 0.05) based on LSD post hoc test.
= 1%, = 2%) during the 30 d refrigerated storage. Different letters indicate significant within-group differences (p < 0.05) based on LSD post hoc test.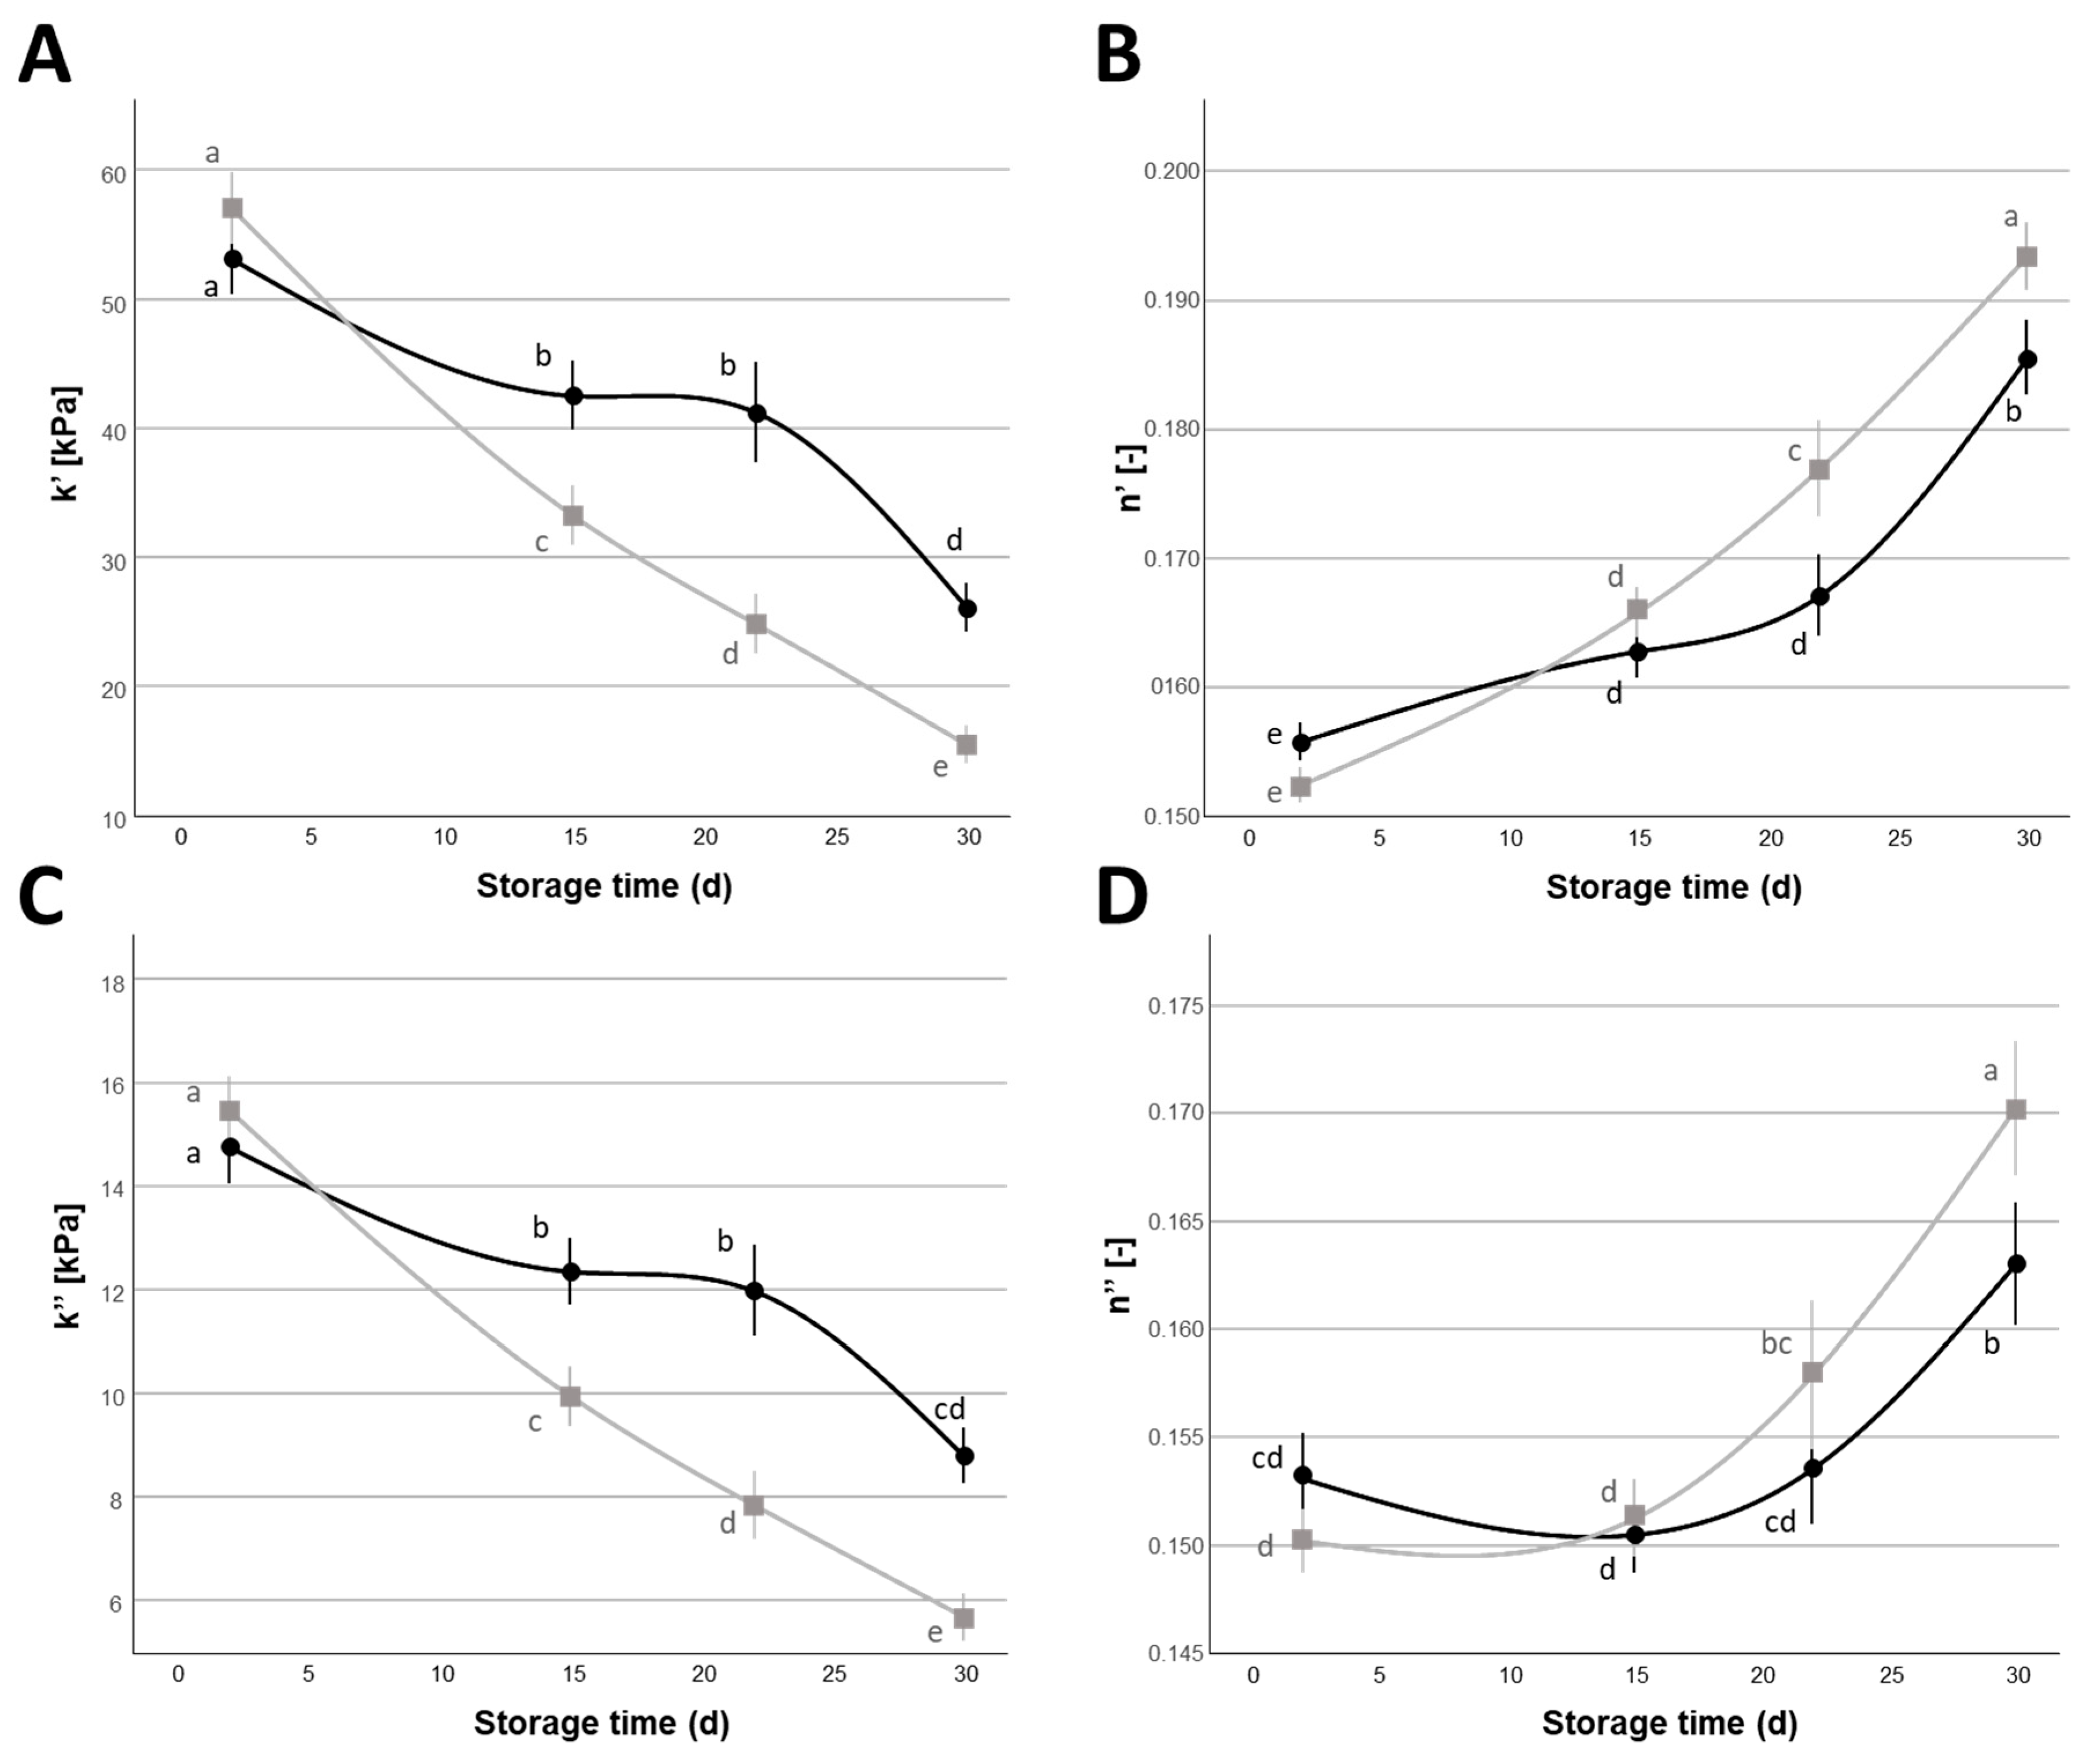 = 1%, = 2%) (A) (Mean ± Standard Error, n = 24), and as a function of the type of organic acid added to the covering liquid (B) (Mean ± Standard Error, n = 64) of Mozzarella di Bufala Campana PDO cheeses. Different letters indicate significant within-group differences (p < 0.05) based on LSD post hoc test.
= 1%, = 2%) (A) (Mean ± Standard Error, n = 24), and as a function of the type of organic acid added to the covering liquid (B) (Mean ± Standard Error, n = 64) of Mozzarella di Bufala Campana PDO cheeses. Different letters indicate significant within-group differences (p < 0.05) based on LSD post hoc test.
= 1%, = 2%) (A) (Mean ± Standard Error, n = 24), and as a function of the type of organic acid added to the covering liquid (B) (Mean ± Standard Error, n = 64) of Mozzarella di Bufala Campana PDO cheeses. Different letters indicate significant within-group differences (p < 0.05) based on LSD post hoc test. = 1%, = 2%) during the 30 d refrigerated storage. Different letters indicate significant within-group differences (p < 0.05) based on LSD post hoc test.
= 1%, = 2%) during the 30 d refrigerated storage. Different letters indicate significant within-group differences (p < 0.05) based on LSD post hoc test.
= 1%, = 2%) during the 30 d refrigerated storage. Different letters indicate significant within-group differences (p < 0.05) based on LSD post hoc test.

| Operation | Mean | SD | CV% | Min | Max |
|---|---|---|---|---|---|
| Milk heat treatment temperature (°C) | 69.3 | 4.6 | 6.6 | 60.0 | 73.0 |
| Milk heat treatment time (s) | 20.0 | 8.7 | 43.3 | 15.0 | 30.0 |
| Natural Whey Starter (L/100 L milk) | 3.0 | 0.7 | 22.1 | 2.0 | 4.2 |
| Natural Whey Starter acidity (°SH/50 mL) | 16.8 | 0.9 | 5.1 | 16.0 | 18.5 |
| Rennet (mL/100 L milk) | 7.0 | 0.9 | 13.2 | 6.0 | 8.3 |
| Rennet strength (IMCU) | 220.0 | 16.4 | 7.5 | 205.0 | 235.0 |
| Time from rennet addition to coagulum cutting (min) | 51.3 | 26.6 | 51.8 | 20.0 | 90.0 |
| Curd acidification time (from starter addition to stretching) (min) | 278.1 | 32.6 | 11.7 | 240.0 | 320.0 |
| Curd pH | 4.9 | 0.0 | 0.6 | 4.9 | 5.0 |
| Stretching fluid temperature (°C) | 94.5 | 1.4 | 1.5 | 93.0 | 97.0 |
| Stretching time (min) | 7.5 | 6.0 | 80.5 | 3.0 | 20.0 |
| Cheese temperature after molding (°C) | 70.3 | 4.6 | 6.5 | 62.0 | 77.0 |
| Hardening water temperature (°C) | 14.9 | 3.8 | 25.3 | 10.0 | 20.0 |
| Hardening time (min) | 39.3 | 27.3 | 69.5 | 15.0 | 90.0 |
| Brine temperature (°C) | 11.6 | 3.6 | 30.8 | 5.0 | 16.0 |
| Brining time (min) | 45.0 | 16.9 | 37.6 | 20.0 | 60.0 |
| Cheese temperature after brining (°C) | 18.1 | 2.4 | 13.0 | 15.0 | 22.0 |
| Factor | WC | MC | ES | ECCL | ECES | pHCL | pHES | ODCL | L*int | a*int | b*int | L*ext | a*ext | b*ext |
|---|---|---|---|---|---|---|---|---|---|---|---|---|---|---|
| Storage time | <0.001 | <0.001 | 0.029 | 0.247 | <0.001 | <0.001 | <0.001 | <0.001 | 0.452 | 0.512 | <0.001 | <0.001 | <0.001 | <0.001 |
| NaCl | 0.009 | 0.038 | <0.001 | <0.001 | <0.001 | 0.110 | 0.029 | 0.115 | 0.316 | 0.004 | 0.561 | 0.970 | 0.826 | 0.145 |
| Organic Acid | 0.487 | 0.527 | 0.962 | 0.770 | 0.751 | 0.001 | 0.009 | 0.040 | 0.268 | 0.032 | 0.023 | 0.924 | 0.266 | 0.799 |
| Storage time × NaCl | 0.015 | 0.186 | 0.428 | 0.478 | 0.203 | 0.951 | 0.540 | 0.083 | 0.803 | 0.875 | 0.253 | 0.941 | 0.864 | 0.973 |
| Storage time × Organic Acid | 0.617 | 0.082 | 0.444 | 0.995 | 0.429 | 0.465 | 0.935 | 0.171 | 0.324 | 0.146 | 0.012 | 0.128 | 0.754 | 0.897 |
| NaCl × Organic Acid | 0.092 | 0.259 | 0.803 | 0.708 | 0.954 | 0.994 | 0.164 | 0.238 | 0.523 | 0.998 | 0.985 | 0.805 | 0.168 | 0.036 |
| NaCl × Organic Acid × Storage time | 0.999 | 0.560 | 0.933 | 0.749 | 0.216 | 0.947 | 0.754 | 0.230 | 0.321 | 0.847 | 0.954 | 0.692 | 0.537 | 0.433 |
| % NaCl | Storage Time (d) | ECES [mS] | ECCL [mS] |
|---|---|---|---|
| 1% | 2 | 14.8 ± 0.3 e | 15.4 ± 0.3 b |
| 15 | 15.6 ± 0.3 de | 15.5 ± 0.5 b | |
| 22 | 15.8 ± 0.5 de | 15.2 ± 0.3 b | |
| 30 | 16.9 ± 0.3 d | 16.1 ± 0.3 b | |
| 2% | 2 | 20.6 ± 0.5 c | 24.8 ± 0.6 a |
| 15 | 23.1 ± 0.6 ab | 24.5 ± 0.8 a | |
| 22 | 23.0 ± 0.8 b | 23.8 ± 0.5 a | |
| 30 | 24.3 ± 0.5 a | 24.4 ± 0.3 a |
| Storage Time (d) | L*int | a*int | b*int | L*ext | a*ext | b*ext |
|---|---|---|---|---|---|---|
| 2 | 92.92 ± 0.04 a | −2.46 ± 0.01 a | 12.93 ± 0.05 a | 95.53 ± 0.02 a | −1.64 ± 0.01 a | 6.79 ± 0.04 c |
| 15 | 93.12 ± 0.04 a | −2.48 ± 0.01 a | 12.34 ± 0.05 b | 95.33 ± 0.02 b | −1.71 ± 0.01 b | 7.18 ± 0.04 b |
| 22 | 93.15 ± 0.03 a | −2.50 ± 0.01 a | 12.32 ± 0.04 b | 95.16 ± 0.02 c | −1.78 ± 0.01 c | 7.73 ± 0.04 a |
| 30 | 93.09 ± 0.04 a | −2.46 ± 0.01 a | 11.87 ± 0.05 c | 94.97 ± 0.02 d | −1.78 ± 0.01 c | 7.81 ± 0.04 a |
| Factor | Hardness | Gumminess | Cohesiveness | Springiness | Tc | k′ | n′ | k″ | n″ | Tanδ1rad/s |
|---|---|---|---|---|---|---|---|---|---|---|
| Storage time | <0.001 | <0.001 | <0.001 | <0.001 | <0.001 | <0.001 | <0.001 | <0.001 | <0.001 | <0.001 |
| NaCl | 0.004 | 0.004 | 0.016 | 0.016 | 0.187 | 0.001 | 0.019 | 0.001 | 0.175 | 0.002 |
| Organic Acid | 0.434 | 0.394 | 0.797 | 0.353 | 0.101 | 0.889 | 0.774 | 0.987 | 0.381 | 0.041 |
| Storage time × NaCl | 0.001 | 0.001 | 0.257 | 0.222 | 0.005 | 0.001 | 0.016 | 0.002 | 0.145 | 0.002 |
| Storage time × Organic Acid | 0.533 | 0.519 | 0.512 | 0.104 | 0.999 | 0.260 | 0.094 | 0.342 | 0.418 | 0.136 |
| NaCl × Organic Acid | 0.938 | 0.898 | 0.296 | 0.286 | 0.198 | 0.577 | 0.154 | 0.318 | 0.016 | 0.615 |
| NaCl × Organic Acid × Storage time | 0.963 | 0.946 | 0.407 | 0.106 | 0.999 | 0.680 | 0.887 | 0.668 | 0.839 | 0.469 |
Disclaimer/Publisher’s Note: The statements, opinions and data contained in all publications are solely those of the individual author(s) and contributor(s) and not of MDPI and/or the editor(s). MDPI and/or the editor(s) disclaim responsibility for any injury to people or property resulting from any ideas, methods, instructions or products referred to in the content. |
© 2025 by the authors. Licensee MDPI, Basel, Switzerland. This article is an open access article distributed under the terms and conditions of the Creative Commons Attribution (CC BY) license (https://creativecommons.org/licenses/by/4.0/).
Share and Cite
Fenga, I.; Alinovi, M.; Paciulli, M.; Mucchetti, G.; Chiavaro, E. Structural and Physico-Chemical Changes of Mozzarella di Bufala Campana Cheese Influenced by Covering Liquid Composition. Foods 2025, 14, 1506. https://doi.org/10.3390/foods14091506
Fenga I, Alinovi M, Paciulli M, Mucchetti G, Chiavaro E. Structural and Physico-Chemical Changes of Mozzarella di Bufala Campana Cheese Influenced by Covering Liquid Composition. Foods. 2025; 14(9):1506. https://doi.org/10.3390/foods14091506
Chicago/Turabian StyleFenga, Irene, Marcello Alinovi, Maria Paciulli, Germano Mucchetti, and Emma Chiavaro. 2025. "Structural and Physico-Chemical Changes of Mozzarella di Bufala Campana Cheese Influenced by Covering Liquid Composition" Foods 14, no. 9: 1506. https://doi.org/10.3390/foods14091506
APA StyleFenga, I., Alinovi, M., Paciulli, M., Mucchetti, G., & Chiavaro, E. (2025). Structural and Physico-Chemical Changes of Mozzarella di Bufala Campana Cheese Influenced by Covering Liquid Composition. Foods, 14(9), 1506. https://doi.org/10.3390/foods14091506