

Synergistic Effects of Selected Nonthermal Technologies Combined with Soursop Leaf Extract on the Quality and Shelf Life of Refrigerated Pacific White Shrimp

 ,
,  ,
,  ,
,  , , and
Abstract
1. Introduction
2. Materials and Methods
2.1. Chemicals
2.2. Preparation of SLE
2.3. Shrimp Collection and Preparation
2.3.1. Preparation of PWS With and Without PEF-SLE-VI Treatments
2.3.2. Treatments of PWS With and Without MAP and CP
- Control (PWS packed under air without any treatment).
- CP (PWS packed under air and subjected to CP treatment only).
- PEF-SLE1-VI-MAP1 (PWS subjected to PEF, SLE (1%) using VI for 2 cycles, and MAP (CO2/Ar: 50%/50%).
- PEF-SLE1-VI-MAP2 (PWS subjected to PEF, SLE (1%) using VI for 2 cycles, and MAP (CO2/N2: 50%/50%).
- PEF-SLE1-VI-MAP3 (PWS subjected to PEF, SLE (1%) using VI for 2 cycles, and MAP (CO2/N2/Ar: 60%/30%/10%).
- PEF-SLE1-VI-MAP1-CP (PWS subjected to PEF, SLE (1%) using VI for 2 cycles, MAP (CO2/Ar: 50%/50%), and CP.
- PEF-SLE1-VI-MAP2-CP (PWS subjected to PEF, SLE (1%) using VI for 2 cycles, MAP (CO2/N2: 50%/50%), and CP.
- PEF-SLE1-VI-MAP3-CP (PWS subjected to PEF, SLE (1%) using VI for 2 cycles, MAP (CO2/N2/Ar: 60%/30%/10%), and CP.
2.4. Analyses
2.4.1. Color
2.4.2. Melanosis Score
2.4.3. Textural Property
2.4.4. Microstructure
2.4.5. Microbiological Quality
2.4.6. pH
2.4.7. Total Volatile Base (TVB) Content
2.4.8. Peroxide Value (PV) and Thiobarbituric Acid Reactive Substances (TBARSs)
2.4.9. Fatty Acid (FA) Profiles
2.4.10. Sensory Property
2.5. Statistical Analysis
3. Results
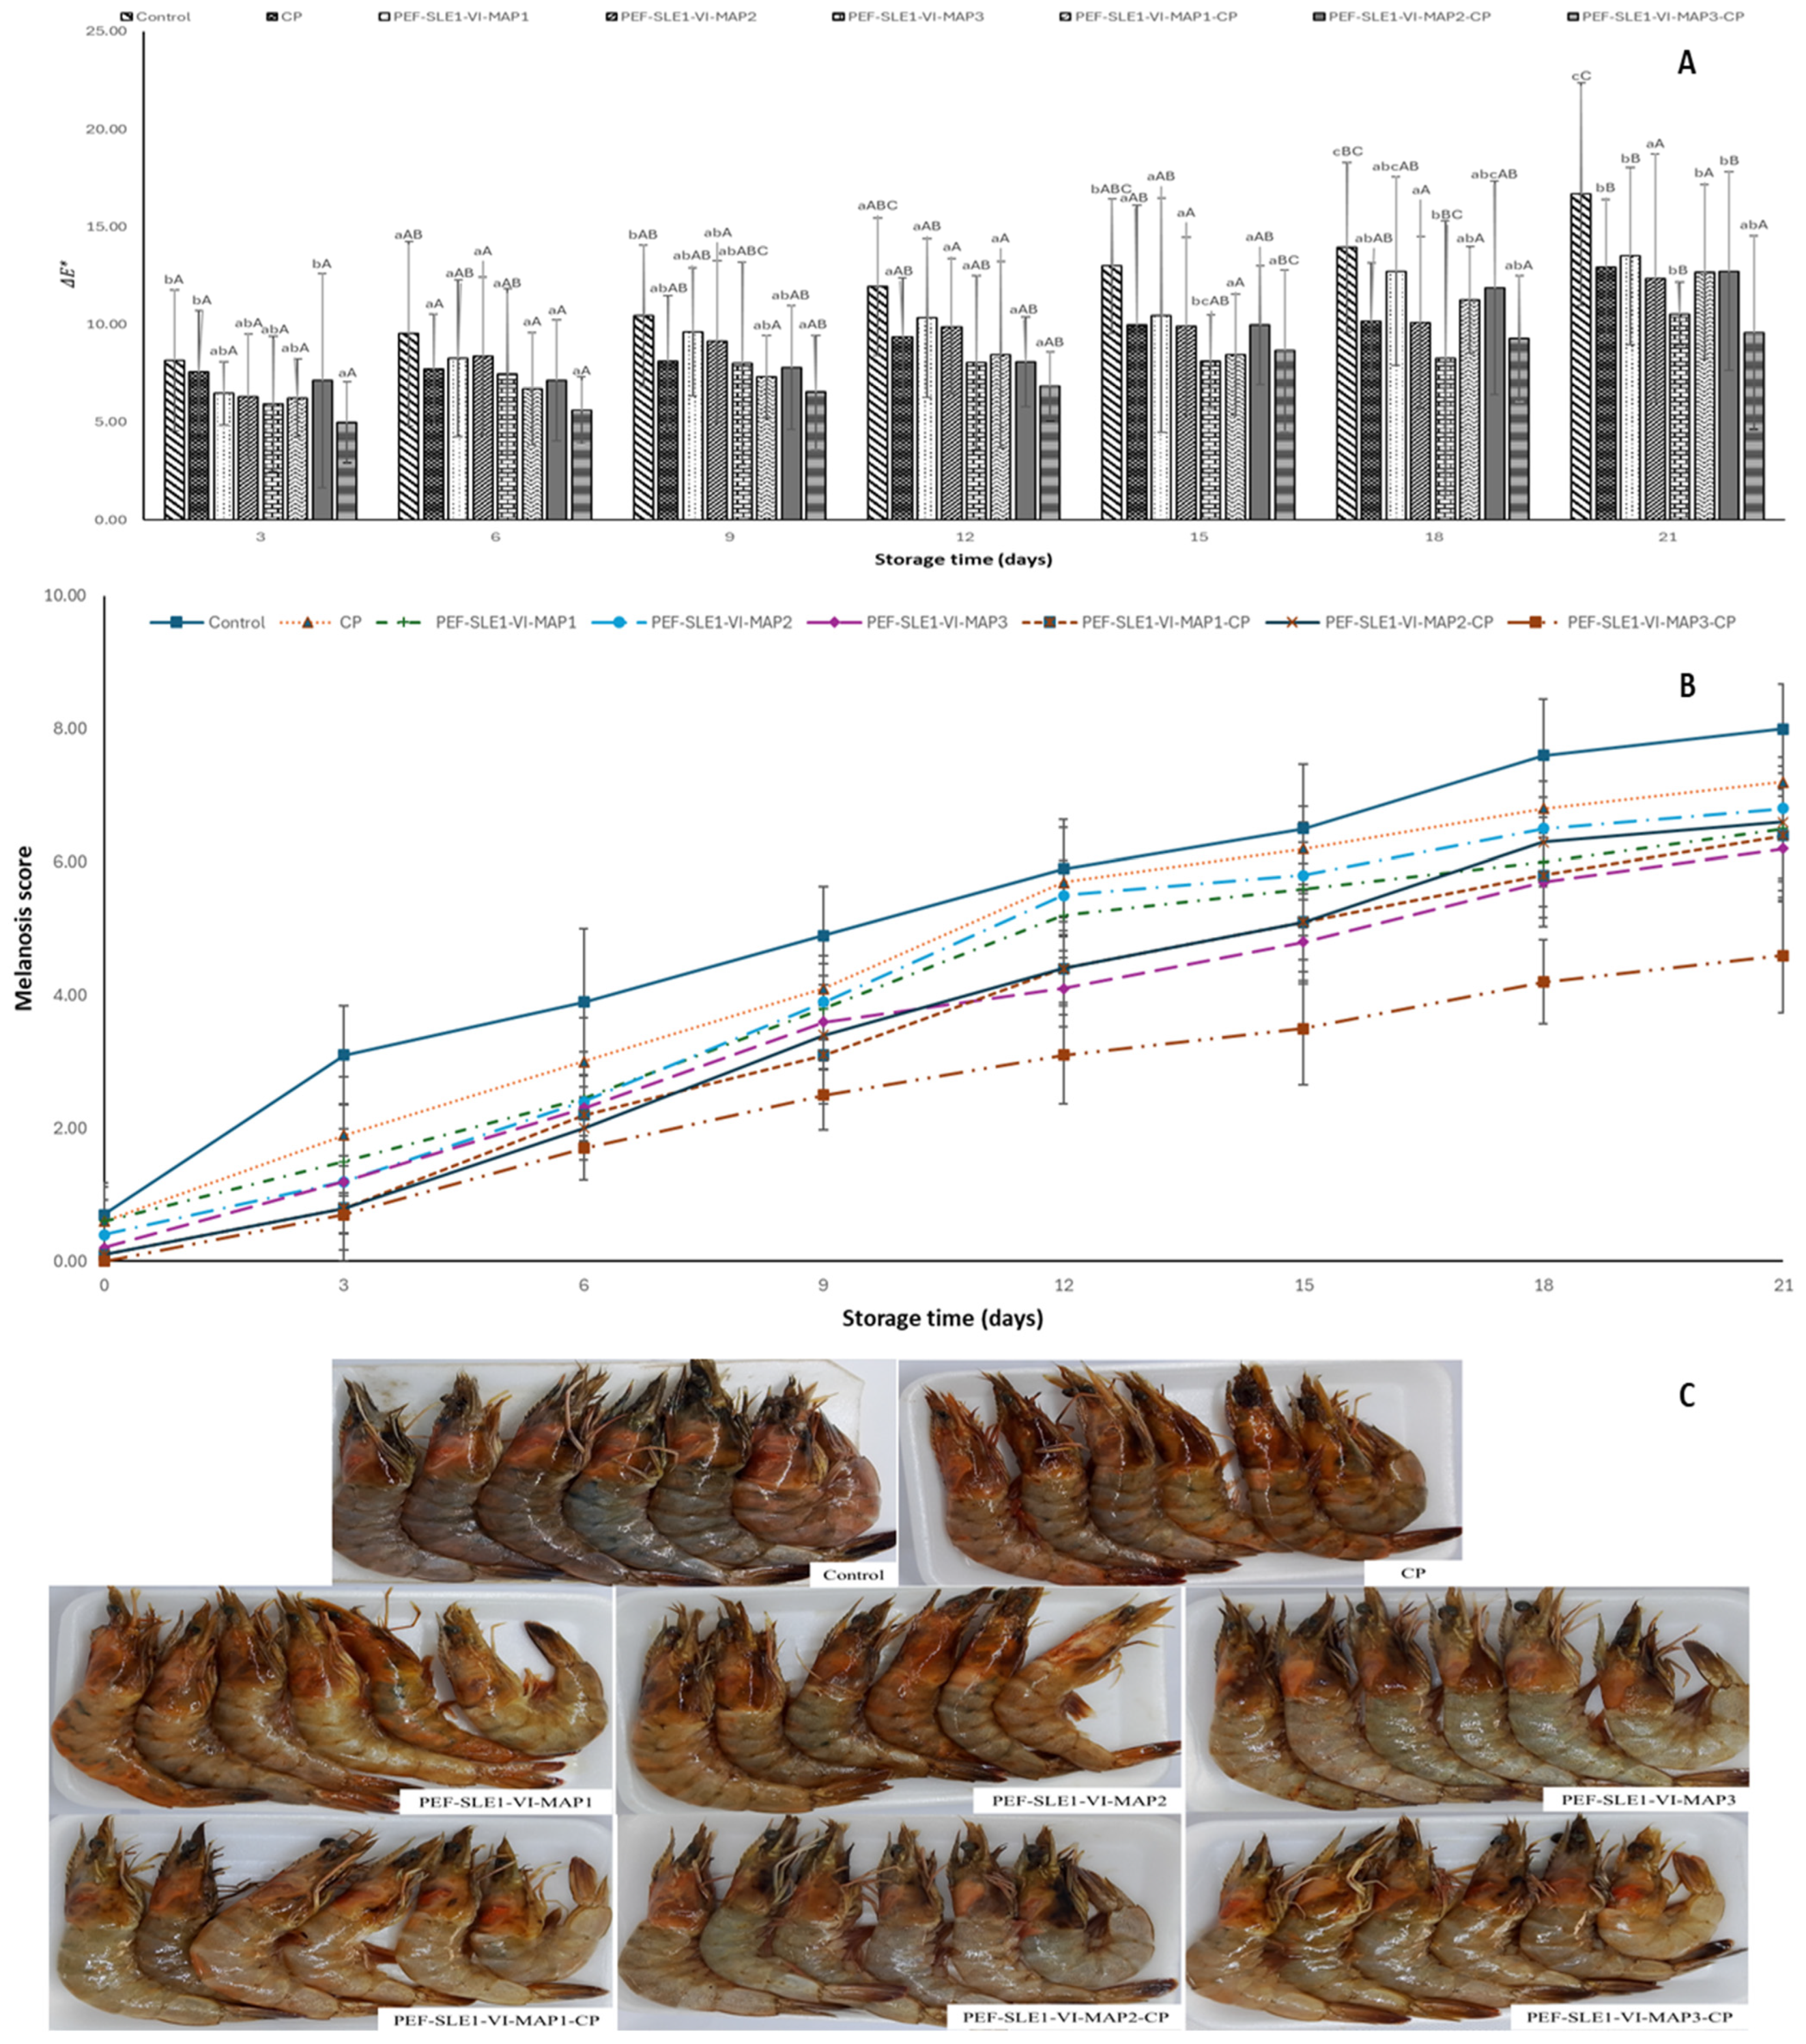
3.1. Color Changes
3.2. Melanosis
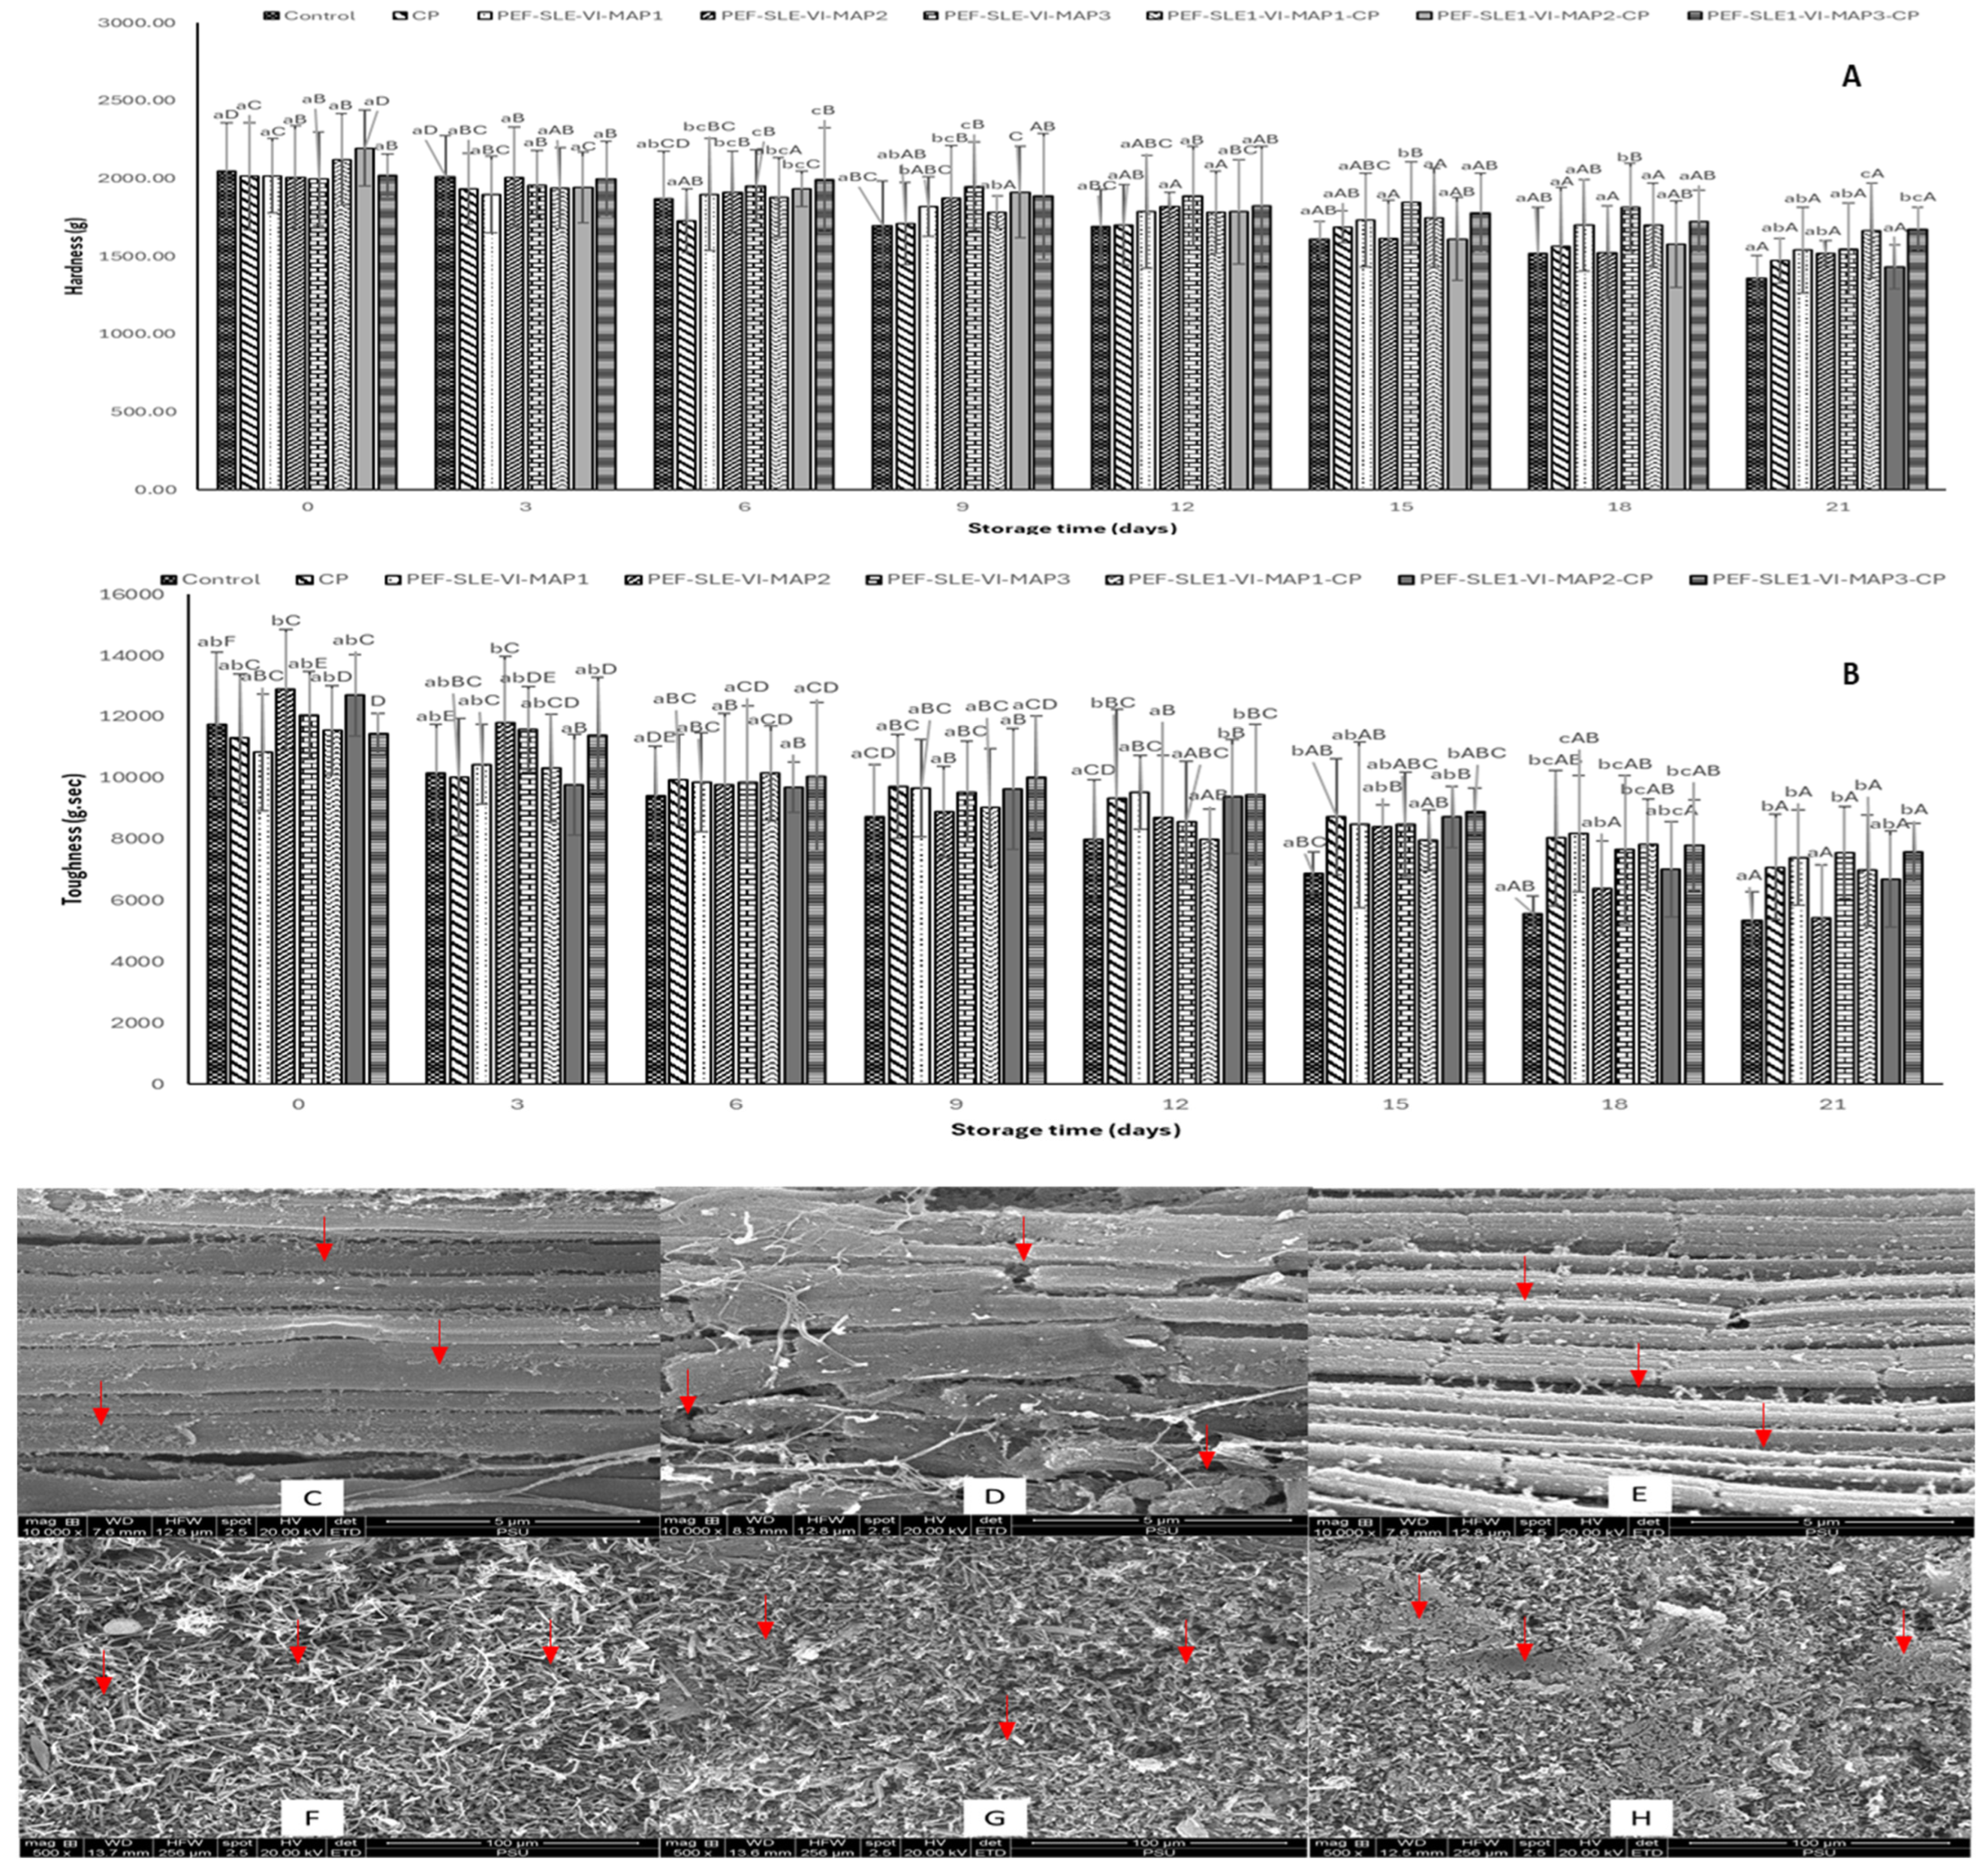
3.3. Textural Properties
3.4. Microstructure
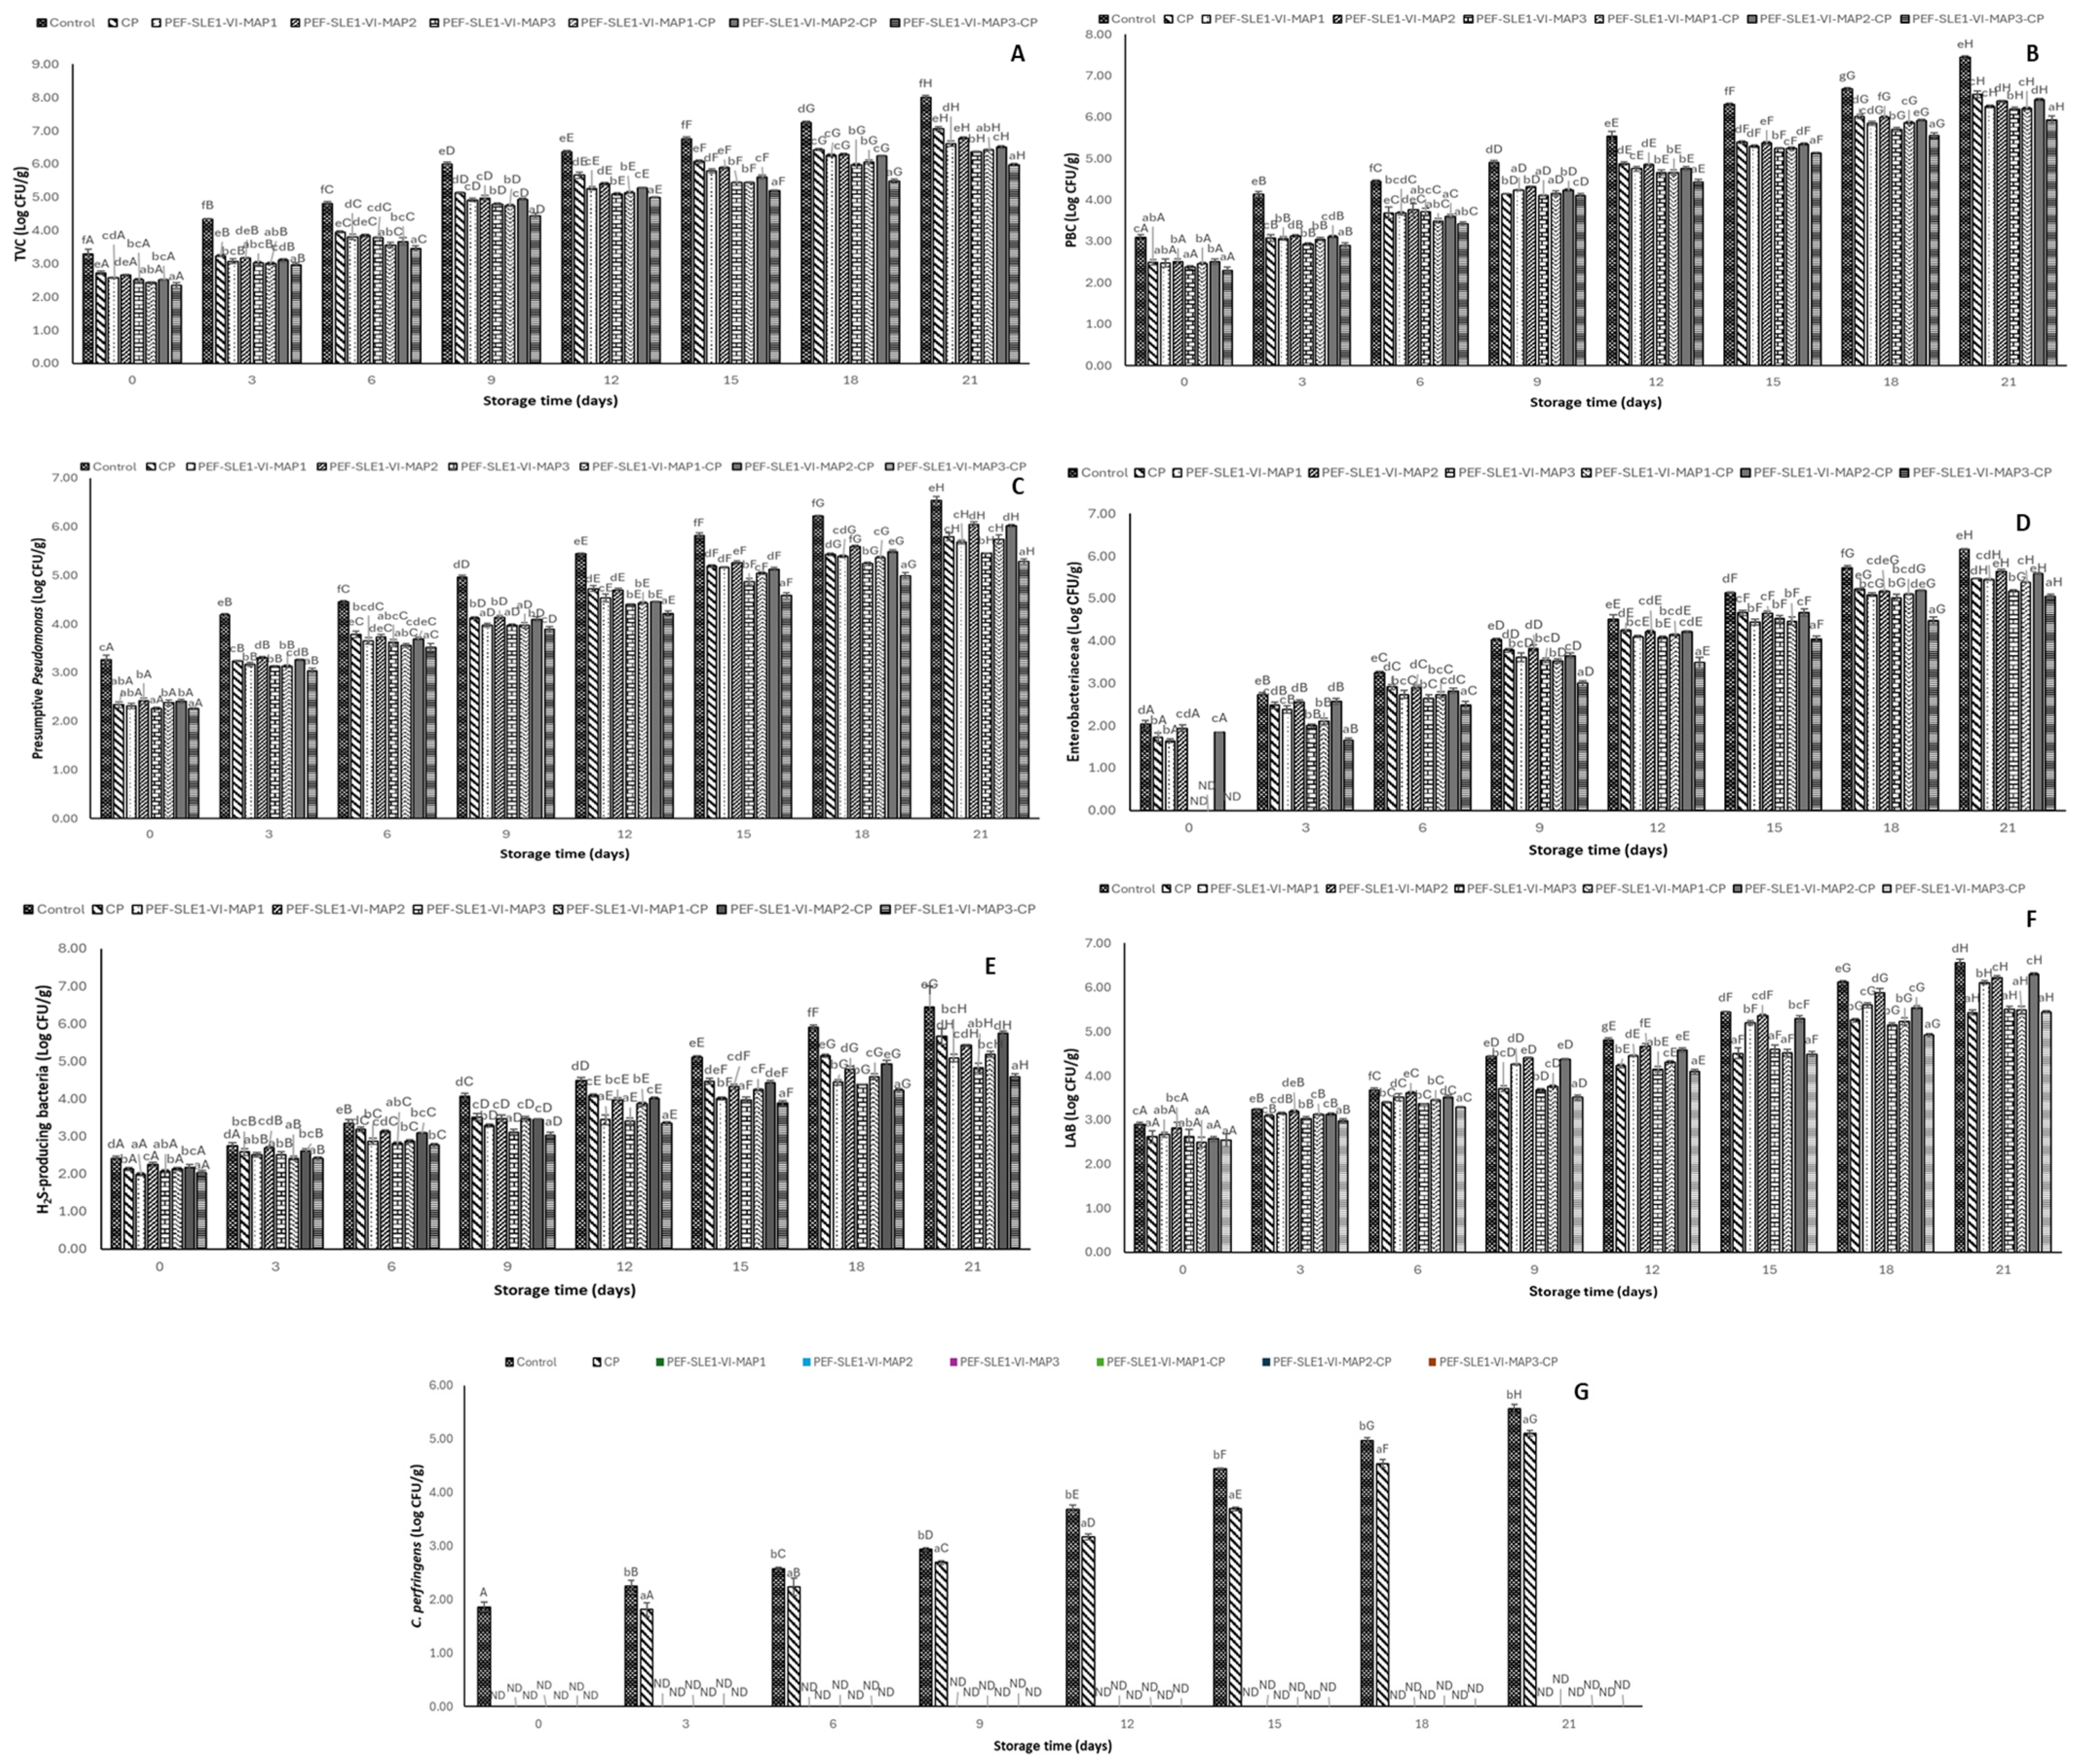
3.5. Bacterial Load
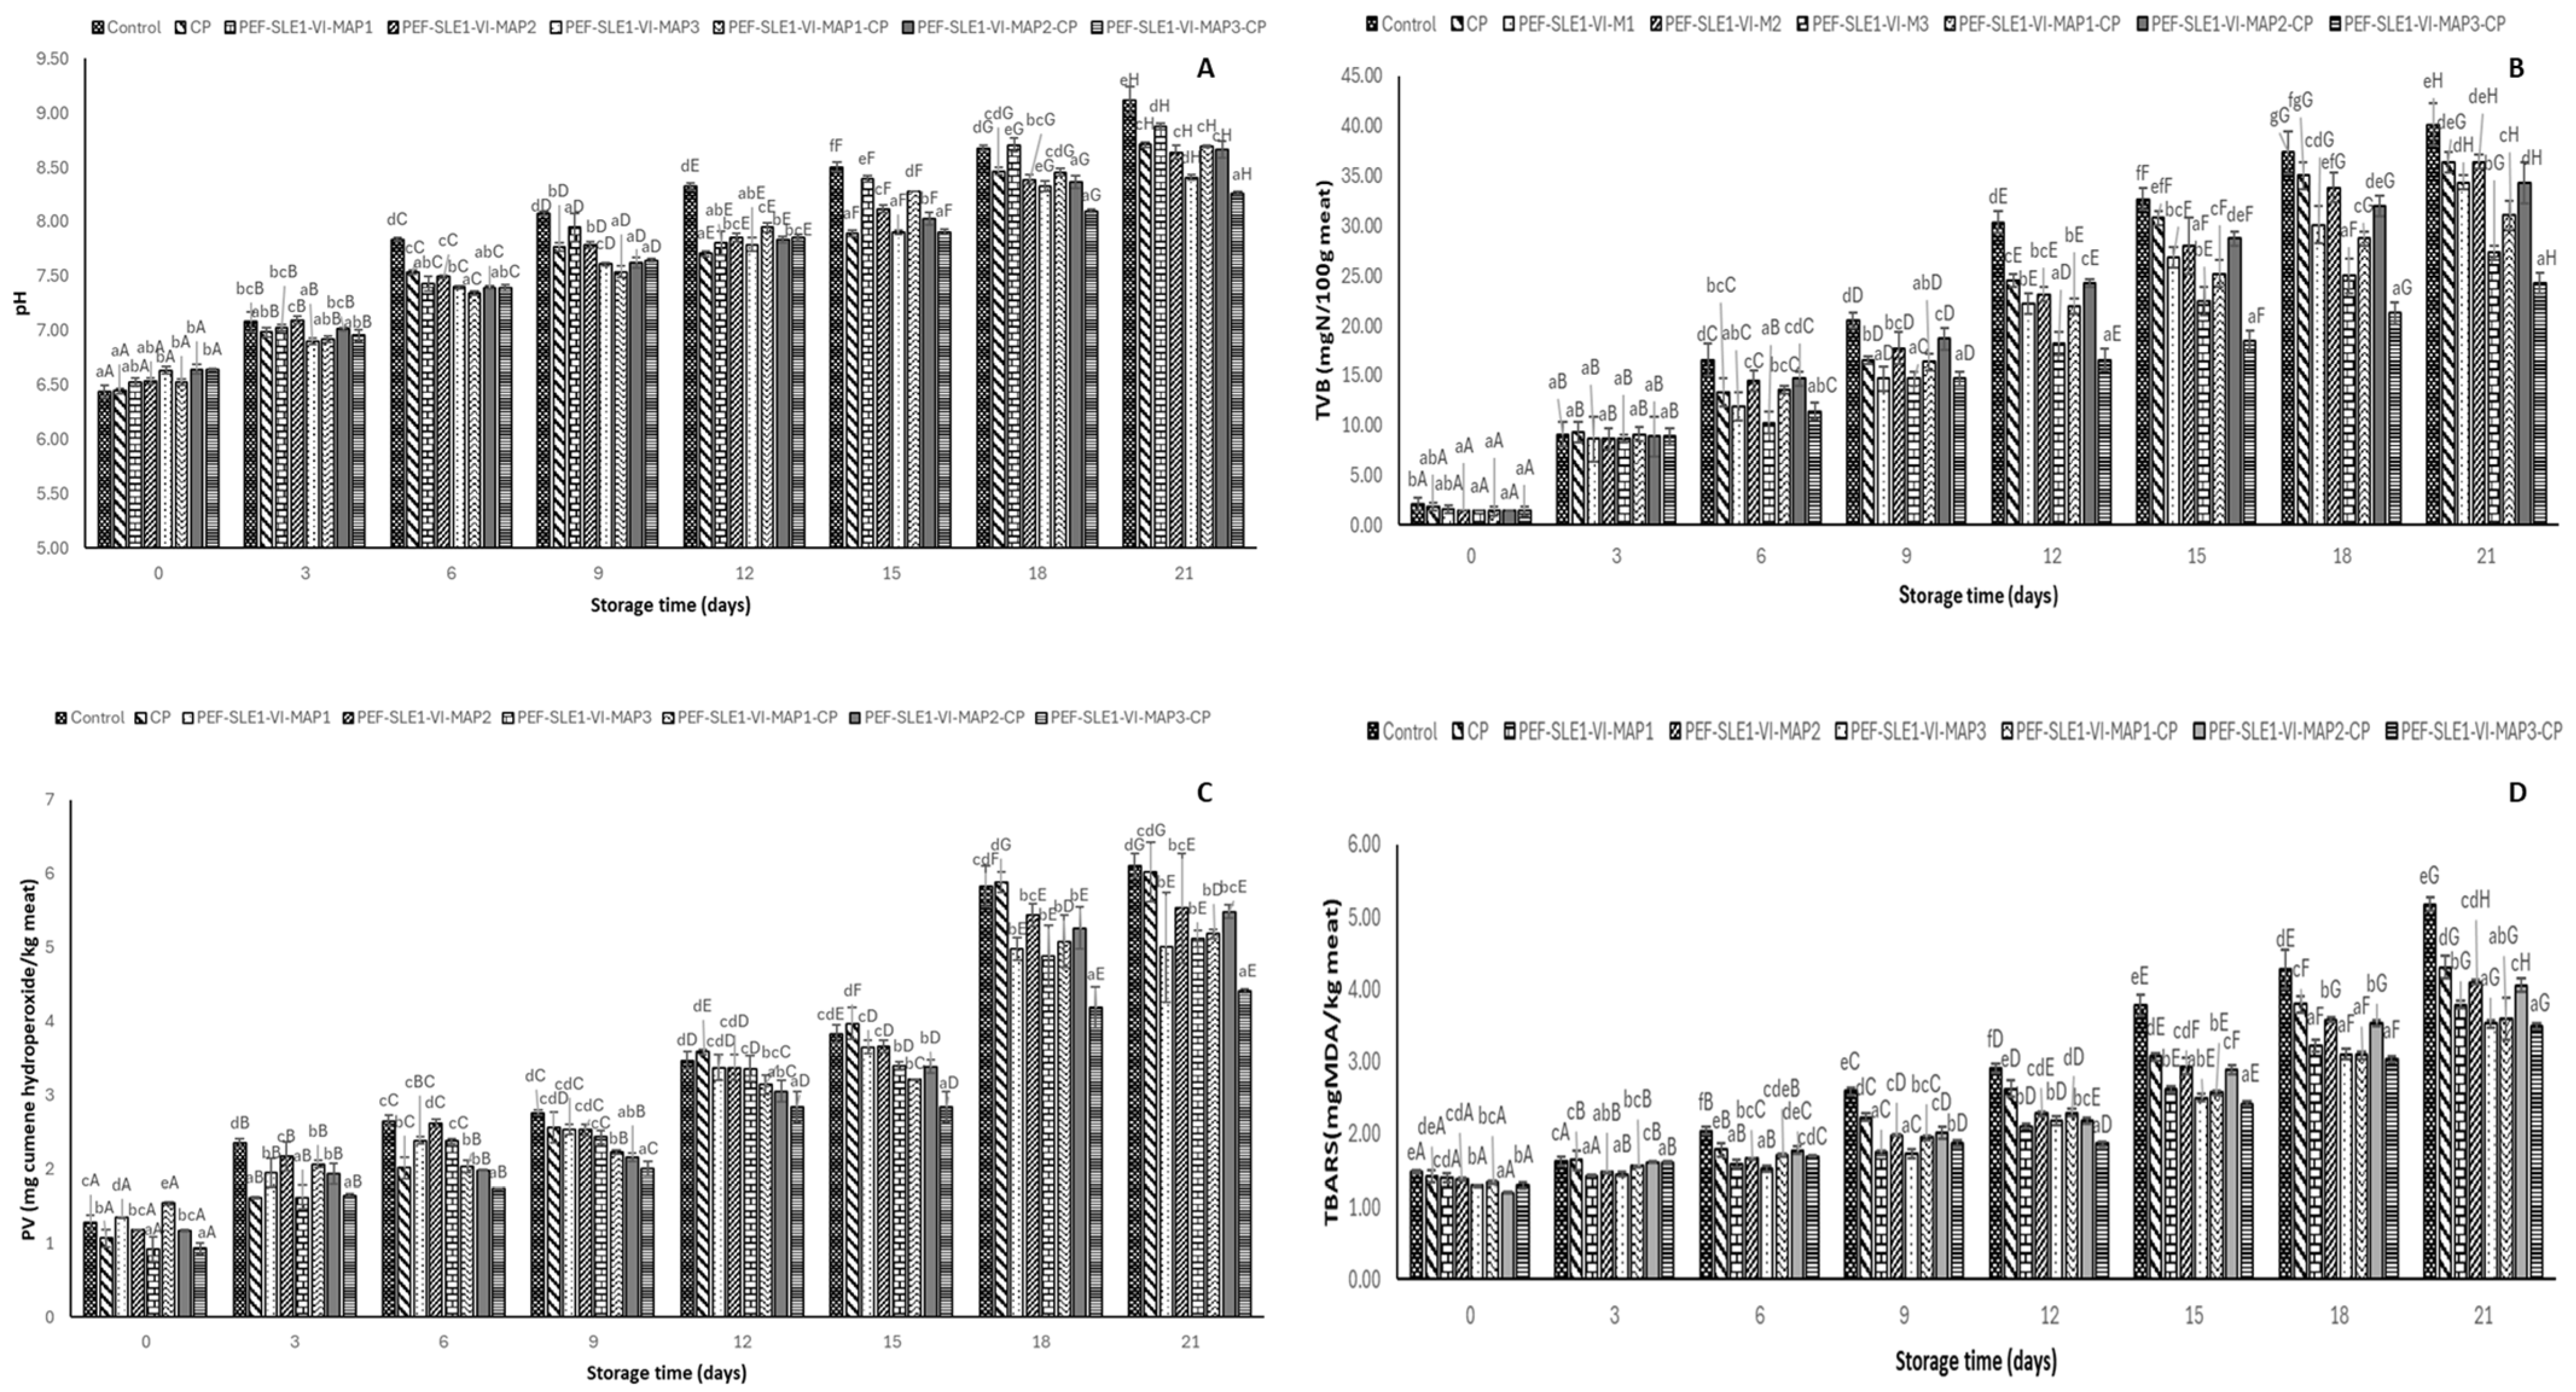
3.6. pH
3.7. Total Volatile Basic Content (TVB)
3.8. Peroxide Value (PV) and Thiobarbituric Acid Reactive Substances (TBARS)
3.9. Fatty Acid Profiles
3.10. Sensory Property
4. Conclusions
Author Contributions
Funding
Institutional Review Board Statement
Informed Consent Statement
Data Availability Statement
Acknowledgments
Conflicts of Interest
References
- Huang, M.; Zhou, Y.; Tian, H.; Pan, S.; Yang, X.; Gao, Q.; Dong, S. Rapidly Increased Greenhouse Gas Emissions by Pacific White Shrimp Aquacultural Intensification and Potential Solutions for Mitigation in China. Aquaculture 2024, 587, 740825. [Google Scholar] [CrossRef]
- Jeyakumari, A.; Debbarma, J.; Remya, S.; Ravishankar, C.N.; Zynudheen, A.A.; Ninan, G.; Lalitha, K.V. Quality Changes of White Shrimp (Litopenaeus Vannamei) Treated with Potassium Sorbate and Sodium Metabisulphite: A Comparative Study. Int. J. Curr. Microbiol. Appl. Sci. 2019, 8, 1331–1339. [Google Scholar] [CrossRef]
- Sae-leaw, T.; Benjakul, S. Prevention of Quality Loss and Melanosis of Pacific White Shrimp by Cashew Leaf Extracts. Food Control 2019, 95, 257–266. [Google Scholar] [CrossRef]
- Xu, D.; Yang, X.; Wang, Y.; Sun, L. Cascading Mechanism Triggering the Activation of Polyphenol Oxidase Zymogen in Shrimp Litopenaeus vannamei After Postmortem and the Correlation with Melanosis Development. Food Bioprocess Technol. 2020, 13, 1131–1145. [Google Scholar] [CrossRef]
- Senapati, S.R.; Kumar, G.P.; Singh, C.B.; Xavier, K.A.M.; Chouksey, M.K.; Nayak, B.B.; Balange, A.K. Melanosis and Quality Attributes of Chill Stored Farm Raised Whiteleg Shrimp (Litopenaeus vannamei). J. Appl. Nat. Sci. 2017, 9, 626–631. [Google Scholar] [CrossRef]
- Qian, Y.; Ye, J.; Yang, S.; Lin, Z.; Cao, W.; Xie, J. Evaluation of the Spoilage Potential of Shewanella putrefaciens, Aeromonas hydrophila, and Aeromonas sobria Isolated from Spoiled Pacific White Shrimp (Litopenaeus vannamei) during Cold Storage. J. Food Saf. 2018, 38, e12550. [Google Scholar] [CrossRef]
- Zhang, W.; Han, Y.; Yang, S.; Wang, S.; Wu, J.; Jiao, T.; Wei, J.; Li, D.; Chen, X.; Chen, Q.; et al. Non-Destructive Prediction of Total Volatile Basic Nitrogen (TVB-N) Content of Litopenaeus vannamei Using A Bi-Channel Data Acquisition of Colorimetric Sensing Array. J. Food Compos. Anal. 2024, 128, 106026. [Google Scholar] [CrossRef]
- Ahmad, A.S.; Zhang, B.; Hong, H.; Ma, L.; Benjakul, S. Combined Effects of Pulsed Electric Field and Soursop Leaf Extract Treatment and Modified Atmosphere Packaging on Melanosis Inhibition and Shelf-Life Elongation of Pacific White Shrimp during Refrigerated Storage. Innov. Food Sci. Emerg. Technol. 2025, 100, 103903. [Google Scholar] [CrossRef]
- Ginson, J.; Remya Kumari, K.R.; Bindu, J. Review on Spoilage and Quality Indices of Prawns. Fish. Technol. 2021, 58, 191–202. [Google Scholar]
- Andrade, L.T.D.; Araújo, N.G.; Ventura, A.P.M.; Lira, A.D.L.; Magnani, M.; Cavalheiro, J.M.D.O. Standardization of Sodium Metabisulfite Solution Concentrations and Immersion Time for Farmed Shrimp Litopenaeus vannamei. Ciência Rural 2015, 45, 499–504. [Google Scholar] [CrossRef]
- Nolasco-González, Y.; Chacón-López, M.A.; Ortiz-Basurto, R.I.; Aguilera-Aguirre, S.; González-Aguilar, G.A.; Rodríguez-Aguayo, C.; Navarro-Cortez, M.C.; García-Galindo, H.S.; García-Magaña, M.d.L.; Meza-Espinoza, L.; et al. Annona muricata Leaves as a Source of Bioactive Compounds: Extraction and Quantification Using Ultrasound. Horticulturae 2022, 8, 560. [Google Scholar] [CrossRef]
- Ahmad, A.S.; Sae-leaw, T.; Zhang, B.; Singh, P.; Kim, J.T.; Benjakul, S. Impact of Ethanolic Thai Indigenous Leaf Extracts on Melanosis Prevention and Shelf-Life Extension of Refrigerated Pacific White Shrimp. Foods 2023, 12, 3649. [Google Scholar] [CrossRef]
- Ahmad, A.S.; Sae-leaw, T.; Zhang, B.; Benjakul, S. Antioxidant and Antimicrobial Activities of Ethanolic Jik (Barringtonia Acutangula) Leaf Extract and Its Application for Shelf-Life Extension of Pacific White Shrimp Meat during Refrigerated Storage. Food Control 2024, 155, 110037. [Google Scholar] [CrossRef]
- Shiekh, K.A.; Benjakul, S. Effect of Pulsed Electric Field Treatments on Melanosis and Quality Changes of Pacific White Shrimp during Refrigerated Storage. J. Food Process. Preserv. 2020, 44, e14292. [Google Scholar] [CrossRef]
- Kimbuathong, N.; Leelaphiwat, P.; Harnkarnsujarit, N. Inhibition of Melanosis and Microbial Growth in Pacific White Shrimp (Litopenaeus vannamei) Using High CO2 Modified Atmosphere Packaging. Food Chem. 2020, 312, 126114. [Google Scholar] [CrossRef]
- Opara, U.L.; Caleb, O.J.; Belay, Z.A. Modified Atmosphere Packaging for Food Preservation. In Food Quality and Shelf Life; Elsevier: Amsterdam, The Netherlands, 2019; pp. 235–259. [Google Scholar]
- Shiekh, K.A.; Zhou, P.; Benjakul, S. Combined Effects of Pulsed Electric Field, Chamuang Leaf Extract and Cold Plasma on Quality and Shelf-Life of Litopenaeus vannamei. Food Biosci. 2021, 41, 100975. [Google Scholar] [CrossRef]
- Chauhan, O.P.; Unni, L.E. Pulsed Electric Field (PEF) Processing of Foods and Its Combination with Electron Beam Processing. In Electron Beam Pasteurization and Complementary Food Processing Technologies; Elsevier: Amsterdam, The Netherlands, 2015; pp. 157–184. [Google Scholar]
- Olatunde, O.O.; Benjakul, S. Nonthermal Processes for Shelf-Life Extension of Seafoods: A Revisit. Compr. Rev. Food Sci. Food Saf. 2018, 17, 892–904. [Google Scholar] [CrossRef]
- Ahmad, A.S.; Sae-leaw, T.; Ma, L.; Zhang, B.; Benjakul, S. Combined Effect of Prior Pulsed Electric Field, Dechlorophyl-lized Soursop Leaf Extract and Vacuum Impregnation on Melanosis Inhibition and Shelf-Life Extension of Refrigerated Pacific White Shrimp. Food Control 2024, 163, 110494. [Google Scholar] [CrossRef]
- Peng, S.; Wei, H.; Zhan, S.; Yang, W.; Lou, Q.; Deng, S.; Yu, X.; Huang, T. Spoilage Mechanism and Preservation Technologies on the Quality of Shrimp: An Overview. Trends Food Sci. Technol. 2022, 129, 233–243. [Google Scholar] [CrossRef]
- Simoes, J.S.; Mársico, E.T.; Lázaro, C.A.; Ferreira, M.d.S.; Franco, R.M.; Pereira, A.P.A.A.S.; Conte-Junior, C.A. Microbiological, Physical and Chemical Characteristics of Freshwater Prawns (Macrobrachium rosenbergii) in Modified-Atmosphere Packaging. Int. J. Food Sci. Technol. 2015, 50, 128–135. [Google Scholar] [CrossRef]
- Rawat, S. Food Spoilage: Microorganisms and Their Prevention. Asian J. Plant Sci. Res. 2015, 5, 47–56. [Google Scholar]
- Sandhya. Modified Atmosphere Packaging of Fresh Produce: Current Status and Future Needs. LWT Food Sci. Technol. 2010, 43, 381–392. [Google Scholar] [CrossRef]
- Zhao, M.; Liu, Z.; Zhao, Y.; Gao, C.; Wang, J.; Xia, G.; Li, C.; Zhou, D. Dielectric Barrier Discharge Cold Plasma Collaborated with Coconut Exocarp Flavonoids: A Promising Technology for Oyster Preservation under Refrigerated Storage. LWT-Food Sci. Technol. 2024, 196, 115888. [Google Scholar] [CrossRef]
- Laroussi, M.; Mendis, D.A.; Rosenberg, M. Plasma interaction with Microbes. New J. Phys. 2003, 5, 41. [Google Scholar] [CrossRef]
- Conway, E.J.; Byrne, A. Micro-Diffusion Analysis of TVN. Biochem. J. 1933, 27, 419–429. [Google Scholar]
- Bligh, E.G.; Dyer, W.J. A Rapid Method of Total Lipid Extraction and Purification. Can. J. Biochem. Physiol. 1959, 37, 911–917. [Google Scholar] [CrossRef] [PubMed]
- Meilgaard, M.C.; Carr, B.T.; Civille, G.V. Sensory Evaluation Techniques; CRC Press: Boca Raton, FL, USA, 1999; ISBN 9781003040729. [Google Scholar]
- Lin, D.; Sun, L.-C.; Chen, Y.-L.; Liu, G.-M.; Miao, S.; Cao, M.-J. Shrimp Spoilage Mechanisms and Functional Films/Coatings Used to Maintain and Monitor Its Quality during Storage. Trends Food Sci. Technol. 2022, 129, 25–37. [Google Scholar] [CrossRef]
- Zhang, C.; Tan, X.; Lv, C.; Zang, J.; Zhao, G. Shrimp Ferritin Greatly Improves the Physical and Chemical Stability of Astaxanthin. J. Food Sci. 2021, 86, 5295–5306. [Google Scholar] [CrossRef]
- Boz, Z.; Brecht, J.K.; Welt, B.A.; Pelletier, W.; Mclamore, E.; Kiker, G.; Butler, J.E. Challenges and Advances in Development of Active Components 62 Challenges and Advances in Development of Active Components to Modify Headspace Gases in Packaging of Fresh Produce and Muscle Foods. J. Appl. Packag. Res. 2018, 10, 62–97. [Google Scholar]
- Bayati, M.; Lund, M.N.; Tiwari, B.K.; Poojary, M.M. Chemical and Physical Changes Induced by Cold Plasma Treatment of Foods: A Critical Review. Compr. Rev. Food Sci. Food Saf. 2024, 23, e13376. [Google Scholar] [CrossRef]
- Shiekh, K.A.; Benjakul, S. Effect of High Voltage Cold Atmospheric Plasma Processing on the Quality and Shelf-Life of Pacific White Shrimp Treated with Chamuang Leaf Extract. Innov. Food Sci. Emerg. Technol. 2020, 64, 102435. [Google Scholar] [CrossRef]
- Huang, W.; Ji, H.; Liu, S.; Zhang, C.; Chen, Y.; Guo, M.; Hao, J. Inactivation Effects and Kinetics of Polyphenol Oxidase from Litopenaeus vannamei by Ultra-High Pressure and Heat. Innov. Food Sci. Emerg. Technol. 2014, 26, 108–115. [Google Scholar] [CrossRef]
- Hashempour-Baltork, F.; Mirza Alizadeh, A.; Taghizadeh, M.; Hosseini, H. Cold Plasma Technology: A Cutting-Edge Approach for Enhancing Shrimp Preservation. Heliyon 2024, 10, e40460. [Google Scholar] [CrossRef] [PubMed]
- De Souza Silva, d.A.; da Silva Campelo, M.C.; de Oliveira Soares Rebouças, L.; de Oliveira Vitoriano, J.; Alves, C.; Alves da Silva, J.B.; de Oliveira Lima, P. Use of Cold Atmospheric Plasma to Preserve the Quality of White Shrimp (Litopenaeus vannamei). J. Food Prot. 2019, 82, 1217–1223. [Google Scholar] [CrossRef] [PubMed]
- Farajzadeh, F.; Motamedzadegan, A.; Shahidi, S.-A.; Hamzeh, S. The Effect of Chitosan-Gelatin Coating on the Quality of Shrimp (Litopenaeus vannamei) under Refrigerated Condition. Food Control 2016, 67, 163–170. [Google Scholar] [CrossRef]
- Chu, Y.; Wang, J.; Xie, J. Foodomics in Aquatic Products Quality Assessment during Storage: An Advanced and Reliable Approach. Food Biosci 2024, 58, 103734. [Google Scholar] [CrossRef]
- Wang, R.; Huang, Z.; Ma, L.; Sun, X.; Sun, C. Effects of Stocking Density and Salinity on the Flavour Performance and Muscle Microstructure of Black Tiger Shrimp (Penaeus monodon) Post Larvae. Aquac. Int. 2024, 32, 8115–8129. [Google Scholar] [CrossRef]
- Astruc, T. Muscle Structure and Digestive Enzyme Bioaccessibility to Intracellular Compartments. In Food Structures, Digestion and Health; Elsevier: Amsterdam, The Netherlands, 2014; pp. 193–222. [Google Scholar]
- Xiao, X.-C.; Lin, D.; Cao, K.-Y.; Sun, L.-C.; Chen, Y.-L.; Weng, L.; Zhang, L.-J.; Cao, M.-J. Properties of Pacific White Shrimp (Litopenaeus vannamei) Collagen and Its Degradation by Endogenous Proteinases During Cold Storage. Food Chem. 2023, 419, 136071. [Google Scholar] [CrossRef]
- Pan, C.; Sun, K.; Yang, X.; Wang, D.; Hu, X.; Chen, S. Insights on Litopenaeus vannamei Quality Deterioration during Partial Freezing Storage from Combining Traditional Quality Studies and Label-Free Based Proteomic Analysis. J. Food Compos. Anal. 2022, 112, 104655. [Google Scholar] [CrossRef]
- Ashie, I.N.A.; Smith, J.P.; Simpson, B.K.; Haard, N.F. Spoilage and Shelf-life Extension of Fresh Fish and Shellfish. Crit. Rev. Food Sci. Nutr. 1996, 36, 87–121. [Google Scholar] [CrossRef]
- Zhang, X.; Owens, C.M.; Schilling, M.W. Meat: The Edible Flesh from Mammals Only or Does It Include Poultry, Fish, and Seafood? Anim. Front. 2017, 7, 12–18. [Google Scholar] [CrossRef]
- Saleena, P.; Jayashree, E.; Anees, K. A Comprehensive Review on Vacuum Impregnation: Mechanism, Applications and Prospects. Food Bioprocess Technol. 2024, 17, 1434–1447. [Google Scholar] [CrossRef]
- Metcalfe, A.M.; Marshall, D.L. Capacitance Method to Determine the Microbiological Quality of Raw Shrimp (Penaeus setiferus). Food Microbiol. 2004, 21, 361–364. [Google Scholar] [CrossRef]
- Ekonomou, S.I.; Parlapani, F.F.; Kyritsi, M.; Hadjichristodoulou, C.; Boziaris, I.S. Preservation Status and Microbial Communities of Vacuum-Packed Hot Smoked Rainbow Trout Fillets. Food Microbiol. 2022, 10, 103959. [Google Scholar] [CrossRef]
- Liao, X.; Su, Y.; Liu, D.; Chen, S.; Hu, Y.; Ye, X.; Wang, J.; Ding, T. Application of Atmospheric Cold Plasma-Activated Water (PAW) Ice for Preservation of Shrimps (Metapenaeus ensis). Food Control 2018, 94, 307–314. [Google Scholar] [CrossRef]
- Subrahmanyam, K.; Gul, K.; Sehrawat, R.; Tiwari, B.K.; Sahoo, S. Cold Plasma-Mediated Inactivation of Microorganisms for the Shelf-Life Extension of Animal-Based Foods: Efficiency, Mechanism of Inactivation, and Impact on Quality Attributes. Food Control 2024, 162, 110464. [Google Scholar] [CrossRef]
- Paulsen, P.; Csadek, I.; Bauer, A.; Bak, K.H.; Weidinger, P.; Schwaiger, K.; Nowotny, N.; Walsh, J.; Martines, E.; Smulders, F.J.M. Treatment of Fresh Meat, Fish and Products Thereof with Cold Atmospheric Plasma to Inactivate Microbial Pathogens and Extend Shelf Life. Foods 2022, 11, 3865. [Google Scholar] [CrossRef]
- Kopuk, B.; Gunes, R.; Palabiyik, I. Cold Plasma Modification of Food Macromolecules and Effects on Related Products. Food Chem. 2022, 382, 132356. [Google Scholar] [CrossRef]
- Mittal, A.; Palamae, S.; Singh, A.; Zhang, B.; Benjakul, S. Pacific White Shrimp (Litopenaeus vannamei) Treated with Chitooligosaccharide-Catechin Conjugate with the Aid of Prior Pulse Electric Field and Vacuum Impregnation: Quality and Microbial Diversity during Refrigerated Storage. Food Biosci. 2024, 61, 104981. [Google Scholar] [CrossRef]
- Mol, S.; Erkan, N.; Üçok, D.; Tosun, Ş.Y. Effect of Psychrophilic Bacteria to Estimate Fish Quality. J. Muscle Foods 2007, 18, 120–128. [Google Scholar] [CrossRef]
- Parlapani, F.F. Microbial Diversity of Seafood. Curr. Opin. Food Sci. 2021, 37, 45–51. [Google Scholar] [CrossRef]
- Cortés-Sánchez, A.D.J.; Diaz-Ramírez, M.; Rayas-Amor, A.A.; Espinosa-Chaurand, L.D.; Torres-Ochoa, E.; Salgado-Cruz, M.D.l.P. Microbiological Hazards in the Food Chain of Fish and Products, a Focus on Klebsiella spp. Vet Sci 2025, 12, 133. [Google Scholar] [CrossRef] [PubMed]
- Ghanem, N.; Elshabassy, N.; Ibrahim, H.; Samaha, I. Enterobacteriaceae in Some Marine Fish Fillet. Alex. J. Vet. Sci. 2014, 40, 124. [Google Scholar] [CrossRef]
- Akinsemolu, A.A.; Onyeaka, H.N. Microorganisms Associated with Food Spoilage and Foodborne Diseases. In Food Safety and Quality in the Global South; Springer Nature Singapore: Singapore, 2024; pp. 489–531. [Google Scholar]
- Adhipaththu, W.A.M.B.W.; Christopher, M.S.; Marasingha, M.M.M.T.; Thunmuduna, T.A.S.V.; Udayanga, M.H.S. The Impact of Pulsed Electric Field Technology on Enzymes, Microbial and Nutritional Quality in Milk Processing—A Comprehensive Review. J. Sci. Univ. Kelaniya 2024, 17, 39–50. [Google Scholar] [CrossRef]
- Caldeira, V.M. Effect of Pulsed Electric Fields on Cell Viability and Metabolism. Master’s Thesis, Instituto Superior de Engenharia de Lisboa Escola Superior de Tecnologia de Saúde de Lisboa, Lisbon, Portugal, 2013. [Google Scholar]
- Butler, M.S.; Vollmer, W.; Goodall, E.C.; Capon, R.J.; Henderson, I.R.; Blaskovich, M.A. A Review of Antibacterial Candidates with New Modes of Action. ACS Infect. Dis. 2024, 10, 3440–3474. [Google Scholar] [CrossRef] [PubMed]
- Shirazinejad, A. Application of Lactic Acid, Nisin and Chitosan on Quality of Prawn (Fenneropenaeus merguiensis). Ph.D. Thesis, Universiti Sains Malaysia, Penang, Malaysia, 2013. [Google Scholar]
- Toldrá, F.; Nollet, L. Handbook of Seafood and Seafood Products Analysis; CRC Press: Boca Raton, FL, USA, 2024; ISBN 9781003289401. [Google Scholar]
- Matamoros, S.; Pilet, M.F.; Gigout, F.; Prévost, H.; Leroi, F. Selection and Evaluation of Seafood-Borne Psychrotrophic Lactic Acid Bacteria as Inhibitors of Pathogenic and Spoilage Bacteria. Food Microbiol. 2009, 26, 638–644. [Google Scholar] [CrossRef]
- Zhang, C.; Liu, X.; Chen, J.; Liu, H.; Liu, Y. Antibacterial Mechanism of Lactobionic Acid against Shewanella baltica and Shewanella putrefaciens and Its Application on Refrigerated Shrimp. Food Biosci. 2023, 51, 102291. [Google Scholar] [CrossRef]
- García-Sifuentes, C.O.; Pacheco-Aguilar, R.; Ramírez-Suarez, J.C.; Scheuren-Acevedo, S.M.; Lugo-Sánchez, M.E.; Garcia-Sánchez, G.; Carvallo-Ruiz, G. Quality Changes of White Shrimp (Litopenaeus vannamei) Stressed by Acute Hypoxia and Stored under Chilled Conditions. Int. Food Res. J. 2018, 25, 1574–1581. [Google Scholar]
- Gökoğlu, N. Crustacean Shellfish. In Shellfish Processing and Preservation; Springer International Publishing: Cham, Switzerland, 2021; pp. 7–127. [Google Scholar]
- Hu, J.; Chen, J.; Zheng, Y.; Huang, J.; Xie, K.; Li, Y.; Peng, S.; Chen, J.; Deng, S. Effect of Atmospheric Cold Plasma Treatment Modes on the Quality of Red Shrimp (Solenocera crassicornis) during Cold Chain Storage. LWT Food Sci. Technol. 2023, 190, 115543. [Google Scholar] [CrossRef]
- Bekhit, A.E.D.A.; Giteru, S.G.; Holman, B.W.; Hopkins, D.L. Total Volatile Basic Nitrogen and Trimethylamine in Muscle Foods: Potential Formation Pathways and Effects on Human Health. Compr. Rev. Food Sci. Food Saf. 2021, 20, 3620–3666. [Google Scholar] [CrossRef]
- Cropotova, J.; Tappi, S.; Genovese, J.; Rocculi, P.; Dalla Rosa, M.; Rustad, T. The Combined Effect of Pulsed Electric Field Treatment and Brine Salting on Changes in the Oxidative Stability of Lipids and Proteins and Color Characteristics of Sea Bass (Dicentrarchus labrax). Heliyon 2021, 7, e05947. [Google Scholar] [CrossRef] [PubMed]
- Rathod, N.B.; Kulawik, P.; Ozogul, Y.; Ozogul, F.; Bekhit, A.E.D.A. Recent Developments in Non-Thermal Processing for Seafood and Seafood Products: Cold Plasma, Pulsed Electric Field and High Hydrostatic Pressure. Int. J. Food Sci. Technol. 2022, 57, 774–790. [Google Scholar] [CrossRef]
- Heinrich, V.; Zunabovic, M.; Nehm, L.; Bergmair, J.; Kneifel, W. Influence of Argon Modified Atmosphere Packaging on the Growth Potential of Strains of Listeria monocytogenes and Escherichia coli. Food Control 2016, 59, 513–523. [Google Scholar] [CrossRef]

| Fatty Acid (g/100g Lipid) | Control | Day 0 | Day 21 | |||||||
|---|---|---|---|---|---|---|---|---|---|---|
| CP | PEF-SLE1-VI-MAP1 | PEF-SLE1- VI-MAP2 | PEF-SLE1- VI-MAP3 | PEF-SLE1- VI-MAP1-CP | PEF-SLE1- VI-MAP2-CP | PEF-SLE1-VI- MAP3-CP | PEF-SLE1- VI-MAP3 | PEF-SLE1- VI-MAP3-CP | ||
| C4:0 (Butyric) | 15.51 ± 2.63 a | 31.48 ± 4.04 b | 42.07 ± 3.91 c | 40.92 ± 7.43 c | 31.10 ± 0.91 b | 41.37 ± 2.19 c | 40.69 ± 5.30 c | 28.28 ± 4.24 ab | 43.71 ± 3.00 c | 37.86 ± 4.42 b |
| C12:0 (Lauric) | 0.56 ± 0.04 | ND | ND | ND | ND | ND | ND | ND | ND | ND |
| C14:0 (Myristic) | 0.57 ± 0.03 b | ND | ND | 0.45 ± 0.00 a | ND | ND | ND | ND | ND | 0.36 ± 0.01 a |
| C15:0 (Pentadecanoic) | ND | ND | 0.31 ± 0.01 a | 0.53 ± 0.13 b | 0.39 ± 0.09 a | 0.49 ± 0.11 a | 0.34 ± 0.08 a | 0.46 ± 0.08 a | 0.56 ± 0.20 b | 0.4 ± 0.00 a |
| C16:0 (Palmitic) | 16.64 ± 0.98 b | 16.04 ± 1.51 b | 10.87 ± 0.91 a | ND | ND | ND | ND | ND | ND | ND |
| C17:0 (Heptadecanoic) | 2.16 ± 0.31 b | 2.00 ± 0.00 b | 1.14 ± 0.23 a | 2.27 ± 0.43 b | 1.85 ± 0.25 ab | 12.4 ± 0.19 c | 1.63 ± 0.16 ab | 2.06 ± 0.58 b | 2.03 ± 0.62 b | 1.81 ± 0.45 a |
| C18:0 (Stearic) | 9.03 ± 0.71 c | 8.65 ± 0.90 c | 5.77 ± 0.47 a | 6.68 ± 0.91 ab | 6.66 ± 0.93 ab | 7.25 ± 0.22 b | 6.09 ± 0.66 a | 6.48 ± 1.94 ab | 7.11 ± 0.87 b | 7.87 ± 0.89 b |
| C20:0 (Arachidic) | ND | 11.42 ± 1.25 c | 7.83 ± 0.61 a | 9.40 ± 0.66 b | ND | ND | ND | ND | ND | ND |
| C14:1 (Myristoleic) | ND | ND | ND | ND | 0.31 ± 0.00 a | 0.33 ± 0.01 a | ND | ND | ND | 0.33 ± 0.00 a |
| C15:1 cis 10 (Pentadecanoic) | 17.97 ± 1.06 c | 12.04 ± 1.60 a | 13.05 ± 0.65 b | 12.17 ± 1.76 a | 13.51 ± 1.43 b | 13.39 ± 0.43 b | 11.55 ± 1.26 a | 15.70 ± 4.16 b | 12.08 ± 3.99 a | 14.30 ± 0.54 b |
| C16:1 (Palmitoleic) | 0.91 ± 0.04 c | 0.89 ± 0.00 c | 0.64 ± 006 a | 0.66 ± 0.07 a | 0.74 ± 0.09 b | 0.77 ± 0.02 b | 0.68 ± 0.09 a | 0.67 ± 0.23 a | 0.69 ± 0.29 a | 0.81 ± 0.04 b |
| C18:1 trans 9 (Elaidic) | 9.68 ± 0.54 d | 8.81 ± 0.76 c | 6.31 ± 0.47 a | 7.14 ± 0.81 b | 8.40 ± 2.09 c | ND | 6.86 ± 0.88 a | 7.75 ± 1.57 b | 8.20 ± 2.09 c | 9.41 ± 1.79 d |
| C18:1 cis 9 (Oleic) | 3.03 ± 0.36 c | ND | 1.9 ± 0.09 a | 2.05 ± 0.24 ab | 2.28 ± 0.27 b | 2.25 ± 0.06 b | 1.98 ± 0.22 a | 2.96 ± 0.75 a | 2.11 ± 0.79 ab | 2.45 ± 0.07 b |
| C20:1 cis 11 (Eicosenoic) | ND | ND | ND | ND | ND | 0.59 ± 0.00 b | 0.51 ± 0.00 a | 0.62 ± 0.00 b | 0.70 ± 0.00 c | 0.68 ± 0.19 c |
| C22:1 cis 13 (Erucanoic) | ND | 3.64 ± 0.59 b | 2.54 ± 0.00 a | 2.63 ± 0.16 a | ND | ND | ND | ND | ND | ND |
| C24:1 cis 15 (Nervonic) | ND | 6.13 ± 0.48 | ND | ND | ND | ND | ND | ND | ND | ND |
| C18:2 cis 9,12 (Linoleic) | 11.73 ± 0.68 d | ND | ND | ND | 10.51 ± 2.70 c | 9.69 ± 0.23 b | 8.22 ± 0.83 a | 10.63 ± 1.79 b | 9.64 ± 1.86 b | 11.18 ± 2.20 d |
| C18:3 cis 6,9,12 gamma (gamma-Linolenic) | ND | ND | ND | 1.24 ± 0.08 b | 1.10 ± 0.00 b | ND | ND | 0.70 ± 0.00 a | ND | ND |
| C18:3 cis 9,12,15 alpha (alpha-Linolenic) | ND | ND | ND | ND | 1.15 ± 0.28 | ND | ND | ND | 0.66 ± 0.00 | ND |
| C20:2 cis 11,14 (Eicosadienoic) | 1.18 ± 0.05 b | ND | 0.81 ± 0.08 a | 0.90 ± 0.11 ab | 1.04 ± 0.33 | 0.90 ± 0.03 ab | 0.78 ± 0.08 a | 1.98 ± 0.13 ab | ND | 1.14 ± 0.33 b |
| C20:4 cis 5,8,11,14 (Eicosatetraenoic) | 4.00 ± 0.24 c | ND | 2.62 ± 0.20 a | 2.99 ± 0.31 b | 3.15 ± 0.25 b | 3.16 ± 0.07 b | 2.67 ± 0.23 a | 3.75 ± 0.96 a | 1.98 ± 1.35 a | 3.16 ± 0.15 b |
| C20:5 cis 5,8,11,14,17 EPA (Eicosapentaenoic) | 6.84 ± 0.38 b | ND | 4.73 ± 0.38 a | 5.18 ± 0.62 ab | 6.44 ± 1.59 b | 5.70 ± 0.18 b | 4.83 ± 0.44 a | 6.03 ± 0.85 b | 5.83 ± 0.83 b | 6.75 ± 1.67 b |
| C22:6 cis 4,710,13,16,19 DHA (Docosahexaenoic) | 8.41 ± 0.54 d | 8.00 ± 0.96 d | 5.82 ± 0.53 a | 6.37 ± 0.77 b | 7.25 ± 0.77 c | 6.82 ± 0.33 b | 5.96 ± 0.56 a | 7.39 ± 2.10 b | 6.30 ± 1.65 b | 6.49 ± 0.51 c |
| Saturated fatty acid | 44.47 ± 9.37 | 69.59 ± 7.70 | 67.98 ± 6.30 | 60.25 ± 9.16 | 40.45 ± 2.6 | 61.51 ± 2.75 | 48.75 ± 6.20 | 37.28 ± 17.02 | 52.78 ± 5.91 | 48.30 ± 5.76 |
| Monounsaturated fatty acid | 31.59 ± 2.00 | 31.51 ± 1.83 | 24.44 ± 1.27 | 24.65 ± 2.89 | 25.24 ± 2.0 | 17.34 ± 0.52 | 21.60 ± 2.45 | 28.70 ± 6.71 | 23.78 ± 7.57 | 23.78 ± 7.17 |
| Polyunsaturated fatty acid | 32.16 ± 1.89 | 8.00 ± 0.96 | 13.98 ± 1.20 | 16.68 ± 1.81 | 30.64 ± 5.94 | 26.27 ± 0.84 | 22.46 ± 2.15 | 30.48 ± 5.84 | 24.41 ± 6.08 | 28.72 ± 5.70 |
| Storage Time (Days) | Sample | Appearance | Color | Texture | Taste | Flavor | Odor | Overall |
| 0 | Control | 7.90 ± 0.88 a | 8.00 ± 0.67 a | 8.10 ± 0.57 a | 8.00 ± 0.67 a | 8.10 ± 0.57 a | 8.00 ± 0.82 a | 8.10 ± 0.57 a |
| CP | 8.09 ± 0.83 a | 8.00 ± 0.77 a | 8.36 ± 0.67 a | 7.91 ± 0.83 a | 8.18 ± 0.60 a | 7.91 ± 0.54 a | 8.27 ± 0.65 a | |
| PEF-SLE1-VI-MAP1 | 8.00 ± 0.67 a | 8.10 ± 1.10 a | 7.80 ± 0.63 a | 7.80 ± 0.63 a | 8.10 ± 0.74 a | 8.00 ± 0.67 a | 8.20 ± 0.63 a | |
| PEF-SLE1-VI-MAP2 | 7.90 ± 0.57 a | 7.80 ± 0.79 a | 7.90 ± 0.57 a | 8.10 ± 0.57 a | 7.90 ± 0.57 a | 7.90 ± 0.32 a | 8.00 ± 0.47 a | |
| PEF-SLE1-VI-MAP3 | 7.90 ± 0.99 a | 8.00 ± 0.82 a | 7.90 ± 0.74 a | 7.70 ± 0.82 a | 8.00 ± 0.67 a | 7.90 ± 0.74 a | 7.90 ± 0.57 a | |
| PEF-SLE1-VI-MAP1-CP | 8.10 ± 0.74 a | 8.10 ± 0.88 a | 7.90 ± 0.57 a | 8.40 ± 0.52 a | 8.10 ± 0.74 a | 8.40 ± 0.52 a | 8.30 ± 0.48 a | |
| PEF-SLE1-VI-MAP2-CP | 8.30 ± 0.67 a | 7.90 ± 0.74 a | 8.10 ± 0.88 a | 8.20 ± 0.79 a | 8.00 ± 0.82 a | 8.20 ± 0.63 a | 8.10 ± 0.57 a | |
| PEF-SLE1-VI-MAP3-CP | 8.1 ± 0.88 a | 8.30 ± 0.67 a | 8.10 ± 0.88 | 7.90 ± 0.88 a | 8.00 ± 0.67 a | 8.10 ± 0.57 a | 8.20 ± 0.63 a | |
| 18 | PEF-SLE1-VI-MAP3-CP | 6.30 ± 1.06 b | 6.40 ± 0.84 b | 6.40 ± 1.07 b | 6.60 ± 1.07 b | 6.20 ± 0.92 b | 6.30 ± 1.06 b | 6.40 ± 0.84 b |
Disclaimer/Publisher’s Note: The statements, opinions and data contained in all publications are solely those of the individual author(s) and contributor(s) and not of MDPI and/or the editor(s). MDPI and/or the editor(s) disclaim responsibility for any injury to people or property resulting from any ideas, methods, instructions or products referred to in the content. |
© 2025 by the authors. Licensee MDPI, Basel, Switzerland. This article is an open access article distributed under the terms and conditions of the Creative Commons Attribution (CC BY) license (https://creativecommons.org/licenses/by/4.0/).
Share and Cite
Ahmad, A.S.; Sae-Leaw, T.; Zhao, Y.; Ma, L.; Zhang, B.; Hong, H.; Benjakul, S. Synergistic Effects of Selected Nonthermal Technologies Combined with Soursop Leaf Extract on the Quality and Shelf Life of Refrigerated Pacific White Shrimp. Foods 2025, 14, 1388. https://doi.org/10.3390/foods14081388
Ahmad AS, Sae-Leaw T, Zhao Y, Ma L, Zhang B, Hong H, Benjakul S. Synergistic Effects of Selected Nonthermal Technologies Combined with Soursop Leaf Extract on the Quality and Shelf Life of Refrigerated Pacific White Shrimp. Foods. 2025; 14(8):1388. https://doi.org/10.3390/foods14081388
Chicago/Turabian StyleAhmad, Abubakar Saleh, Thanasak Sae-Leaw, Yadong Zhao, Lukai Ma, Bin Zhang, Hui Hong, and Soottawat Benjakul. 2025. "Synergistic Effects of Selected Nonthermal Technologies Combined with Soursop Leaf Extract on the Quality and Shelf Life of Refrigerated Pacific White Shrimp" Foods 14, no. 8: 1388. https://doi.org/10.3390/foods14081388
APA StyleAhmad, A. S., Sae-Leaw, T., Zhao, Y., Ma, L., Zhang, B., Hong, H., & Benjakul, S. (2025). Synergistic Effects of Selected Nonthermal Technologies Combined with Soursop Leaf Extract on the Quality and Shelf Life of Refrigerated Pacific White Shrimp. Foods, 14(8), 1388. https://doi.org/10.3390/foods14081388