
Effect of Blue Light Intensity During Spreading on the Aroma of Green Tea


 , and
, and
Abstract

1. Introduction
2. Materials and Methods
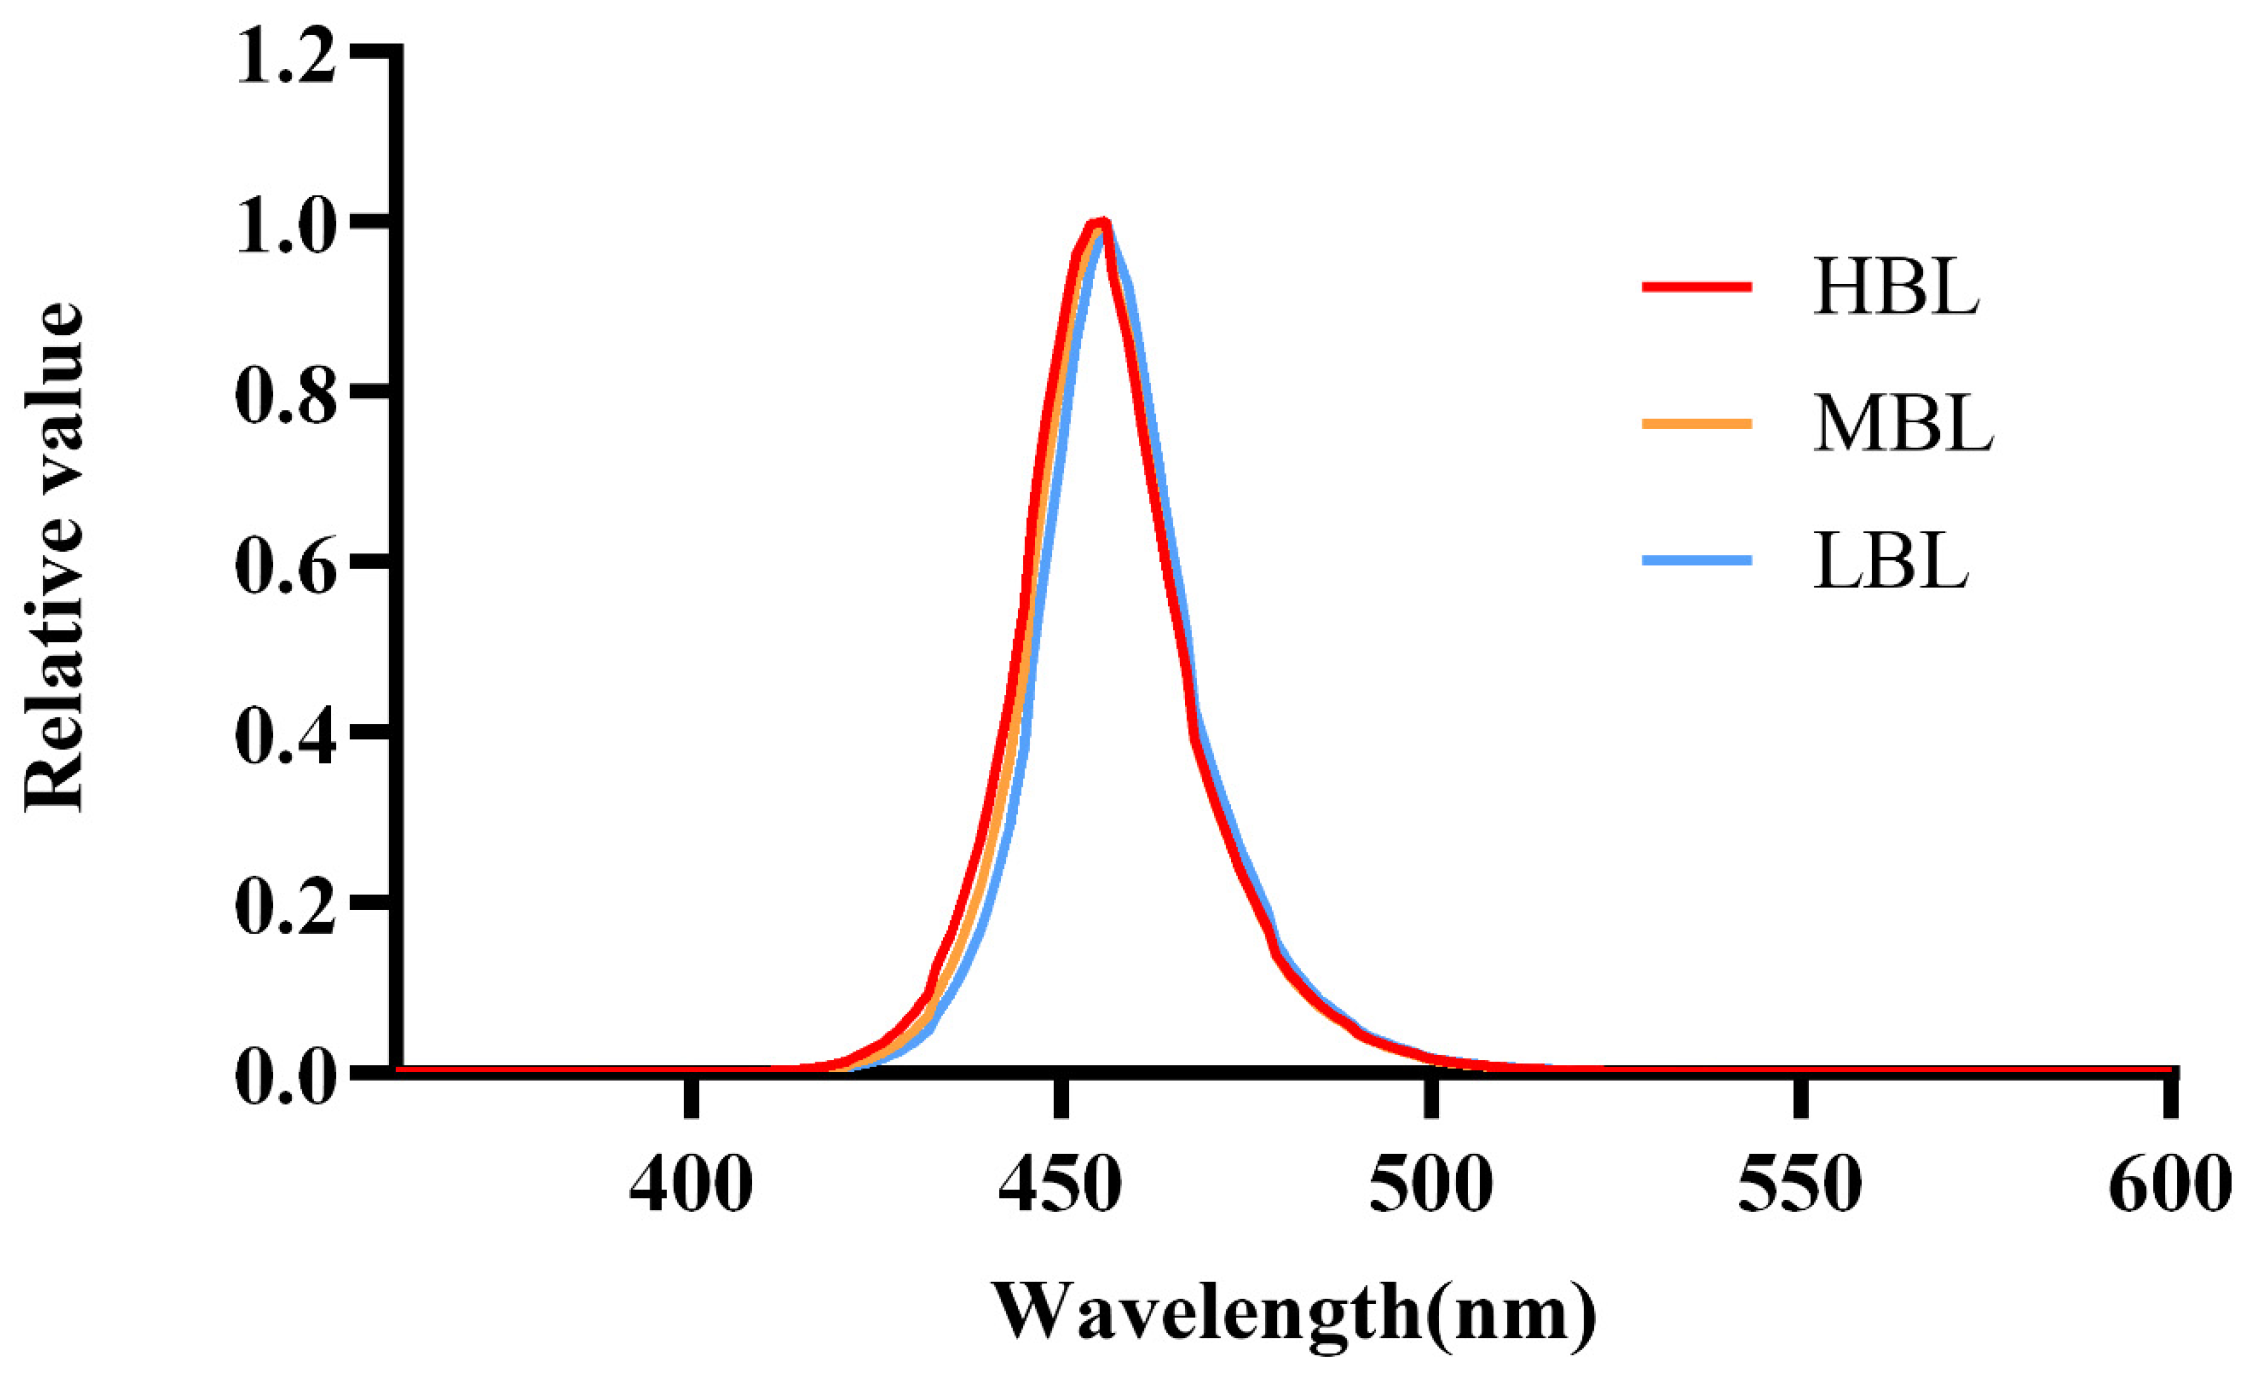
2.1. Plant Materials and Treatments
2.2. Sensory Analysis of Green Tea Aroma
2.3. Green Tea Aroma Extraction by HS-SPME
2.4. GC-MS Analysis of Volatile Composition
2.5. rOAV Value Analysis
2.6. Statistical Analysis
3. Results
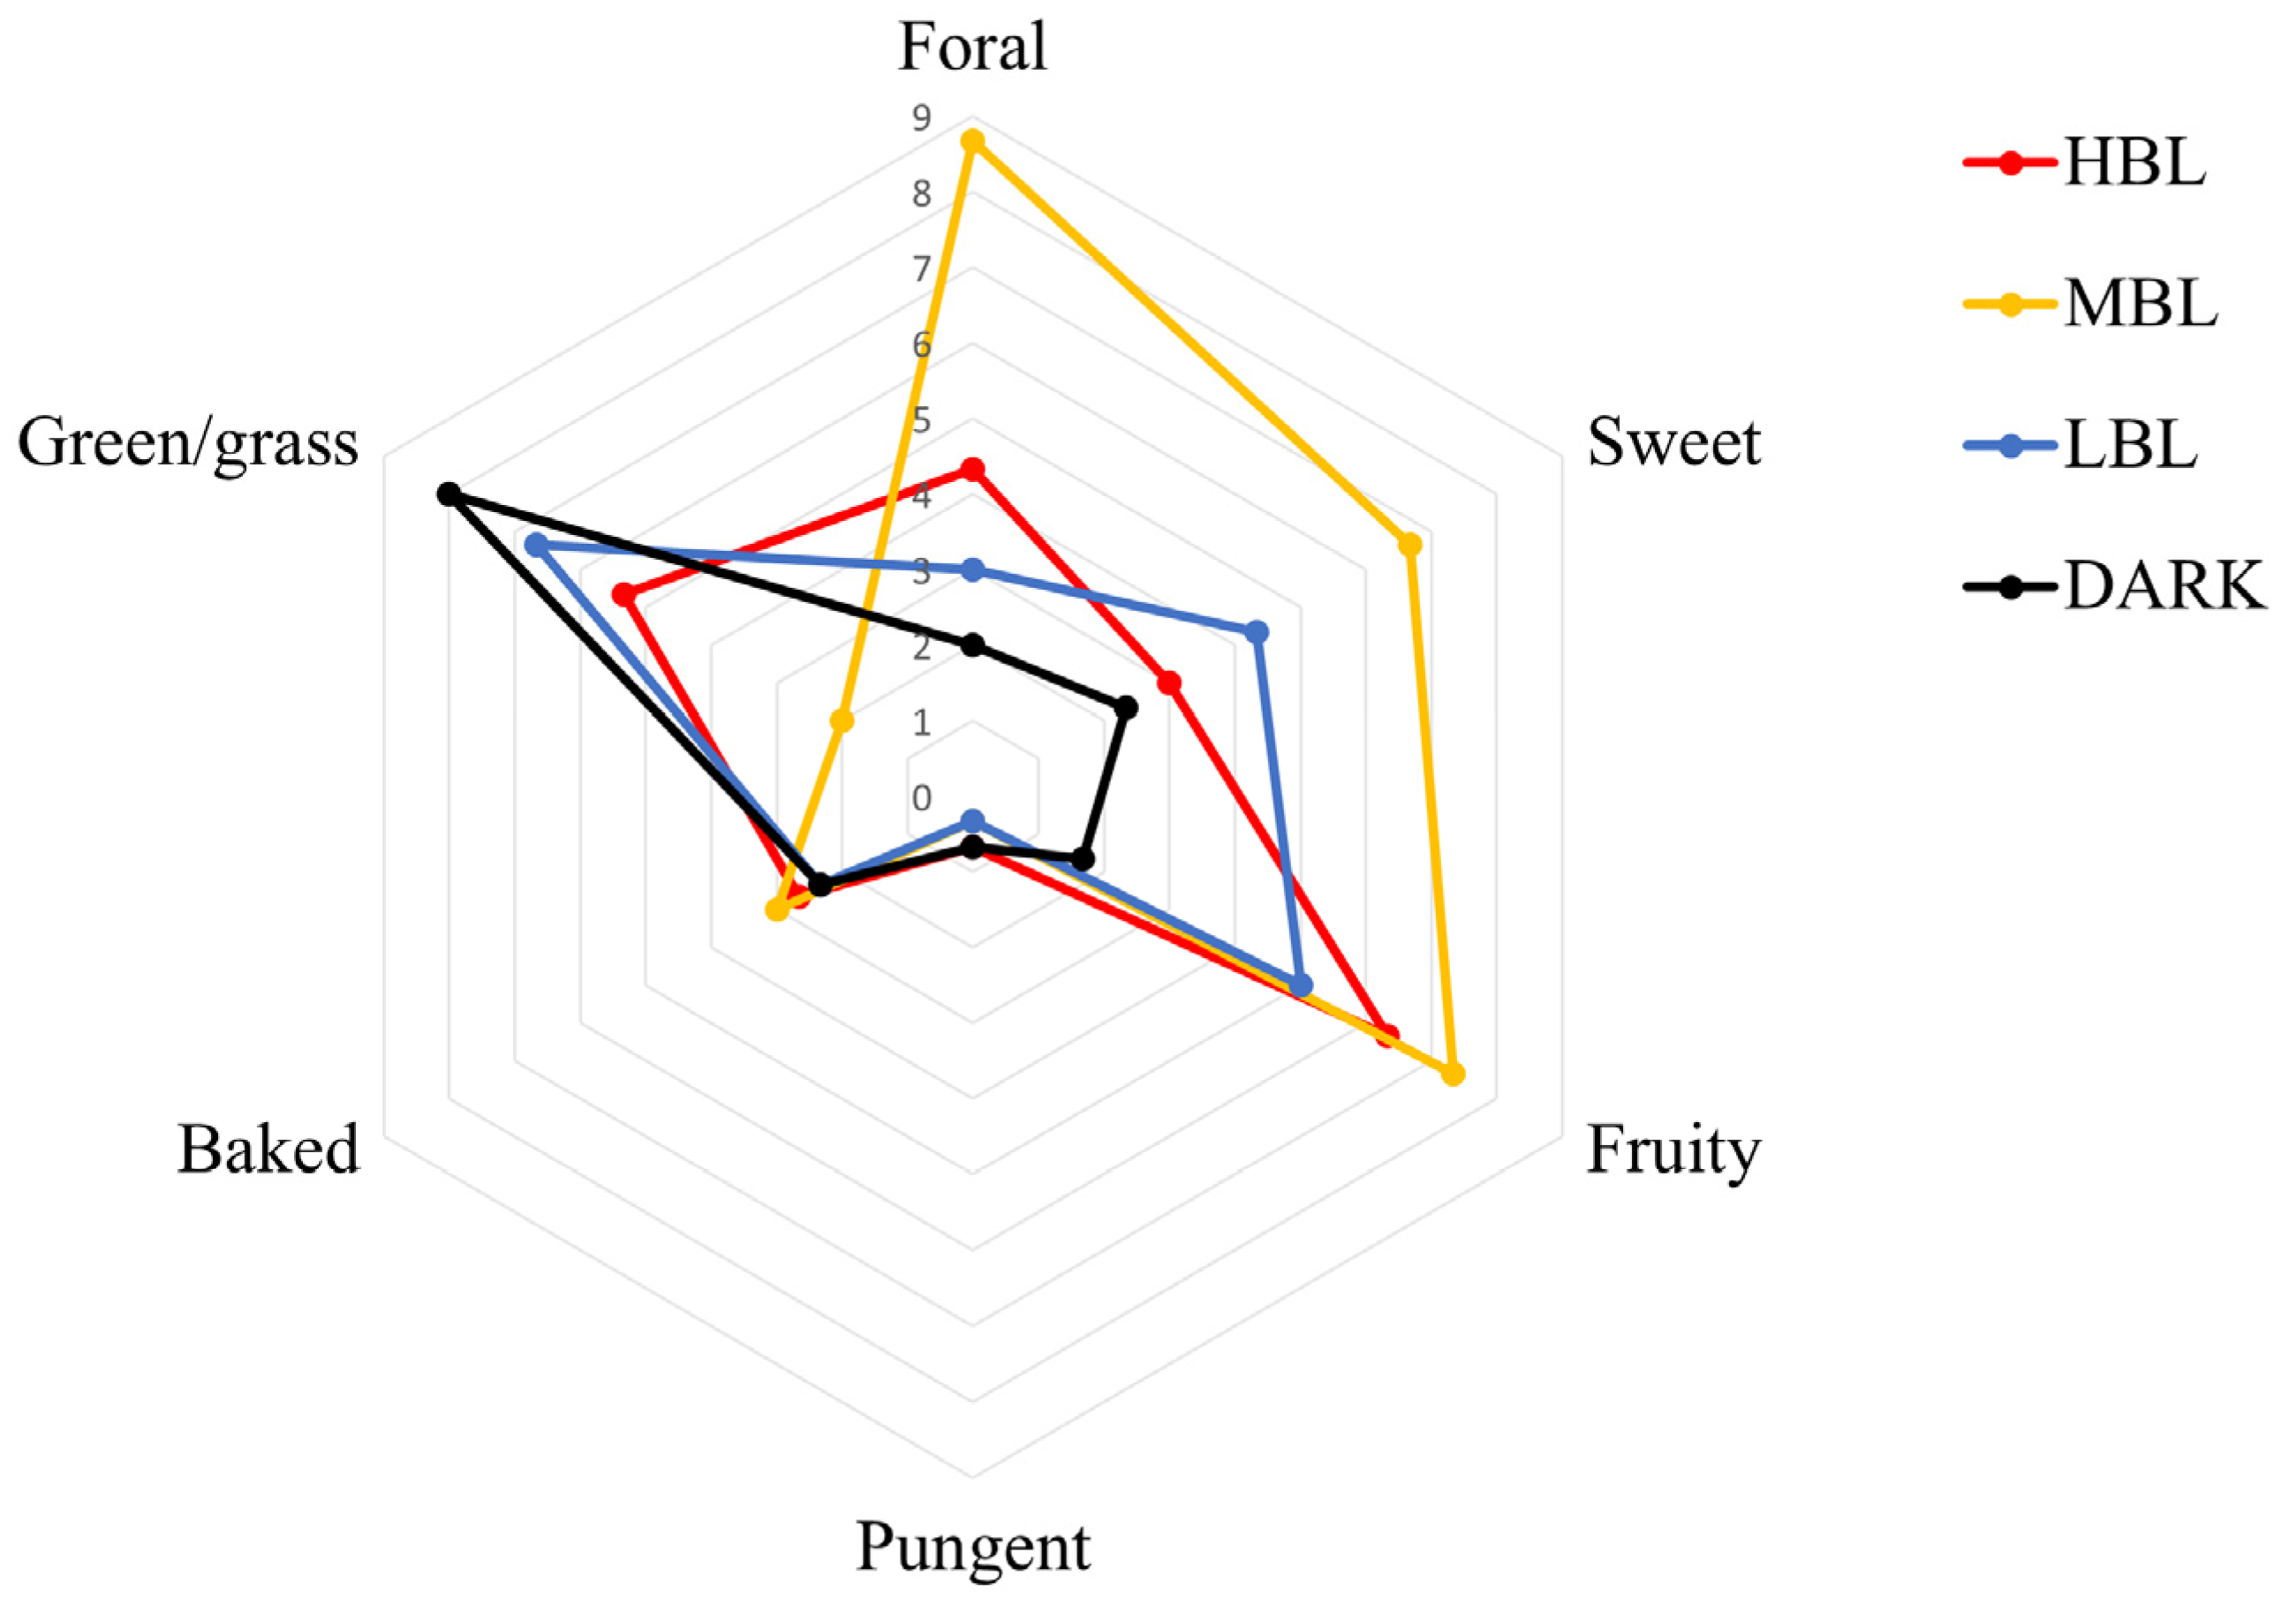
3.1. Aroma Profiles
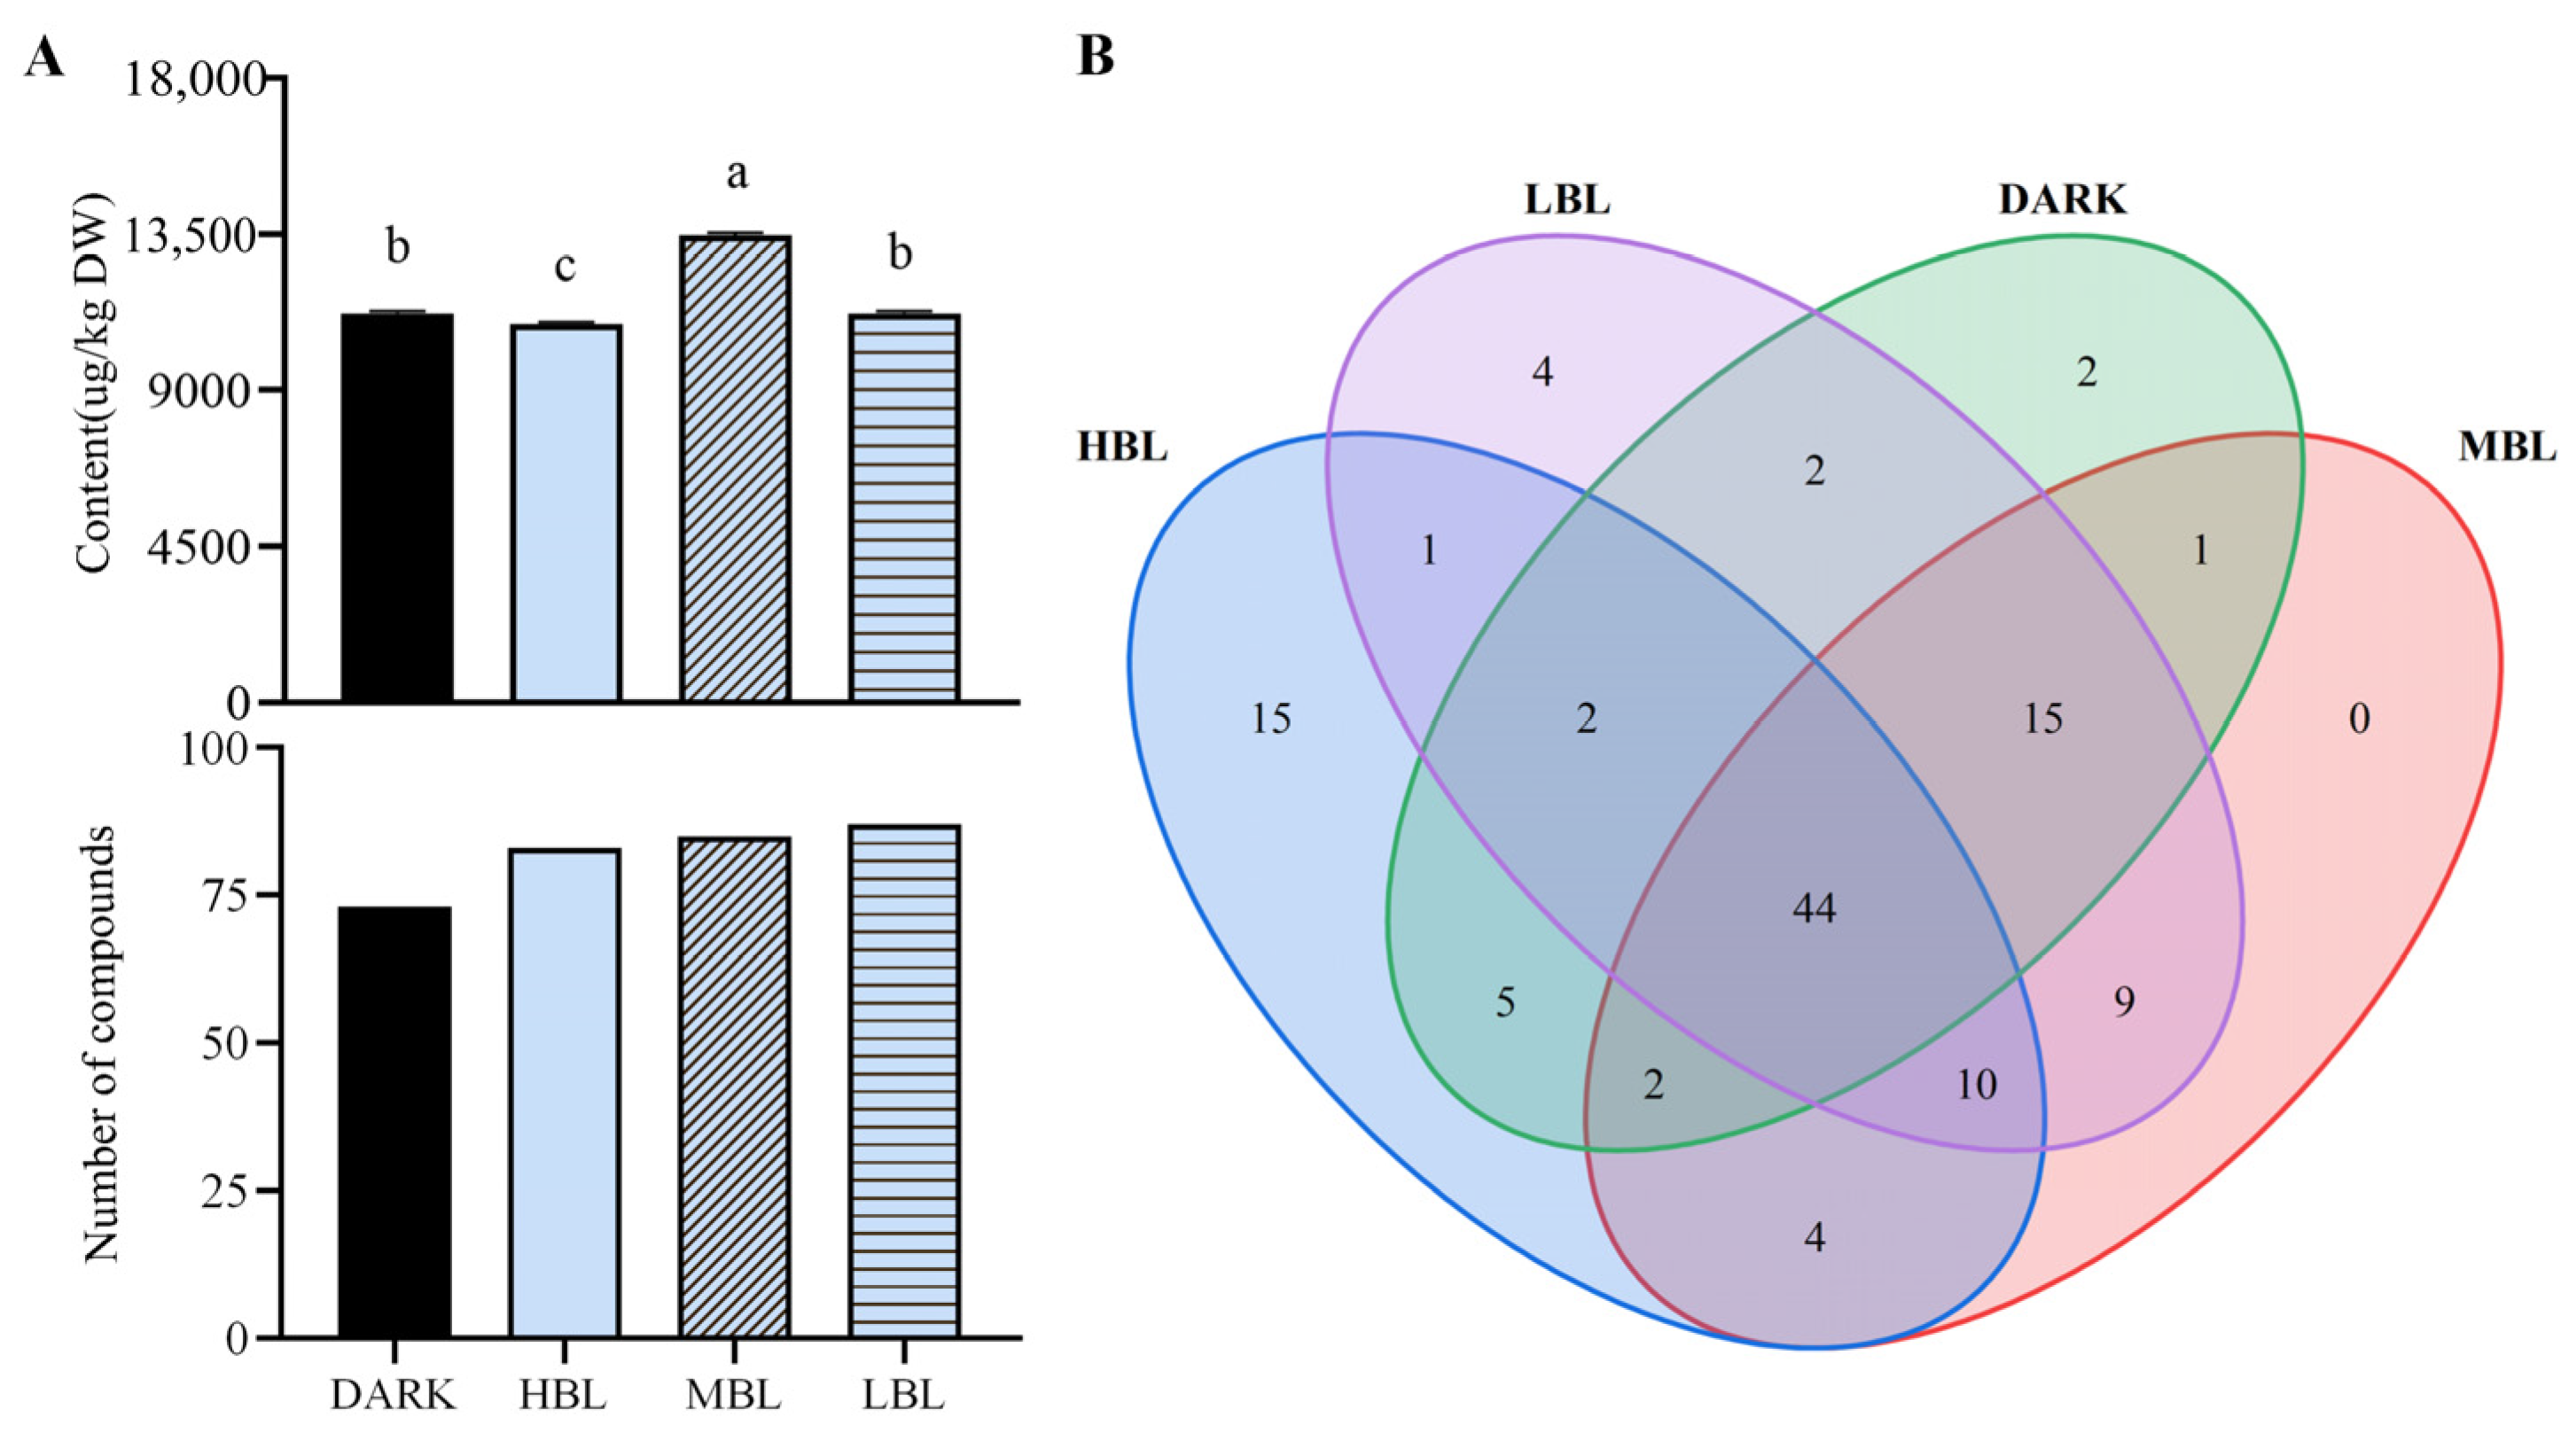
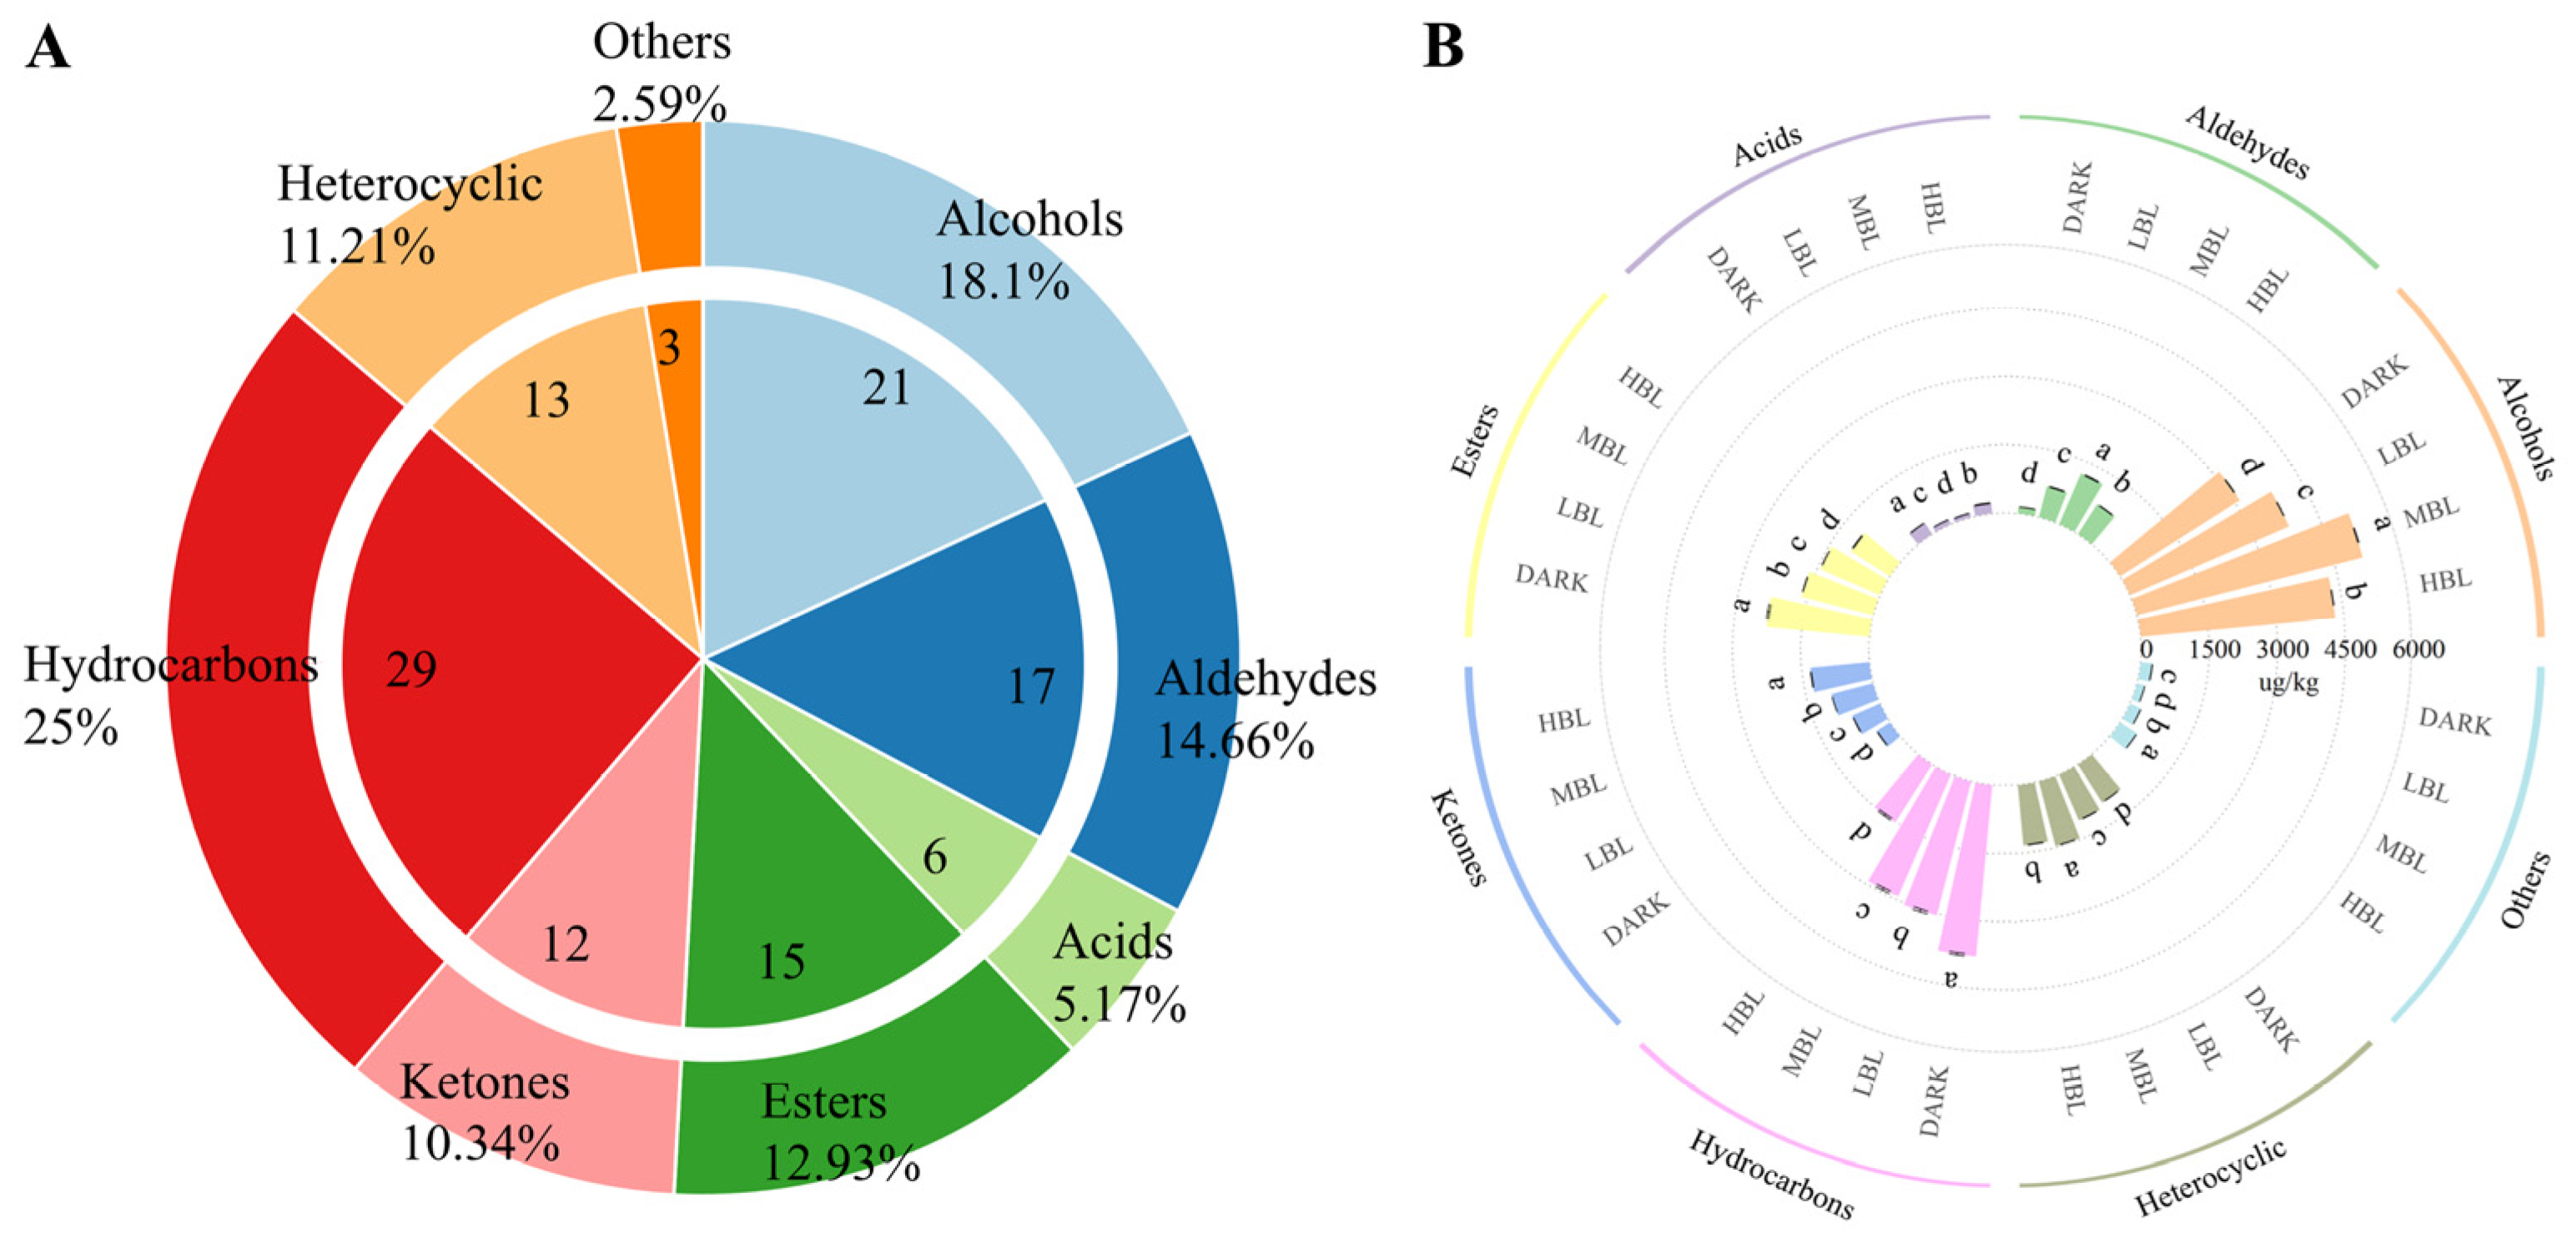
3.2. Identification and Quantification of the Aroma Compounds in Green Tea Samples by HS-SPME/GC-MS
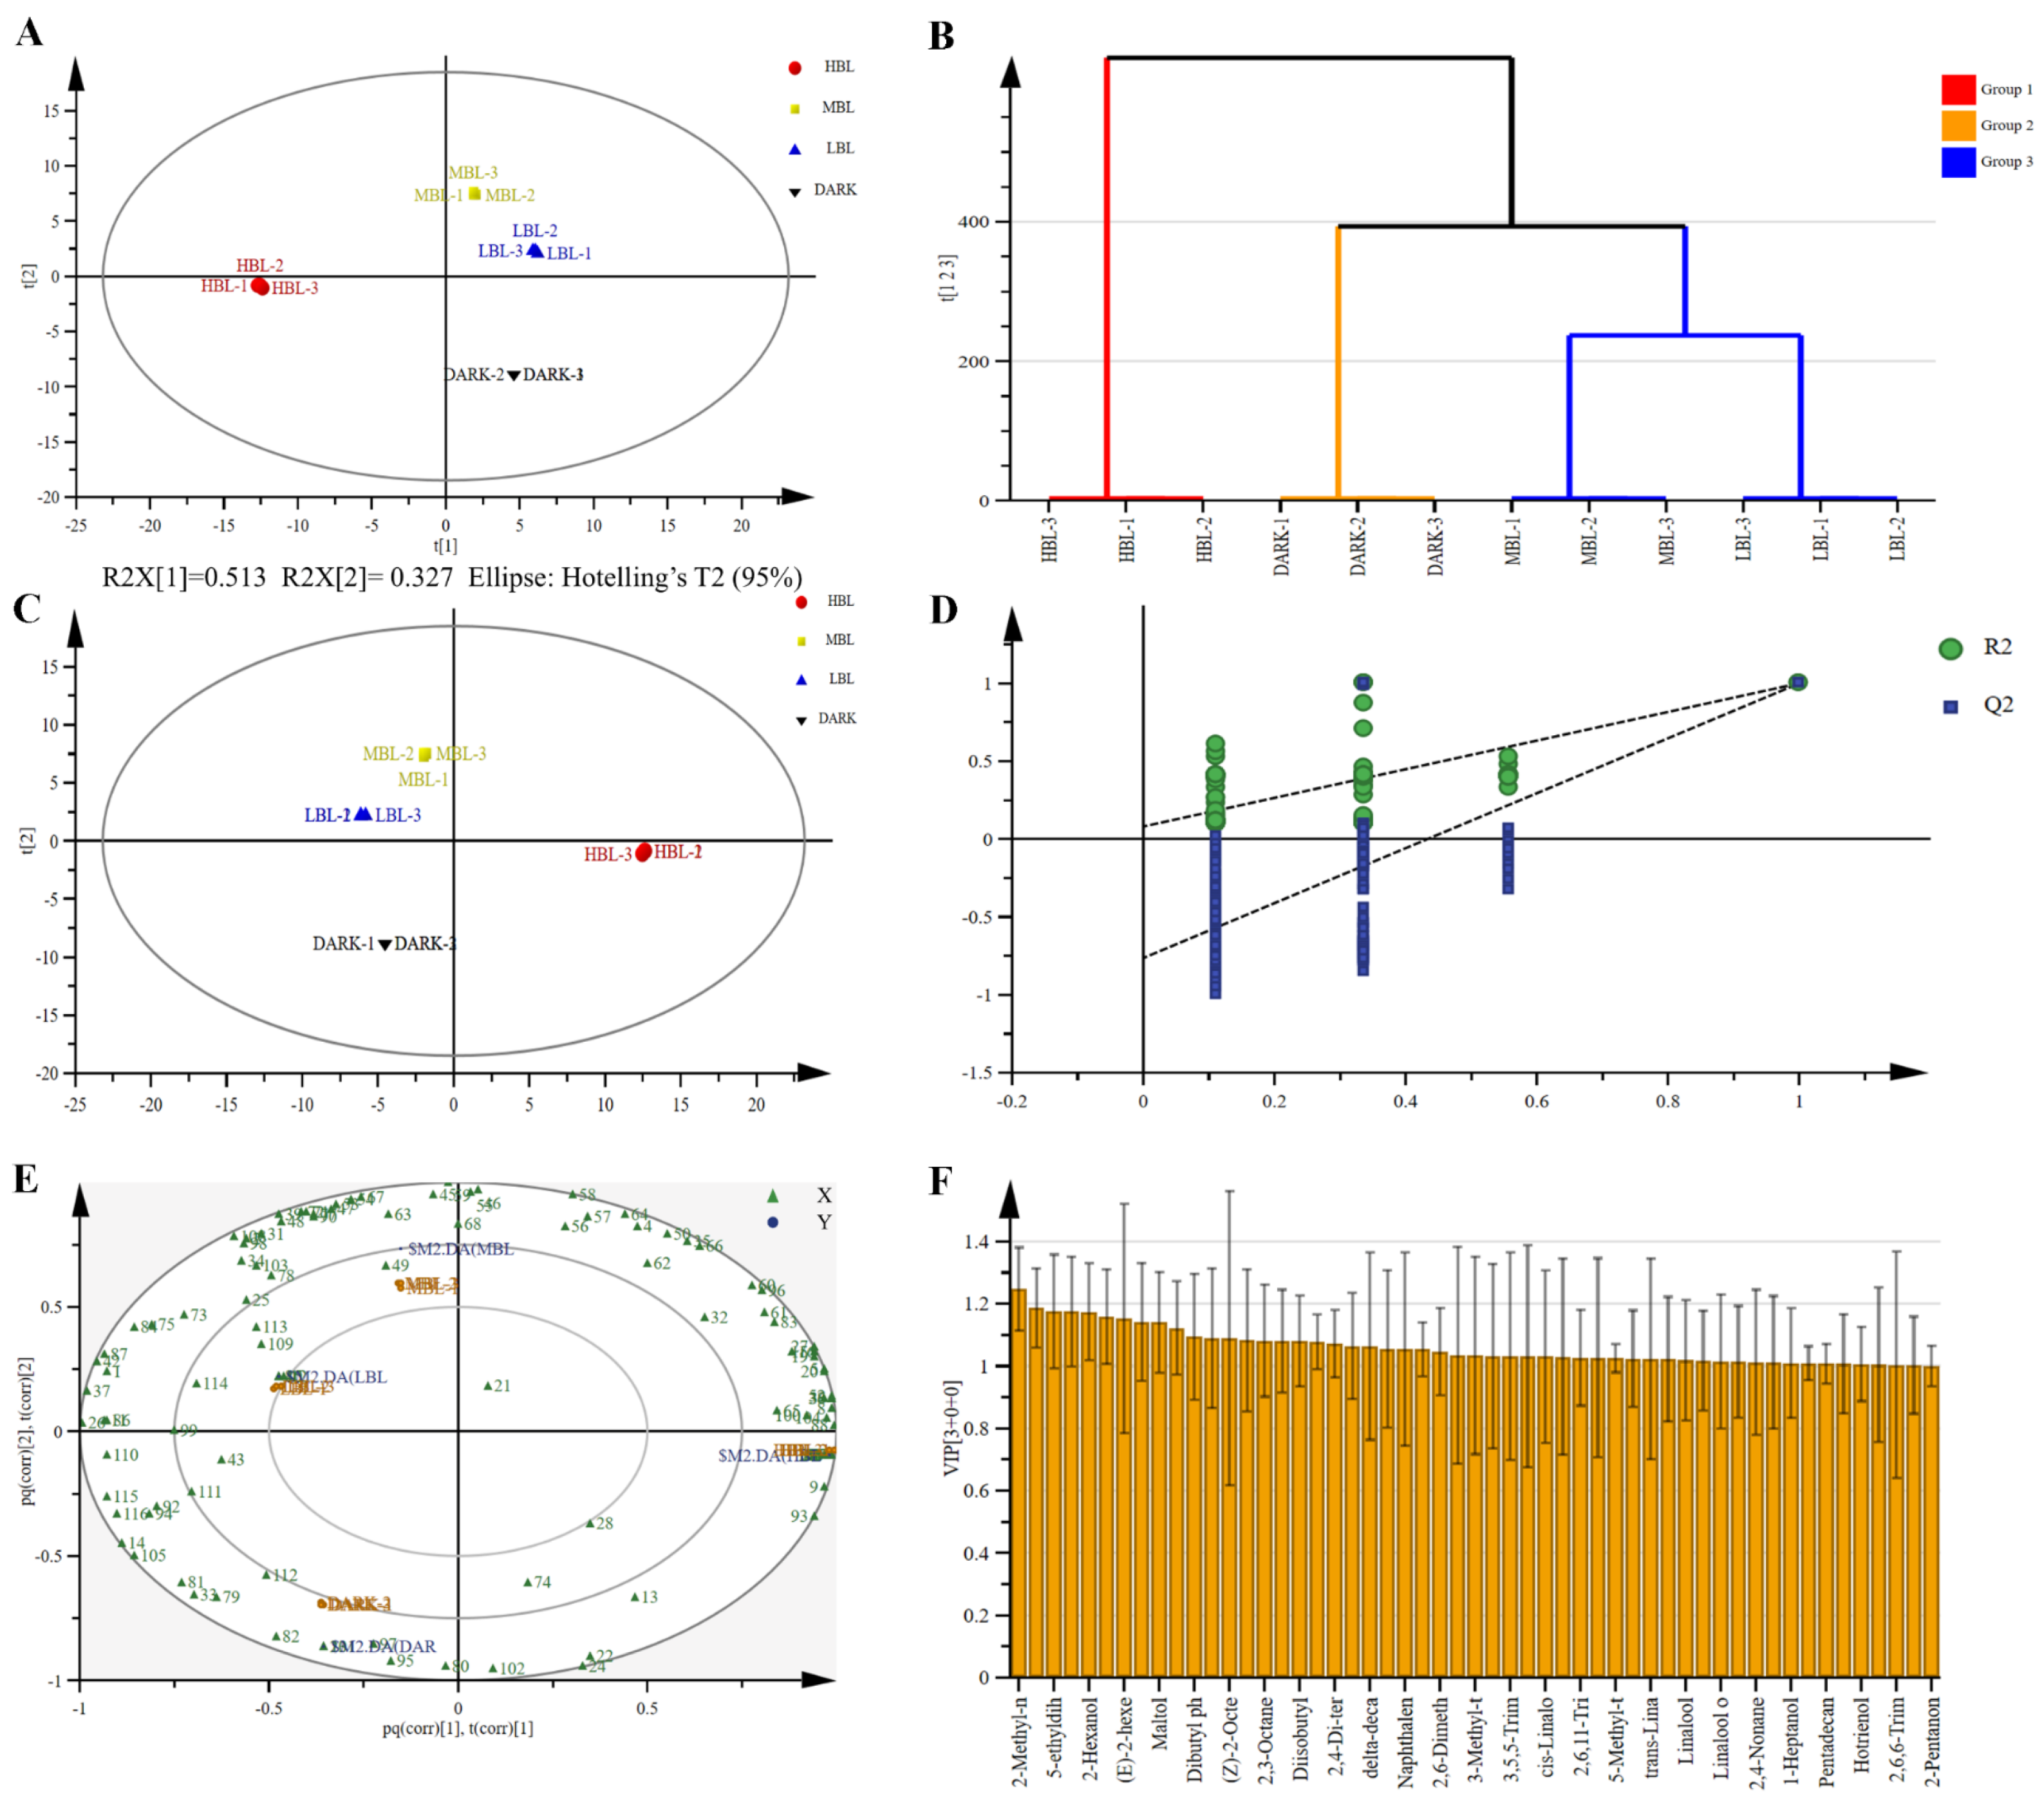
3.3. Multivariate Statistical Analysis of Volatile Compounds
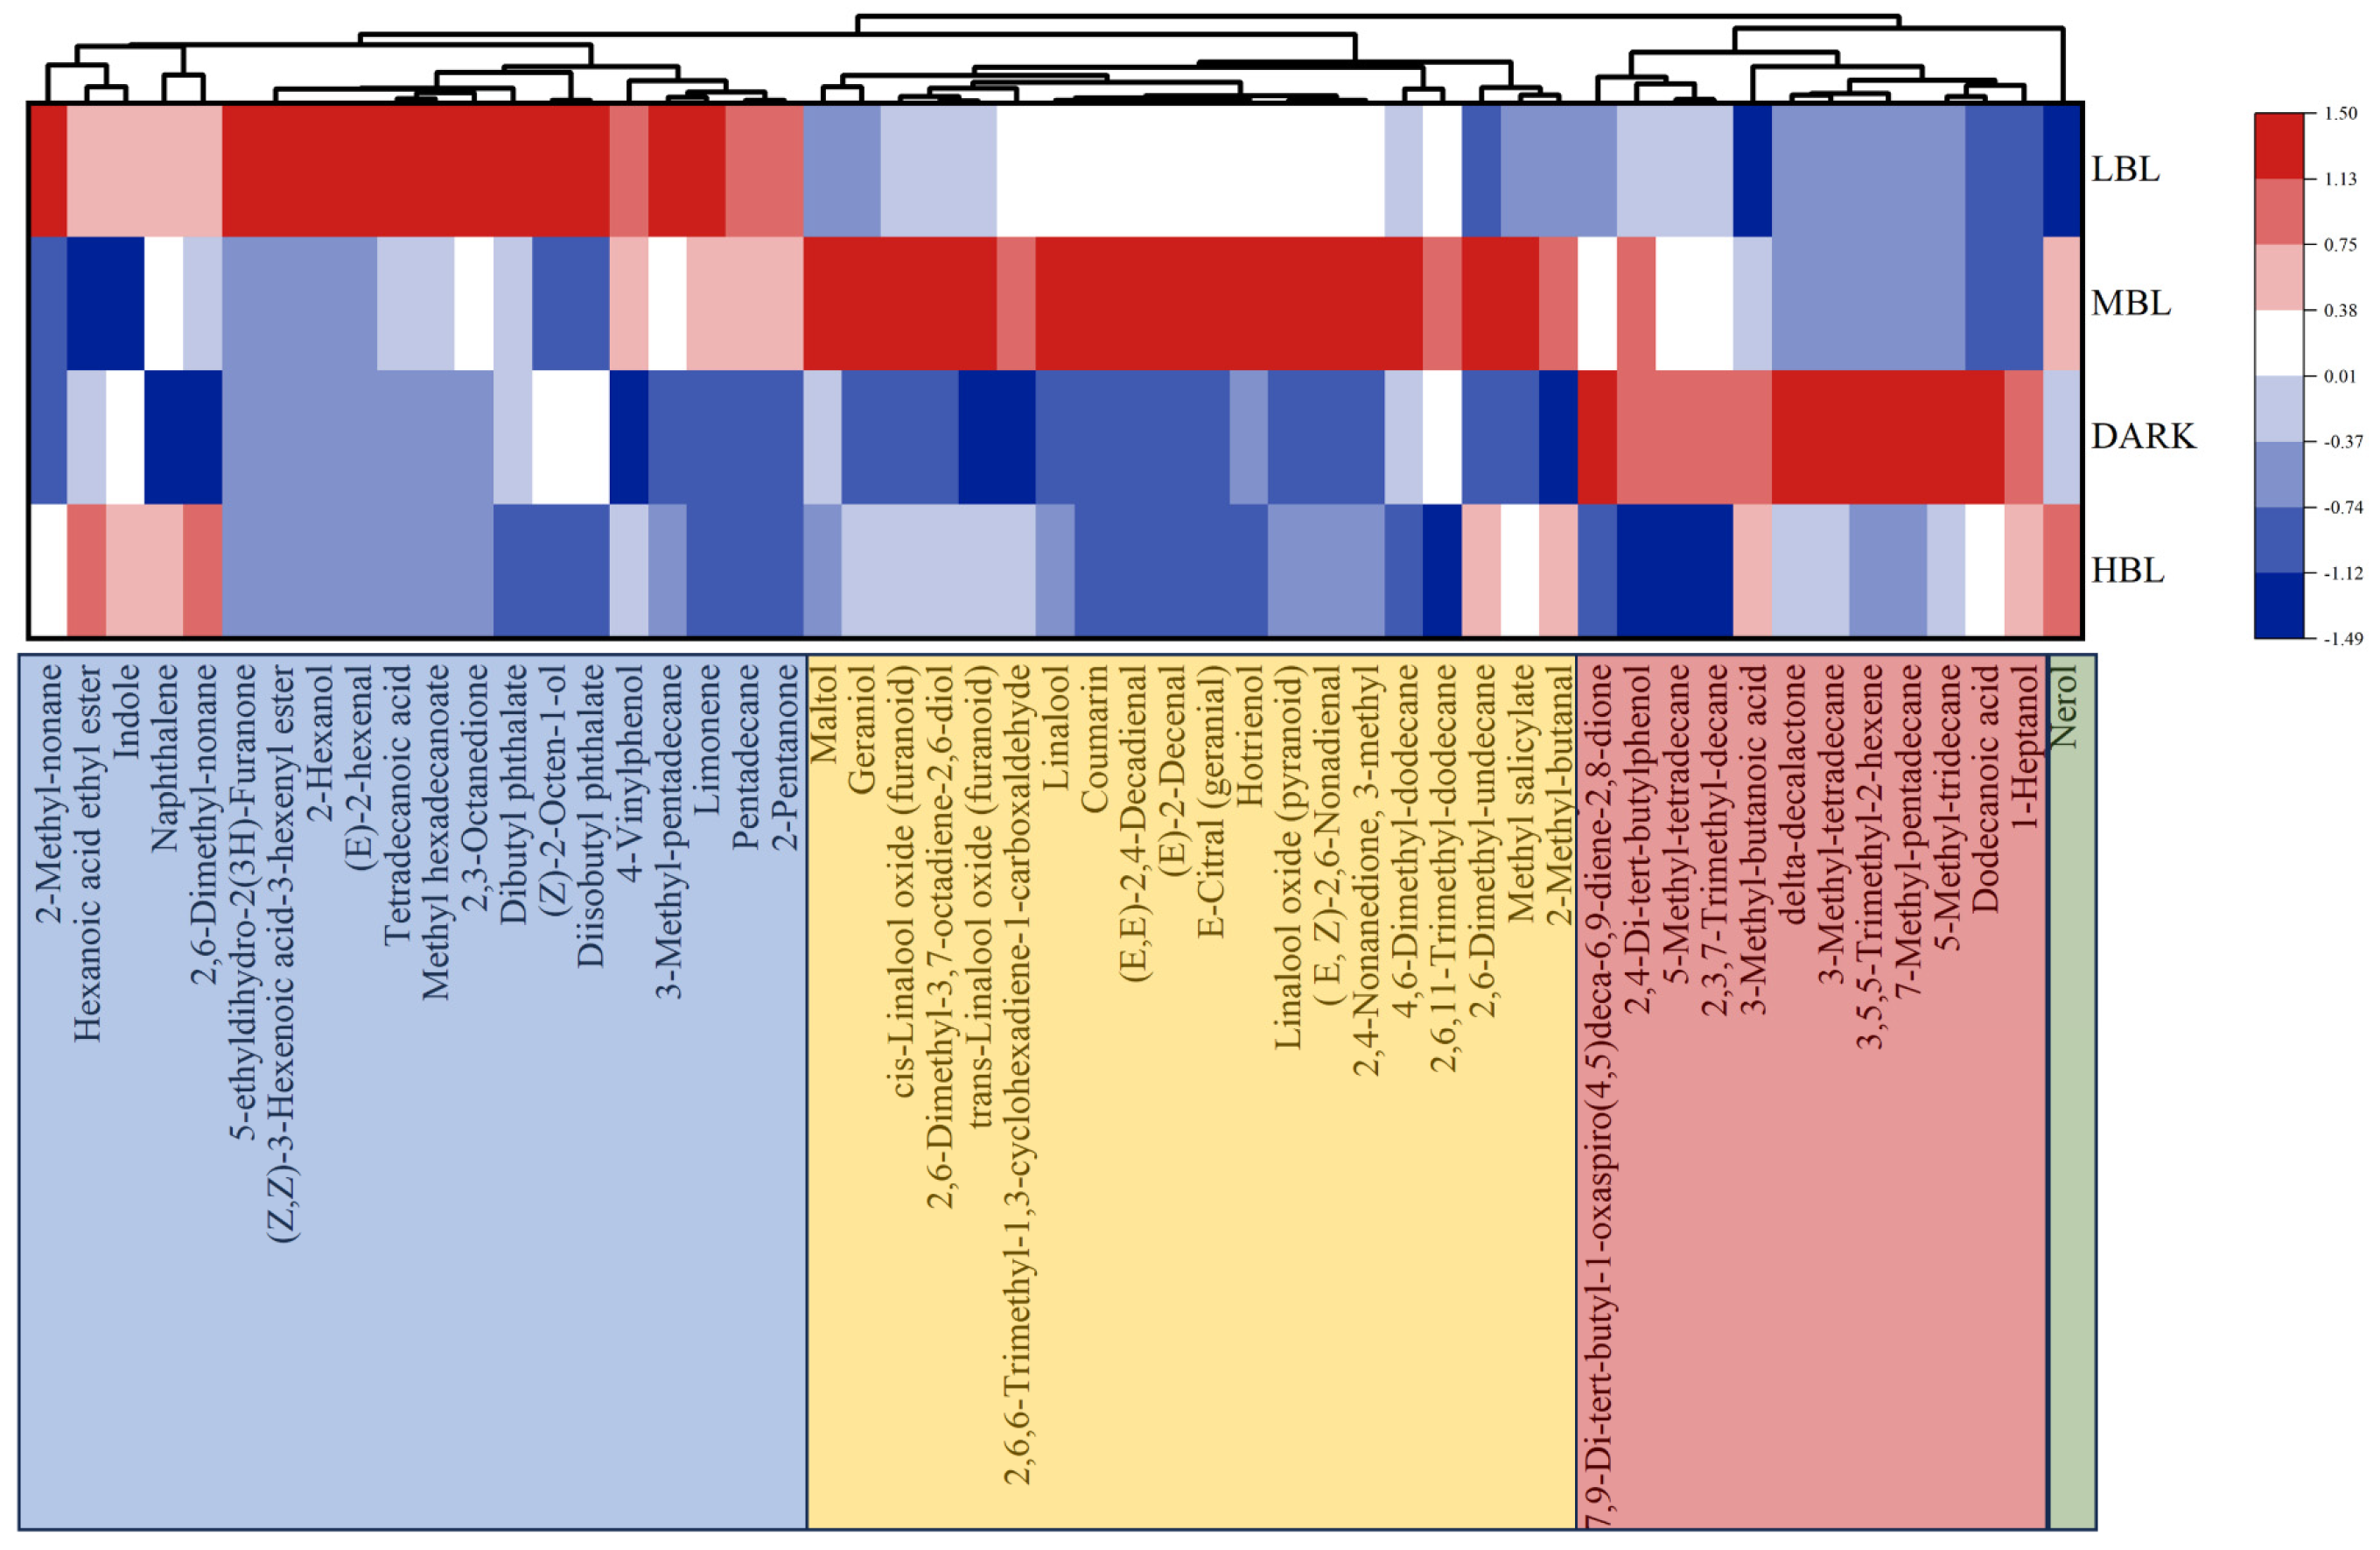
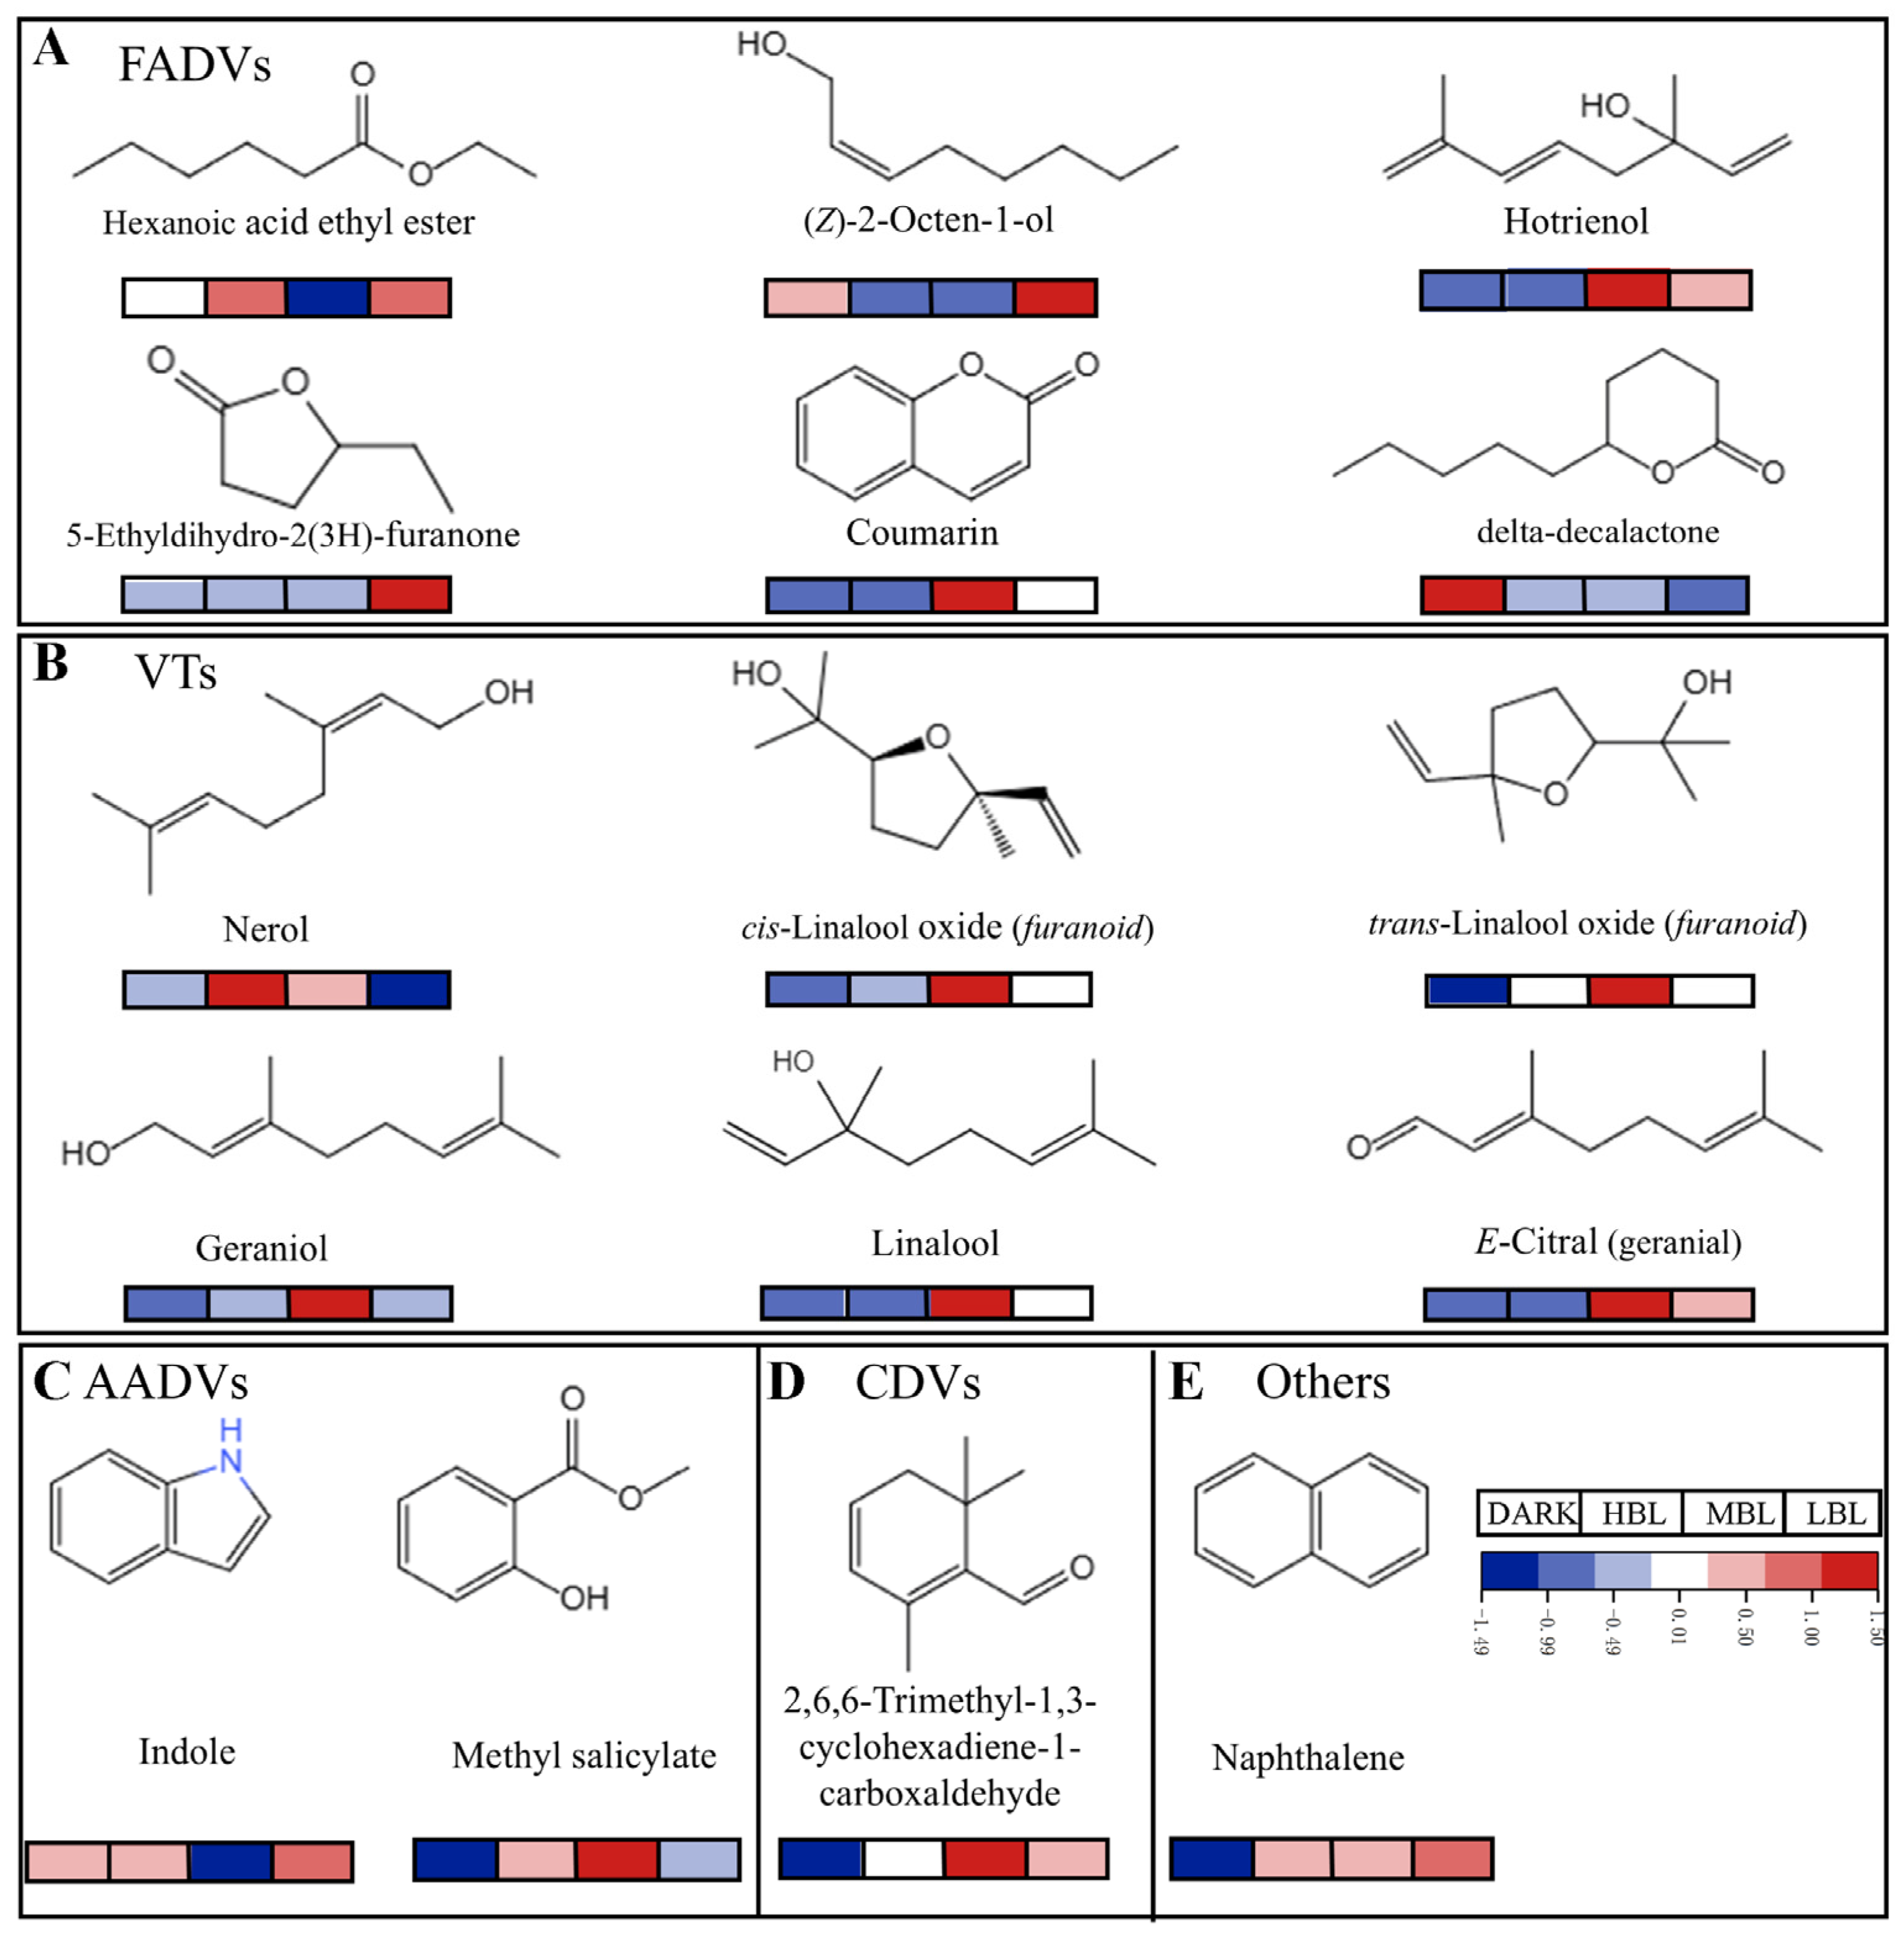
3.4. Validation of Important Differential Volatile Compounds
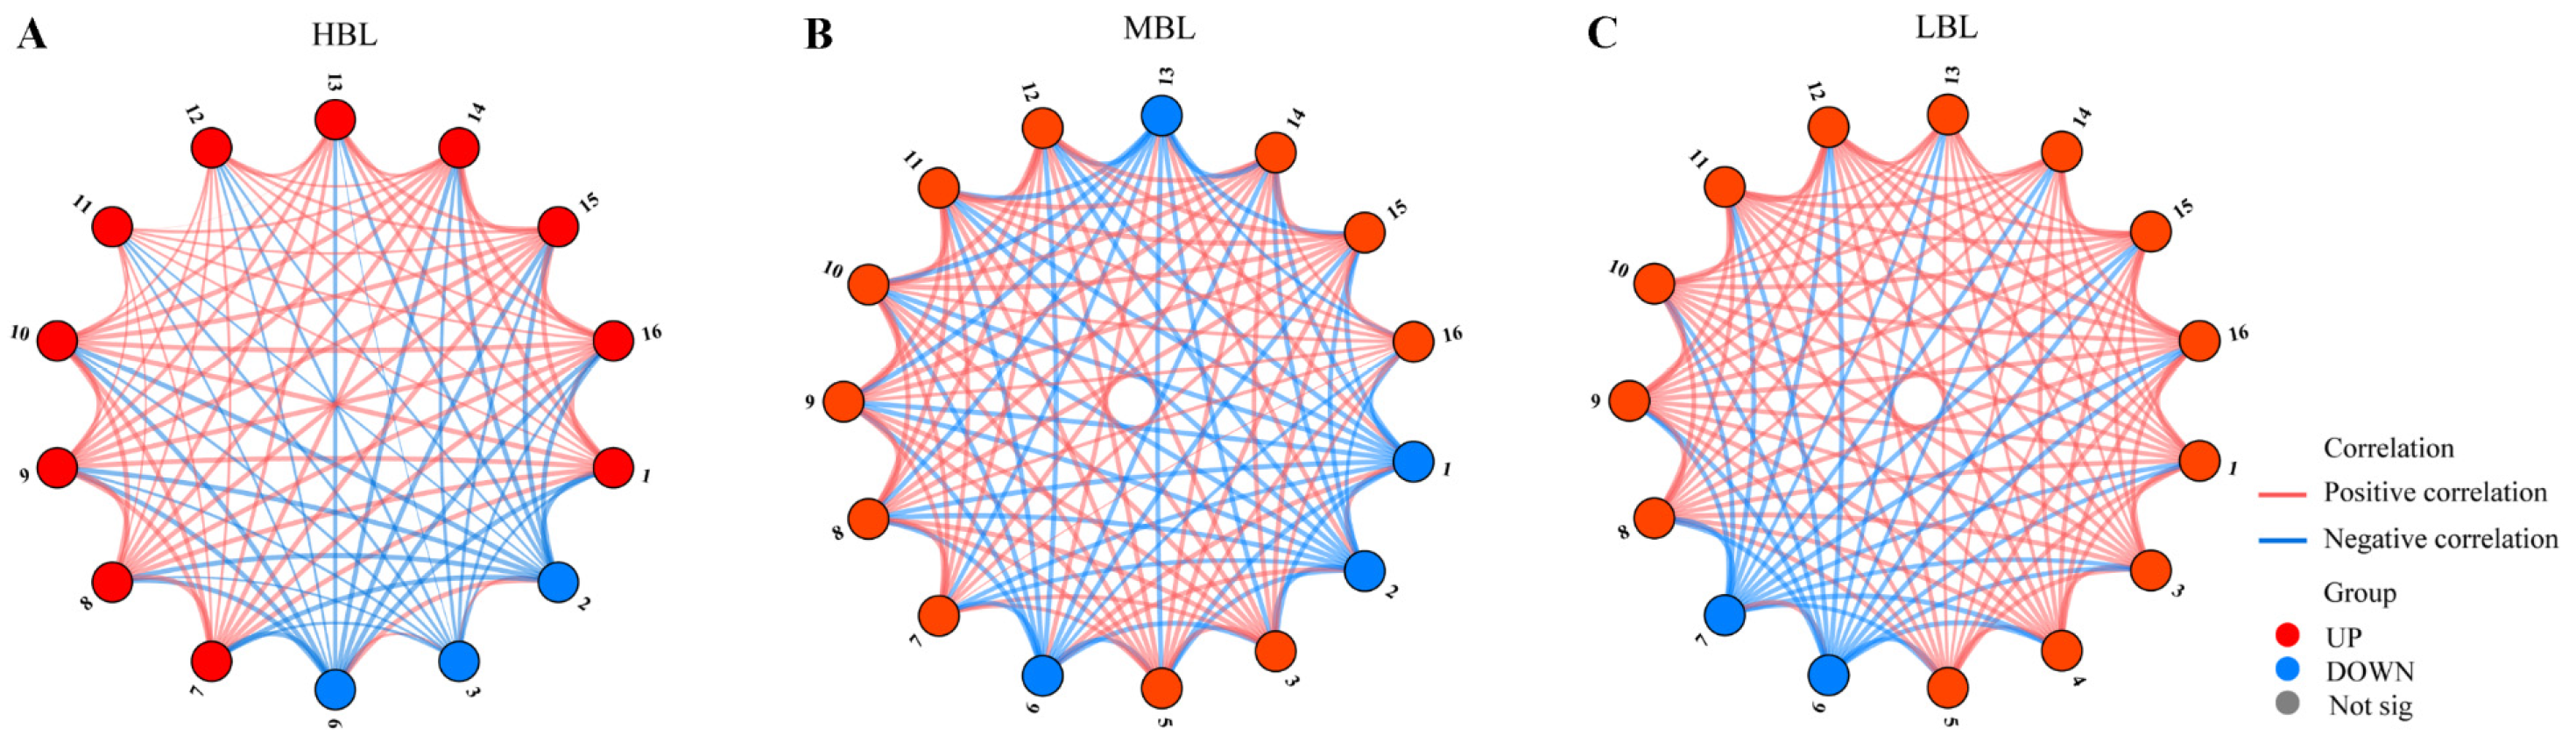
3.5. Relationship Network Analysis of Key Volatile Compounds
4. Discussion
5. Conclusions
Supplementary Materials
Author Contributions
Funding
Institutional Review Board Statement
Informed Consent Statement
Data Availability Statement
Conflicts of Interest
Abbreviations
| AADVs | Amino acid-derived volatiles |
| CDVs | Carotenoid-derived volatiles. |
| DARK | Dark treatment |
| FADVs | Fatty acid-derived volatiles |
| GC-MS | Gas chromatography-mass spectrometry |
| HBL | High-intensity blue light treatment |
| HCA | Hierarchical clustering analysis |
| HS-SPME | Headspace solid-phase microextraction |
| LBL | Low-intensity blue light treatment |
| LED | Light emitting diode |
| MBL | Middle-intensity blue light treatment |
| NIST | National Institute of Standards and Technology |
| OPLS-DA | Orthogonal partial least squares discriminant analysis |
| PCA | Principal component analysis |
| rOAV | Relative odor activity value |
| VIP | Variables important in the projection |
| VTs | Volatile terpenoids |
References
- Sheibani, E.; Duncan, S.E.; Kuhn, D.D.; Dietrich, A.M.; O’Keefe, S.F. SDE and SPME Analysis of Flavor Compounds in Jin Xuan Oolong Tea. J. Food Sci. 2016, 81, 348–358. [Google Scholar] [CrossRef] [PubMed]
- Yin, P.; Kong, Y.; Liu, P.; Wang, J.; Zhu, Y.; Wang, G.; Sun, M.; Chen, Y.; Guo, G.; Liu, Z. A critical review of key odorants in green tea: Identification and biochemical formation pathway. Trends Food Sci. Technol. 2022, 129, 221–232. [Google Scholar] [CrossRef]
- Yang, Y.-Q.; Yin, H.-X.; Yuan, H.-B.; Jiang, Y.-W.; Dong, C.-W.; Deng, Y.-L. Characterization of the volatile components in green tea by IRAE-HS-SPME/GC-MS combined with multivariate analysis. PLoS ONE 2018, 13, e0193393. [Google Scholar] [CrossRef] [PubMed]
- Kaczyński, P.; Iwaniuk, P.; Jankowska, M.; Orywal, K.; Socha, K.; Perkowski, M.; Farhan, J.A.; Łozowicka, B. Pesticide residues in common and herbal teas combined with risk assessment and transfer to the infusion. Chemosphere 2024, 367, 143550. [Google Scholar] [CrossRef]
- Qi, D.; Shi, Y.; Lu, M.; Ma, C.; Dong, C. Effect of withering/spreading on the physical and chemical properties of tea: A review. Comp. Rev. Food Sci. Food Safe 2024, 23, e70010. [Google Scholar] [CrossRef]
- Ho, C.; Zheng, X.; Li, S. Tea aroma formation. Food Sci. Hum. Wellness 2015, 4, 9–27. [Google Scholar] [CrossRef]
- Lasekan, O.; Lasekan, A. Flavour chemistry of mate and some common herbal teas. Trends Food Sci. Technol. 2012, 27, 37–46. [Google Scholar] [CrossRef]
- Chen, Q.; Shi, J.; Mu, B.; Chen, Z.; Dai, W.; Lin, Z. Metabolomics combined with proteomics provides a novel interpretation of the changes in nonvolatile compounds during white tea processing. Food Chem. 2020, 332, 127412. [Google Scholar] [CrossRef]
- Zhu, J.; Niu, Y.; Xiao, Z. Characterization of the key aroma compounds in Laoshan green teas by application of odour activity value (OAV), gas chromatography-mass spectrometry-olfactometry (GC-MS-O) and comprehensive two-dimensional gas chromatography mass spectrometry (GC × GC-qMS). Food Chem. 2021, 339, 128136. [Google Scholar] [CrossRef]
- Sui, M.; Wang, L.; Xue, R.; Xiang, J.; Wang, Y.; Yuan, Y.; Pu, Q.; Fang, X.; Liu, B.; Hu, X.; et al. The aroma formation from fresh tea leaves of Longjing 43 to finished Enshi Yulu tea at an industrial scale. J. Sci. Food Agric. 2024, 105, 244–254. [Google Scholar] [CrossRef]
- Ouzounis, T.; Rosenqvist, E.; Ottosen, C.-O. Spectral Effects of Artificial Light on Plant Physiology and Secondary Metabolism: A Review. HortScience 2015, 50, 1128–1135. [Google Scholar] [CrossRef]
- Hua, J.; Zhu, X.; Ouyang, W.; Yu, Y.; Chen, M.; Wang, J.; Yuan, H.; Jiang, Y. Non-target and target quantitative metabolomics with quantitative aroma evaluation reveal the influence mechanism of withering light quality on tea aroma and volatile metabolites evolution. Food Res. Int. 2024, 192, 114773. [Google Scholar] [CrossRef] [PubMed]
- Li, Y.; He, C.; Yu, X.; Zhou, J.; Ntezimana, B.; Yu, Z.; Chen, Y.; Ni, D. Study on improving aroma quality of summer-autumn black tea by red-light irradiation during withering. LWT 2022, 154, 112597. [Google Scholar] [CrossRef]
- Lin, J.; Liu, F.; Zhou, X.; Tu, Z.; Chen, L.; Wang, Y.; Yang, Y.; Wu, X.; Lv, H.; Zhu, H.; et al. Effect of red light on the composition of metabolites in tea leaves during the withering process using untargeted metabolomics. J. Sci. Food Agric. 2022, 102, 1628–1639. [Google Scholar] [CrossRef]
- Mu, L.; Li, T.; Tang, J.; Liu, L.; Wang, R. Effects of LED Light Withering on the Quality of White Tea. IOP Conf. Ser. Earth Environ. Sci. 2021, 792, 012018. [Google Scholar] [CrossRef]
- Xie, J.; Wang, Q.; Hu, J.; Wang, L.; Yu, X.; Yuan, H.; Jiang, Y.; Yang, Y. Uncovering the effects of spreading under different light irradiation on the volatile and non-volatile metabolites of green tea by intelligent sensory technologies integrated with targeted and non-targeted metabolomics analyses. Food Chem. 2025, 463, 141482. [Google Scholar] [CrossRef]
- Zhu, Y.-L. Insight into volatile metabolites and key odorants in black teas processed from Jianghua Kucha tea germplasm (Camellia sinensis var. assamica cv. Jianghua). Food Chem. 2025, 464, 141794. [Google Scholar] [CrossRef]
- Zhu, Y.; Lv, H.-P.; Shao, C.-Y.; Kang, S.; Zhang, Y.; Guo, L.; Dai, W.-D.; Tan, J.-F.; Peng, Q.-H.; Lin, Z. Identification of key odorants responsible for chestnut-like aroma quality of green teas. Food Res. Int. 2018, 108, 74–82. [Google Scholar] [CrossRef]
- Wang, H.; Hua, J.; Jiang, Y.; Yang, Y.; Wang, J.; Yuan, H. Influence of fixation methods on the chestnut-like aroma of green tea and dynamics of key aroma substances. Food Res. Int. 2020, 136, 109479. [Google Scholar] [CrossRef]
- Xie, J.; Wang, L.; Deng, Y.; Yuan, H.; Zhu, J.; Jiang, Y.; Yang, Y. Characterization of the key odorants in floral aroma green tea based on GC-E-Nose, GC-IMS, GC-MS and aroma recombination and investigation of the dynamic changes and aroma formation during processing. Food Chem. 2023, 427, 136641. [Google Scholar] [CrossRef]
- Guo, X.; Schwab, W.; Ho, C.; Song, C.; Wan, X. Characterization of the aroma profiles of oolong tea made from three tea cultivars by both GC–MS and GC-IMS. Food Chem. 2022, 376, 131933. [Google Scholar] [CrossRef]
- Ye, J.; Wang, Y.; Lin, S.; Hong, L.; Kang, J.; Chen, Y.; Li, M.; Jia, Y.; Jia, X.; Wu, Z.; et al. Effect of processing on aroma intensity and odor characteristic of Shuixian (Camellia sinensis) tea. Food Chem. X 2023, 17, 100616. [Google Scholar] [CrossRef] [PubMed]
- Pastoriza, S.; Mesías, M.; Cabrera, C.; Rufián-Henares, J.A. Healthy properties of green and white teas: An update. Food Funct. 2017, 8, 2650–2662. [Google Scholar] [CrossRef]
- Kochman, J.; Jakubczyk, K.; Antoniewicz, J.; Mruk, H.; Janda, K. Health Benefits and Chemical Composition of Matcha Green Tea: A Review. Molecules 2020, 26, 85. [Google Scholar] [CrossRef]
- Liu, N.; Shen, S.; Huang, L.; Deng, G.; Wei, Y.; Ning, J.; Wang, Y. Revelation of volatile contributions in green teas with different aroma types by GC–MS and GC–IMS. Food Res. Int. 2023, 169, 112845. [Google Scholar] [CrossRef]
- Jiang, Y.; Huang, D.; Lu, C.; Ye, S.; Li, L.; Li, T.; Liu, X.; Chen, B.; Guo, J.; Lu, L. Shorten spreading duration enhance the quality of summer Meitan Cuiya tea. Food Chem. X 2024, 24, 101878. [Google Scholar] [CrossRef]
- Feng, Z.; Li, Y.; Li, M.; Wang, Y.; Zhang, L.; Wan, X.; Yang, X. Tea aroma formation from six model manufacturing processes. Food Chem. 2019, 285, 347–354. [Google Scholar] [CrossRef]
- Liu, Z.; Yang, C.; Luo, X.; Hu, B.; Dong, C. Research on the online rapid sensing method of moisture content in famous green tea spreading. J. Food Process. Eng. 2021, 44, e13853. [Google Scholar] [CrossRef]
- Jiang, H.; Li, Y.; He, R.; Tan, J.; Liu, K.; Chen, Y.; Liu, H. Effect of Supplemental UV-A Intensity on Growth and Quality of Kale under Red and Blue Light. Int. J. Mol. Sci. 2022, 23, 6819. [Google Scholar] [CrossRef]
- He, Y.; Li, J.; Mei, H.; Zhuang, J.; Zhao, Z.; Jeyaraj, A.; Wang, Y.; Chen, X.; Li, X.; Liu, Z. Effects of leaf-spreading on the volatile aroma components of green tea under red light of different intensities. Food Res. Int. 2023, 168, 112759. [Google Scholar] [CrossRef]
- Yu, X.; He, C.; Li, Y.; Zhou, J.; Chen, Y.; Yu, Z.; Wang, Y.; Ni, D. Effects of different spreading treatments on the formation of aroma quality in green tea. Beverage Plant Res. 2021, 1, 14. [Google Scholar] [CrossRef]
- Li, J.; Hua, J.; Dong, C.; Yang, Y.; Deng, Y.; Wang, J.; Jiang, Y.; Yuan, H.; Zhou, Q. Real-time fingerprinting of the dynamics of green tea volatiles by ion mobility spectrometry for aroma assessment and discrimination. LWT 2020, 131, 109751. [Google Scholar] [CrossRef]
- Ai, Z.; Zhang, B.; Chen, Y.; Yu, Z.; Chen, H.; Ni, D. Impact of light irradiation on black tea quality during withering. J. Food. Sci. Technol. 2017, 54, 1212–1227. [Google Scholar] [CrossRef] [PubMed]
- Chen, Q.; Zhu, Y.; Liu, Y.; Liu, Y.; Dong, C.; Lin, Z.; Teng, J. Black tea aroma formation during the fermentation period. Food Chem. 2022, 374, 131640. [Google Scholar] [CrossRef]
- Zhang, S.; Chen, L.; Niu, L.; Yuan, H.; Shan, X.; Zhang, Q.; Feng, Y.; Zhou, Q.; Jiang, Y.; Li, J. New insights into the role of lipids in aroma formation during black tea processing revealed by integrated lipidomics and volatolomics. Curr. Res. Food Sci. 2024, 9, 100910. [Google Scholar] [CrossRef]
- Wang, Y.; Zheng, P.; Liu, P.; Song, X.; Guo, F.; Li, Y.; Ni, D.; Jiang, C. Novel insight into the role of withering process in characteristic flavor formation of teas using transcriptome analysis and metabolite profiling. Food Chem. 2019, 272, 313–322. [Google Scholar] [CrossRef]
- Yang, Z.; Kinoshita, T.; Tanida, A.; Sayama, H.; Morita, A.; Watanabe, N. Analysis of coumarin and its glycosidically bound precursor in Japanese green tea having sweet-herbaceous odour. Food Chem. 2009, 114, 289–294. [Google Scholar] [CrossRef]
- Zhang, Y.; Lei, P.; Ding, Y.; Zhai, X.; Wan, X.; Li, W.; Zhang, Y.; Lv, H.-P.; Lin, Z.; Zhu, Y. Uncovering characteristic and enantiomeric distribution of volatile components in Huangshan Maofeng and Zhejiang baked green teas. Food Chem. 2024, 465, 142001. [Google Scholar] [CrossRef]
- Wu, H.; Sheng, C.; Lu, M.; Ke, H.; Li, T.; Wei, Y.; Shen, S.; Yin, X.; Lu, C.; Wang, Y.; et al. Identification of the causes of aroma differences in white tea under different withering methods by targeted metabolomics. Food Biosci 2024, 59, 104020. [Google Scholar] [CrossRef]
- Chen, M.; Fang, D.; Gou, H.; Wang, S.; Yue, W. Quantitative Measurement Reveals Dynamic Volatile Changes and Potential Biochemical Mechanisms during Green Tea Spreading Treatment. ACS Omega 2022, 7, 40009–40020. [Google Scholar] [CrossRef]
- Jumtee, K.; Komura, H.; Bamba, T.; Fukusaki, E. Predication of Japanese green tea (Sen-cha) ranking by volatile profiling using gas chromatography mass spectrometry and multivariate analysis. J. Biosci. Bioeng. 2011, 112, 252–255. [Google Scholar] [CrossRef]
- Zeng, L.; Zhou, Y.; Gui, J.; Fu, X.; Mei, X.; Zhen, Y.; Ye, T.; Du, B.; Dong, F.; Watanabe, N.; et al. Formation of Volatile Tea Constituent Indole During the Oolong Tea Manufacturing Process. J. Agric. Food Chem. 2016, 64, 5011–5019. [Google Scholar] [CrossRef] [PubMed]
- GB/T 23776-2018; Methodology for Sensory Evaluation of Tea. China Agriculture Press Co., Ltd.: Beijing, China, 2021.

| No. | Name | Rt | RI | Content (μg/kg, DW) | |||
|---|---|---|---|---|---|---|---|
| HBL | MBL | LBL | DARK | ||||
| Alcohols | |||||||
| 1 | 1-Penten-3-ol | 2.33 | 684 | 256.62 ± 0.25 a | 186.79 ± 0.39 b | 141.71 ± 0.99 c | 134.71 ± 2.41 d |
| 2 | 1-Pentanol | 3.42 | 765 | 70.62 ± 0.23 a | 38.86 ± 0.55 b | 20.71 ± 0.11 d | 25.61 ± 0.07 c |
| 3 | 2-Hexanol | 3.99 | 803 | N.d | N.d | 17.62 ± 1.05 a | N.d |
| 4 | (Z)-3-Hexen-1-ol | 5.05 | 857 | 108.04 ± 1.74 a | 77.22 ± 0.49 b | 51.54 ± 0.92 c | 46.21 ± 1.16 d |
| 5 | 1-Hexanol | 5.25 | 868 | 27.6 ± 0.42 a | 15.5 ± 0.19 c | 16.49 ± 0.43 b | 8.51 ± 0.22 d |
| 6 | 1-Heptanol | 7.17 | 970 | 6.88 ± 0.04 b | N.d | N.d | 9.42 ± 0.31 a |
| 7 | 1-Octen-3-ol | 7.38 | 980 | 354.33 ± 2.96 b | 162.18 ± 1.34 d | 237.21 ± 1.35 c | 393.34 ± 2.37 a |
| 8 | 2-Ethyl-1-hexanol | 8.28 | 1030 | N.d | N.d | 10.41 ± 0.33 b | 13.32 ± 0.51 a |
| 9 | Benzyl alcohol | 8.40 | 1036 | 309.14 ± 0.43 b | 327.76 ± 0.32 a | 190.82 ± 1.19 c | 113.32 ± 2.26 d |
| 10 | (Z)-2-Octen-1-ol | 9.06 | 1067 | N.d | N.d | 36.12 ± 22.15 a | 17.82 ± 0.64 ab |
| 11 | (E)-2-Octen-1-ol | 9.10 | 1068 | 86.11 ± 1.07 a | N.d | N.d | N.d |
| 12 | cis-Linalool oxide (furanoid) | 9.20 | 1074 | 140.99 ± 1.58 c | 225.52 ± 0.37 a | 156.12 ± 2.88 b | 104.9 ± 1.78 d |
| 13 | trans-Linalool oxide (furanoid) | 9.53 | 1086 | 462.35 ± 2.12 c | 668.91 ± 0.6 a | 477.59 ± 1.34 b | 313.93 ± 4.15 d |
| 14 | Linalool | 9.76 | 1099 | 188.1 ± 1.87 c | 415.93 ± 0.85 a | 285.27 ± 2.26 b | 175.16 ± 4.36 d |
| 15 | Hotrienol | 9.87 | 1107 | 57.05 ± 1.16 d | 114.65 ± 0.96 a | 87.26 ± 1.91 b | 62.2 ± 1.34 c |
| 16 | Phenylethyl alcohol | 10.10 | 1116 | 912.04 ± 1.7 b | 1003.42 ± 0.97 a | 648.07 ± 8.75 c | 465.13 ± 4.37 d |
| 17 | 2,6-Dimethyl-3,7-octadiene-2,6-diol | 11.82 | 1190 | 73.01 ± 0.17 b | 114.74 ± 0.57 a | 75.75 ± 2.03 b | 46.18 ± 0.95 c |
| 18 | 4-Vinylphenol | 12.79 | 1219 | 36.54 ± 0.76 c | 66.58 ± 2.14 b | 82.98 ± 4.71 a | N.d |
| 19 | Nerol | 12.97 | 1228 | 58.21 ± 0.89 a | 42.19 ± 1.49 b | N.d | 24.77 ± 0.03 c |
| 20 | Geraniol | 13.63 | 1255 | 1152.5 ± 0.06 b | 1613.6 ± 3.57 a | 1107.96 ± 7.29 c | 1016.93 ± 1.58 d |
| 21 | Phytol | 36.06 | 2114 | N.d | 56.95 ± 0.99 c | 155.1 ± 0.57 a | 146.9 ± 4.37 b |
| Aldehydes | |||||||
| 22 | 3-Methyl-butanal | 2.12 | 652 | 53.01 ± 2.41 a | 38.4 ± 0.24 b | 27.23 ± 0.05 c | 30.31 ± 0.84 c |
| 23 | 2-Methyl-butanal | 2.19 | 662 | 62.69 ± 0.24 b | 66.55 ± 0.61 a | 56.6 ± 0.9 c | 52.04 ± 1.38 d |
| 24 | Hexanal | 3.91 | 800 | 138.63 ± 0.27 a | N.d | N.d | 19.48 ± 0.32 b |
| 25 | (E)-2-hexenal | 4.67 | 854 | N.d | N.d | 7.89 ± 1.84 a | N.d |
| 26 | Benzaldehyde | 7.09 | 962 | 76.1 ± 0.11 a | 35.66 ± 0.49 b | 16.75 ± 0.19 c | 9.53 ± 0.19 d |
| 27 | (E,E)-2,4-Heptadienal | 7.91 | 1011 | N.d | 8.44 ± 2.2 a | 8.68 ± 2.13 a | N.d |
| 28 | Benzeneacetaldehyde | 8.62 | 1045 | 77.95 ± 2.02 a | 30.1 ± 0.98 b | 19.53 ± 0.43 c | 13.34 ± 1.09 d |
| 29 | (E)-2-octenal | 8.83 | 1060 | 115.52 ± 2.78 a | N.d | N.d | N.d |
| 30 | (E,Z)-2,6-Nonadienal | 11.00 | 1155 | 3.44 ± 0.18 c | 34.77 ± 0.92 a | 17.72 ± 0.34 b | N.d |
| 31 | 2,6,6-Trimethyl-1,3-cyclohexadiene-1-carboxaldehyde | 12.18 | 1201 | 18.59 ± 0.25 c | 23.33 ± 0.33 a | 20.52 ± 0.35 b | 14.61 ± 0.07 d |
| 32 | Decanal | 12.24 | 1205 | 69.86 ± 0.5 a | 44.91 ± 1.78 b | 35.31 ± 1.55 c | N.d |
| 33 | β-Cyclocitral | 12.81 | 1220 | 22.98 ± 0.7 b | 27.13 ± 1.37 a | 17.54 ± 0.42 c | 9.58 ± 0.16 d |
| 34 | Neral | 13.29 | 1240 | 64.65 ± 14.74 a | 62.12 ± 10.81 a | 42.64 ± 1.09 a | N.d |
| 35 | (E)-2-Decenal | 13.83 | 1263 | 2.83 ± 0.3 c | 246.31 ± 3.32 a | 127.05 ± 1.27 b | N.d |
| 36 | E-Citral (geranial) | 14.09 | 1271 | 2.97 ± 1.07 c | 484.22 ± 0.79 a | 262.97 ± 7.74 b | N.d |
| 37 | (E,E)-2,4-Decadienal | 15.02 | 1317 | N.d | 90.79 ± 23.27 a | 47.01 ± 2.38 b | N.d |
| 38 | Vanillin | 17.82 | 1405 | 70.41 ± 2.51 a | 11.55 ± 1.38 b | N.d | N.d |
| Acids | |||||||
| 39 | 3-Methyl-butanoic acid | 4.70 | 863 | 29.45 ± 0.54 b | 24.55 ± 0.15 c | 18.64 ± 0.18 d | 31.14 ± 0.24 a |
| 40 | 2-Methyl-butanoic acid | 4.89 | 861 | N.d | 8.54 ± 0.33 c | 14.78 ± 0.2 b | 20.29 ± 0.09 a |
| 41 | Pentanoic acid | 5.49 | 904 | 36.06 ± 6.57 a | N.d | N.d | N.d |
| 42 | n-Decanoic acid | 16.84 | 1373 | 54.5 ± 9.54 a | 43.49 ± 5.97 a | N.d | N.d |
| 43 | Dodecanoic acid | 22.46 | 1568 | 112.08 ± 2.99 b | N.d | N.d | 246.7 ± 3.32 a |
| 44 | Tetradecanoic acid | 27.64 | 1769 | N.d | 12.31 ± 1.33 b | 77.86 ± 4.08 a | N.d |
| Esters | |||||||
| 45 | Ethyl Acetate | 1.87 | 612 | 18.88 ± 0.57 c | 78.78 ± 0.29 a | 68.33 ± 0.6 b | 67.52 ± 0.93 b |
| 46 | Hexanoic acid ethyl ester | 7.76 | 1000 | 12.62 ± 0.02 a | N.d | 12.24 ± 0.44 a | 6.9 ± 0.1 b |
| 47 | (E)-3-Hexenoic acid ethyl ester | 7.86 | 1006 | 3.27 ± 0.59 a | N.d | N.d | N.d |
| 48 | Methyl salicylate | 12.04 | 1192 | 142.13 ± 2.45 b | 174.14 ± 1.5 a | 118.26 ± 0.83 c | 95.51 ± 2.05 d |
| 49 | (Z)-Hexanoic acid-3-hexenyl ester | 17.21 | 1380 | N.d | 287.95 ± 0.89 b | 434.35 ± 1.11 a | 181.14 ± 7.63 c |
| 50 | (Z,Z)-3-Hexenoic acid-3-hexenyl ester | 17.34 | 1389 | N.d | N.d | 80.74 ± 0.43 a | N.d |
| 51 | Diethyl phthalate | 23.16 | 1594 | 173.09 ± 2.28 a | 26.16 ± 0.32 b | 23.53 ± 0.35 b | N.d |
| 52 | Methyl jasmonate | 23.63 | 1648 | 32.53 ± 0.49 a | N.d | N.d | N.d |
| 53 | 2-Ethylhexyl-benzoic acid ester | 26.37 | 1735 | N.d | 127.54 ± 2.1 a | 86.27 ± 0.77 b | 24.84 ± 0.55 c |
| 54 | Diisobutyl phthalate | 30.25 | 1870 | 64.64 ± 1.62 c | 66.14 ± 0.28 c | 120.69 ± 0.6 a | 95.54 ± 2.69 b |
| 55 | Methyl hexadecanoate | 31.74 | 1926 | N.d | 12.16 ± 1 b | 50.61 ± 2.12 a | N.d |
| 56 | Dibutyl phthalate | 32.62 | 1965 | 53.48 ± 0.98 c | 90.26 ± 0.07 b | 213.87 ± 1.48 a | 95.65 ± 3.36 b |
| 57 | Ethyl hexadecanoate | 33.38 | 1993 | 31.37 ± 0.29 c | 71.89 ± 1.56 b | 74 ± 1.72 b | 92.84 ± 1.69 a |
| 58 | (E)-2-Hexenyl-hexanoic acid ester | 17.43 | 1391 | N.d | 46.23 ± 1.31 c | 95.82 ± 4.6 a | 59.72 ± 0.63 b |
| 59 | Delta-decalactone | 20.48 | 1495 | 488.87 ± 7.27 b | 449.06 ± 0.77 b | 253.4 ± 5.09 c | 1555.69 ± 36.95 a |
| Ketons | |||||||
| 60 | 2-Pentanone | 1.95 | 655 | N.d | 49.92 ± 1.08 b | 61.15 ± 1.36 a | N.d |
| 61 | 2-Heptanone | 5.72 | 891 | 23.37 ± 4.65 a | N.d | N.d | N.d |
| 62 | 2,3-Octanedione | 7.42 | 985 | N.d | 13.04 ± 2.33 b | 34.42 ± 3.29 a | N.d |
| 63 | 6-Methyl-5-hepten-2-one | 7.54 | 986 | N.d | 25.94 ± 0.28 c | 35.68 ± 0.17 a | 30.02 ± 0.59 b |
| 64 | (E)-3-Octen-2-one | 8.42 | 1033 | 77.09 ± 0.58 a | N.d | N.d | N.d |
| 65 | 2,2,6-Trimethyl-cyclohexanone | 8.42 | 1036 | N.d | 12.7 ± 0.13 b | 16.93 ± 0.37 a | 12.45 ± 0.2 b |
| 66 | (R,S)-5-Ethyl-6-methyl-3 E-hepten-2-one | 10.78 | 1144 | 58.67 ± 0.39 a | 18.48 ± 0.44 b | N.d | N.d |
| 67 | α-Ionone | 18.47 | 1426 | 76.29 ± 2.63 a | N.d | N.d | N.d |
| 68 | Geranylacetone | 19.14 | 1456 | 295.4 ± 6.23 a | N.d | N.d | N.d |
| 69 | trans-β-Ionone | 20.24 | 1486 | 762.8 ± 4.48 a | 656.47 ± 1.52 b | 336.95 ± 3.21 c | 225.39 ± 4.8 d |
| 70 | cis-Jasmone | 17.76 | 1394 | N.d | 105.61 ± 1.04 b | 144.78 ± 1.72 a | 83.82 ± 1.29 c |
| 71 | 2,4-Nonanedione, 3-methyl | 13.45 | 1252 | 11.23 ± 0.42 c | 64.17 ± 1.04 a | 33.91 ± 0.37 b | N.d |
| Hydrocarbons | |||||||
| 72 | 2-Methyl-nonane | 7.11 | 964 | 4.62 ± 0.18 b | N.d | 8.28 ± 0.09 a | N.d |
| 73 | 3,5,5-Trimethyl-2-hexene | 7.30 | 985 | N.d | N.d | N.d | 137.75 ± 3.24 a |
| 74 | 2,6-Dimethyl-nonane | 8.11 | 1018 | 51.67 ± 1.28 a | 42.02 ± 1.06 c | 47.08 ± 2.13 b | 34.2 ± 0.67 d |
| 75 | Limonene | 8.30 | 1030 | N.d | 8.43 ± 0.87 b | 13.6 ± 1.28 a | N.d |
| 76 | β-Ocimene | 8.67 | 1037 | N.d | 22.82 ± 0.9 a | 15.88 ± 0.89 b | N.d |
| 77 | 2,9-Dimethyl-decane | 10.32 | 1126 | 9.01 ± 0.25 a | N.d | N.d | N.d |
| 78 | Naphthalene | 11.94 | 1181 | 16.14 ± 0.61 a | 15.54 ± 2.3 a | 18.38 ± 0.58 a | N.d |
| 79 | Dodecane | 12.10 | 1200 | 72.23 ± 0.87 b | 89.51 ± 0.05 a | 65.68 ± 0.33 c | 36.18 ± 3.07 d |
| 80 | 2,4-Dimethyl-undecane | 12.38 | 1208 | 28.71 ± 0.49 a | 26.16 ± 0.73 b | 15.81 ± 0.26 c | 15.51 ± 0.47 c |
| 81 | 2,6-Dimethyl-undecane | 12.56 | 1210 | 141.53 ± 1.95 b | 166.62 ± 2.12 a | 91.79 ± 0.62 c | 91.17 ± 1.11 c |
| 82 | 4-Methyl-dodecane | 13.66 | 1259 | 55.24 ± 15.05 a | N.d | N.d | N.d |
| 83 | 2,3-Dimethyl-undecane | 13.77 | 1251 | 261.58 ± 7.56 a | N.d | N.d | N.d |
| 84 | 2,6,11-Trimethyl-dodecane | 14.49 | 1275 | N.d | 103.41 ± 20.41 a | 60.42 ± 0.68 b | 61.31 ± 1.02 b |
| 85 | Tridecane | 14.80 | 1300 | 8.25 ± 0.29 c | 86.36 ± 1.42 a | 58.8 ± 0.6 b | 55.54 ± 3.06 b |
| 86 | 4,6-Dimethyl-dodecane | 15.34 | 1325 | 62.48 ± 14.8 b | 199.48 ± 42.43 a | 117.46 ± 0.93 b | 117.59 ± 0.97 b |
| 87 | 6-Methyl-tridecane | 16.32 | 1344 | N.d | 28.46 ± 5.12 b | 28.17 ± 9.44 b | 93.88 ± 5.15 a |
| 88 | 5-Methyl-tridecane | 16.40 | 1348 | 24.41 ± 1.08 b | N.d | N.d | 73.49 ± 1.12 a |
| 89 | 4-Methyl-tridecane | 16.45 | 1359 | N.d | 28.08 ± 1.17 c | 32.69 ± 0.87 b | 78.63 ± 1.43 a |
| 90 | 3-Methyl-tridecane | 16.79 | 1371 | 33.54 ± 1.97 b | 41.28 ± 7.66 b | 45.18 ± 20.79 b | 154.67 ± 4.73 a |
| 91 | 5-Methyl-tetradecane | 19.24 | 1453 | N.d | 224.51 ± 9.47 b | 144.59 ± 2.53 c | 322.47 ± 3.48 a |
| 92 | 4-Methyl-tetradecane | 19.39 | 1459 | 511.39 ± 6.69 a | 160.73 ± 0.92 c | 129.95 ± 5.4 d | 253.77 ± 0.8 b |
| 93 | 2,3,7-Trimethyl-decane | 19.51 | 1466 | 88.81 ± 0.75 d | 665.63 ± 6.45 b | 504.4 ± 5.8 c | 967.42 ± 8.51 a |
| 94 | 3-Methyl-tetradecane | 19.64 | 1470 | 83.38 ± 2.24 b | N.d | N.d | 440.51 ± 30.12 a |
| 95 | Pentadecane | 20.56 | 1500 | N.d | 605.15 ± 2.9 b | 794.43 ± 14.97 a | N.d |
| 96 | 7-Methyl-pentadecane | 21.90 | 1541 | N.d | N.d | N.d | 192.88 ± 5 a |
| 97 | 3-Methyl-pentadecane | 22.54 | 1570 | 16.44 ± 1.08 c | 163.85 ± 12.13 b | 308.29 ± 22.13 a | N.d |
| 98 | Hexadecane | 23.26 | 1600 | N.d | 191.45 ± 1.56 c | 502.66 ± 2.23 b | 628.56 ± 6.06 a |
| 99 | 4-Methyl-hexadecane | 23.84 | 1659 | 18.56 ± 0.32 a | N.d | N.d | N.d |
| 100 | Neophytadiene | 29.65 | 1837 | N.d | 15.22 ± 0.27 c | 35.48 ± 0.43 a | 25.33 ± 0.53 b |
| Heterocyclic | |||||||
| 101 | 2-Ethyl-furan | 2.52 | 703 | 28.02 ± 0.69 a | 14.79 ± 0.24 b | 7.14 ± 0.21 c | 8.45 ± 0.54 c |
| 102 | 1-Ethyl-1H-pyrrole | 4.28 | 821 | N.d | 12.58 ± 0.21 a | 10.27 ± 0.14 b | 12.72 ± 0.97 a |
| 103 | Butyrolactone | 6.11 | 915 | 23.88 ± 0.07 a | 12.36 ± 0.5 b | N.d | N.d |
| 104 | 2-Pentylfuran | 7.63 | 993 | 163.98 ± 0.62 a | 93.09 ± 1.44 b | 53.49 ± 1.21 c | 27.51 ± 1.12 d |
| 105 | 2,3,5-Trimethylpyrazine | 7.86 | 1008 | 26.75 ± 7.28 a | N.d | N.d | N.d |
| 106 | 5-ethyldihydro-2(3H)-Furanone | 8.73 | 1057 | N.d | N.d | 23.4 ± 0.34 a | N.d |
| 107 | 2-Acetyl pyrrole | 8.86 | 1064 | 29.41 ± 1.12 c | 176.02 ± 0.93 a | 177.28 ± 0.66 a | 147.3 ± 4.19 b |
| 108 | Maltol | 10.08 | 1110 | N.d | 56.07 ± 0.92 a | N.d | 5.51 ± 0.05 b |
| 109 | Linalool oxide (pyranoid) | 11.45 | 1173 | 325.7 ± 0.4 c | 558.02 ± 0.43 a | 424.04 ± 2.91 b | 289.31 ± 2.25 d |
| 110 | Indole | 14.78 | 1295 | 67.68 ± 1.43 a | N.d | 70.67 ± 0.28 a | 58.04 ± 1.76 b |
| 111 | Coumarin | 18.87 | 1441 | 34.7 ± 1.9 c | 53.87 ± 0.7 a | 43.14 ± 0.81 b | 34.9 ± 0.28 c |
| 112 | Dihydroactinolide | 21.46 | 1538 | 605.45 ± 3.91 a | 462.74 ± 2.27 b | 264.46 ± 4.66 d | 373.34 ± 2.61 c |
| 113 | 7,9-Di-tert-butyl-1-oxaspiro(4,5)deca-6,9-diene-2,8-dione | 31.60 | 1923 | 20.25 ± 0.67 c | 25.68 ± 0.15 b | 21.35 ± 0.01 c | 33.01 ± 1.35 a |
| Others | |||||||
| 114 | 1,1-Diethoxy-ethane | 2.81 | 726 | 222.43 ± 0.52 a | 10.62 ± 0.28 b | N.d | 9.04 ± 0.99 b |
| 115 | p-Vinylguaiacol | 14.86 | 1317 | 114.84 ± 1.92 a | N.d | N.d | N.d |
| 116 | 2,4-Di-tert-butylphenol | 20.94 | 1519 | 107.69 ± 0.83 c | 256.55 ± 2.91 a | 176.8 ± 0.88 b | 251.01 ± 5.36 a |
| No. | Compound Name | Odor Characteristic | OTs (ug/kg) | rOAV | |||
|---|---|---|---|---|---|---|---|
| HBL | MBL | LBL | DARK | ||||
| 1 | Hexanoic acid ethyl ester | citrus, green | 0.7 | 18.03 ± 0.03 a | N.d | 17.49 ± 0.63 a | 9.86 ± 0.14 b |
| 2 | (Z)-2-Octen-1-ol | Sweet, green, citrus, fatty, herbal, cucumber- like | 3 | N.d | N.d | 12.04 ± 7.38 a | 5.94 ± 0.21 ab |
| 3 | Hotrienol | Fresh, floral, fruity | 110 | 0.52 ± 0.01 d | 1.04 ± 0.01 a | 0.79 ± 0.02 b | 0.57 ± 0.01 c |
| 4 | 5-Ethyldihydro-2(3 H)-furanone | Caramel, nutty, roasted, sweet, creamy | 9.7 | N.d | N.d | 2.41 ± 0.03 a | N.d |
| 5 | Coumarin | Floral | 11 | 3.15 ± 0.17 c | 4.9 ± 0.06 a | 3.92 ± 0.07 b | 3.17 ± 0.03 c |
| 6 | delta-Decalactone | Green, herbal | 66 | 7.41 ± 0.11 b | 6.8 ± 0.01 b | 3.84 ± 0.08 c | 23.57 ± 0.56 a |
| 7 | Nerol | Fresh, citrus, floral, green, sweet, lemon-like | 49 | 1.19 ± 0.02 a | 0.86 ± 0.03 b | N.d | 0.51 ± 0.00 c |
| 8 | cis-Linalool oxide (furanoid) | Sweet, floral, creamy | 190 | 0.74 ± 0.01 c | 1.19 ± 0.00 a | 0.82 ± 0.02 b | 0.55 ± 0.01 d |
| 9 | trans-Linalool oxide (furanoid) | Sweet, floral, creamy | 190 | 2.43 ± 0.01 c | 3.52 ± 0.00 a | 2.51 ± 0.01 b | 1.65 ± 0.02 d |
| 10 | Geraniol | Rose-like, sweet, honey-like | 7.5 | 153.67 ± 0.01 b | 215.15 ± 0.48 a | 147.73 ± 0.97 c | 135.59 ± 0.21 d |
| 11 | Linalool | Floral, sweet, grape-like, woody | 0.22 | 854.99 ± 8.48 c | 1890.6 ± 3.86 a | 1296.68 ± 10.27 b | 796.2 ± 19.8 d |
| 12 | E-Citral (geranial) | Citrus, lemon-like | 1 | 2.97 ± 1.07 c | 484.22 ± 0.79 a | 262.97 ± 7.74 b | N.d |
| 13 | Indole | Floral, animal-like | 40 | 1.69 ± 0.04 a | N.d | 1.77 ± 0.01 a | 1.45 ± 0.04 b |
| 14 | Methyl salicylate | Minty, wintergreen-like | 40 | 3.55 ± 0.06 b | 4.35 ± 0.04 a | 2.96 ± 0.02 c | 2.39 ± 0.05 d |
| 15 | 2,6,6-Trimethyl-1,3-cyclohexadiene-1-carboxaldehyde | Woody, spicy, medicinal, powdery, herbal | 3 | 6.20 ± 0.08 c | 7.78 ± 0.11 a | 6.84 ± 0.12 b | 4.87 ± 0.02 d |
| 16 | Naphthalene | Pungent, tar | 0.44 | 36.68 ± 1.39 a | 35.32 ± 5.22 a | 41.77 ± 1.32 a | N.d |
Disclaimer/Publisher’s Note: The statements, opinions and data contained in all publications are solely those of the individual author(s) and contributor(s) and not of MDPI and/or the editor(s). MDPI and/or the editor(s) disclaim responsibility for any injury to people or property resulting from any ideas, methods, instructions or products referred to in the content. |
© 2025 by the authors. Licensee MDPI, Basel, Switzerland. This article is an open access article distributed under the terms and conditions of the Creative Commons Attribution (CC BY) license (https://creativecommons.org/licenses/by/4.0/).
Share and Cite
He, Y.; Tang, Y.; Song, S.; Li, L.; An, S.; Zhou, G.; Zhu, J.; Li, S.; Yin, Y.; Jeyaraj, A.; et al. Effect of Blue Light Intensity During Spreading on the Aroma of Green Tea. Foods 2025, 14, 1308. https://doi.org/10.3390/foods14081308
He Y, Tang Y, Song S, Li L, An S, Zhou G, Zhu J, Li S, Yin Y, Jeyaraj A, et al. Effect of Blue Light Intensity During Spreading on the Aroma of Green Tea. Foods. 2025; 14(8):1308. https://doi.org/10.3390/foods14081308
Chicago/Turabian StyleHe, Youyue, Yan Tang, Shiyue Song, Lailong Li, Shaoshuai An, Guoming Zhou, Jing Zhu, Song Li, Yue Yin, Anburaj Jeyaraj, and et al. 2025. "Effect of Blue Light Intensity During Spreading on the Aroma of Green Tea" Foods 14, no. 8: 1308. https://doi.org/10.3390/foods14081308
APA StyleHe, Y., Tang, Y., Song, S., Li, L., An, S., Zhou, G., Zhu, J., Li, S., Yin, Y., Jeyaraj, A., Peng, C., Li, X., & Zeng, G. (2025). Effect of Blue Light Intensity During Spreading on the Aroma of Green Tea. Foods, 14(8), 1308. https://doi.org/10.3390/foods14081308