
Energy and Macronutrient Dietary Intakes of Serbian Adults 18–64 Years Old: EFSA EU Menu Food Consumption Survey in Serbia (2017–2022)

 ,
,  , , , , , , , , and
Abstract
1. Introduction
Aims
- To provide detailed evidence on the energy and macronutrient intake patterns among Serbian adults, identifying the key nutritional imbalances and gender-based disparities in dietary habits.
- To evaluate the adequacy of protein, fat, carbohydrate, and fiber intake in relation to the international dietary recommendations, including those of EFSA and the US Dietary Guidelines.
- To assess the prevalence of overweight, obesity, and inadequate nutrition, particularly the underconsumption of essential micronutrients, such as fruits, vegetables, and fiber.
- To contribute to the ongoing harmonization of dietary data across European countries, enhancing the comparability of Serbia’s dietary data with other European nations, and supporting the development of targeted public health policies.
- To provide actionable insights for the development of national dietary guidelines and to inform public health strategies aimed at improving the dietary habits of Serbian adults, with particular attention being paid to gender-specific needs and nutritional interventions.
2. Materials and Methods
2.1. Study Design
2.2. Setting
2.3. Participants
2.4. Variables
2.5. Data Sources/Measurement
2.6. Bias
2.7. Study Size
2.8. Quantitative Variables
2.9. Statistical Methods
3. Results
3.1. Anthropometric Data and Nutritional Status
3.2. Daily Energy and Macronutrient Intake Across Gender
3.3. Energy Intake Categories and Macronutrient Distribution Compared to the Dietary Guidelines
3.4. Daily Food Group Consumption
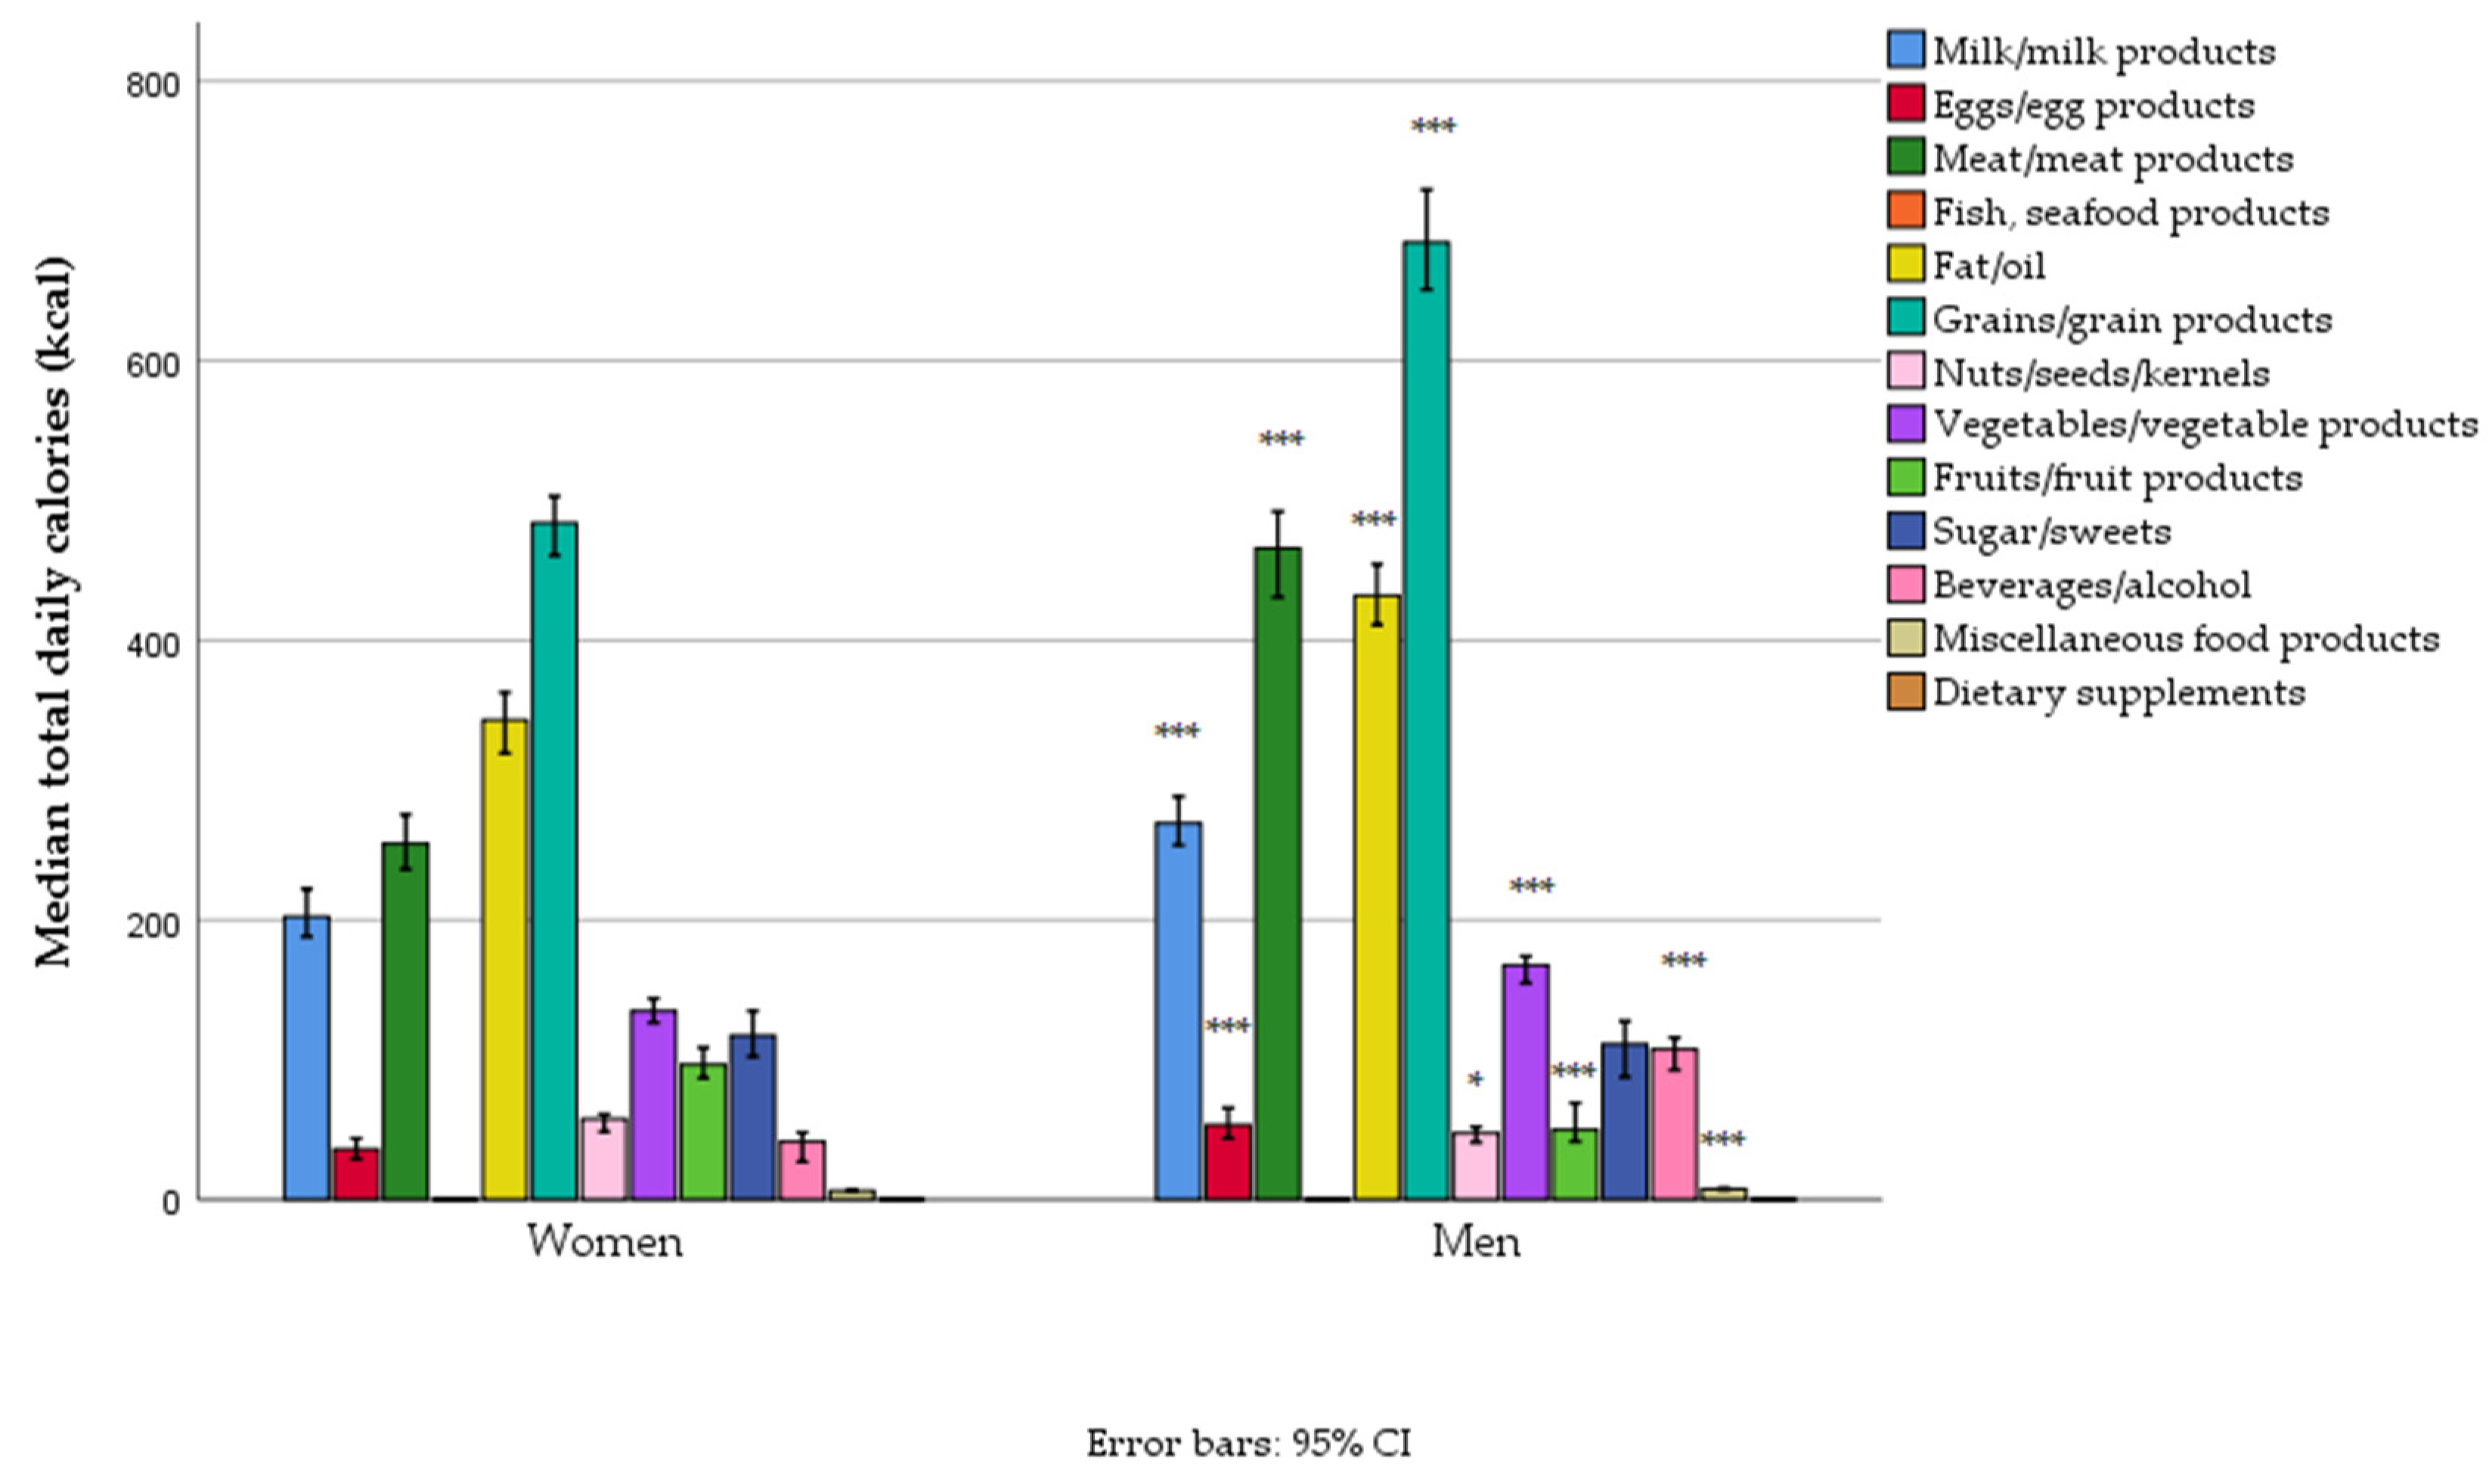
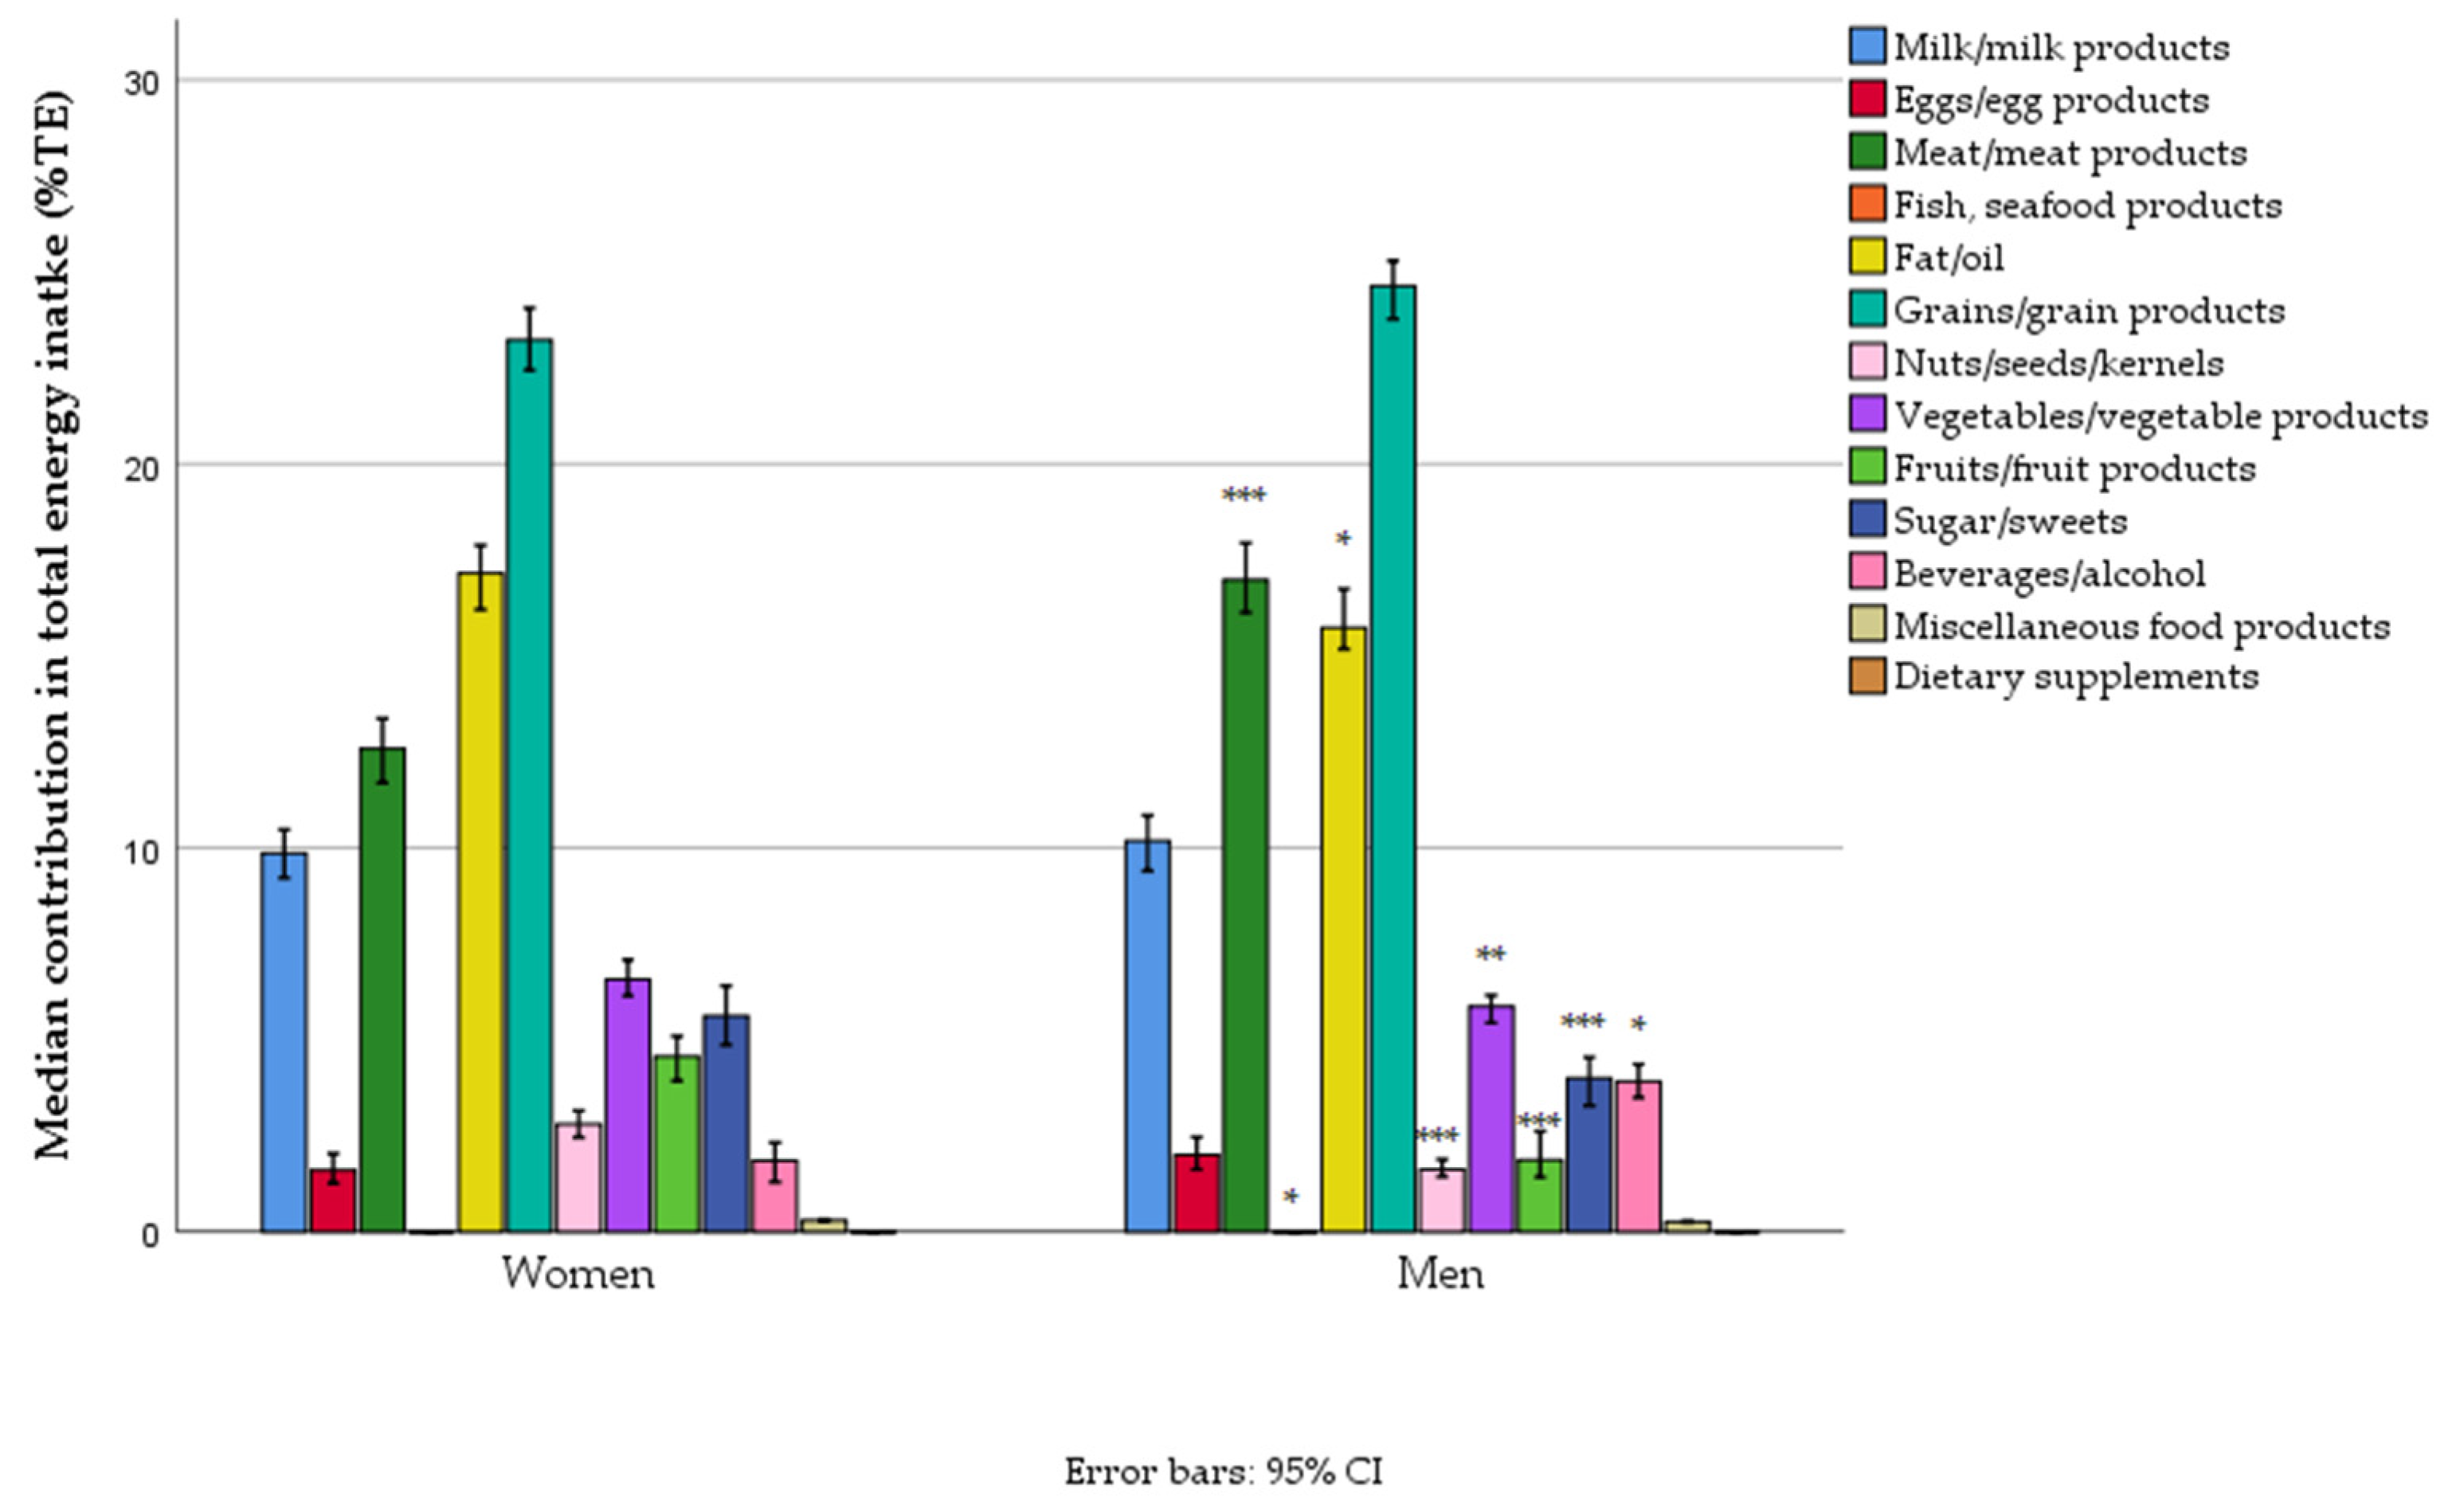
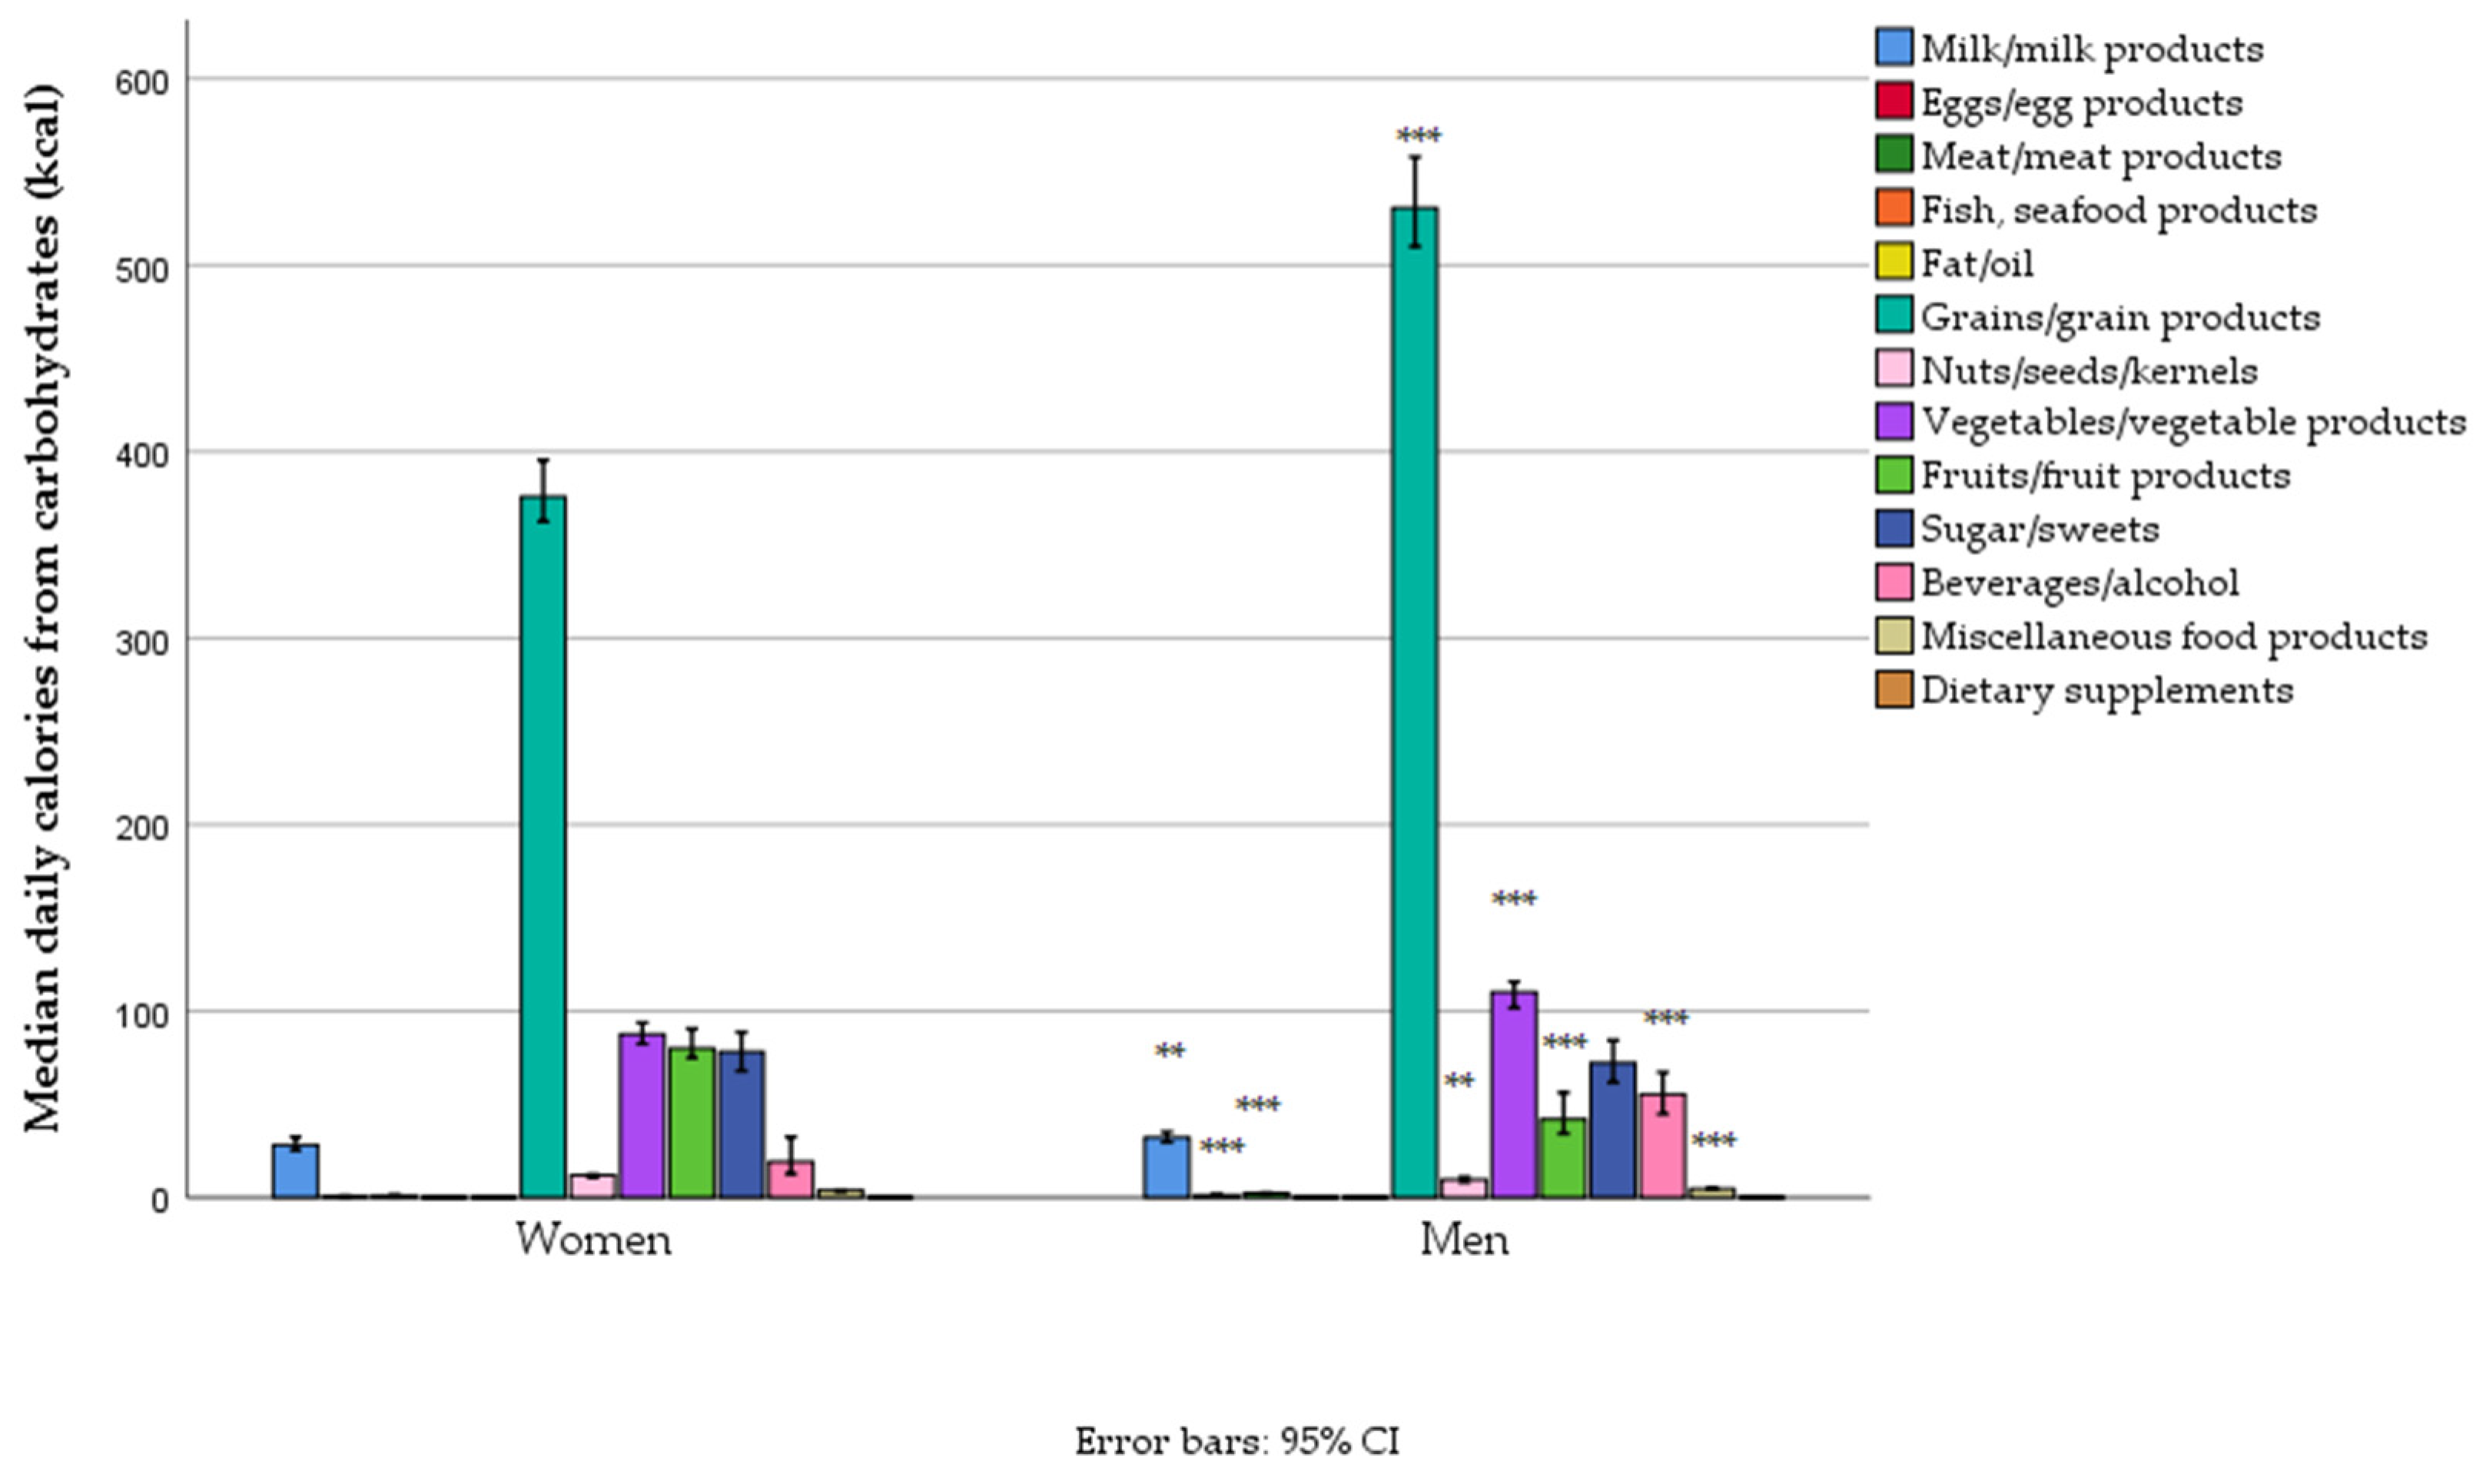
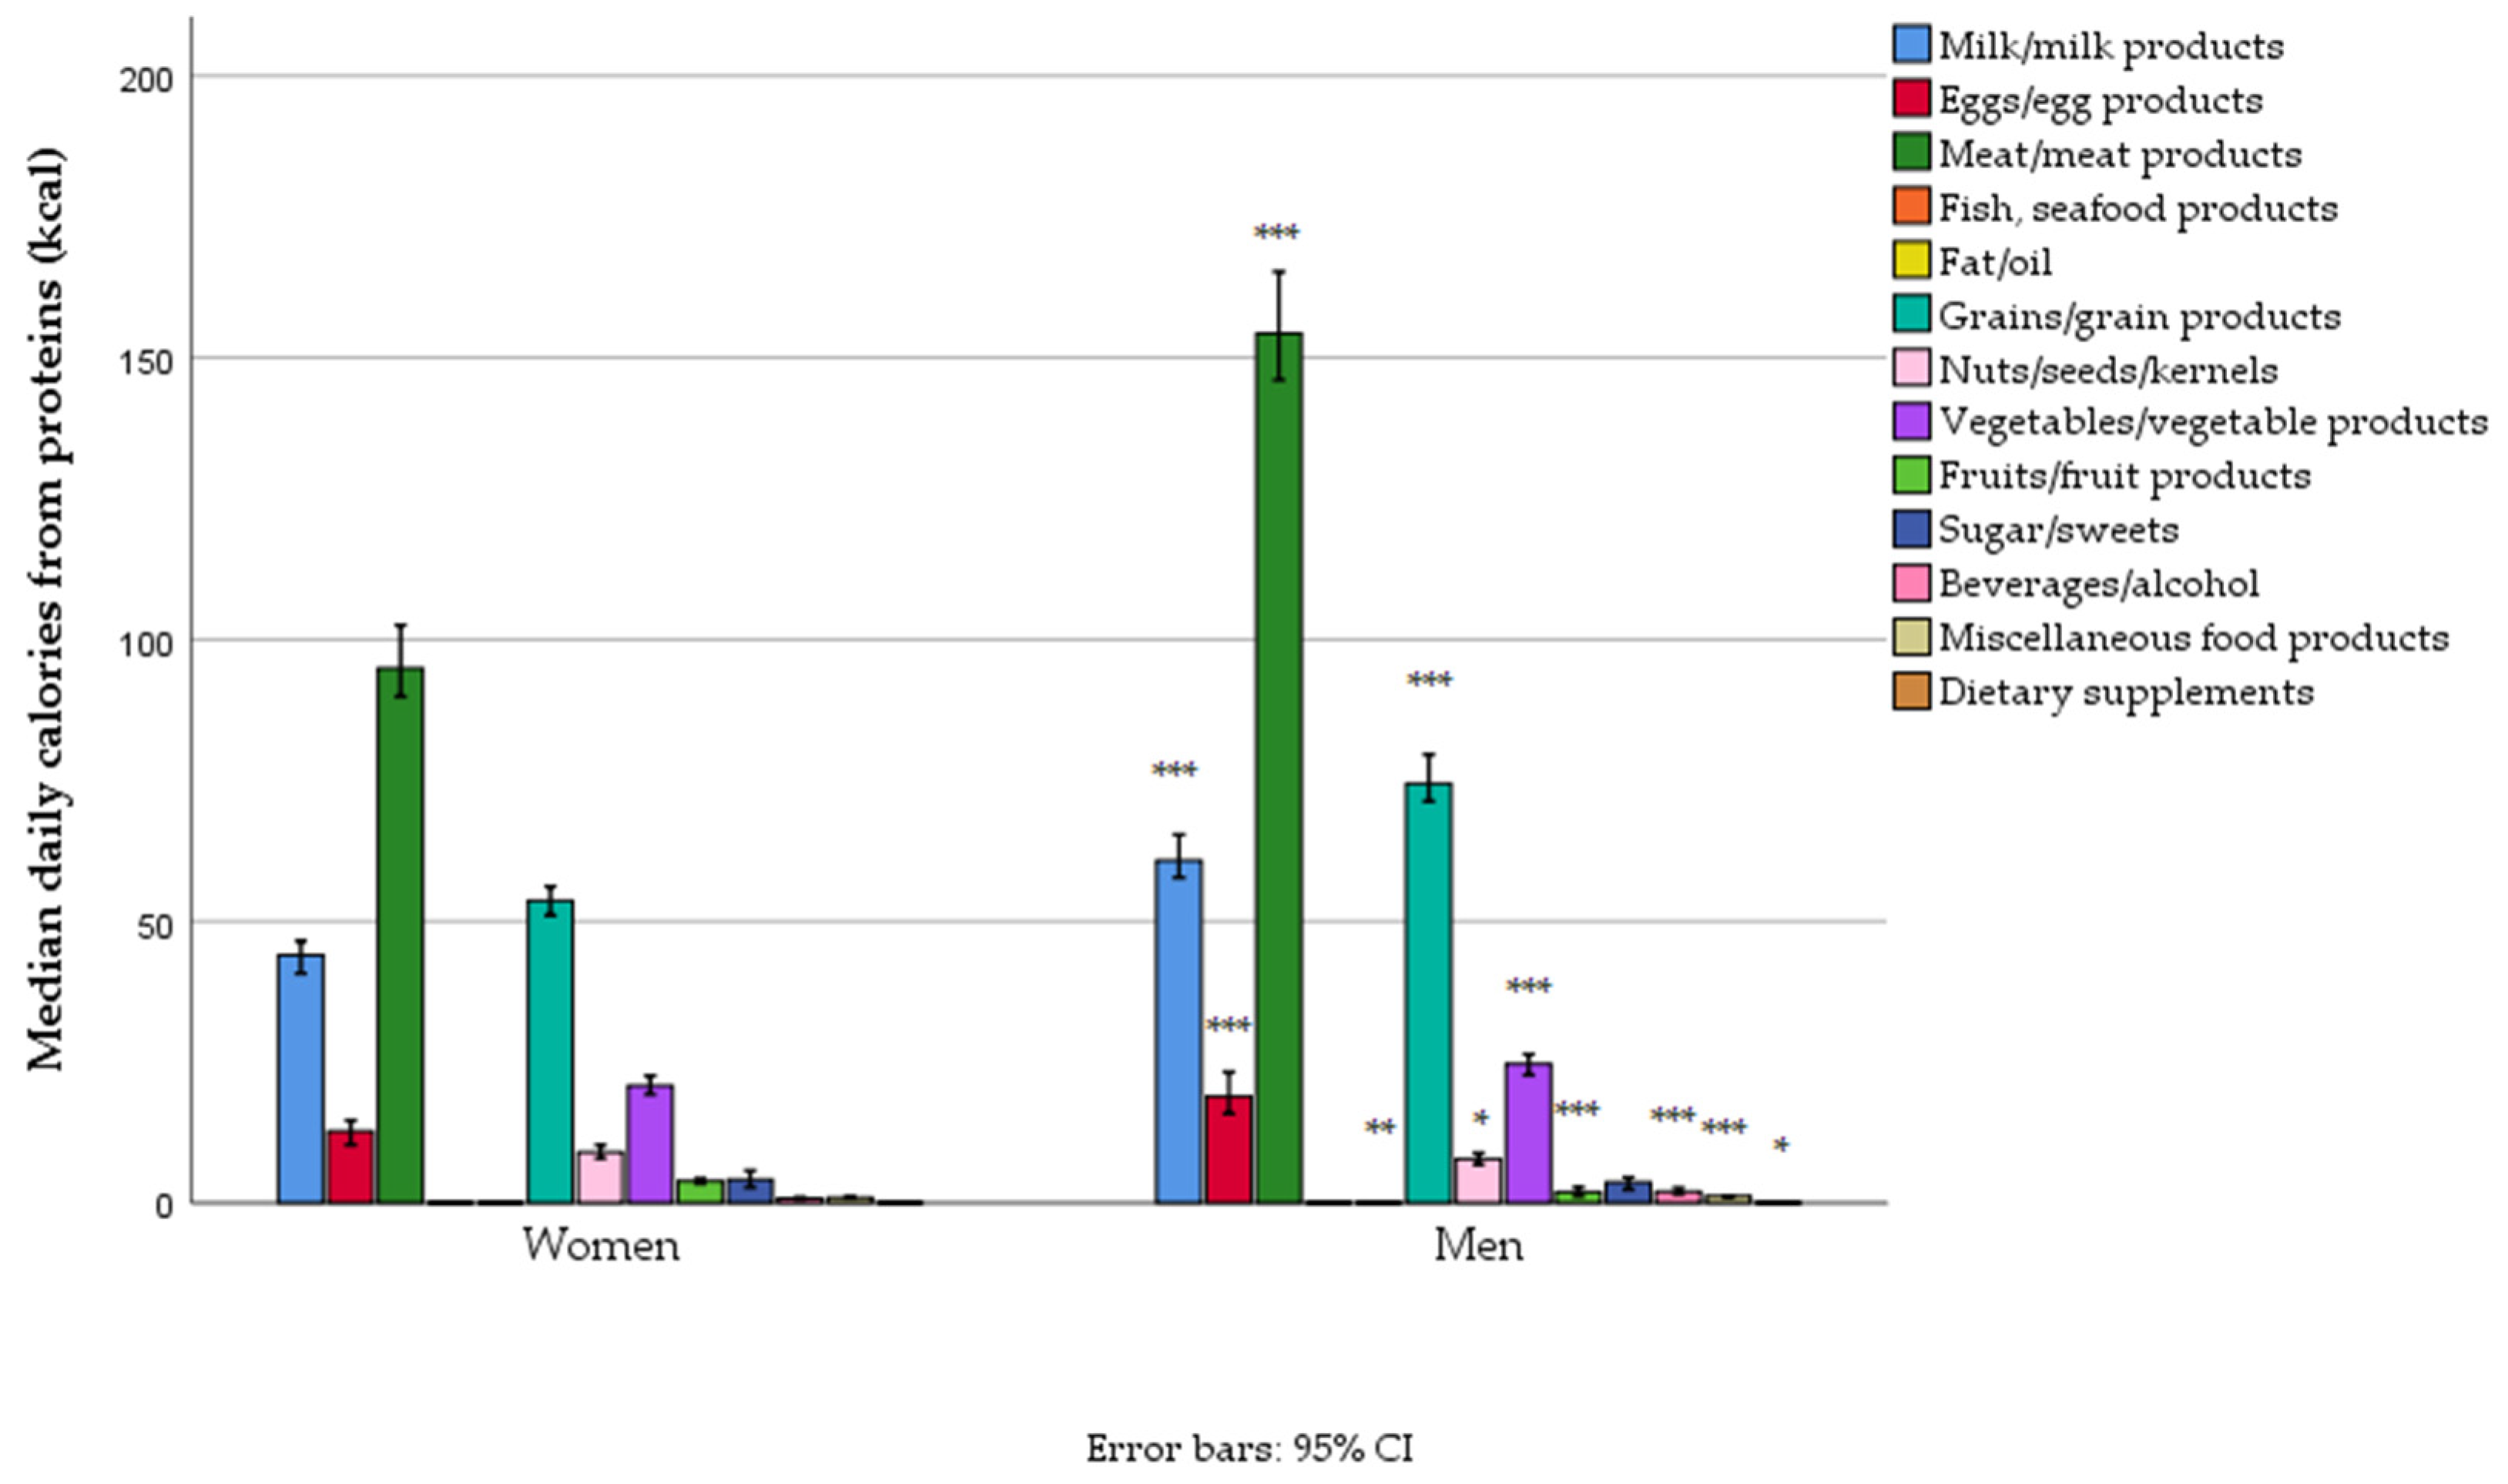
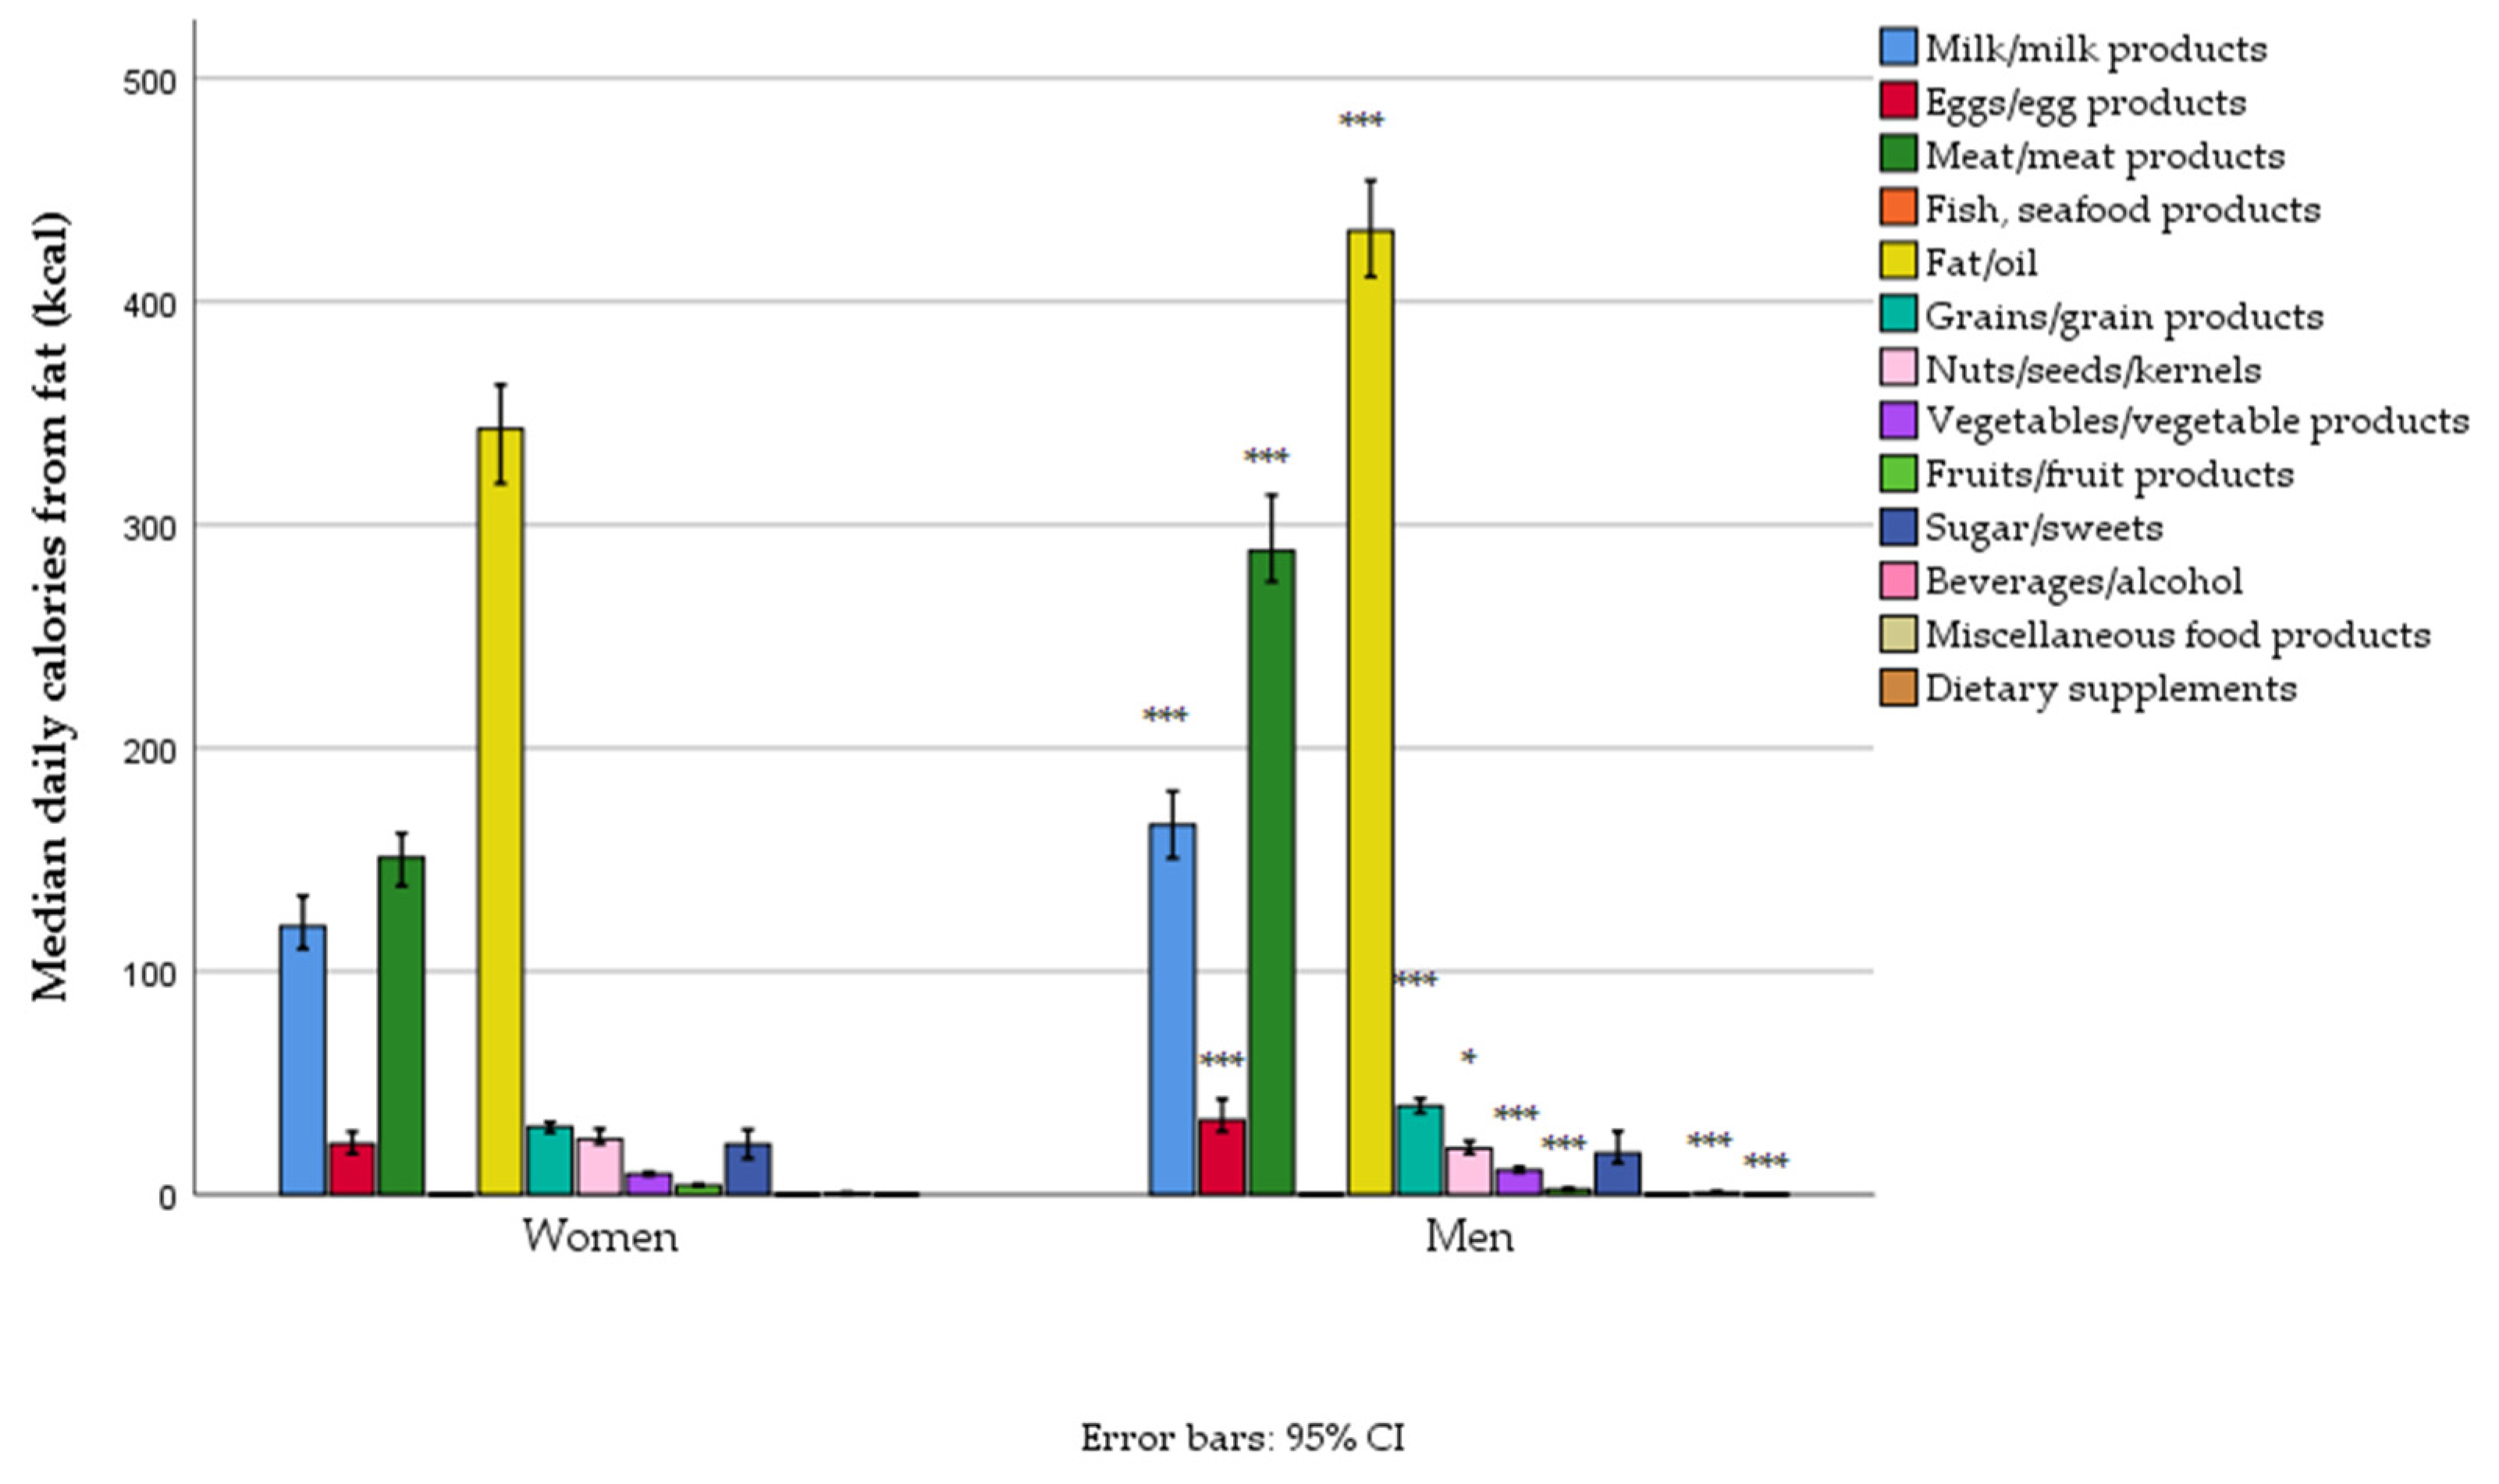
3.5. Energy and Proximates Intake by Food Groups
4. Discussion
4.1. Recommendations for Public Health Strategies to Target Gender-Specific Nutritional Challenges
4.2. Limits and Strengths
5. Conclusions
Supplementary Materials
Author Contributions
Funding
Institutional Review Board Statement
Informed Consent Statement
Data Availability Statement
Conflicts of Interest
Abbreviations
| AP | Autonomous Province |
| BMI | Body Mass Index |
| CAPNUTRA | Capacity Development in Nutrition |
| COVID-19 | Coronavirus Disease 2019 |
| CVDs | Cardiovascular Diseases |
| DALYs | Disability-Adjusted Life Years |
| DAP | Diet Assess and Plan |
| DRIs | Dietary Reference Intakes |
| DRVs | Dietary Reference Values |
| EAT-Lancet | EAT-Lancet Commission on Healthy Diets from Sustainable Food Systems |
| EFSA | European Food Safety Authority |
| EFSA EU Menu | EFSA-coordinated harmonized food consumption survey |
| EU | European Union |
| EU Menu | European Union Menu food consumption survey |
| FAO | Food and Agriculture Organization |
| FCDB | Food Composition Database |
| GBD | Global Burden of Disease |
| GDA | Guideline Daily Amount |
| GDP | Gross Domestic Product |
| IPAQ-SF | International Physical Activity Questionnaire—Short Form |
| IQR | Interquartile Range |
| ISCED | International Standard Classification of Education |
| METs | Metabolic Equivalents of the Task |
| NCDs | Non-Communicable Diseases |
| OMICS | Comprehensive study of biological molecules |
| PRI | Population Reference Intake |
| RDA | Recommended Dietary Allowances |
| SDG | Sustainable Development Goal |
| SPSS | Statistical Package for the Social Sciences |
| TE | Total Energy |
| TEI | Total Energy Intake |
| UN | United Nations |
| WHO | World Health Organization |
References
- HLPE. Food Security and Nutrition: Building a Global Narrative Towards 2030; High Level Panel of Experts on Food Security and Nutrition of the Committee on World Food Security: Rome, Italy, 2020; 112p. [Google Scholar]
- Afshin, A.; Sur, P.J.; Fay, K.A.; Cornaby, L.; Ferrara, G.; Salama, J.S.; Mullany, E.C.; Abate, K.H.; Abbafati, C.; Abebe, Z.; et al. Health Effects of Dietary Risks in 195 Countries, 1990–2017: A Systematic Analysis for the Global Burden of Disease Study 2017. Lancet 2019, 393, 1958–1972. [Google Scholar] [CrossRef] [PubMed]
- Rippin, H.L.; Hutchinson, J.; Jewell, J.; Breda, J.J.; Cade, J.E. Adult Nutrient Intakes from Current National Dietary Surveys of European Populations. Nutrients 2017, 9, 1288. [Google Scholar] [CrossRef] [PubMed]
- Mensink, G.B.M.; Fletcher, R.; Gurinovic, M.; Huybrechts, I.; Lafay, L.; Serra-Majem, L.; Szponar, L.; Tetens, I.; Verkaik-Kloosterman, J.; Baka, A.; et al. Mapping Low Intake of Micronutrients across Europe. Br. J. Nutr. 2013, 110, 755–773. [Google Scholar] [CrossRef]
- Kwong, E.J.L.; Whiting, S.; Bunge, A.C.; Leven, Y.; Breda, J.; Rakovac, I.; Cappuccio, F.P.; Wickramasinghe, K. Population Level Salt Intake in the WHO European Region in 2022: A Systematic Review. Public Health Nutr. 2022, 26, s6–s19. [Google Scholar] [CrossRef] [PubMed]
- Cangelosi, G.; Grappasonni, I.; Nguyen, C.T.T.; Acito, M.; Pantanetti, P.; Benni, A.; Petrelli, F. Mediterranean Diet (MedDiet) and Lifestyle Medicine (LM) for Support and Care of Patients with Type II Diabetes in the COVID-19 Era: A Cross-Observational Study. Acta Biomed. 2023, 94, e2023189. [Google Scholar] [CrossRef]
- Farrington, J.; Satylganova, A.; Stachenko, S.; Tello, J.; Pezzella, F.R.; Korotkova, A.; Aguire, I.Y.; Johansen, A.S.; Mantingh, F.; Corbex, M.; et al. Better Noncommunicable Disease Outcomes: Challenges and Opportunities for Health Systems. Kazakhstan Country Assessment; WHO: Geneva, Switzerland, 2018; Volume 67. [Google Scholar]
- Radević, S.; Radovanović, S.; Djonović, N.; Vukomanović, I.S.; Mihailović, N.; Janićijević, K.; Kocić, S. Socioeconomic Inequalities and Non-Communicable Diseases in Serbia: National Health Survey. Vojnosanit. Pregl. 2018, 75, 926–934. [Google Scholar] [CrossRef]
- Gurinović, M.; Nikolić, M.; Zeković, M.; Milešević, J.; Kadvan, A.; Ranić, M.; Glibetić, M. Implementation of Harmonized Food Consumption Data Collection in the Balkan Region According to the EFSA EU Menu Methodology Standards. Front. Nutr. 2022, 8, 809328. [Google Scholar] [CrossRef]
- Ioannidou, S.; Horváth, Z.; Arcella, D. Harmonised Collection of National Food Consumption Data in Europe. Food Policy 2020, 96, 101908. [Google Scholar] [CrossRef]
- Miller, V.; Singh, G.M.; Onopa, J.; Reedy, J.; Shi, P.; Zhang, J.; Tahira, A.; Shulkin Morris, M.L.; Marsden, D.P.; Kranz, S.; et al. Global Dietary Database 2017: Data Availability and Gaps on 54 Major Foods, Beverages and Nutrients Among 5.6 Million Children and Adults from 1220 Surveys Worldwide. BMJ Glob. Health 2021, 6, e003585. [Google Scholar] [CrossRef]
- EFSA. Guidance on the EU Menu Methodology. EFSA J. 2014, 12, 3944. [Google Scholar] [CrossRef]
- Gurinovic, M.; Milesevic, J.; Zekovic, M.; Kadvan, A.; Ranic, M.; Glibetic, M. Capacity Development in Food and Nutrition in Central and Eastern Europe: A Decade of Achievements. Food Policy 2020, 96, 101850. [Google Scholar] [CrossRef]
- Gurinovic, M.; Kadvan, A.; Vukotic, M. The Quality of Nutrition of Schoolchildren and Adult Members of Families. In Yugoslav Study of Atherososclerosis Precursors in Schoolchildren in Serbia: Twenty Years Follow-Up; Nedeljkovic, S., Ed.; Medical Faculty University of Belgrade: Belgrade, Serbia, 2011; pp. 343–368. [Google Scholar]
- Gurinović, M.; Kadvan, A. Methodology of the Dietary Survey in YUSAD Study. In Yugoslav Study of Atherosclerosis Precursors in Schoolchildren in Serbia: Twenty Years Follow-Up; Nedeljković, S.I., Ed.; Medical Faculty, University of Belgrade: Belgrade, Serbia, 2011; pp. 334–342. [Google Scholar]
- Gurinović, M.; Milešević, J.; Novaković, R.; Kadvan, A.; Djekić-Ivanković, M.; Šatalić, Z.; Korošec, M.; Spiroski, I.; Ranić, M.; Dupouy, E.; et al. Improving Nutrition Surveillance and Public Health Research in Central and Eastern Europe/Balkan Countries Using the Balkan Food Platform and Dietary Tools. Food Chem. 2016, 193, 173–180. [Google Scholar] [CrossRef]
- Gurinović, M.; Milešević, J.; Kadvan, A.; Nikolić, M.; Zeković, M.; Djekić-Ivanković, M.; Dupouy, E.; Finglas, P.; Glibetić, M. Development, Features and Application of DIET ASSESS & PLAN (DAP) Software in Supporting Public Health Nutrition Research in Central Eastern European Countries (CEEC). Food Chem. 2018, 238, 186–194. [Google Scholar] [CrossRef]
- Gavrieli, A.; Naska, A.; Konstantinidi, C.; Berry, R.; Roe, M.; Harvey, L.; Finglas, P.; Glibetic, M.; Gurinovic, M.; Trichopoulou, A. Dietary Monitoring Tools for Risk Assessment. EFSA Support. Publ. 2014, 11, 607E. [Google Scholar] [CrossRef]
- Zekovic, M.; Gurinovic, M.; Milesevic, J.; Kadvan, A.; Glibetic, M. National Food Consumption Survey among Children from 1 to 9 Years Old in Serbia. EFSA Support. Publ. 2021, 18, 6994E. [Google Scholar] [CrossRef]
- Zekovic, M.; Gurinovic, M.; Milesevic, J.; Kadvan, A.; Glibetic, M. National Food Consumption Survey among 10–74 Years Old Individuals in Serbia. EFSA Support. Publ. 2022, 19, 7401E. [Google Scholar] [CrossRef]
- von Elm, E.; Altman, D.G.; Egger, M.; Pocock, S.J.; Gøtzsche, P.C.; Vandenbroucke, J.P. The Strengthening the Reporting of Observational Studies in Epidemiology (STROBE) Statement: Guidelines for Reporting Observational Studies. J. Clin. Epidemiol. 2008, 61, 344–349. [Google Scholar] [CrossRef]
- Nikolić, M.; Milešević, J.; Zeković, M.; Gurinović, M.; Glibetić, M. The Development and Validation of Food Atlas for Portion Size Estimation in the Balkan Region. Front. Nutr. 2018, 5, 1–8. [Google Scholar] [CrossRef]
- Gurinović, M.; Milešević, J.; Kadvan, A.; Djekić-Ivanković, M.; Debeljak-Martačić, J.; Takić, M.; Nikolić, M.; Ranković, S.; Finglas, P.; Glibetić, M.; et al. Establishment and Advances in the Online Serbian Food and Recipe Data Base Harmonized with EuroFIRTM Standards. Food Chem. 2016, 193, 30–38. [Google Scholar] [CrossRef]
- Craig, C.L.; Marshall, A.L.; Sjöström, M.; Bauman, A.E.; Booth, M.L.; Ainsworth, B.E.; Pratt, M.; Ekelund, U.; Yngve, A.; Sallis, J.F.; et al. International Physical Activity Questionnaire: 12-Country Reliability and Validity. Med. Sci. Sports Exerc. 2003, 35, 1381–1395. [Google Scholar] [CrossRef]
- IPAQ. International Physical Activity Questionnaire. Available online: https://sites.google.com/site/theipaq/ (accessed on 16 December 2021).
- WHO. Body Mass Index (BMI). Available online: https://www.who.int/data/gho/data/themes/topics/topic-details/GHO/body-mass-index (accessed on 10 January 2025).
- EFSA. Dietary Reference Values for Nutrients Summary Report. EFSA Support. Public. 2017, 14, e15121. [Google Scholar] [CrossRef]
- 2025 Dietary Guidelines Advisory Committee. Scientific Report of the 2025 Dietary Guidelines Advisory Committee: Advisory Report to the Secretary of Health and Human Services and Secretary of Agriculture. 2024. Available online: https://www.dietaryguidelines.gov/2025-advisory-committee-report (accessed on 24 March 2025).
- FAO/WHO. What Are Healthy Diets? Joint Statement by the Food and Agriculture Organization of the United Nations and the World Health Organization; FAO/WHO: Rome, Italy; Geneva, Switzerland, 2024; ISBN 978-92-4-010187-6. [Google Scholar]
- WHO. Total Fat Intake for the Prevention of Unhealthy Weight Gain in Adults and Children; WHO: Geneva, Switzerland, 2023; ISBN 978-92-4-007365-4. [Google Scholar]
- USDA. Dietary Guidelines for Americans 2020–2025; USDA: Washington, DC, USA, 2020.
- EAT-Lancet Commission. Healthy Diet From Sustainable Food Systems Food Planet Health; EAT-Lancet Commission on Healthy Diets from Sustainable Food Systems: Stockholm, Sweden, 2019; Volume 5. [Google Scholar]
- Springmann, M.; Spajic, L.; Clark, M.A.; Poore, J.; Herforth, A.; Webb, P.; Rayner, M.; Scarborough, P. The Healthiness and Sustainability of National and Global Food Based Dietary Guidelines: Modelling Study. BMJ 2020, 370, m2322. [Google Scholar] [CrossRef] [PubMed]
- UNICEF. The State of Food Security and Nutrition in the World 2024–Financing to End, Food Insecurity and Malnutrition in All Its Forms; UNICEF: New York, NY, USA, 2024; ISBN 978-92-5-138882-2. [Google Scholar]
- United Nation. Global Nutrition Report 2021; United Nation: New York, NY, USA, 2021; ISBN 9780896295643. [Google Scholar]
- WHO Regional Office for Europe. Subregional Training on the Use of Risk Analysis in the Response to Food Safety Emergencies in the Western Balkans; Technical Report; WHO Regional Office for Europe: Belgrade, Serbia, 2022. [Google Scholar]
- Phelps, N.H.; Singleton, R.K.; Zhou, B.; Heap, R.A.; Mishra, A.; Bennett, J.E.; Paciorek, C.J.; Lhoste, V.P.; Carrillo-Larco, R.M.; Stevens, G.A.; et al. Worldwide Trends in Underweight and Obesity from 1990 to 2022: A Pooled Analysis of 3663 Population-Representative Studies with 222 Million Children, Adolescents, and Adults. Lancet 2024, 403, 1027–1050. [Google Scholar] [CrossRef]
- Spiroski, I.; Nikolić, M.; Kochubovski, M.; Gurinović, M.; Ristovska, G.; Kadvan, A. Energy, Macronutrients and Dietary Fibre Intake among Adults in North Macedonia. Cent. Eur. J. Public Health 2020, 28, 24–32. [Google Scholar] [CrossRef]
- Gregoric, M.; Hristov, H.; Blaznik, U.; Koroušic Seljak, B.; Delfar, N.; Pravst, I. Dietary Intakes of Slovenian Adults and Elderly: Design and Results of the National Dietary Study SI.Menu 2017/18. Nutrients 2022, 14, 3618. [Google Scholar] [CrossRef]
- Sto´s, K.; Rychlik, E.; Wo´zniak, A.; Ołtarzewski, M.; Jankowski, M.; Gujski, M.; Juszczyk, G. Prevalence and Sociodemographic Factors Associated with Overweight and Obesity among Adults in Poland: A 2019/2020 Nationwide Cross-Sectional Survey. Int. J. Environ. Res. Public Health Artic. 2022, 19, 1502. [Google Scholar] [CrossRef]
- van Berleere, M.; Dauchet, L. 13-Fruits, Vegetables, and Health: Evidence From Meta-Analyses of Prospective Epidemiological Studies. In Vegetarian and Plant-Based Diets in Health and Disease Prevention; Academic Press: Cambridge, MA, USA, 2017; pp. 215–248. [Google Scholar]
- WHO/FAO Joint Expert Consultation. Diet, Nutrition and the Prevention of Chronic Diseases; WHO: Geneva, Switzerland, 2003. [Google Scholar]
- Mistura, L.; Le, C.; Addezio, L.D.; Ferrari, M.; Javier, F.; Piccinelli, R.; Martone, D.; Sette, S.; Catasta, G.; Turrini, A.; et al. Nutrition, Metabolism and Cardiovascular Diseases The Italian IV SCAI Dietary Survey: Main Results on Food Consumption. Nutr. Metab. Cardiovasc. Dis. 2025, 103863. [Google Scholar] [CrossRef]
- Gicevic, S.; Gaskins, A.J.; Fung, T.T.; Rosner, B.; Sabanovic, E.; Milesevic, J.; Kadvan, A.; Kremic, E.; Willett, W. Demographic and Socio-Economic Predictors of Diet Quality among Adults in Bosnia and Herzegovina. Public Health Nutr. 2019, 22, 3107–3117. [Google Scholar] [CrossRef]
- Mertens, E.; Kuijsten, A.; Dofková, M.; Mistura, L.; D’Addezio, L.; Turrini, A.; Dubuisson, C.; Favret, S.; Havard, S.; Trolle, E.; et al. Geographic and Socioeconomic Diversity of Food and Nutrient Intakes: A Comparison of Four European Countries. Eur. J. Nutr. 2019, 58, 1475–1493. [Google Scholar] [CrossRef]
- Singh, B.K.; Arnold, T.; Biermayr-Jenzano, P.; Broerse, J.; Brunori, G.; Caron, P.; De Schutter, O.; Fan, S.; Fanzo, J.; Fraser, E.; et al. Enhancing Science–Policy Interfaces for Food Systems Transformation. Nat. Food 2021, 2, 838–842. [Google Scholar] [CrossRef]
- Koroušić, B.; Valenčić, E.; Kušar, A.; Žmitek, K.; Korošec, M. Inadequate Intake of Dietary Fibre in Adolescents, Adults, and Elderlies: Results of Slovenian Representative SI. Menu Study. Nutrients 2021, 13, 3826. [Google Scholar] [CrossRef] [PubMed]
- FAO; WHO. Sustainable Healthy Diets-Guiding Principles; FAO: Rome, Italy, 2019; ISBN 978-92-5-131875-1/978-92-4-151664-8. [Google Scholar]
- Hobbs-Grimmer, D.A.; Givens, D.I.; Lovegrove, J.A. Associations between Red Meat, Processed Red Meat and Total Red and Processed Red Meat Consumption, Nutritional Adequacy and Markers of Health and Cardio-Metabolic Diseases in British Adults: A Cross-Sectional Analysis Using Data from UK National Diet and Nutrition Survey. Eur. J. Nutr. 2021, 60, 2979–2997. [Google Scholar] [CrossRef] [PubMed]
- Lescinsky, H.; Afshin, A.; Ashbaugh, C.; Bisignano, C.; Brauer, M.; Ferrara, G.; Hay, S.I.; He, J.; Iannucci, V.; Marczak, L.B.; et al. Health Effects Associated with Consumption of Unprocessed Red Meat: A Burden of Proof Study. Nat. Med. 2022, 28, 2075–2082. [Google Scholar] [CrossRef] [PubMed]
- Cancer: Carcinogenicity of the Consumption of Red Meat and Processed Meat. Available online: https://www.who.int/news-room/questions-and-answers/item/cancer-carcinogenicity-of-the-consumption-of-red-meat-and-processed-meat (accessed on 31 January 2025).
- Ipsos. An Exploration into Diets Around the World. Available online: https://www.ipsos.com/sites/default/files/ct/news/documents/2018-09/an_exploration_into_diets_around_the_world.pdf (accessed on 31 January 2025).
- Miller, V.; Reedy, J.; Cudhea, F.; Zhang, J.; Shi, P.; Erndt-Marino, J.; Coates, J.; Micha, R.; Webb, P.; Mozaffarian, D.; et al. Global, Regional, and National Consumption of Animal-Source Foods between 1990 and 2018: Findings from the Global Dietary Database. Lancet Planet. Health 2022, 6, e243–e256. [Google Scholar] [CrossRef]
- Klapp, A.L.; Wyma, N.; Alessandrini, R.; Ndinda, C.; Perez-Cueto, A.; Risius, A. Recommendations to Address the Shortfalls of the EAT–Lancet Planetary Health Diet from a Plant-Forward Perspective. Lancet Planet. Health 2025, 9, e23–e33. [Google Scholar] [CrossRef]
- Verschuren, W.M.M.; Boer, J.M.A.; Temme, E.H.M. Optimal Diet for Cardiovascular and Planetary Health. Heart 2022, 108, 1234–1239. [Google Scholar] [CrossRef]
- Schwingshackl, L.; Heseker, H.; Kiesswetter, E.; Koletzko, B. Reprint of: Dietary Fat and Fatty Foods in the Prevention of Non-Communicable Diseases: A Review of the Evidence. Trends Food Sci. Technol. 2022, 130, 20–31. [Google Scholar] [CrossRef]
- Rippin, H.L.; Hutchinson, J.; Jewell, J.; Breda, J.J.; Cade, J.E. Assessing Diet in European Populations Using National Dietary Surveys. Proc. Nutr. Soc. 2020, 79, 531–541. [Google Scholar]
- Poggioli, R.; Hirani, K.; Jogani, V.G.; Ricordi, C. Modulation of Inflammation and Immunity by Omega-3 Fatty Acids: A Possible Role for Prevention and to Halt Disease Progression in Autoimmune, Viral, and Age-Related Disorders. Eur. Rev. Med. Pharmacol. Sci. 2023, 27, 7380–7400. [Google Scholar] [CrossRef]
- Simopoulos, A.P. The Importance of the Ratio of Omega-6/Omega-3 Essential Fatty Acids. Biomed. Pharmacother. 2002, 56, 365–379. [Google Scholar] [CrossRef]
- Šarac, I.; Debeljak-Martačić, J.; Takić, M.; Stevanović, V.; Milešević, J.; Zeković, M.; Popović, T.; Jovanović, J.; Vidović, N.K. Associations of Fatty Acids Composition and Estimated Desaturase Activities in Erythrocyte Phospholipids with Biochemical and Clinical Indicators of Cardiometabolic Risk in Non-Diabetic Serbian Women: The Role of Level of Adiposity. Front. Nutr. 2023, 10, 1065578. [Google Scholar] [CrossRef]
- Takić, M.; Ranković, S.; Girek, Z.; Pavlović, S.; Jovanović, P.; Jovanović, V.; Šarac, I. Current Insights into the Effects of Dietary α-Linolenic Acid Focusing on Alterations of Polyunsaturated Fatty Acid Profiles in Metabolic Syndrome. Int. J. Mol. Sci. 2024, 25, 4909. [Google Scholar] [CrossRef] [PubMed]
- Hooper, L.; Martin, N.; Abdelhamid, A.; Davey Smith, G. Reduction in Saturated Fat Intake for Cardiovascular Disease. Cochrane Database Syst. Rev. 2015, 5, CD011737. [Google Scholar] [CrossRef]
- Maki, K.C.; Dicklin, M.R.; Kirkpatrick, C.F. Saturated Fats and Cardiovascular Health: Current Evidence and Controversies. J. Clin. Lipidol. 2021, 15, 765–772. [Google Scholar] [CrossRef]
- Stender, S. Trans Fat in Foods in Iran, South-Eastern Europe, Caucasia and Central Asia: A Market Basket Investigation. Food Policy 2020, 96, 101877. [Google Scholar] [CrossRef]
- Poppitt, S.D. Cow’s Milk and Dairy Consumption: Is There Now Consensus for Cardiometabolic Health? Front. Nutr. 2020, 7, 574725. [Google Scholar] [CrossRef]
- Gómez-Cortés, P.; Juárez, M.; de la Fuente, M.A. Milk Fatty Acids and Potential Health Benefits: An Updated Vision. Trends Food Sci. Technol. 2018, 81, 1–9. [Google Scholar] [CrossRef]
- Molina-Montes, E.; Uzhova, I.; Verardo, V.; Artacho, R.; García-Villanova, B.; Jesús Guerra-Hernández, E.; Kapsokefalou, M.; Malisova, O.; Vlassopoulos, A.; Katidi, A.; et al. Impact of COVID-19 Confinement on Eating Behaviours Across 16 European Countries: The COVIDiet Cross-National Study. Food Qual. Prefer. 2021, 93, 104231. [Google Scholar] [CrossRef]
- Institute of Public Health of Serbia. The 2019 Serbian National Health Survey; Milić, N., Stanisavljević, D., Krstić, M., Eds.; OMNIA BGD: Belgrade, Serbia, 2021; ISBN 978-86-903192-0-6. [Google Scholar]
- Herrero, M.; Hugas, M.; Lele, U.; Wirakartakusumah, A.; Torero, M. A Shift to Healthy and Sustainable Consumption Patterns. In Science and Innovations for Food Systems Transformation; von Braun, J., Fresco, L.O., Afsana, K., Hassan, M.H.A., Eds.; Springer Nature: Cham, Switzerland, 2023; pp. 59–86. [Google Scholar]
- Timic, J.B.; Kotur-Stevuljevic, J.; Boeing, H.; Krajnovic, D.; Djordjevic, B.; Sobajic, S. A Cross-Sectional Survey of Salty Snack Consumption among Serbian Urban-Living Students and Their Contribution to Salt Intake. Nutrients 2020, 12, 3290. [Google Scholar] [CrossRef]
- Gurinović, M.; Zeković, M.; Milešević, J.; Nikolić, M.; Glibetić, M. Nutritional Assessment. Encycl. Biodivers. 2016, 5, 195–211. [Google Scholar] [CrossRef]
- Karageorgou, D.; Lara Castor, L.; Padula De Quadros, V.; Ferreira De Sousa, R.; Holmes, B.A.; Ioannidou, S.; Mozaffarian, D.; Micha, R. Harmonising Dietary Datasets for Global Surveillance: Methods and Findings from the Global Dietary Database. Public Health Nutr. 2024, 27, 1–18. [Google Scholar] [CrossRef]
- Fang, C.; Gurinović, M. Sustainable and Nutrition-Sensitive Food Systems for Healthy Diets and Prevention of Malnutrition in Europe and Central Asia; Fang, C., Gurinović, M., Eds.; FAO: Budapest, Hungary, 2023; ISBN 9789251375341. [Google Scholar]
- Gurinovic, M.; Milesevic, J.; Zekovic, M.; Glibetic, M.; Nikolic, M.; Jehle, R.; Dupouy, E.; Cheng, F.; Obara, K.; Ranic, M.; et al. Challenges and Opportunities to Support Food Systems Transformations for Healthier Diets in Central and South-Eastern Europe. In Sustainable and Nutrition-Sensitive Food Systems for Healthy Diets and Prevention of Malnutrition in Europe and Central Asia; Cheng, F., Gurinovic, M., Eds.; FAO: Budapest, Hungary, 2022; pp. 1–44. [Google Scholar]
- Singh, B.K.; Fraser, E.D.G.; Arnold, T.; Biermayr-Jenzano, P.; Broerse, J.E.W.; Brunori, G.; Caron, P.; De Schutter, O.; Fabbri, K.; Fan, S.; et al. Food Systems Transformation Requires Science–Policy–Society Interfaces That Integrate Existing Global Networks and New Knowledge Hubs. Nat. Food 2022, 4, 1–3. [Google Scholar] [CrossRef]
- SCAR. Sustainable Food Systems Partnership for People, Planet and Climate. Strategic Research and Innovation Agenda (SRIA). 2023. Available online: https://scar-europe.org/images/FOOD/Main_actions/SFS_Partnership_SRIA_31012023.pdf (accessed on 24 March 2025).

| Variable | Total Sample n = 1139 | Women n = 576 | Men n = 563 | p |
|---|---|---|---|---|
| Response rate, % | 80.7 | 81.8 | 79.5 | |
| Age, years, median (IQR) | 42 (29–52) | 43.0 (29–52) | 41 (29–51) | 0.351 |
| Age group, n (%) | 0.549 | |||
| 18–24 years | 149 (13.1%) | 72 (12.5%) | 77 (13.7%) | |
| 25–44 years | 468 (41.1%) | 231 (40.1%) | 237 (42.1%) | |
| 45–64 years | 522 (45.8%) | 273 (47.4%) | 249 (44.2%) | |
| Distribution per geographical region, n (%) | 0.912 | |||
| Belgrade (capital city) region | 270 (23.7%) | 141 (24.5%) | 129 (22.9%) | |
| Vojvodina region | 307 (27.0%) | 156 (27.1%) | 151 (26.8%) | |
| Region of Šumadija and Western Serbia | 320 (28.1%) | 160 (27.8%) | 160 (28.4%) | |
| Southeastern Serbia region | 242 (21.2%) | 119 (20.7%) | 123 (21.8%) | |
| Settlement type, n (%) | 0.527 | |||
| Urban | 975 (85.6%) | 496 (86.1%) | 479 (85.1%) | |
| Rural | 164 (14.4%) | 80 (13.9%) | 84 (14.9%) | |
| Ethnicity, n (%) | 0.991 | |||
| Serbian | 1060 (93.1%) | 536 (93.1%) | 524 (93.1%) | |
| Other | 79 (6.9%) | 40 (6.9%) | 39 (6.9%) | |
| Religion, n (%) | 0.803 | |||
| Orthodox | 1025 (90.0%) | 517 (89.8%) | 508 (90.2%) | |
| Catholic | 36 (3.2%) | 21 (3.6%) | 15 (2.7%) | |
| Islamic | 14 (1.2%) | 7 (1.2%) | 7 (1.2%) | |
| Other | 64 (5.6%) | 31 (5.4%) | 33 (5.9%) | |
| Marital status, n (%) | 0.004 ** | |||
| Single | 378 (33.2%) | 173 (30.0%) | 205 (36.4%) | |
| Married | 602 (52.9%) | 304 (52.8%) | 298 (52.9%) | |
| Divorced | 57 (5.0%) | 36 (6.2%) | 21 (3.7%) | |
| Separated | 21 (1.8%) | 11 (1.9%) | 10 (1.8%) | |
| Single parent | 1 (0.1%) | 0 (0.0%) | 1 (0.2%) | |
| Widowed | 36 (3.2%) | 28 (4.9%) | 8 (1.4%) | |
| Other | 44 (3.9%) | 24 (4.2%) | 20 (3.6%) | |
| Household size and composition, median (IQR) | ||||
| People per household | 30 (2–4) | 3 (2–4) | 3 (2–4) | 0.826 |
| Highest level of formal education, n (%) | 0.007 ** | |||
| ISCED 0: less than primary educational attainment | 7 (0.6%) | 4 (0.7%) | 3 (0.5%) | |
| ISCED 1: Primary education | 30 (2.6%) | 17 (3.0%) | 13 (2.3%) | |
| ISCED 2: Lower secondary education | 46 (4.0%) | 15 (2.6%) | 31 (5.5%) | |
| ISCED 3: Upper secondary education | 476 (41.8%) | 233 (40.5%) | 243 (43.2%) | |
| ISCED 4/5: Post-secondary/Short-cycle tertiary education | 73 (6.4%) | 29 (5.0%) | 44 (7.8%) | |
| ISCED 6: Bachelor’s or equivalent level | 359 (31.5%) | 187 (32.5%) | 172 (30.6%) | |
| ISCED 7/8: Master’s/Doctoral or equivalent level | 148 (13.0%) | 91 (15.8%) | 57 (10.1%) | |
| Employment status, n (%) | <0.001 *** | |||
| Unemployed | 81 (7.1%) | 41 (7.1%) | 40 (7.1%) | |
| Working for pay or profit | 812 (71.3%) | 382 (66.3%) | 430 (76.4%) | |
| Pupil, student, further training, unpaid work experience | 133 (11.7%) | 77 (13.4%) | 56 (9.9%) | |
| In retirement or early retirement or has given up business | 59 (5.2%) | 40 (6.9%) | 19 (3.4%) | |
| Maternity, parental, or sick leave | 9 (0.8%) | 8 (1.4%) | 1 (0.2%) | |
| Permanently disabled | 4 (0.4%) | 2 (0.3%) | 2 (0.4%) | |
| Fulfilling domestic tasks | 16 (1.4%) | 15 (2.6%) | 1 (0.2%) | |
| Not applicable/Other | 25 (2.2%) | 11 (1.9%) | 14 (2.5%) | |
| Professional profile, n (%) | ||||
| Managers | 92 (8.1%) | 38 (6.6%) | 54 (9.6%) | <0.001 *** |
| Professionals | 253 (22.2%) | 132 (22.9%) | 121 (21.5%) | |
| Technicians and associate professionals | 134 (11.8%) | 58 (10.1%) | 76 (13.5%) | |
| Clerical support workers | 114 (10.0%) | 91 (15.8%) | 23 (4.1%) | |
| Service and sales workers | 108 (9.5%) | 52 (9.0%) | 56 (9.9%) | |
| Skilled agricultural, forestry, and fishery workers | 7 (0.6%) | 3 (0.5%) | 4 (0.7%) | |
| Craft and related trades workers | 55 (4.8%) | 19 (3.3%) | 36 (6.4%) | |
| Plant and machine operators, and assemblers | 35 (3.1%) | 3 (0.5%) | 32 (5.7%) | |
| Elementary occupations | 10 (0.9%) | 1 (0.2%) | 9 (1.6%) | |
| Armed forces occupations | 41 (3.6%) | 12 (2.1%) | 29 (5.2%) | |
| Other | 289 (25.4%) | 167 (29.0%) | 122 (21.5%) | |
| Suffer from chronic illness, n (%) | ||||
| No | 859 (75.4%) | 400 (69.4%) | 459 (81.5%) | <0.001 *** |
| Yes: | 280 (24.6%) | 176 (30.6%) | 104 (18.5%) | |
| Neoplasms | 6 (0.5%) | 5 (0.9%) | 1 (0.2%) | |
| Diseases of the blood-forming organs and immune system | 11 (1.0%) | 8 (1.4%) | 3 (0.5%) | 0.218 |
| Endocrine, nutritional, and metabolic diseases | 92 (8.1%) | 74 (12.8%) | 18 (3.2%) | 0.225 |
| Mental and behavioral disorders | 11 (1.0%) | 4 (0.7%) | 7 (1.2%) | <0.001 *** |
| Diseases of the nervous system | 8 (0.7%) | 7 (1.2%) | 1 (0.2%) | 0.380 |
| Diseases of the circulatory system | 150 (13.2%) | 85 (14.8%) | 65 (11.5%) | 0.069 |
| Diseases of the respiratory system | 35 (3.1%) | 22 (3.8%) | 13 (2.3%) | 0.109 |
| Diseases of the digestive system | 22 (1.9%) | 11 (1.9%) | 11 (2.0%) | 0.140 |
| Diseases of the skin and subcutaneous tissue | 4 (0.4%) | 3 (0.5%) | 1 (0.2%) | 0.957 |
| Diseases of the musculoskeletal system and connective tissue | 19 (1.7%) | 16 (2.8%) | 3 (0.5%) | 0.624 |
| Diseases of the genitourinary system | 13 (1.1%) | 11 (1.9%) | 2 (0.4%) | 0.004 ** |
| Other | 3 (0.3%) | 2 (0.3%) | 1 (0.2%) | 0.022 * |
| Taking chronic medications, n (%) | 1.000 | |||
| No | 897 (78.8%) | 420 (72.9%) | 477 (84.7%) | <0.001 *** |
| Yes | 242 (21.2%) | 156 (27.1%) | 86 (15.3%) | |
| Smoking status, n (%) | ||||
| Current smoker | 358 (31.4%) | 176 (30.6%) | 182 (32.3%) | 0.385 |
| Former smoker | 178 (15.6%) | 84 (14.6%) | 94 (16.7%) | |
| Never smoker | 603 (52.9%) | 316 (54.9%) | 287 (51.0%) | |
| Physical activity level, n (%) | ||||
| Low | 444 (39.0%) | 198 (34.4%) | 246 (43.7%) | <0.001 *** |
| Medium | 567 (49.8%) | 321 (55.7%) | 246 (43.7%) | |
| High | 128 (11.2%) | 57 (9.9%) | 71 (12.6%) | |
| Physical activity METS, min/week, median (IQR) | 3756 (1746–7284) | 3383 (1668–6703) | 4185 (1851–7866) | |
| Dietary pattern, n (%) | 0.006 ** | |||
| Conventional | 1074 (94.3) | 528 (91.7) | 546 (96.9) | 0.004 ** |
| Diet linked to health conditions (e.g., celiac disease, allergy, diabetes, obesity) | 65.0 (5.7) | 48 (8.3) | 17 (3.0) | |
| Season, n (%) | ||||
| Fall | 290 (25.5%) | 149 (25.9%) | 141 (25.0%) | 0.983 |
| Spring | 285 (25.0%) | 143 (24.8%) | 142 (25.2%) | |
| Summer | 283 (24.8%) | 144 (25.0%) | 139 (24.7%) | |
| Winter | 281 (24.7%) | 140 (24.3%) | 141 (25.0%) |
| Anthropometric Indicators | Total | Women | Men | p |
|---|---|---|---|---|
| Median (IQR) | Median (IQR) | Median (IQR) | ||
| Body height (cm) | 174 (167–180) | 168 (164–172) | 180 (176–186) | <0.001 * |
| Body mass (kg) | 75 (64–87) | 65 (59–74) | 85 (77–94) | <0.001 * |
| BMI (kg/m2) | 24.8 (22.2–27.8) | 23.1 (21.0–26.1) | 25.9 (23.7–28.6) | <0.001 * |
| Nutritional status | n (%) | n (%) | n (%) | |
| Underweight (<18 kg/m2) | 29 (2.5%) | 21 (3.6%) | 8 (1.4%) | <0.001 * |
| Normal weight (18–24 kg/m2) | 574 (50.4%) | 366 (63.5%) | 208 (36.9%) | |
| Overweight (25–30 kg/m2) | 401 (35.2%) | 136 (23.6%) | 265 (47.1%) | |
| Obese (>30 kg/m2) | 135 (11.9%) | 53 (9.2%) | 82 (14.6%) |
| Proximate Daily Intake | Total | Women | Men | p |
|---|---|---|---|---|
| Median (IQR) | Median (IQR) | Median (IQR) | ||
| Total energy (kcal) | 2373.0 (1896.0–3013.0) | 2069.5 (1683.8–2439.0) | 2800.0 (2293.0–3367.0) | <0.001 *** |
| Carbohydrates (g) | 218.2 (168.2–274.3) | 194.8 (150.5–241.8) | 247.2 (191.9–309.5) | <0.001 *** |
| Carbohydrates (kcal) | 872.8 (673.0–1097.2) | 779.1 (601.8–967.0) | 988.7 (767.6–1238.0) | <0.001 *** |
| Carbohydrates (%TE) | 37.1 (31.9–41.9) | 38.2 (33.0–43.3) | 36.0 (30.6–40.7) | <0.001 *** |
| Protein (g) | 87.7 (69.7–110.8) | 74.1 (61.4–90.1) | 104.6 (83.2–129.5) | <0.001 *** |
| Protein (kcal) | 350.9 (278.9–443.2) | 296.2 (245.6–360.5) | 418.6 (332.7–518.1) | <0.001 *** |
| Protein (%TE) | 14.6 (12.8–16.8) | 14.3 (12.5–16.6) | 14.9 (13.0–17.0) | 0.001 ** |
| Protein (g/kg body mass) | 1.2 (0.9–1.5) | 1.1 (0.9–1.4) | 1.2 (1.0–1.6) | <0.001 *** |
| Protein intake categories 1, n (%) | 0.003 ** | |||
| <0.83 g/kg body mass | 196 (17.2%) | 118 (20.5%) | 78 (13.9%) | |
| ≥0.83 g/kg body mass | 943 (82.8%) | 458 (79.5%) | 485 (86.1%) | |
| Fat (g) | 117.7 (88.5–152.2) | 99.2 (78.2–126.1) | 139.3 (109.4–167.0) | <0.001 *** |
| Fat (kcal) | 1059.6 (796.5–1369.3) | 892.7 (704.0–1135.0) | 1254.1 (984.3–1520.7) | <0.001 *** |
| Fat (%TE) | 44.7 (40.0–49.3) | 44.4 (39.2–48.8) | 45.3 (40.8–49.7) | 0.011 * |
| Alcohol (g) | 0.01 (0.0–8.2) | 0.01 (0.00–0.07) | 0.03 (0.00–13.68) | <0.001 *** |
| Alcohol (kcal) | 0.00 (0.0–2.1) | 0.00 (0.00–0.03) | 0.01 (0.00–3.40) | <0.001 *** |
| Alcohol (%TE) | 0.07 (0.0–59.0) | 0.04 (0.00–0.52) | 0.24 (0.00–98.50) | <0.001 *** |
| Fiber (g) | 20.7 (15.7–27.3) | 20.0 (14.9–26.2) | 21.7 (16.5–28.4) | <0.001 *** |
| Fiber intake categories 1, n (%) | 0.026 * | |||
| <25 g | 772 (67.8%) | 408 (70.8%) | 364 (64.7%) | |
| ≥25 g | 367 (32.2%) | 168 (29.2%) | 199 (35.3%) | |
| Fiber (kcal) | 41.4 (31.3–54.6) | 40.0 (29.8–52.4) | 43.4 (32.9–56.8) | <0.001 *** |
| Fiber (%TE) | 0.02 (0.01–0.02) | 0.02 (0.02–0.02) | 0.02 (0.01–0.02) | <0.001 *** |
| Total (n = 1139) | Women (n = 576) | Men (n = 563) | ||
|---|---|---|---|---|
| n (%) | n (%) | n (%) | p | |
| Total Energy Intake 1,2 | <0.001 * | |||
| <1600 kcal/day (women), <2000 kcal/day (men) | 200 (17.6%) | 114 (19.8%) | 86 (15.3%) | |
| 1600–2400 kcal/day (women), 2000–3000 kcal/day (men) | 547 (48.0%) | 305 (53.0%) | 242 (43.0%) | |
| ≥2400 kcal/day (women), ≥3000 kcal/day (men) | 392 (34.4%) | 157 (27.3%) | 235 (41.7%) | |
| Percentage of energy intake coming from carbohydrates 1 | <0.001 * | |||
| <45% | 979 (86.0%) | 473 (82.1%) | 506 (89.9%) | |
| 45–60% | 157 (13.8%) | 102 (17.7%) | 55 (9.8%) | |
| >60% | 3 (0.3%) | 1 (0.2%) | 2 (0.4%) | |
| Percentage of energy intake coming from carbohydrates 2 | <0.001 * | |||
| <45% | 979 (86.0%) | 473 (82.1%) | 506 (89.9%) | |
| 45–65% | 160 (14.0%) | 103 (17.9%) | 57 (10.1%) | |
| >65% | 0 (0.0%) | 0 (0.0%) | 0 (0.0%) | |
| Percentage of energy intake coming from proteins 1,2 | 0.001 * | |||
| <10% | 27 (2.4%) | 23 (4.0%) | 4 (0.7%) | |
| 10–35% | 1110 (97.5%) | 552 (95.8%) | 558 (99.1%) | |
| >35% | 2 (0.2%) | 1 (0.2%) | 1 (0.2%) | |
| Percentage of energy intake coming from fats 1,2 | 0.073 | |||
| <20% | 3 (0.3%) | 0 (0.0%) | 3 (0.5%) | |
| 20–35% | 108 (9.5%) | 62 (10.8%) | 46 (8.2%) | |
| >35% | 1028 (90.3%) | 514 (89.2%) | 514 (91.3%) | |
| Food Groups | Total | Women | Men | p |
|---|---|---|---|---|
| Median (IQR) | Median (IQR) | Median (IQR) | ||
| Milk/milk products (g) | 207.5 (109.7–321.8) | 186.8 (99.9–295.3) | 229.5 (126.0–342.6) | <0.001 * |
| Eggs/egg products (g) | 30.0 (7.4–70.2) | 25.5 (6.7–62.8) | 37.5 (8.4–85.2) | <0.001 * |
| Meat/meat products (g) | 162.8 (97.8–251.5) | 124.9 (73.1–183.5) | 214.5 (140.4–317.0) | <0.001 * |
| Fish/seafood products (g) | 0.0 (0.0–0.0) | 0.0 (0.0–0.0) | 0.0 (0.0–0.0) | 0.098 |
| Fat/oil (g) | 43.9 (30.2–62.1) | 39.5 (26.4–54.3) | 49.0 (33.5–68.2) | <0.001 * |
| Grains/grain products (g) | 199.0 (136.6–272.3) | 167.2 (115.4–226.1) | 238.8 (172.4–314.4) | <0.001 * |
| Nuts/seeds/kernels (g) | 13.1 (4.8–25.0) | 14.1 (5.2–26.5) | 12.7 (4.1–23.4) | 0.109 |
| Vegetables/vegetable products (g) | 273.6 (194.2–379.2) | 259.2 (180.4–373.3) | 286.3 (206.9–393.1) | <0.001 * |
| Fruits/fruit products (g) | 124.0 (0.0–255.0) | 155.5 (41.7–274.5) | 96.5 (0.0–234.9) | <0.001 * |
| Sugar/sweets (g) | 27.7 (5.5–57.7) | 28.7 (6.7–58.3) | 26.1 (4.3–57.7) | 0.402 |
| Beverages/alcohol (g) | 1599.2 (1226.9–2087.8) | 1488.9 (1142.4–1946.7) | 1725.0 (1299.2–2200.6) | <0.001 * |
| Miscellaneous food products (g) | 6.5 (4.2–9.7) | 5.7 (3.8–9.0) | 7.3 (5.0–10.7) | <0.001 * |
| Dietary supplements (g) | 0.0 (0.0–0.0) | 0.0 (0.0–0.0) | 0.0 (0.0–0.0) | 0.126 |
| Food Groups (%TE) | Total | Women | Men | p |
|---|---|---|---|---|
| Median (IQR) | Median (IQR) | Median (IQR) | ||
| Milk/milk products | 10.0 (5.8–14.1) | 9.7 (5.7–14.2) | 10.2 (6.0–13.9) | 0.739 |
| Eggs/egg products | 1.8 (0.5–4.8) | 1.6 (0.5–4.7) | 2.00 (0.5–4.8) | 0.384 |
| Meat/meat products | 14.5 (9.2–21.2) | 12.6 (7.5–18.7) | 17.0 (11.4–23.8) | <0.001 *** |
| Fish/seafood products | 0.00 (0.00–0.00) | 0.00 (0.00–0.00) | 0.00 (0.00–0.00) | 0.049 * |
| Fat/oil | 16.4 (11.9–21.0) | 17.1 (12.1–21.9) | 15.7 (11.8–20.6) | 0.014 * |
| Grains/grain products | 23.9 (18.6–30.5) | 23.2 (17.7–30.9) | 24.6 (19.3–30.2) | 0.071 |
| Nuts/seeds/kernels | 2.2 (0.7–4.9) | 2.8 (1.1–6.1) | 1.6 (0.5–3.8) | <0.001 *** |
| Vegetables/vegetable products | 6.2 (4.0–9.3) | 6.6 (4.1–9.8) | 5.9 (3.8–8.7) | 0.002 ** |
| Fruits/fruit products | 3.3 (0.0–7.1) | 4.6 (1.1–8.5) | 1.9 (0.0–5.5) | <0.001 *** |
| Sugar/sweets | 4.6 (1.0–10.2) | 5.6 (1.4–11.8) | 4.0 (0.6–8.5) | <0.001 *** |
| Beverages/alcohol | 2.7 (0.2–6.8) | 1.8 (0.1–5.2) | 3.9 (0.5–8.3) | <0.001 *** |
| Miscellaneous food products | 0.28 (0.16–0.43) | 0.30 (0.16–0.45) | 0.26 (0.15–0.41) | 0.025 * |
| Dietary supplements | 0.00 (0.00–0.00) | 0.00 (0.00–0.00) | 0.00 (0.00–0.00) | 0.206 |
Disclaimer/Publisher’s Note: The statements, opinions and data contained in all publications are solely those of the individual author(s) and contributor(s) and not of MDPI and/or the editor(s). MDPI and/or the editor(s) disclaim responsibility for any injury to people or property resulting from any ideas, methods, instructions or products referred to in the content. |
© 2025 by the authors. Licensee MDPI, Basel, Switzerland. This article is an open access article distributed under the terms and conditions of the Creative Commons Attribution (CC BY) license (https://creativecommons.org/licenses/by/4.0/).
Share and Cite
Milešević, J.; Zeković, M.; Šarac, I.; Knez, M.; Krga, I.; Takić, M.; Martačić, J.D.; Stevanović, V.; Vidović, N.; Ranković, S.; et al. Energy and Macronutrient Dietary Intakes of Serbian Adults 18–64 Years Old: EFSA EU Menu Food Consumption Survey in Serbia (2017–2022). Foods 2025, 14, 1228. https://doi.org/10.3390/foods14071228
Milešević J, Zeković M, Šarac I, Knez M, Krga I, Takić M, Martačić JD, Stevanović V, Vidović N, Ranković S, et al. Energy and Macronutrient Dietary Intakes of Serbian Adults 18–64 Years Old: EFSA EU Menu Food Consumption Survey in Serbia (2017–2022). Foods. 2025; 14(7):1228. https://doi.org/10.3390/foods14071228
Chicago/Turabian StyleMilešević, Jelena, Milica Zeković, Ivana Šarac, Marija Knez, Irena Krga, Marija Takić, Jasmina Debeljak Martačić, Vuk Stevanović, Nevena Vidović, Slavica Ranković, and et al. 2025. "Energy and Macronutrient Dietary Intakes of Serbian Adults 18–64 Years Old: EFSA EU Menu Food Consumption Survey in Serbia (2017–2022)" Foods 14, no. 7: 1228. https://doi.org/10.3390/foods14071228
APA StyleMilešević, J., Zeković, M., Šarac, I., Knez, M., Krga, I., Takić, M., Martačić, J. D., Stevanović, V., Vidović, N., Ranković, S., Kadvan, A., & Gurinović, M. (2025). Energy and Macronutrient Dietary Intakes of Serbian Adults 18–64 Years Old: EFSA EU Menu Food Consumption Survey in Serbia (2017–2022). Foods, 14(7), 1228. https://doi.org/10.3390/foods14071228